Embed Size (px)
Citation preview
Materials research at the University of
Botswana: Phases in Ni based ternary alloys#.
Pushpendra K Jain†
Professor of Physics, and
Coordinator: AMSEN* - UB Node
University of BotswanaUniversity of Botswana
Gaborone, Botswana
Ph: +267 7151 9489
email: [email protected]
(#) Seminar @ UCONN, Physics, Storrs, CT, USA, 29 May 2012.
(*) African Materials Science and Engineering Network,
A Carnegie – IAS RISE Network.
(†) UCONN AlumniClass of 1975: PhD Physics
1. Introduction: Botswana
2. University of Botswana
3. FoS Shared Research
Facilities
4. Materials Research
Funding: AMSEN
5. Phases in Ni - super alloys.
6. The Ni – Ru – Zr system
7. Sample preparation
8. SEM, EDX and XRD analysis
9. Solidus & Liquidus
projections.
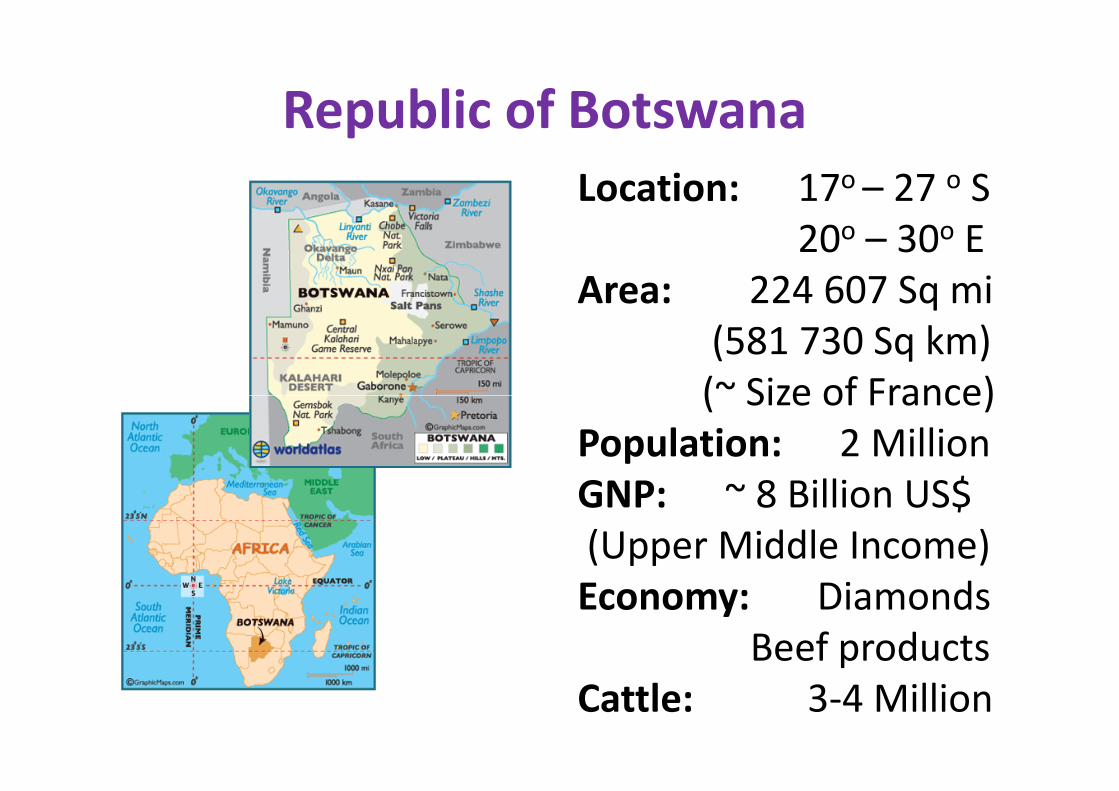
Republic of Botswana
Location: 17o – 27 o S20o – 30o E
Area: 224 607 Sq mi(581 730 Sq km)
(~ Size of France)(~ Size of France)Population: 2 MillionGNP: ~ 8 Billion US$(Upper Middle Income)Economy: Diamonds
Beef productsCattle: 3-4 Million
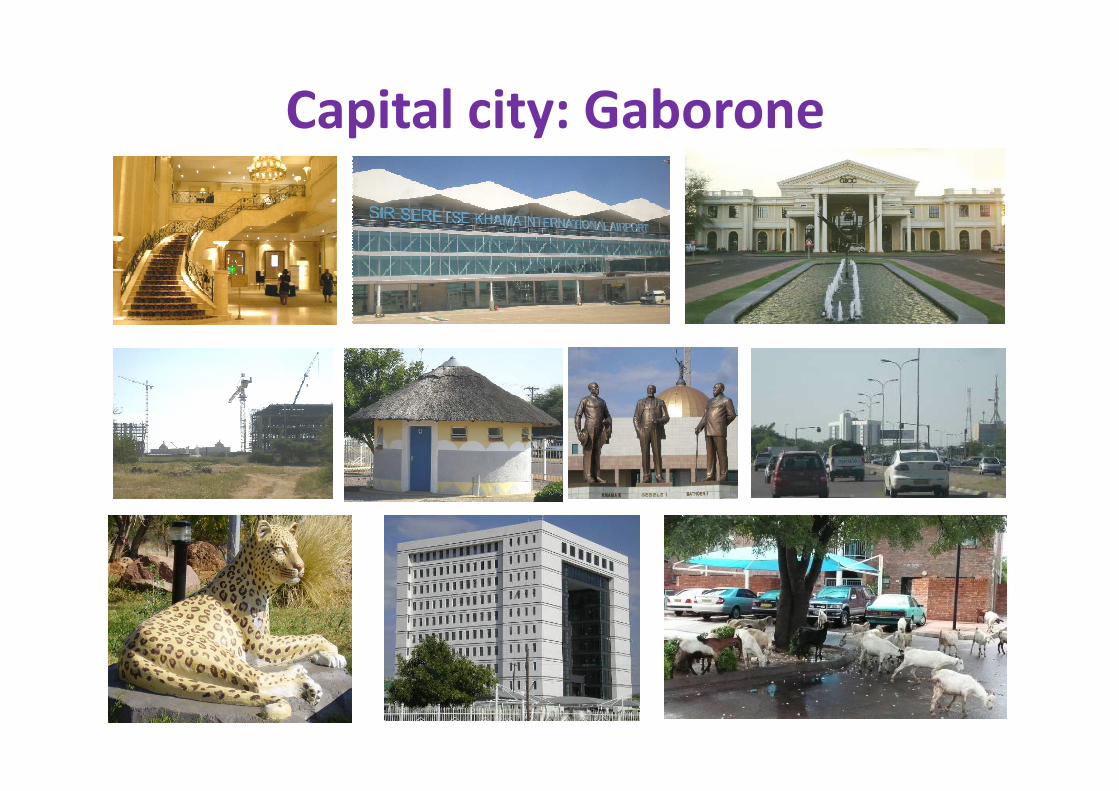
Capital city: Gaborone
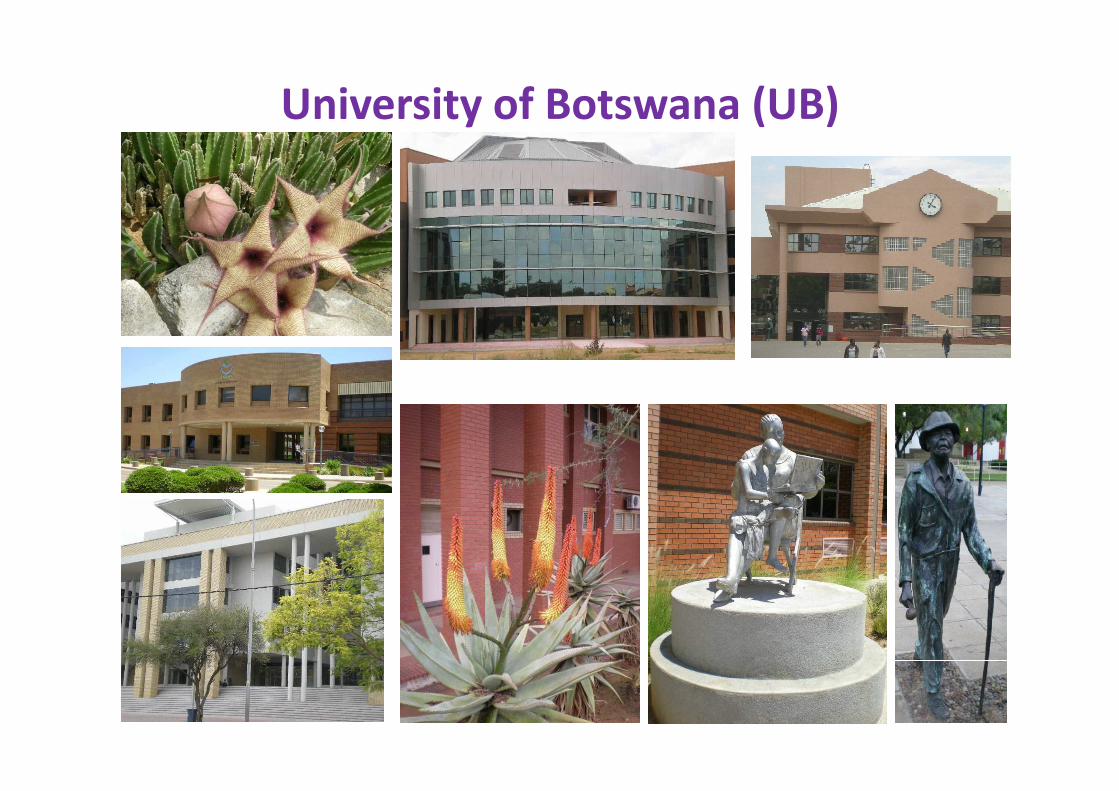
University of Botswana (UB)
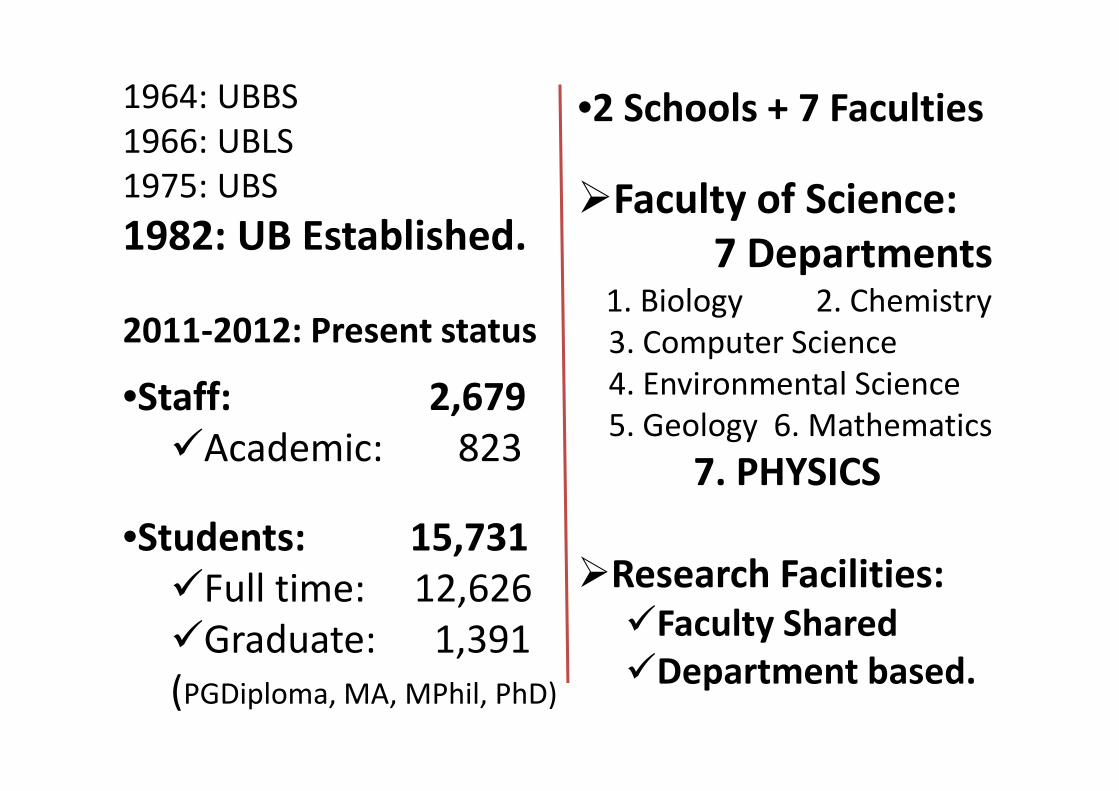
•2 Schools + 7 Faculties
�Faculty of Science:
7 Departments1. Biology 2. Chemistry3. Computer Science4. Environmental Science
1964: UBBS 1966: UBLS1975: UBS
1982: UB Established.
2011-2012: Present status
•Staff: 2,679 4. Environmental Science5. Geology 6. Mathematics
7. PHYSICS
�Research Facilities:
�Faculty Shared
�Department based.
•Staff: 2,679
�Academic: 823
•Students: 15,731
�Full time: 12,626�Graduate: 1,391(PGDiploma, MA, MPhil, PhD)
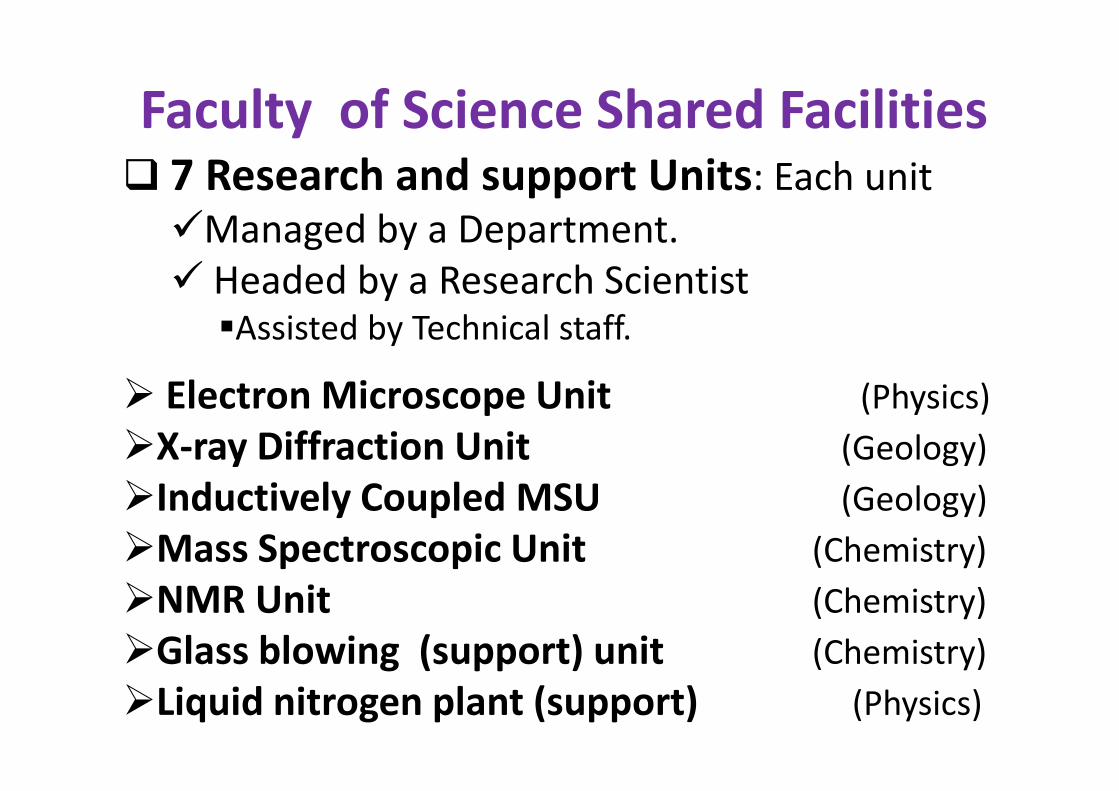
Faculty of Science Shared Facilities� 7 Research and support Units: Each unit
�Managed by a Department.� Headed by a Research Scientist
�Assisted by Technical staff.
� Electron Microscope Unit (Physics)� Electron Microscope Unit (Physics)
�X-ray Diffraction Unit (Geology)
�Inductively Coupled MSU (Geology)
�Mass Spectroscopic Unit (Chemistry)
�NMR Unit (Chemistry)
�Glass blowing (support) unit (Chemistry)
�Liquid nitrogen plant (support) (Physics)
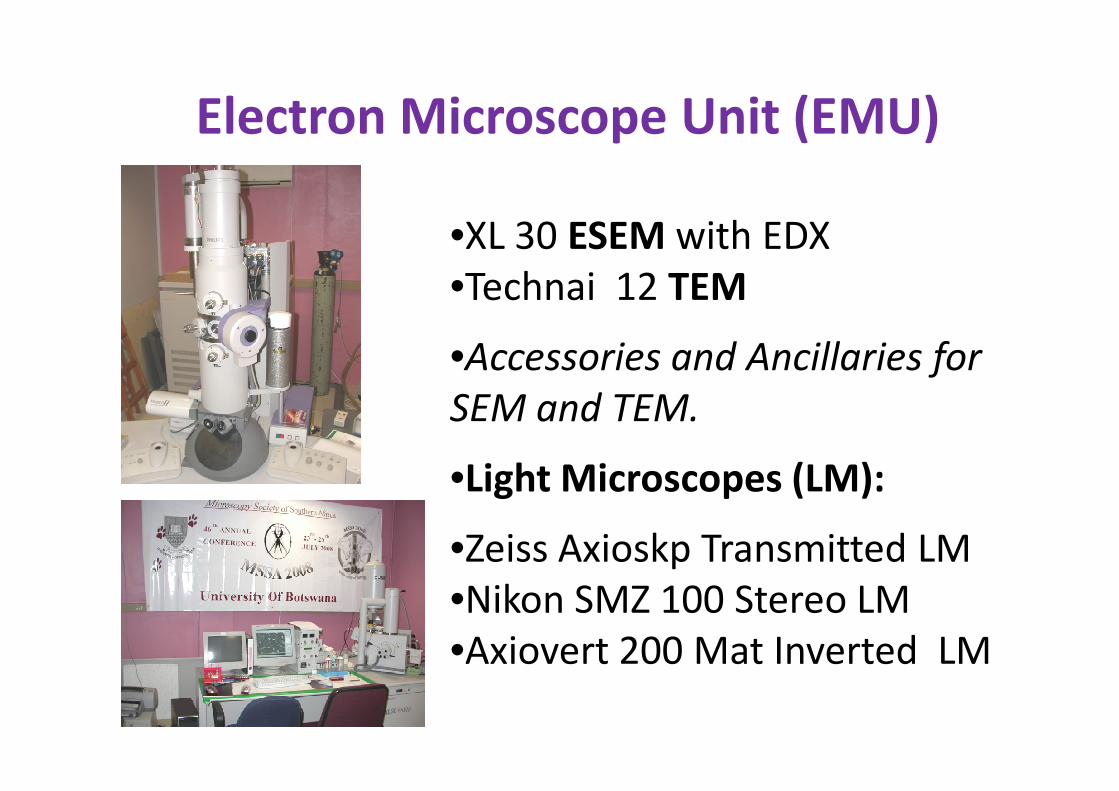
Electron Microscope Unit (EMU)
•XL 30 ESEM with EDX•Technai 12 TEM
•Accessories and Ancillaries for
SEM and TEM.SEM and TEM.
•Light Microscopes (LM):
•Zeiss Axioskp Transmitted LM•Nikon SMZ 100 Stereo LM•Axiovert 200 Mat Inverted LM
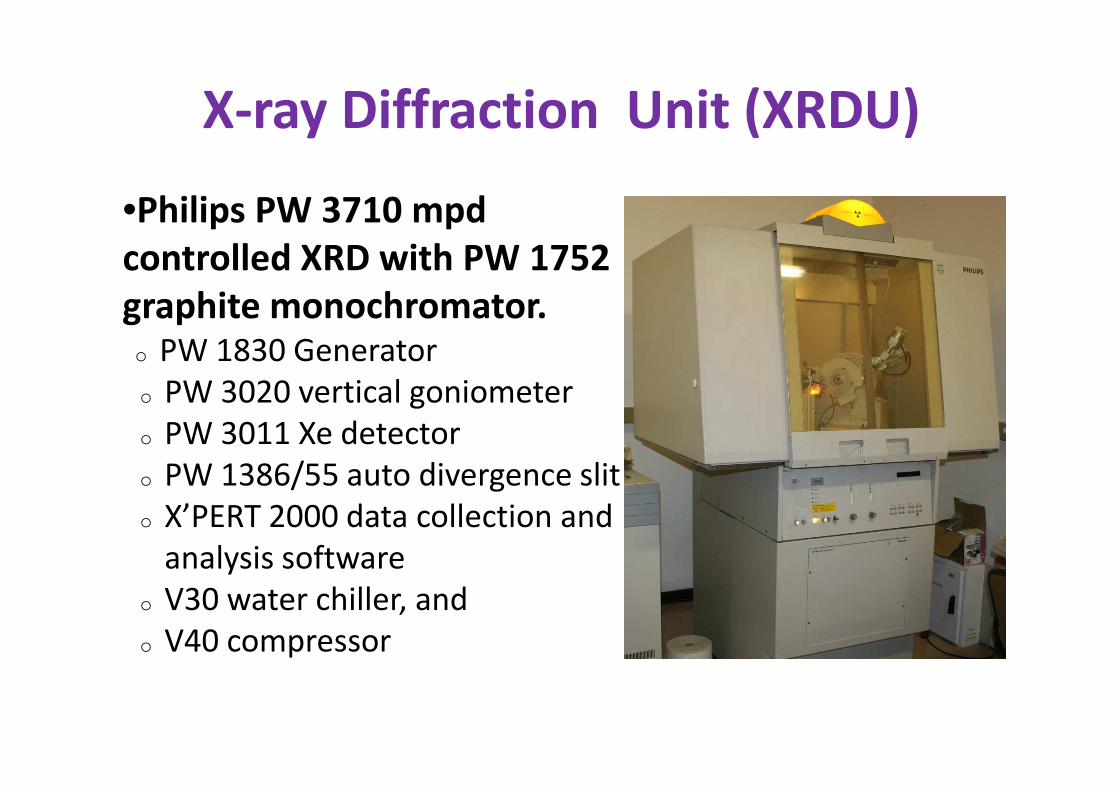
X-ray Diffraction Unit (XRDU)
•Philips PW 3710 mpd
controlled XRD with PW 1752
graphite monochromator.o PW 1830 Generatoro PW 3020 vertical goniometero PW 3020 vertical goniometero PW 3011 Xe detectoro PW 1386/55 auto divergence slito X’PERT 2000 data collection and
analysis softwareo V30 water chiller, ando V40 compressor
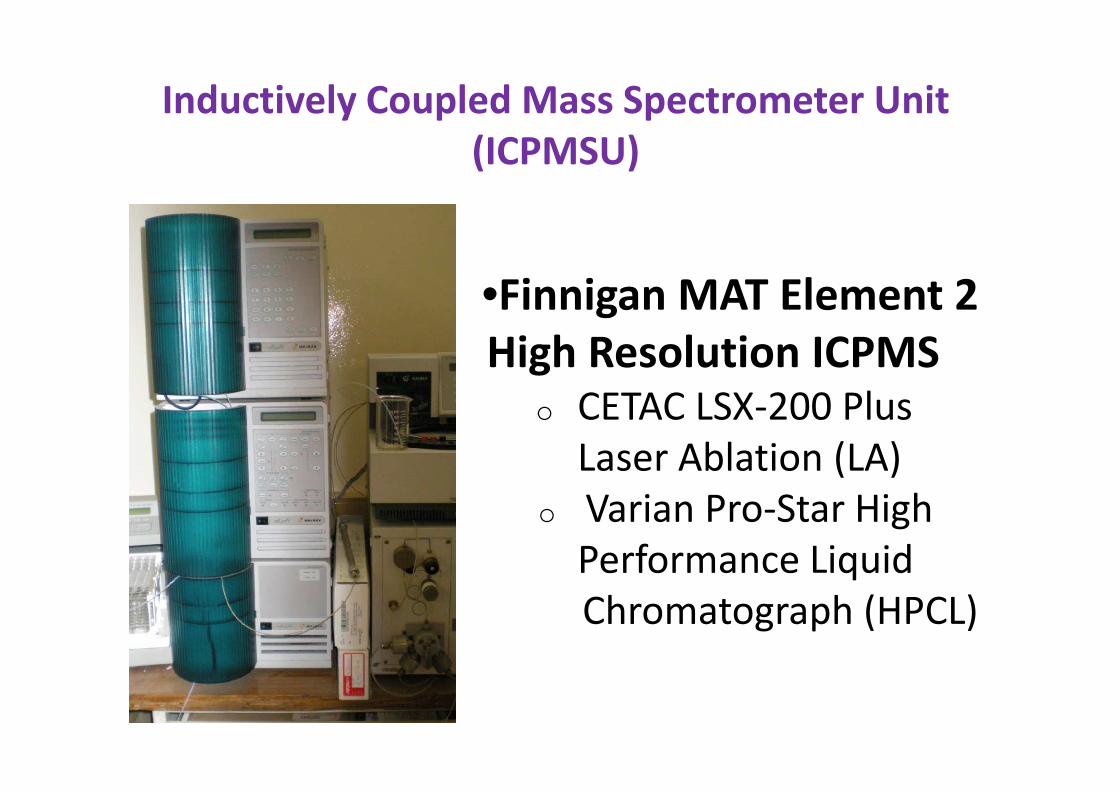
Inductively Coupled Mass Spectrometer Unit
(ICPMSU)
•Finnigan MAT Element 2
High Resolution ICPMS
CETAC LSX-200 Plus o CETAC LSX-200 Plus Laser Ablation (LA)
o Varian Pro-Star HighPerformance LiquidChromatograph (HPCL)
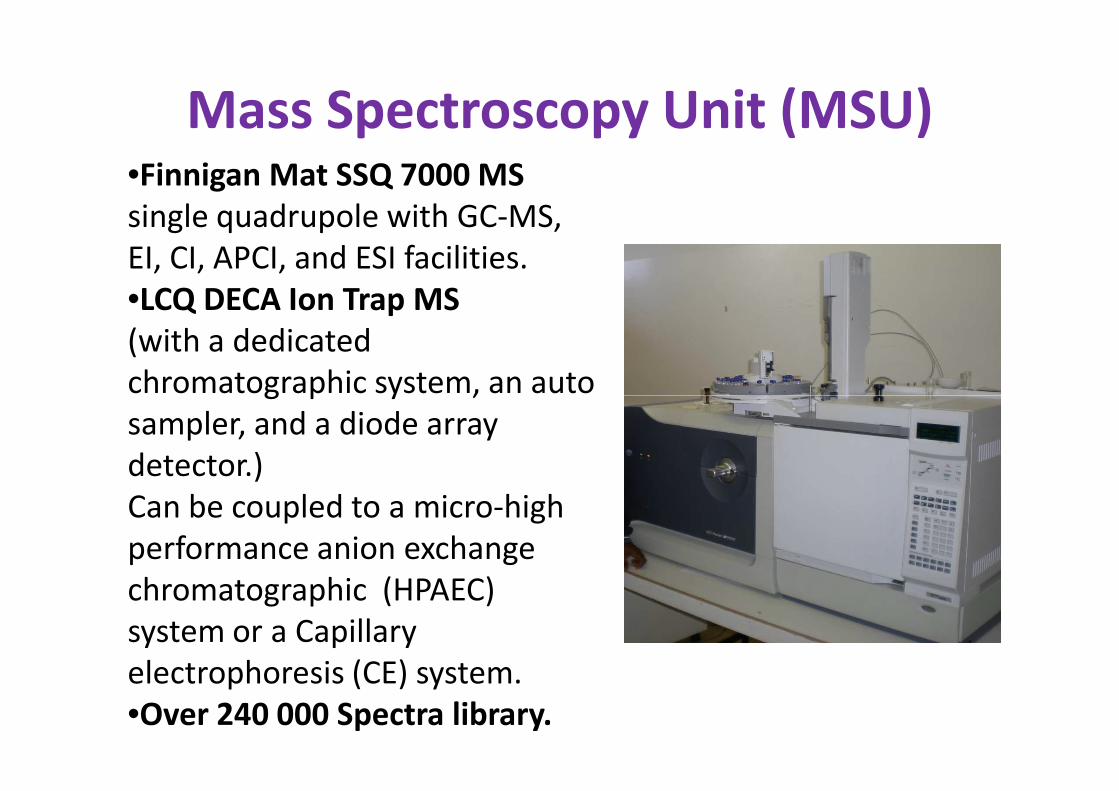
Mass Spectroscopy Unit (MSU)•Finnigan Mat SSQ 7000 MS
single quadrupole with GC-MS, EI, CI, APCI, and ESI facilities.•LCQ DECA Ion Trap MS
(with a dedicated chromatographic system, an auto chromatographic system, an auto sampler, and a diode array detector.)Can be coupled to a micro-high performance anion exchange chromatographic (HPAEC) system or a Capillary electrophoresis (CE) system.•Over 240 000 Spectra library.
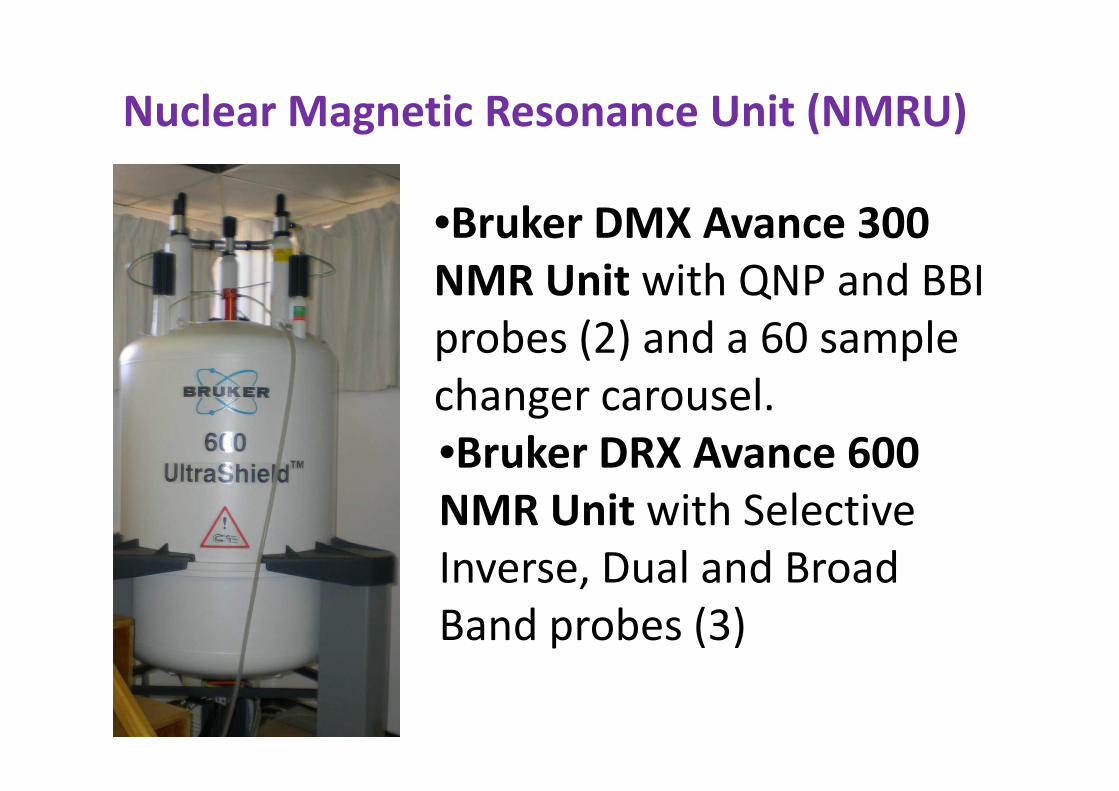
Nuclear Magnetic Resonance Unit (NMRU)
•Bruker DMX Avance 300
NMR Unit with QNP and BBI probes (2) and a 60 sample changer carousel.changer carousel.•Bruker DRX Avance 600
NMR Unit with Selective Inverse, Dual and Broad Band probes (3)
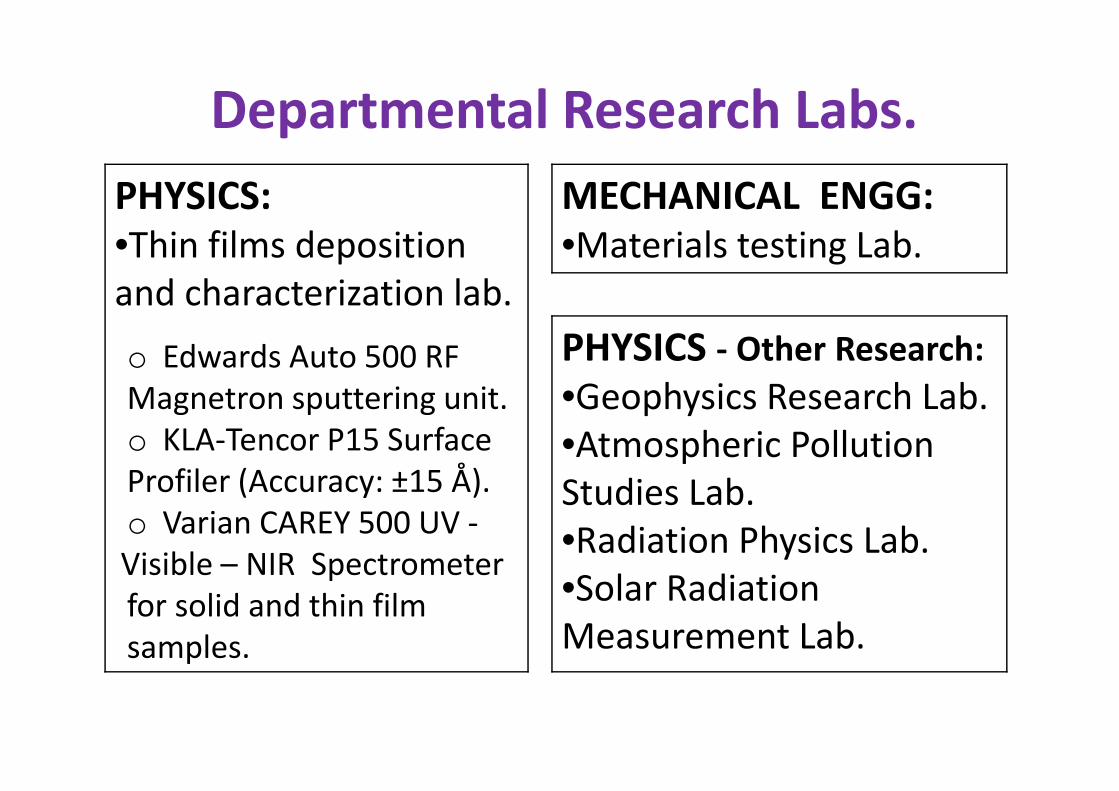
Departmental Research Labs.
PHYSICS:
•Thin films deposition and characterization lab.
o Edwards Auto 500 RF Magnetron sputtering unit.
MECHANICAL ENGG:
•Materials testing Lab.
PHYSICS - Other Research:
•Geophysics Research Lab.Magnetron sputtering unit.o KLA-Tencor P15 Surface Profiler (Accuracy: ±15 Å).o Varian CAREY 500 UV -Visible – NIR Spectrometer for solid and thin film samples.
•Geophysics Research Lab.•Atmospheric Pollution Studies Lab.•Radiation Physics Lab.•Solar Radiation Measurement Lab.
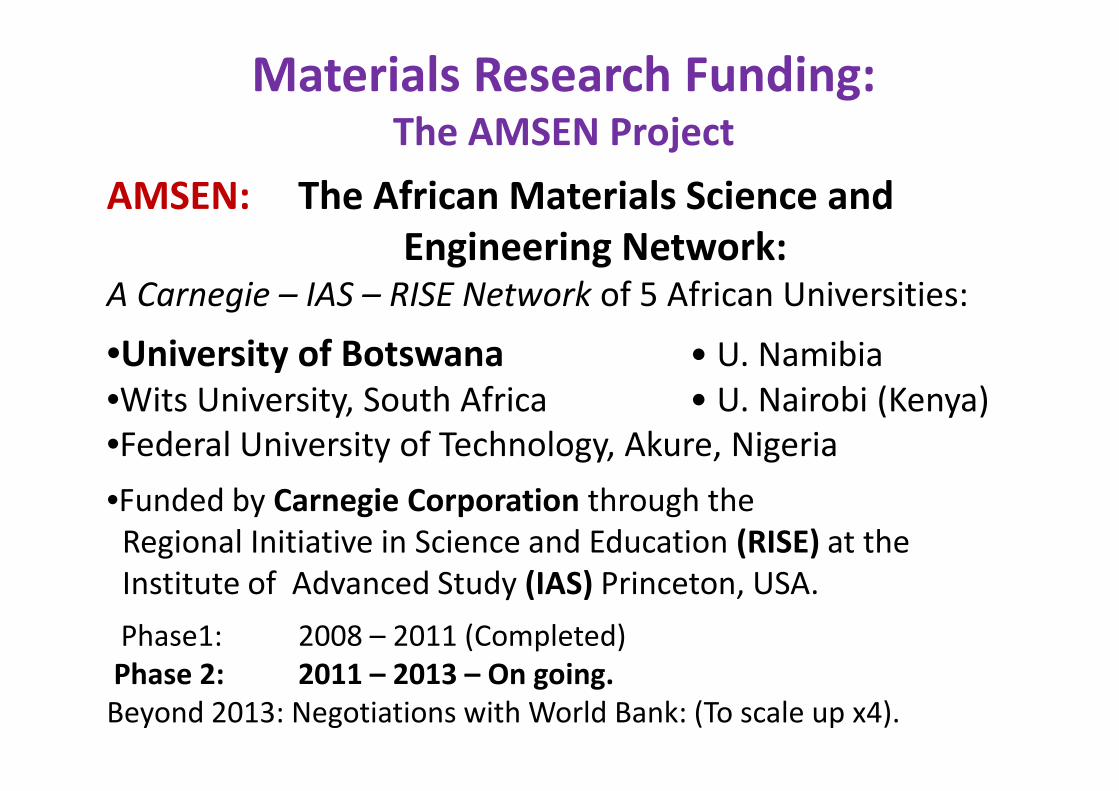
Materials Research Funding:The AMSEN Project
AMSEN: The African Materials Science and
Engineering Network:A Carnegie – IAS – RISE Network of 5 African Universities:
•University of Botswana • U. Namibia•Wits University, South Africa • U. Nairobi (Kenya)•Wits University, South Africa • U. Nairobi (Kenya)•Federal University of Technology, Akure, Nigeria
•Funded by Carnegie Corporation through theRegional Initiative in Science and Education (RISE) at the Institute of Advanced Study (IAS) Princeton, USA.
Phase1: 2008 – 2011 (Completed)Phase 2: 2011 – 2013 – On going.
Beyond 2013: Negotiations with World Bank: (To scale up x4).
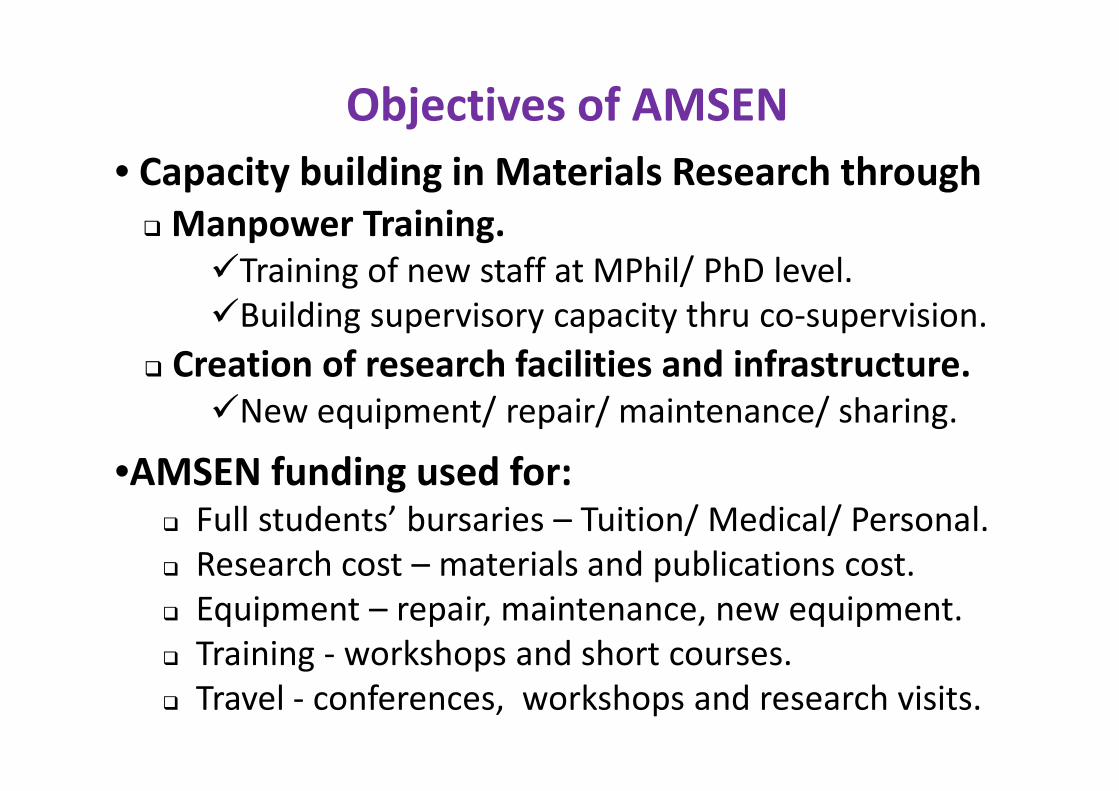
Objectives of AMSEN
• Capacity building in Materials Research through
� Manpower Training.
�Training of new staff at MPhil/ PhD level.�Building supervisory capacity thru co-supervision.
� Creation of research facilities and infrastructure.
�New equipment/ repair/ maintenance/ sharing.�New equipment/ repair/ maintenance/ sharing.
•AMSEN funding used for:� Full students’ bursaries – Tuition/ Medical/ Personal.� Research cost – materials and publications cost.� Equipment – repair, maintenance, new equipment.� Training - workshops and short courses.� Travel - conferences, workshops and research visits.
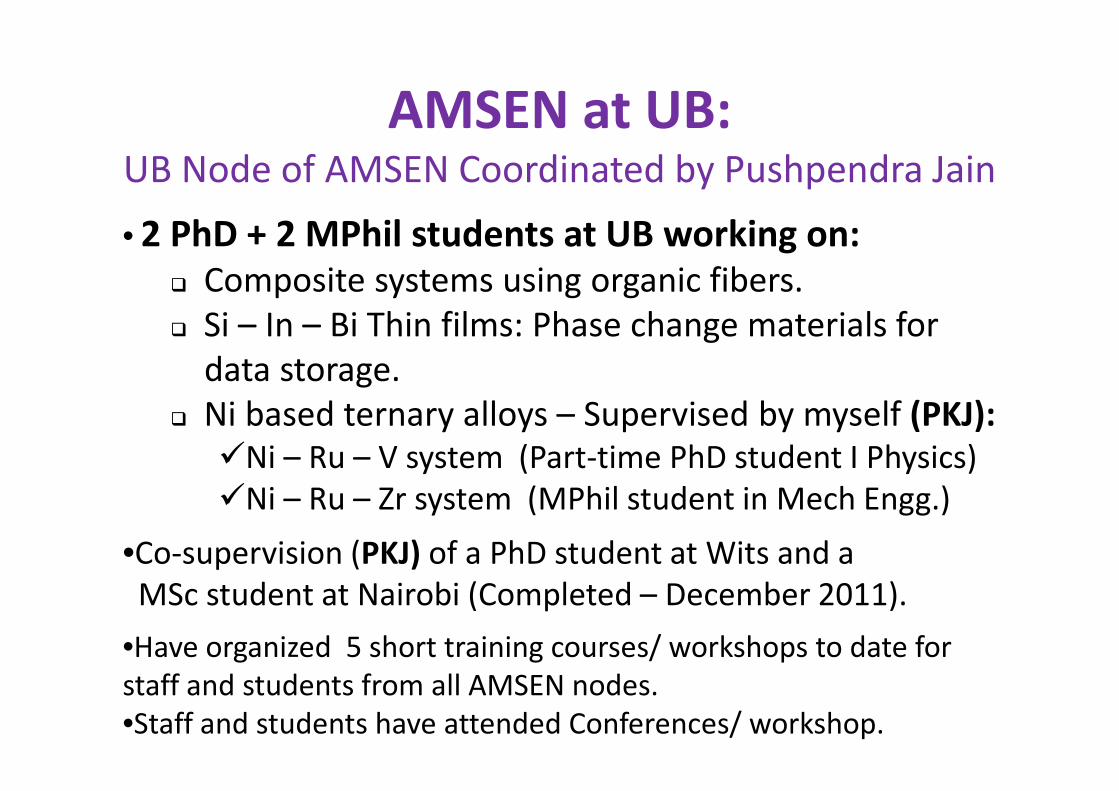
AMSEN at UB:UB Node of AMSEN Coordinated by Pushpendra Jain
• 2 PhD + 2 MPhil students at UB working on:
� Composite systems using organic fibers.� Si – In – Bi Thin films: Phase change materials for
data storage.Ni based ternary alloys – Supervised by myself (PKJ):� Ni based ternary alloys – Supervised by myself (PKJ):
�Ni – Ru – V system (Part-time PhD student I Physics)�Ni – Ru – Zr system (MPhil student in Mech Engg.)
•Co-supervision (PKJ) of a PhD student at Wits and a MSc student at Nairobi (Completed – December 2011).
•Have organized 5 short training courses/ workshops to date for staff and students from all AMSEN nodes.•Staff and students have attended Conferences/ workshop.
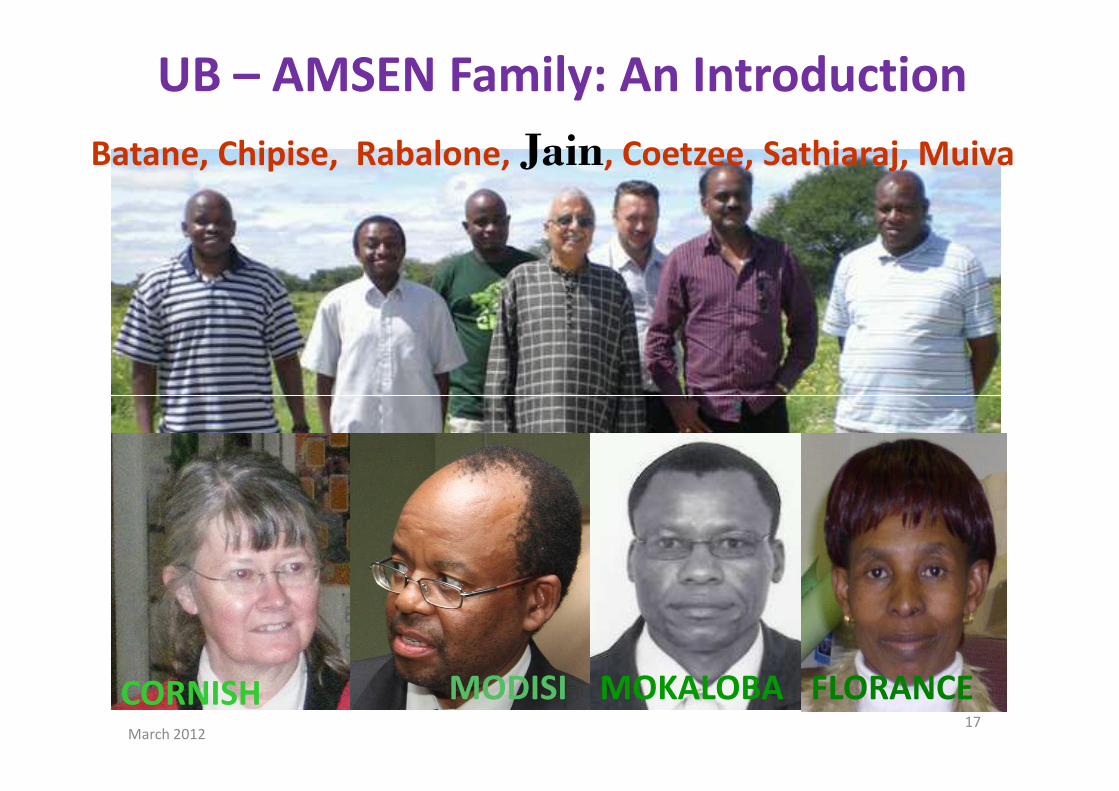
UB – AMSEN Family: An Introduction
Batane, Chipise, Rabalone, Jain, Coetzee, Sathiaraj, Muiva
March 201217
CORNISH MODISI MOKALOBA FLORANCE
Phases in Ternary Alloys: Work at UB
• Ni based Ternary alloys (Super alloys):
�Ni-Ru-Y system: MPhil – Stephen (Completed)�Ni-Ru-Zr system: MPhil – Liberty (Ongoing)�Ni-Ru-V system: PhD – Stephan (Ongoing)(Potential application: Jet engine and Power turbines).(Potential application: Jet engine and Power turbines).
• Ni-V-C being investigated by Apata (PhD) at Wits University (Co-supervised by PKJ): (Potential application in high corrosion petrochemical and related industries.)
•Our focus today is on Ni-based super alloys.
Ni based supper alloysSuper alloys: oHigh Temperature application: ~0.8 x melting temp.oHigh creep and oxidation resistance at high temp.oHigh corrosion resistance at high temp.oCommon super alloys: Iron, Cobalt, Nickel based.
•Ni (melting temp: 1455 oC) super alloys suited for
jet engines and turbines applications.
oTo increase their temperature of operation (say ~1300 oC) to achieve:
�Improved efficiency,�Reduced fuel consumption,�Reduced environmental pollution.
Alloying Additives: Why and Which?
•Alloying additives in steels are used to:�Solid solution strengthening.�Improve corrosion resistance.�Improve hardenability.�Phase stability.�Reduce rate of tempering…..�Reduce rate of tempering…..
•Physical Parameters to Consider:•Atomic size factor: For Ni alloys: V, Cr, Fe. Mn. etc.•Solubility factor: For Ni alloys: Ru, V, Cr, Ti, Al, Au, Cu, W.•Diffusivity: W, Mo, Cr, V, Fe, Co, Au, Cu.•Crystal structure: Ni3X compounds with FCC structure
where X → Al, Ti, V, Mn, Fe, Mo, Co etc.
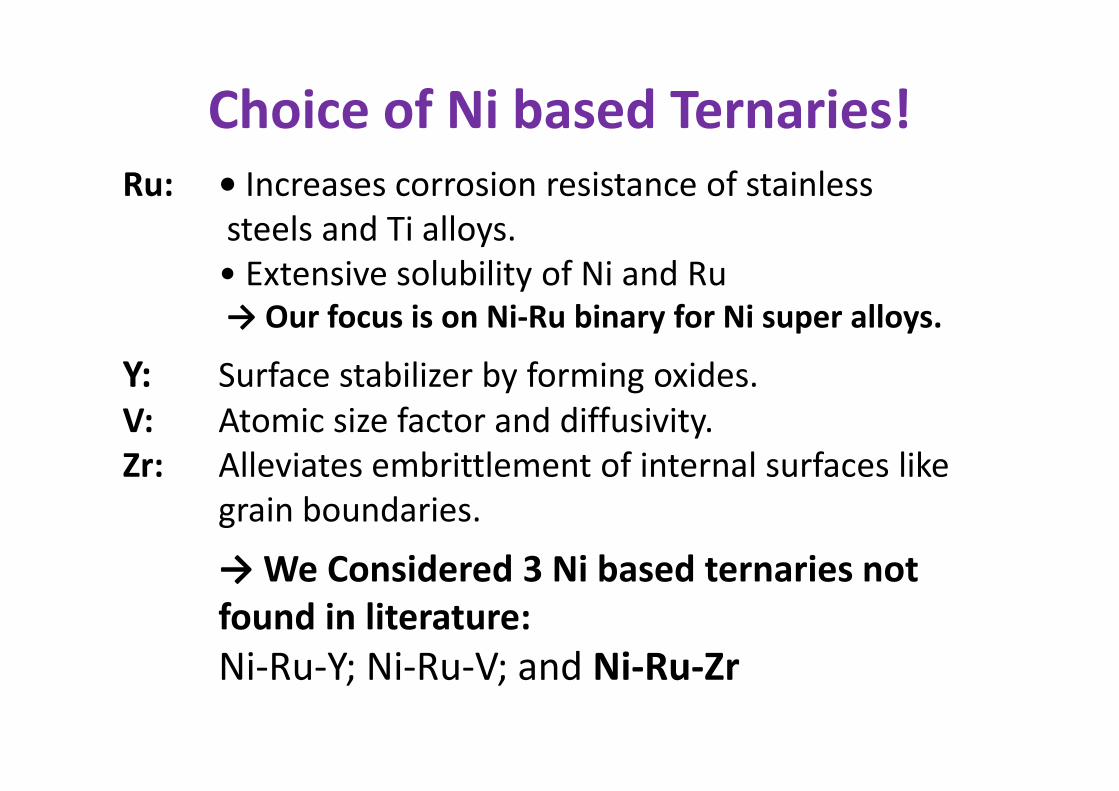
Choice of Ni based Ternaries!
Ru: • Increases corrosion resistance of stainlesssteels and Ti alloys.• Extensive solubility of Ni and Ru→ Our focus is on Ni-Ru binary for Ni super alloys.
Y: Surface stabilizer by forming oxides.V: Atomic size factor and diffusivity.Zr: Alleviates embrittlement of internal surfaces like
grain boundaries.
→ We Considered 3 Ni based ternaries not
found in literature:
Ni-Ru-Y; Ni-Ru-V; and Ni-Ru-Zr
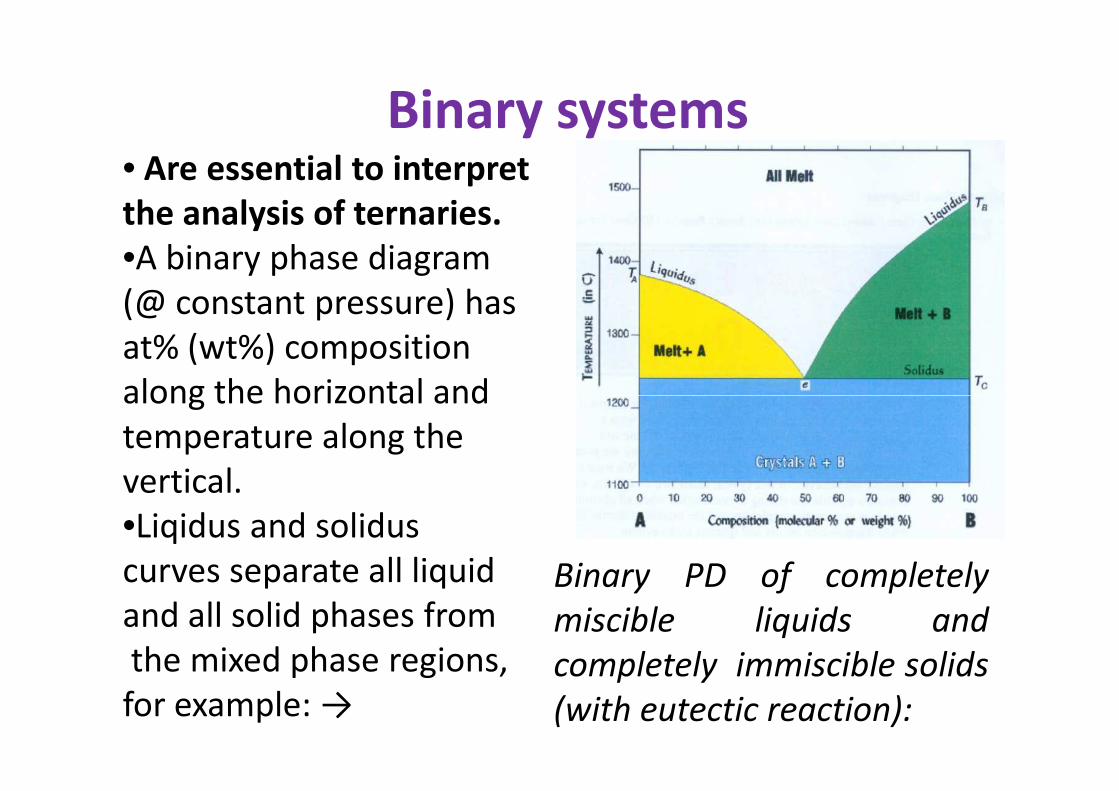
Binary systems• Are essential to interpret
the analysis of ternaries.
•A binary phase diagram (@ constant pressure) has at% (wt%) composition along the horizontal and along the horizontal and temperature along the vertical.•Liqidus and soliduscurves separate all liquidand all solid phases fromthe mixed phase regions, for example: →
Binary PD of completely
miscible liquids and
completely immiscible solids
(with eutectic reaction):
Binaries associated with a ternary•3 Binaries are associated with a ternary system.•From the binary PDs solidification reaction andthe binary phases at different compositions arededuced as a function of temperature.
•All known binary systems are all well•All known binary systems are all wellunderstood and extensively studied.
•These PDs could be quite complex .•For example, binaries associated with theNi – Ru - Zr ternary are Ni - Ru, Ni - Zr, Ru - Zr as shown in the following slides:
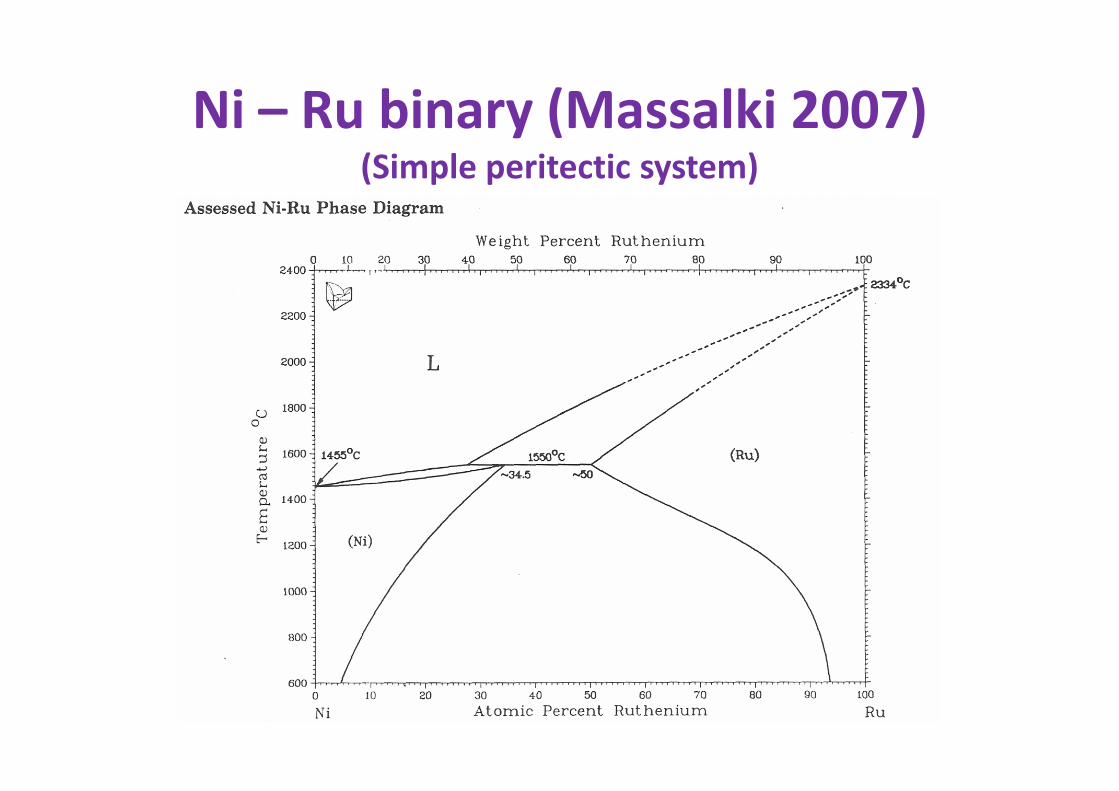
Ni – Ru binary (Massalki 2007)(Simple peritectic system)
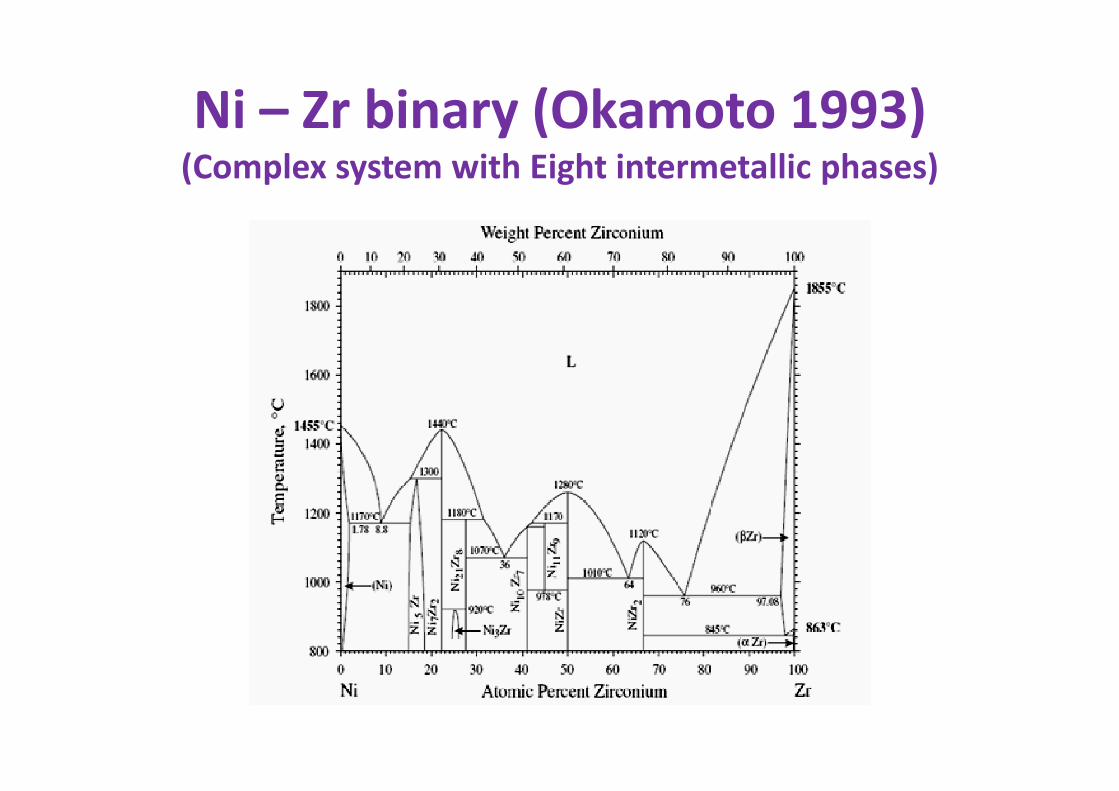
Ni – Zr binary (Okamoto 1993)(Complex system with Eight intermetallic phases)
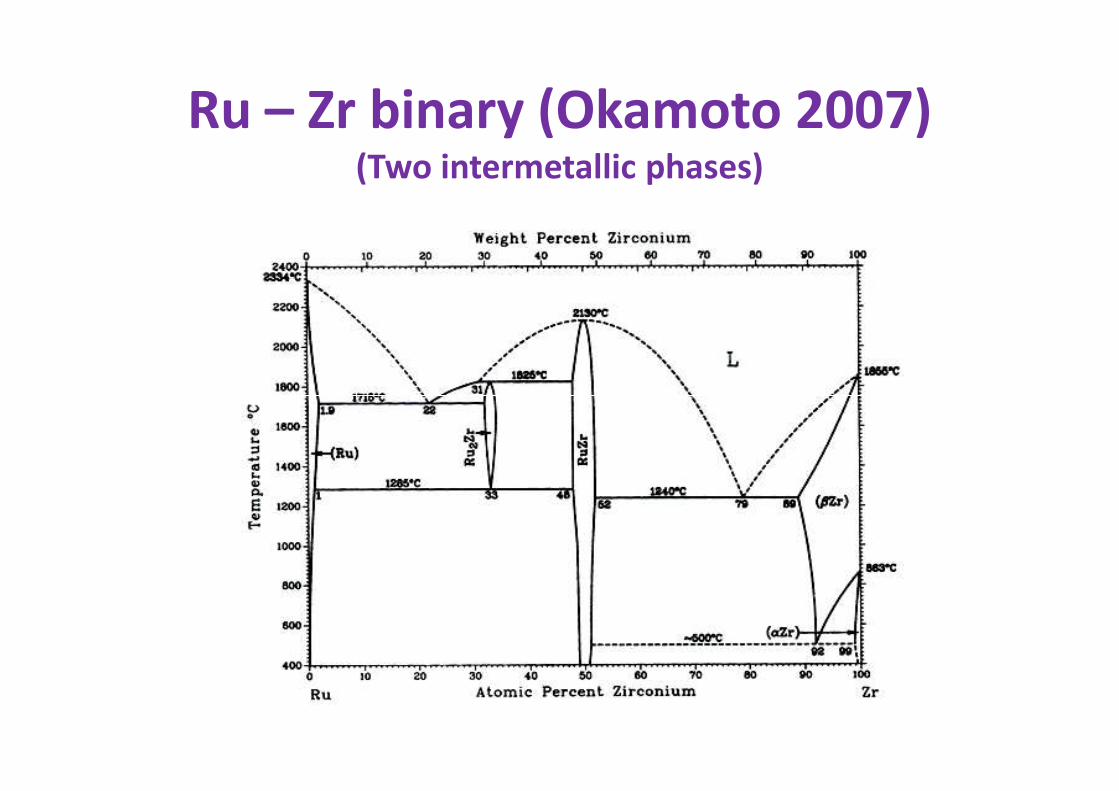
Ru – Zr binary (Okamoto 2007)(Two intermetallic phases)
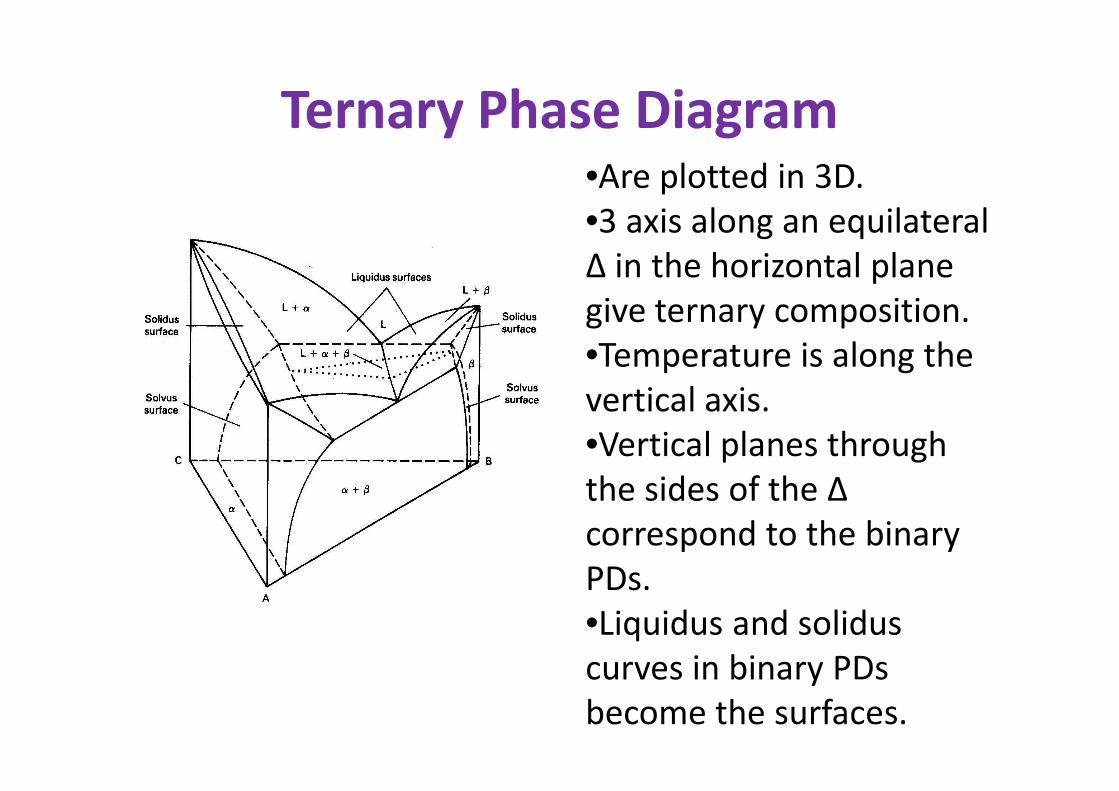
Ternary Phase Diagram•Are plotted in 3D.•3 axis along an equilateral ∆ in the horizontal plane give ternary composition.•Temperature is along the vertical axis.vertical axis.•Vertical planes through the sides of the ∆ correspond to the binary PDs.•Liquidus and solidus curves in binary PDs become the surfaces.
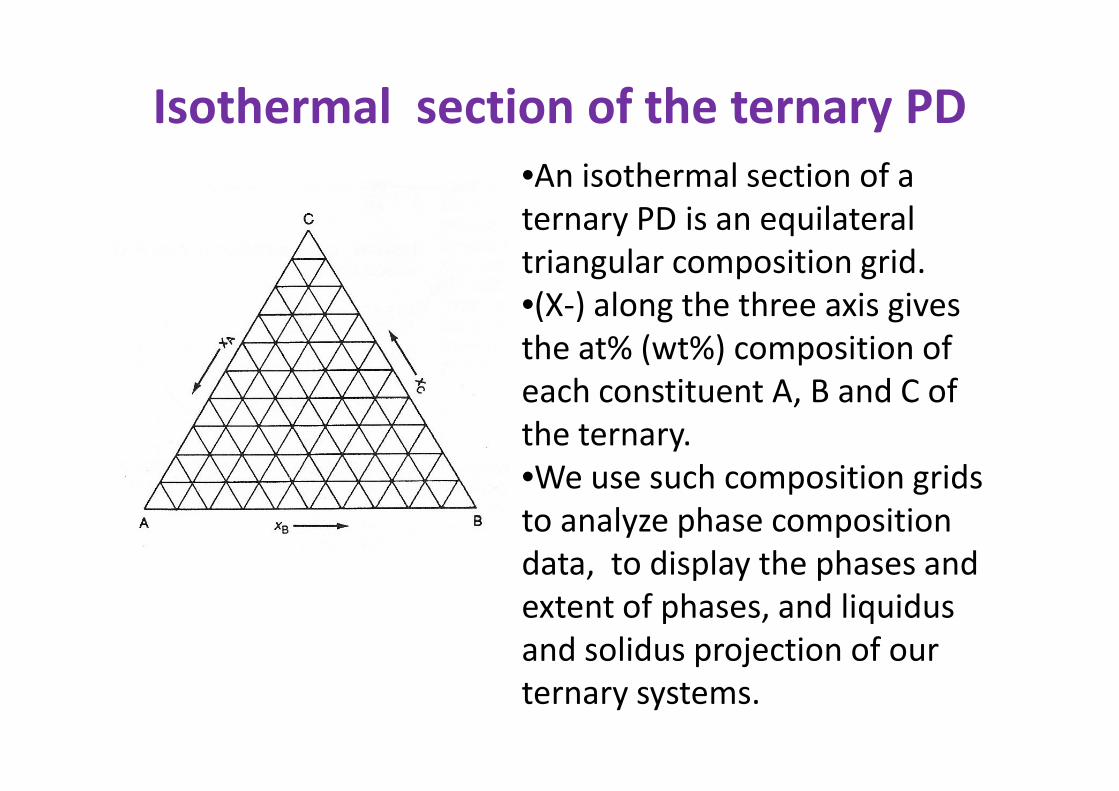
Isothermal section of the ternary PD
•An isothermal section of a ternary PD is an equilateral triangular composition grid.•(X-) along the three axis gives the at% (wt%) composition of each constituent A, B and C of each constituent A, B and C of the ternary.•We use such composition grids to analyze phase composition data, to display the phases and extent of phases, and liquidus and solidus projection of our ternary systems.
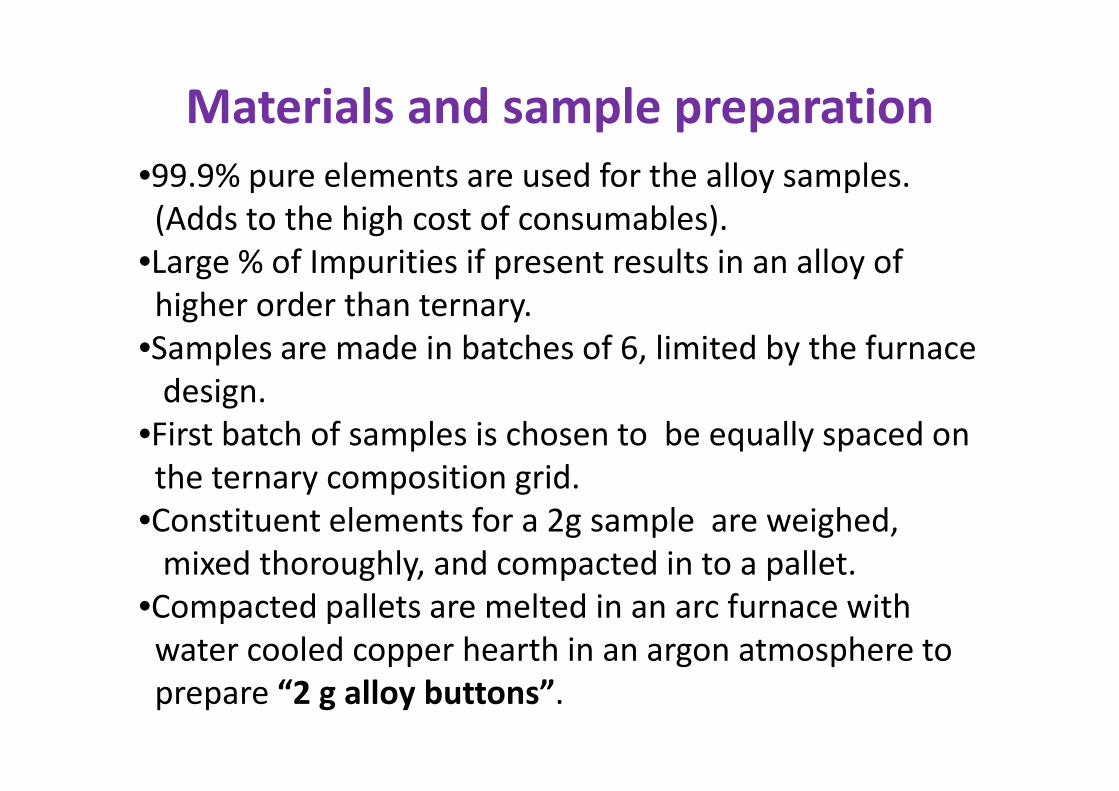
Materials and sample preparation
•99.9% pure elements are used for the alloy samples. (Adds to the high cost of consumables).
•Large % of Impurities if present results in an alloy ofhigher order than ternary.
•Samples are made in batches of 6, limited by the furnacedesign.design.
•First batch of samples is chosen to be equally spaced onthe ternary composition grid.
•Constituent elements for a 2g sample are weighed, mixed thoroughly, and compacted in to a pallet.
•Compacted pallets are melted in an arc furnace withwater cooled copper hearth in an argon atmosphere toprepare “2 g alloy buttons”.
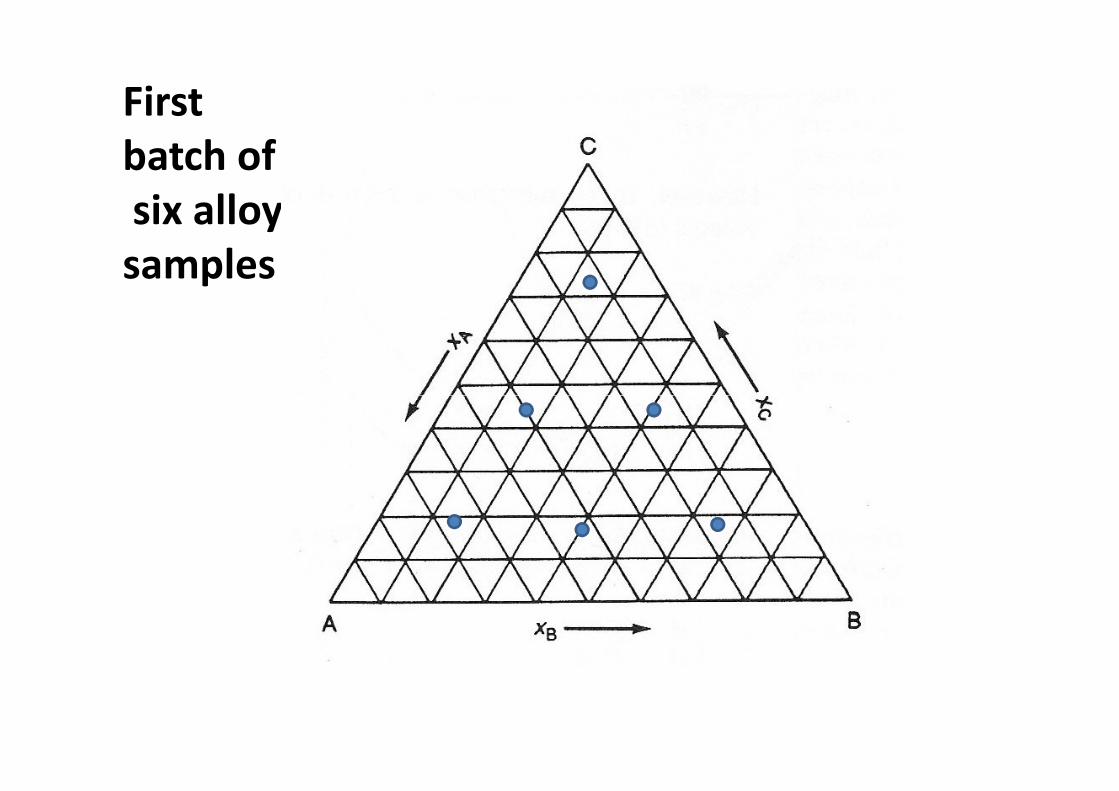
First
batch of
six alloy
samples
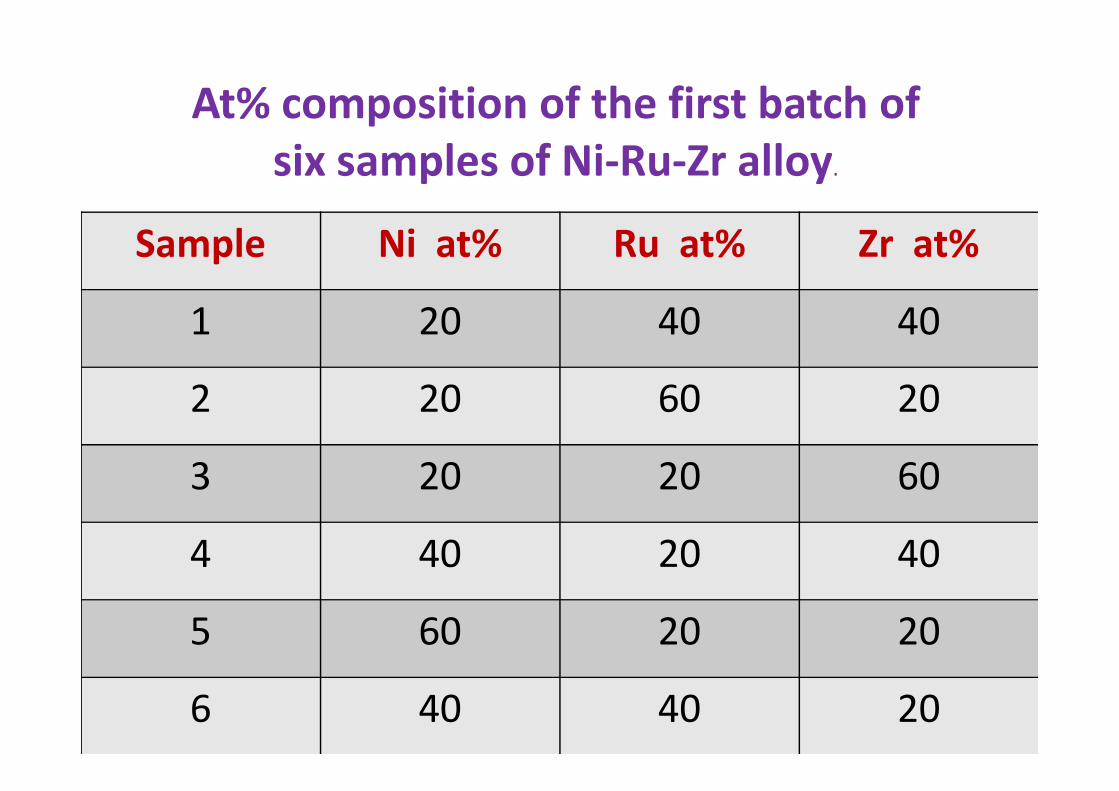
Sample Ni at% Ru at% Zr at%
1 20 40 40
2 20 60 20
At% composition of the first batch of
six samples of Ni-Ru-Zr alloy.
2 20 60 20
3 20 20 60
4 40 20 40
5 60 20 20
6 40 40 20
Sample Element
Atomic
Mass At %
Mass (g)
in
sample
Mass (g)
in 2g
sample
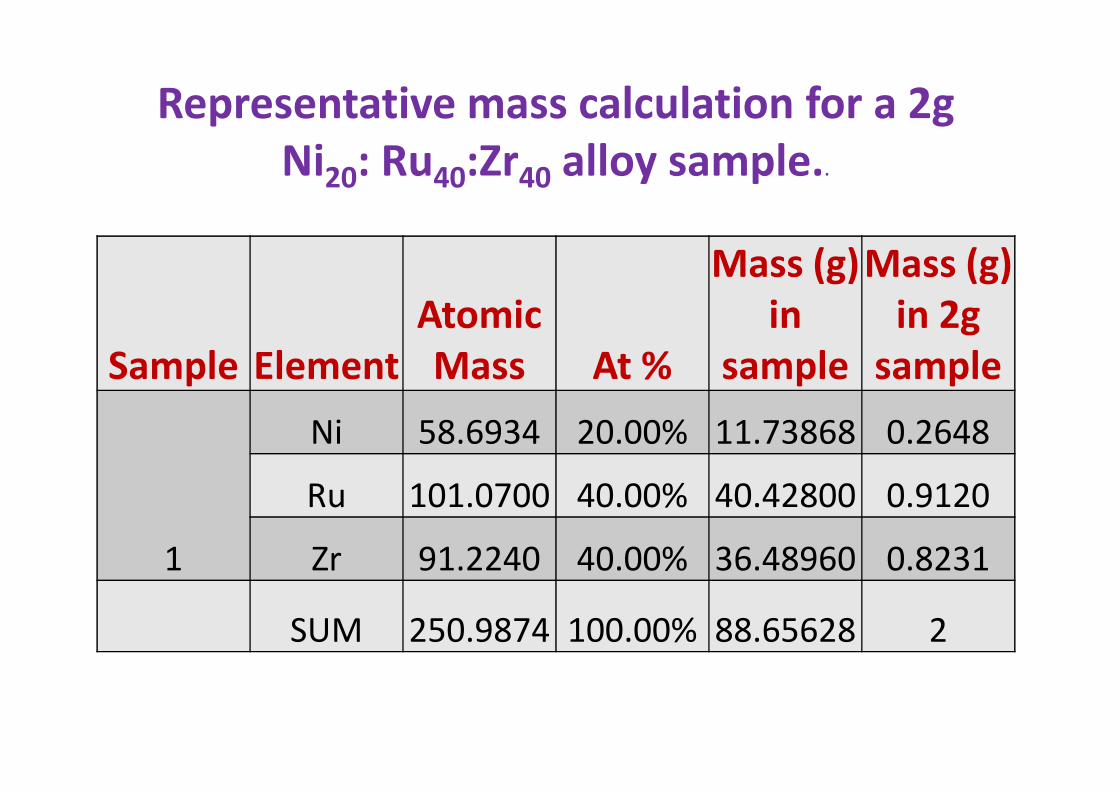
Representative mass calculation for a 2g
Ni20: Ru40:Zr40 alloy sample..
1
Ni 58.6934 20.00% 11.73868 0.2648
Ru 101.0700 40.00% 40.42800 0.9120
Zr 91.2240 40.00% 36.48960 0.8231
SUM 250.9874 100.00% 88.65628 2
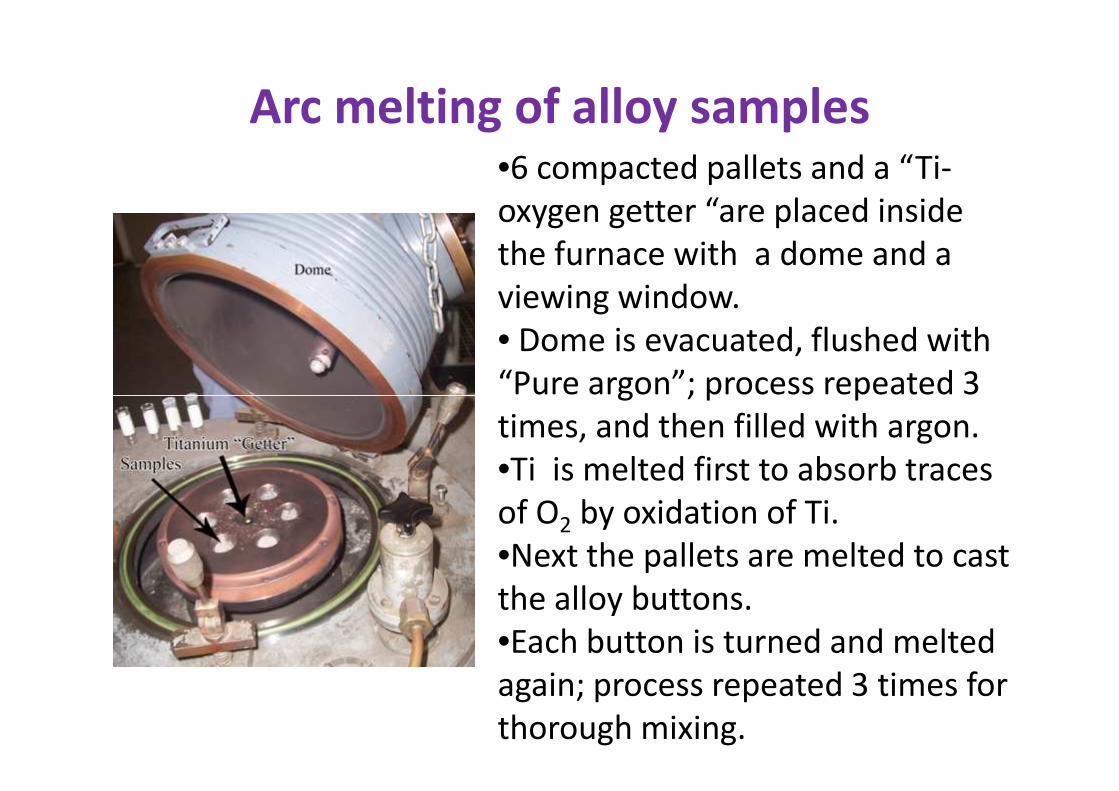
Arc melting of alloy samples•6 compacted pallets and a “Ti-oxygen getter “are placed inside the furnace with a dome and a viewing window.• Dome is evacuated, flushed with “Pure argon”; process repeated 3 “Pure argon”; process repeated 3 times, and then filled with argon.•Ti is melted first to absorb traces of O2 by oxidation of Ti.•Next the pallets are melted to cast the alloy buttons.•Each button is turned and melted again; process repeated 3 times for thorough mixing.
Metallographic preparation of as cast samples
•Alloy buttons are sectioned in two halves;�one half preserved for heat treatment studies later; and �Second half is prepared for as-cast sample analysis.
•The second half is mounted in cold epoxy resin; ground on successive grade (#25 0→ #2400) emery papers to on successive grade (#25 0→ #2400) emery papers to remove cutting-scratches; polished to 1µm finish with diamond paste.•Polished samples given a thin carbon coating to prepare them for SEM analysis.•BSE imaging and EDX analysis are used as the SEM analytical tools to deduce solidification reactions and determine phases compositions.
Samples analysis: Solidification reactions
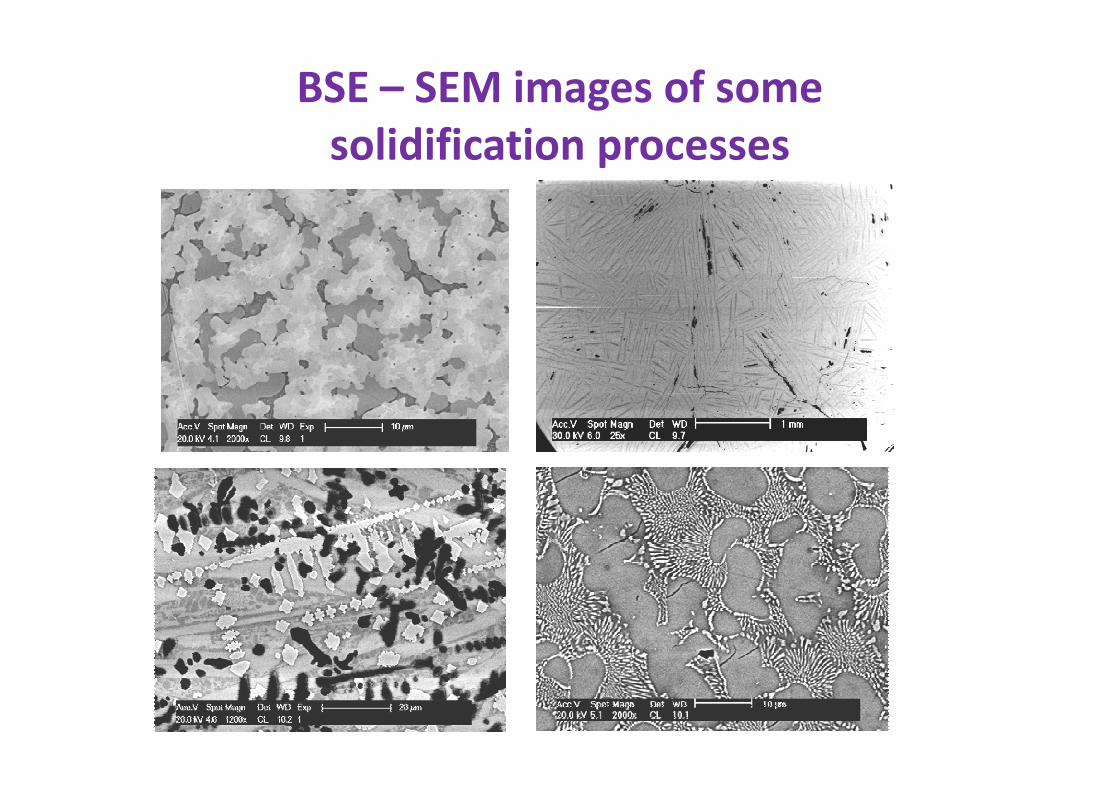
•Phases distinguished from contrast in Back scatter electron (BSE)-SEM image, (larger atomic number → brighter image).•Orientation, and coring also effects contrast.•Solidification reactions are inferred from shapes of the phases, e.g..
�Oxides, if any, are the first to form and do not participate solidification reactions, may act as nucleation sites.solidification reactions, may act as nucleation sites.�Dendrites/ needles are the first to solidify.�Liquid then solidifies outwards from the dendrites.�Irregular (chewed-up) edges of the solid phase point to peritectic reaction .�Eutectic is the last to solidify as a mix of dark and light regions from simultaneous growth of two or more phases. (zebra like appearance).
BSE – SEM images of some
solidification processes
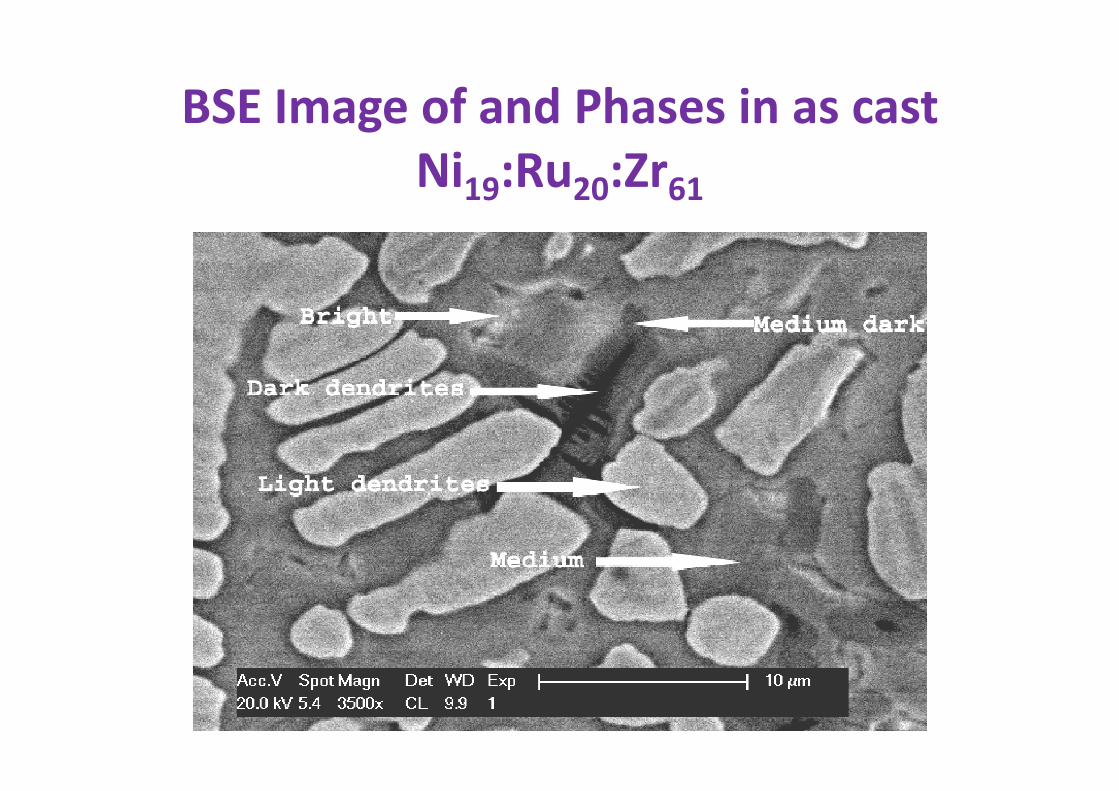
BSE Image of and Phases in as cast
Ni19:Ru20:Zr61
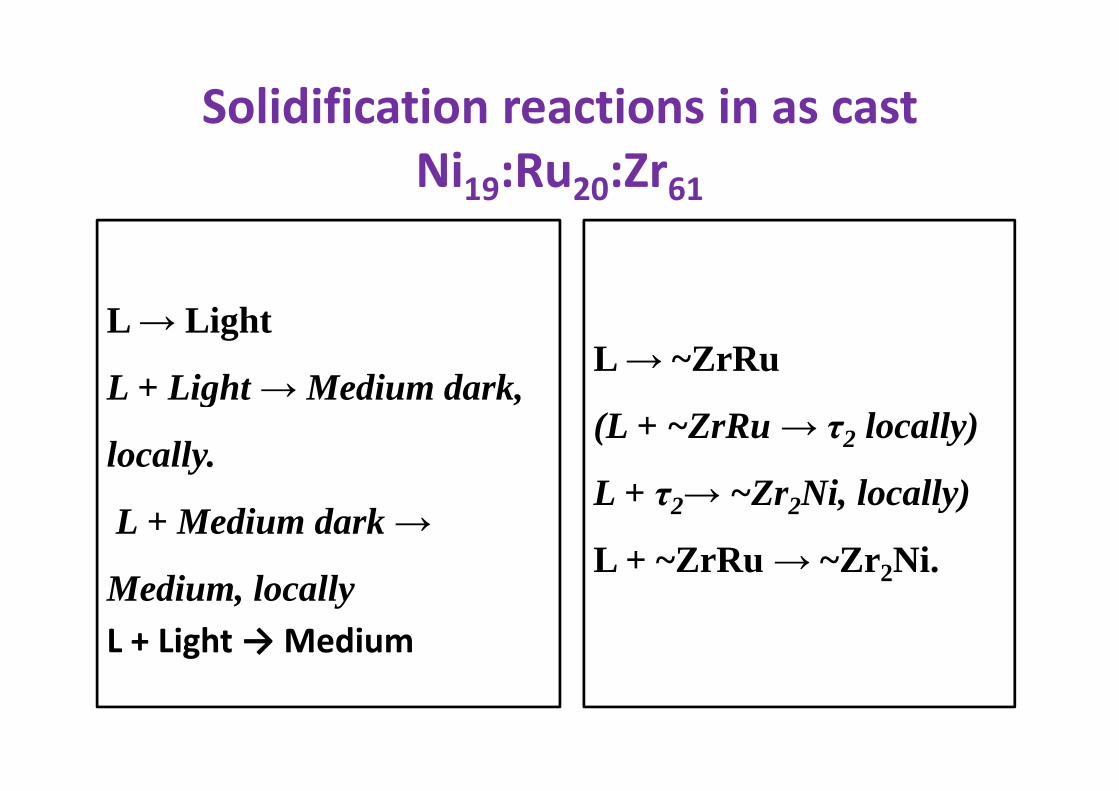
Solidification reactions in as cast
Ni19:Ru20:Zr61
L → Light
L + Light → Medium dark, L→ ~ZrRu
L + Light → Medium dark,
locally.
L + Medium dark →
Medium, locallyL + Light → Medium
(L + ~ZrRu → τ2 locally)
L + τ2→ ~Zr2Ni, locally)
L + ~ZrRu → ~Zr2Ni.
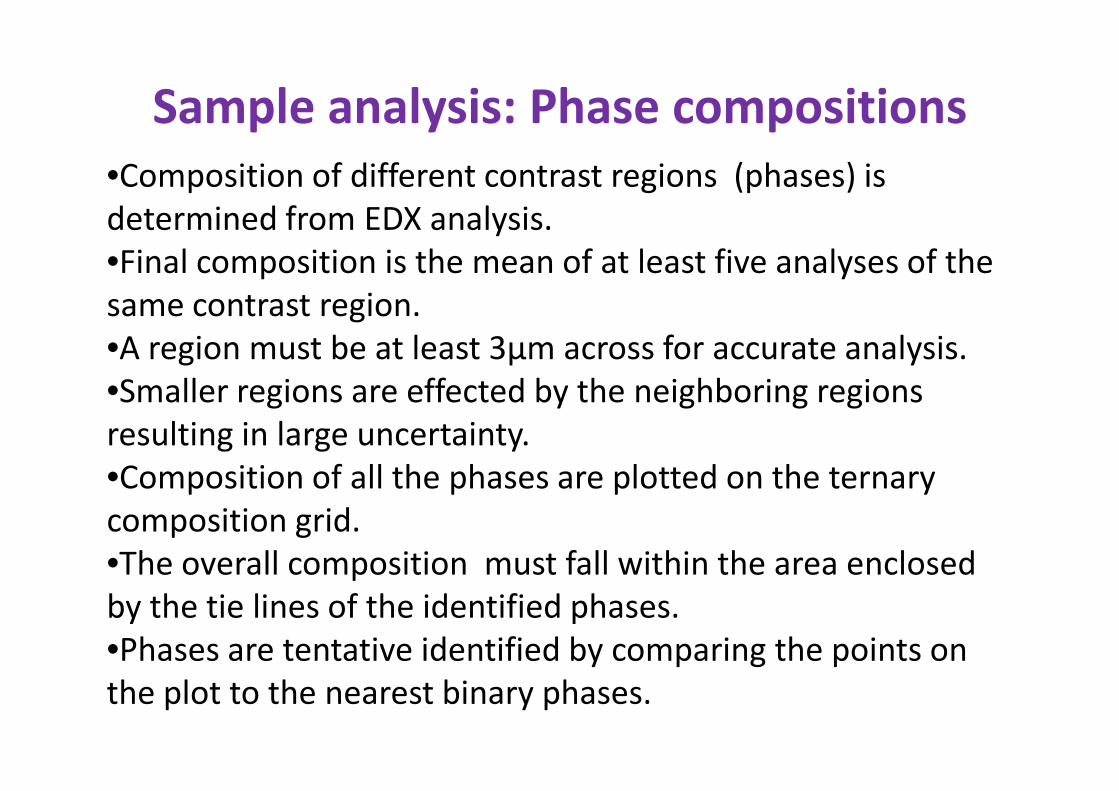
Sample analysis: Phase compositions
•Composition of different contrast regions (phases) is determined from EDX analysis.•Final composition is the mean of at least five analyses of the same contrast region.•A region must be at least 3µm across for accurate analysis.•Smaller regions are effected by the neighboring regions •Smaller regions are effected by the neighboring regions resulting in large uncertainty.•Composition of all the phases are plotted on the ternary composition grid.•The overall composition must fall within the area enclosed by the tie lines of the identified phases.•Phases are tentative identified by comparing the points on the plot to the nearest binary phases.
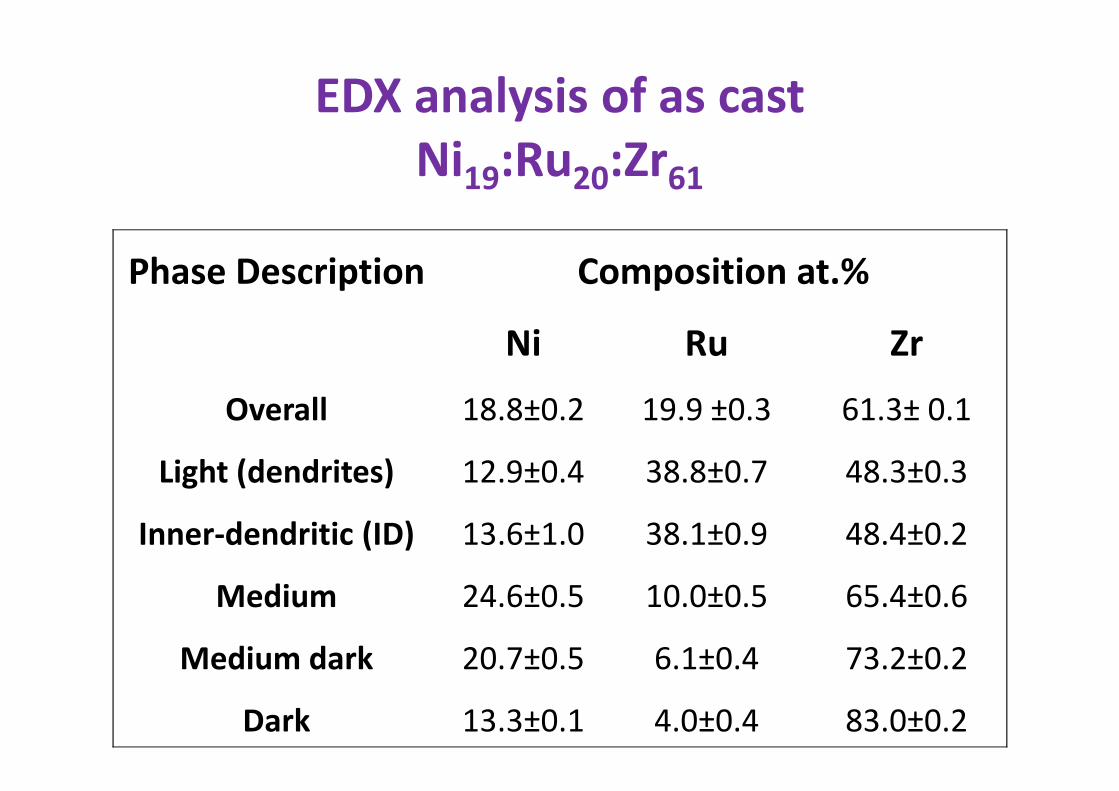
EDX analysis of as cast
Ni19:Ru20:Zr61
Phase Description Composition at.%
Ni Ru Zr
Overall 18.8±0.2 19.9 ±0.3 61.3± 0.1Overall 18.8±0.2 19.9 ±0.3 61.3± 0.1
Light (dendrites) 12.9±0.4 38.8±0.7 48.3±0.3
Inner-dendritic (ID) 13.6±1.0 38.1±0.9 48.4±0.2
Medium 24.6±0.5 10.0±0.5 65.4±0.6
Medium dark 20.7±0.5 6.1±0.4 73.2±0.2
Dark 13.3±0.1 4.0±0.4 83.0±0.2
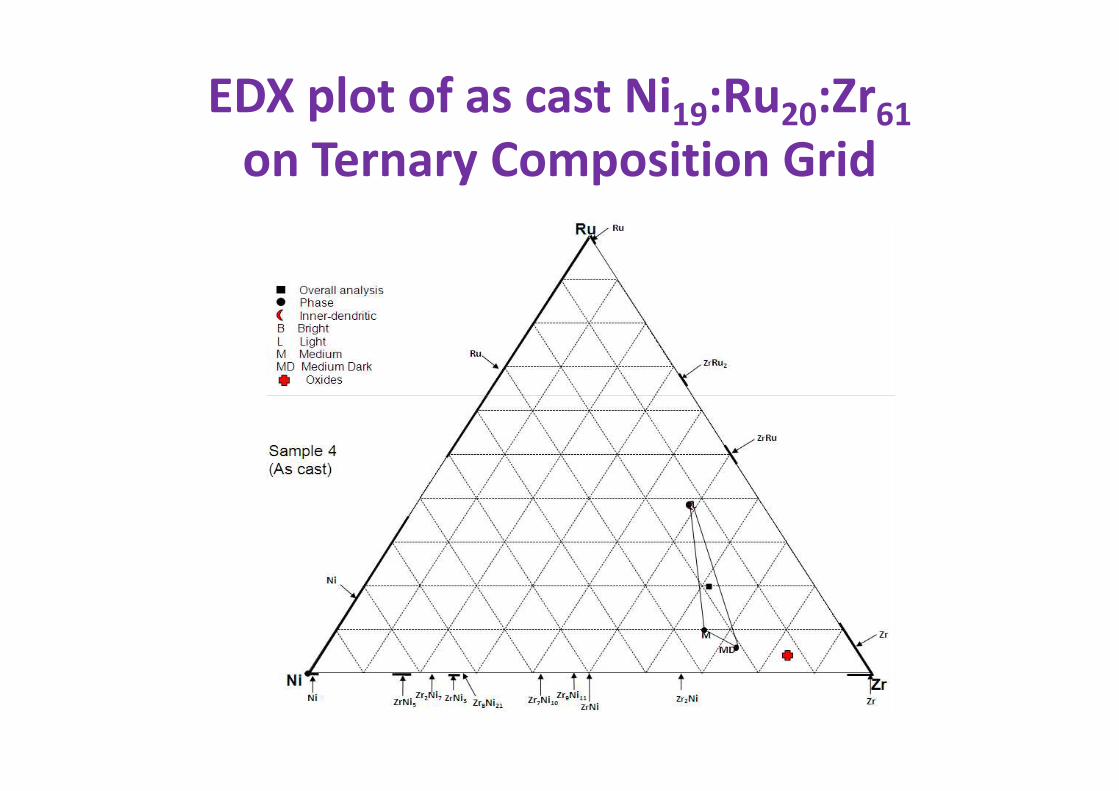
EDX plot of as cast Ni19:Ru20:Zr61
on Ternary Composition Grid
Sample analysis: Phase identification
•Phases are confirmed and identified from the XRD analysis of the samples and by matching peaks from the data base.•As known binary phases of our ternary system are all known, the unidentified peaks in the XRD spectra point to known, the unidentified peaks in the XRD spectra point to new ternary phases. In the system.•Position of the unidentified phases on the ternary plot support the presence of ternary phases in the system as such points are far from the known binary phases.•Next we go back to solidification reaction, and express them in terms of the phases identified.
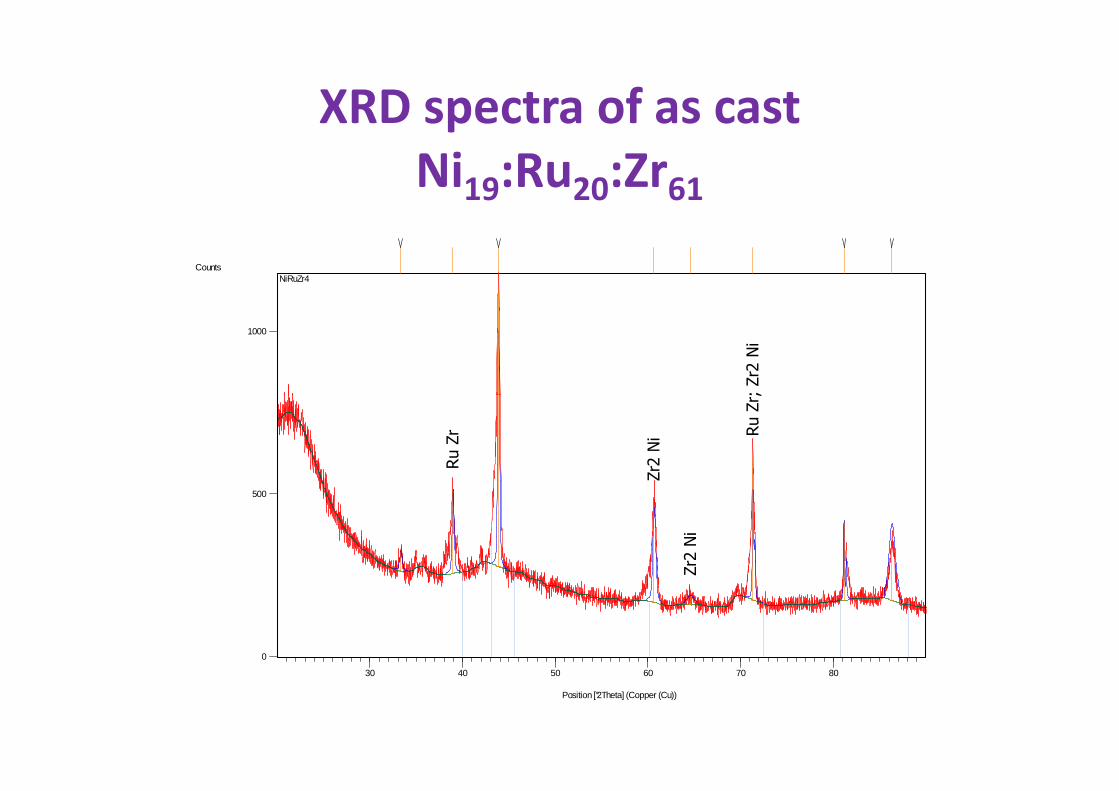
XRD spectra of as cast
Ni19:Ru20:Zr61
Counts
1000
Ru Zr; Zr2 Ni
NiRuZr4
Position [°2Theta] (Copper (Cu))
30 40 50 60 70 80
0
500
Ru Zr
Zr2 Ni
Zr2 Ni
Ru Zr; Zr2 Ni
More samples analysis
•This is the complete storey of analysis of one sample.•Likewise all the six samples in the batch are analyzed, and plotted together on the ternary composition grid.•Next a second batch of six samples is cast with compositions selected to fill the gaps on the composition grid; samples analyzed, and plotted on the same grid with grid; samples analyzed, and plotted on the same grid with the first batch.•Finally third batch of six samples is cast to fill the remaining gaps or to investigate certain region of the grid in details; samples analyzed.•In the end we have 18 samples plotted on the grid.•This is generally sufficient data to be able plot solidus surface and liquidus projection of the ternary system.
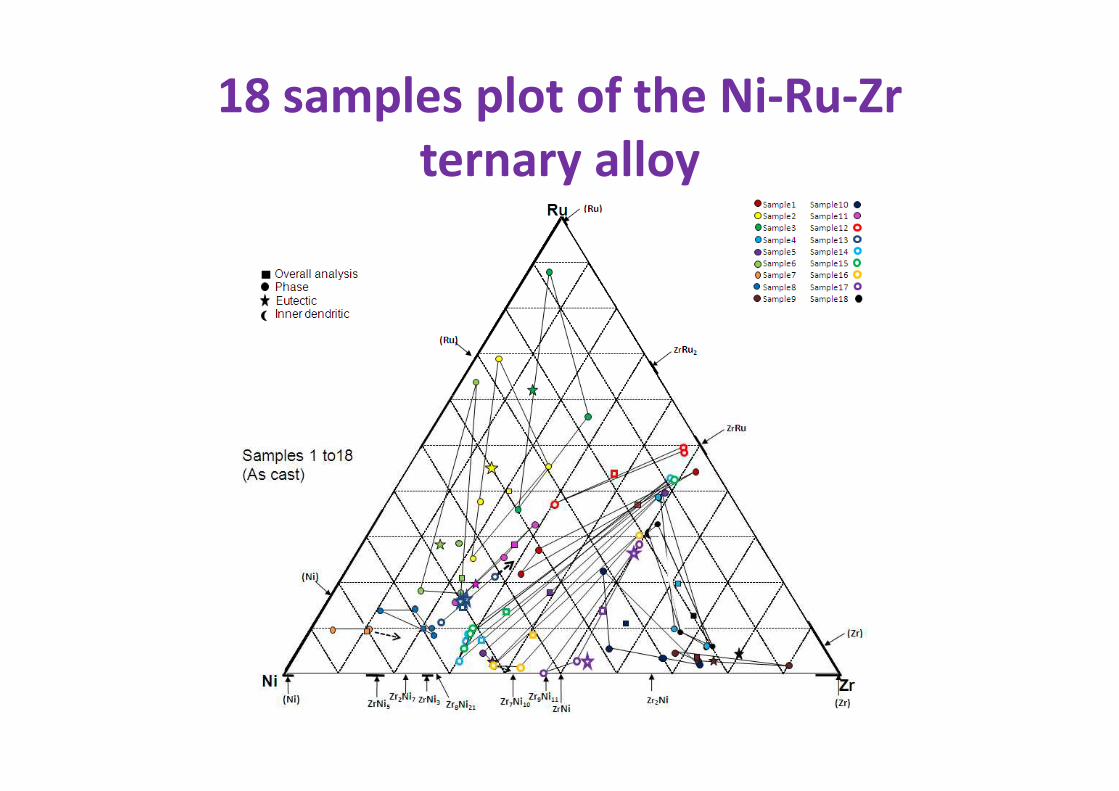
18 samples plot of the Ni-Ru-Zr
ternary alloy
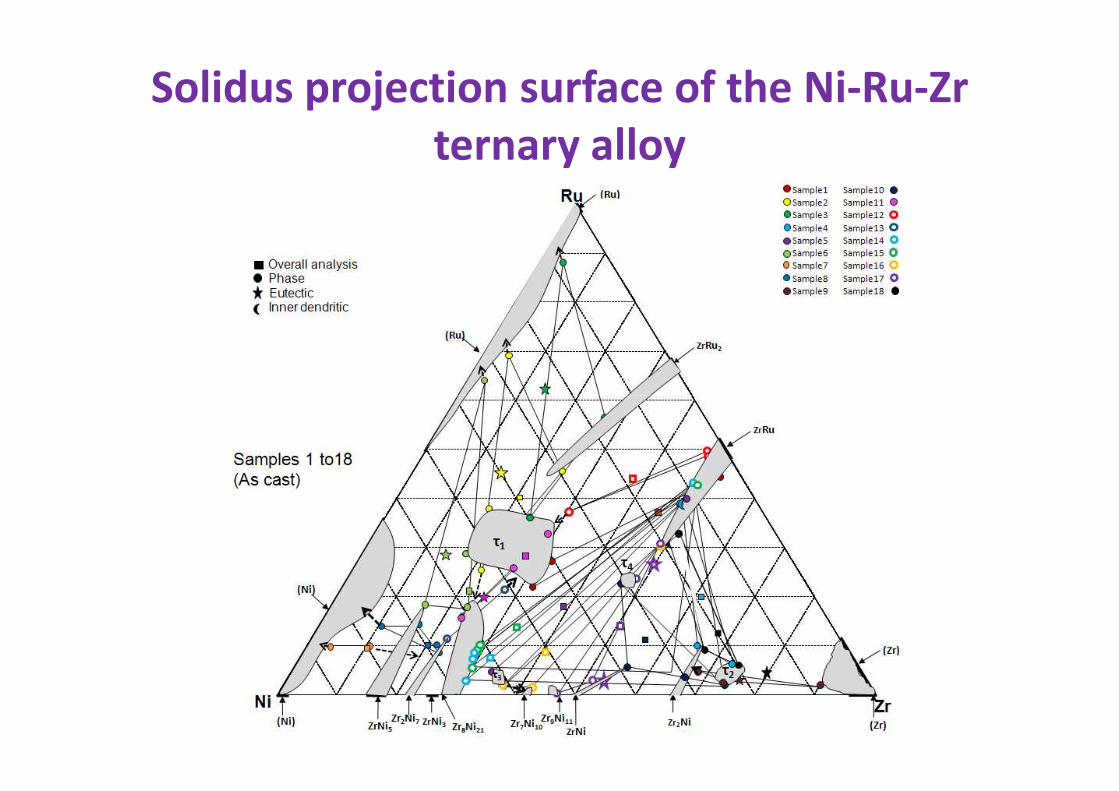
Solidus projection surface of the Ni-Ru-Zr
ternary alloy
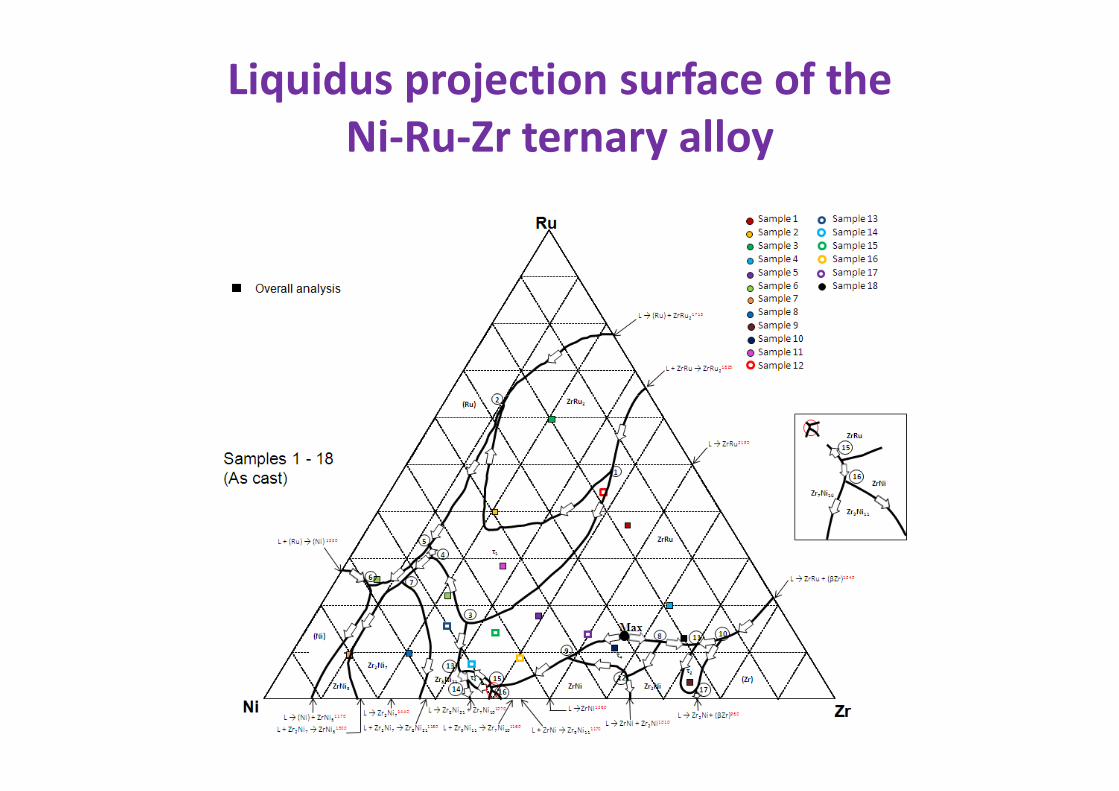
Liquidus projection surface of the
Ni-Ru-Zr ternary alloy
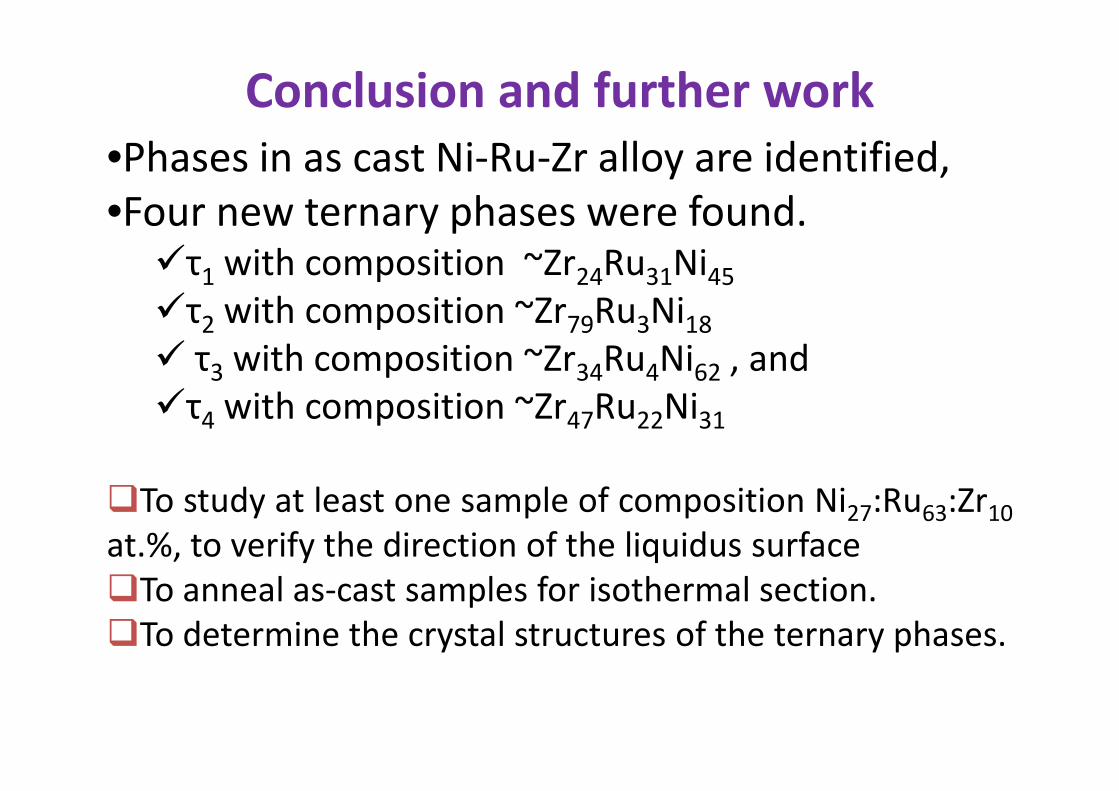
Conclusion and further work
•Phases in as cast Ni-Ru-Zr alloy are identified,•Four new ternary phases were found.
�τ1 with composition ~Zr24Ru31Ni45
�τ2 with composition ~Zr79Ru3Ni18
� τ3 with composition ~Zr34Ru4Ni62 , and �τ with composition ~Zr Ru Ni�τ4 with composition ~Zr47Ru22Ni31
�To study at least one sample of composition Ni27:Ru63:Zr10
at.%, to verify the direction of the liquidus surface�To anneal as-cast samples for isothermal section.�To determine the crystal structures of the ternary phases.
“Millennium Etched in a Rock: A Geological Calendar”
First Prize: Micrograph Competition – MSSA2005,
44th Annual Conference of the MSSA, December 2005,
and
Image of Distinction Award: Nikon’s Small World 2009
Jain family: December 2011