Embed Size (px)
Citation preview
Page 1 of 16
MATHS SKILLS IN BIOLOGY
You should be familiar with the following GCSE maths skills before starting you’re A-Level Biology course. Use the tick list to indicate which skills you feel you are happy with…..be honest!
1 Arithmetic and numerical computation
o Recognise and use expressions in decimal form
o Recognise and use expressions in standard form
o Use ratios, fractions and percentages
o Make estimates of the results of simple calculations
2 Handling data
o Use an appropriate number of significant figures
o Find arithmetic means
o Construct and interpret frequency tables and diagrams, bar charts and histograms
o Understand the principles of sampling as applied to scientific data
o Understand simple probability
o Understand the terms mean, mode and median
o Use a scatter diagram to identify a correlation between two variables
o Make order of magnitude calculations
3 Algebra
o Understand and use the symbols: =, <, <<, >>, >, ∝ , ~
o Solve simple algebraic equations
4 Graphs
o Translate information between graphical and numeric form
o Understand that y = mx + c represents a linear relationship
o Plot two variables from experimental or other data
o Determine the slope and intercept of a linear graph
5 Geometry and trigonometry
o Calculate areas of triangles and rectangles, surface areas and volumes of cubes
Page 2 of 16
Summer Task: Assess your understanding of some of these skills by completing the GCSE questions below.
You may have come across some of the questions during your GCSE course but this doesn’t matter as the point of this task is to remind yourself about the maths skills you need and think about how to form a model answer!
Making sure you are happy with these skills now will make the transition to A-Level much easier, as it will get significantly harder!
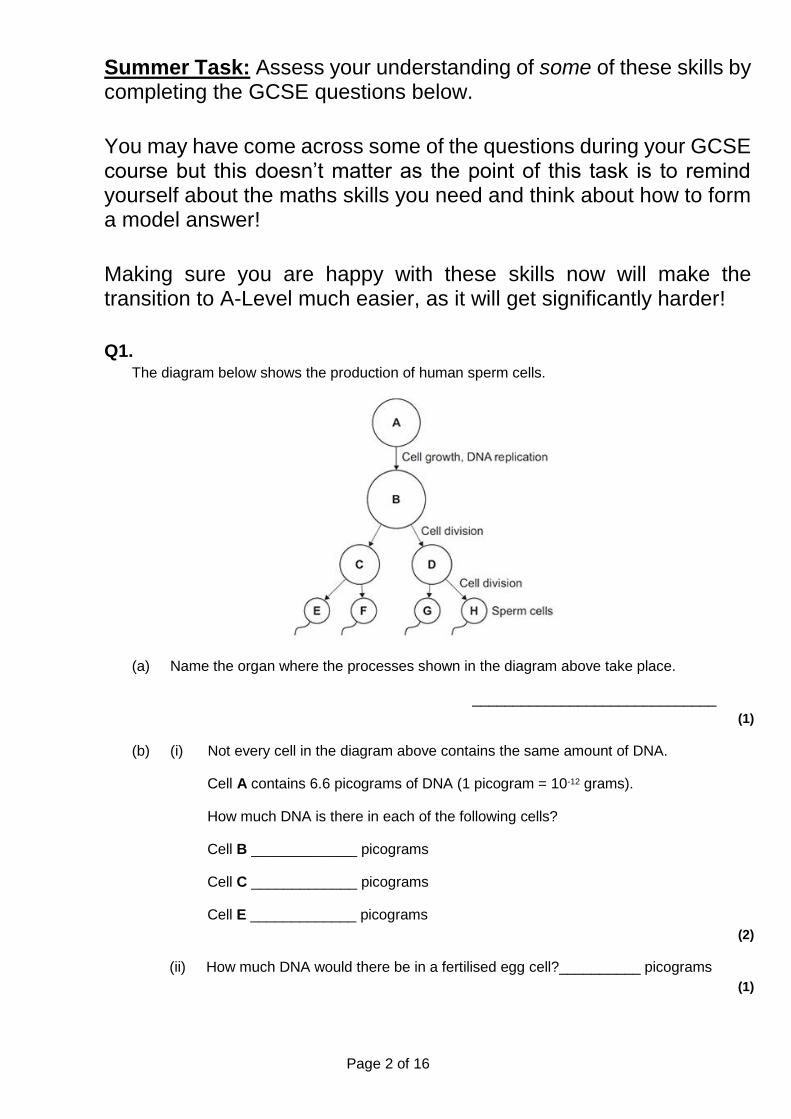
Q1. The diagram below shows the production of human sperm cells.
(a) Name the organ where the processes shown in the diagram above take place.
______________________________
(1)
(b) (i) Not every cell in the diagram above contains the same amount of DNA.
Cell A contains 6.6 picograms of DNA (1 picogram = 10-12 grams).
How much DNA is there in each of the following cells?
Cell B _____________ picograms
Cell C _____________ picograms
Cell E _____________ picograms
(2)
(ii) How much DNA would there be in a fertilised egg cell?__________ picograms
(1)
Page 3 of 16
(iii) A fertilised egg cell divides many times to form an embryo.
Name this type of cell division. ______________________________
(1)
(c) After a baby is born, stem cells may be collected from the umbilical cord. These can be frozen and stored for possible use in the future.
(i) What are stem cells?
______________________________________________________________
______________________________________________________________
______________________________________________________________
(2)
(ii) Suggest why it is ethically more acceptable to take stem cells from an umbilical cord instead of using stem cells from a 4-day-old embryo produced by In Vitro Fertilisation (IVF).
______________________________________________________________
______________________________________________________________
(1)
(iii) Stem cells taken from a child’s umbilical cord could be used to treat a condition later in that child’s life.
Give one advantage of using the child’s own umbilical cord stem cells instead of using stem cells donated from another person.
______________________________________________________________
______________________________________________________________
(1)
(iv) Why would it not be possible to treat a genetic disorder in a child using his own umbilical cord stem cells?
______________________________________________________________
______________________________________________________________
(1)
(Total 10 marks)
Page 4 of 16
Q2. Amylase is an enzyme found in the human body.
Amylase breaks down starch into sugars.
(a) Where is amylase produced in the human body?
Tick one box.
Liver and pancreas
Liver and stomach
Salivary glands and pancreas
Salivary glands and stomach
(1)
(b) Enzymes speed up chemical reactions.
Explain how amylase breaks down starch.
___________________________________________________________________
___________________________________________________________________
___________________________________________________________________
___________________________________________________________________
___________________________________________________________________
___________________________________________________________________
(3)
(c) One sugar in the body is glucose.
Glucose is used for respiration.
Give one other use for glucose in the body.
___________________________________________________________________
(1)
Page 5 of 16
(d) A student investigated the effect of temperature on the activity of human amylase.
This is the method used.
1. Put 2 cm3 of 1% starch solution into a boiling tube.
2. Put 2 cm3 of amylase solution into a second boiling tube.
3. Put both boiling tubes into a water bath at 20 °C.
4. After 5 minutes, mix the amylase and the starch together in one boiling tube.
5. After 30 seconds, add a drop of the starch and amylase mixture to a drop of iodine solution in one well of a spotting tile.
6. Repeat step 5 until the iodine solution no longer changes colour.
7. Repeat steps 1 – 6 at 40 °C and at 60 °C and at 80 °C
Why did the student leave the starch and amylase solutions in the water bath for 5 minutes in step 3?
___________________________________________________________________
___________________________________________________________________
(1)
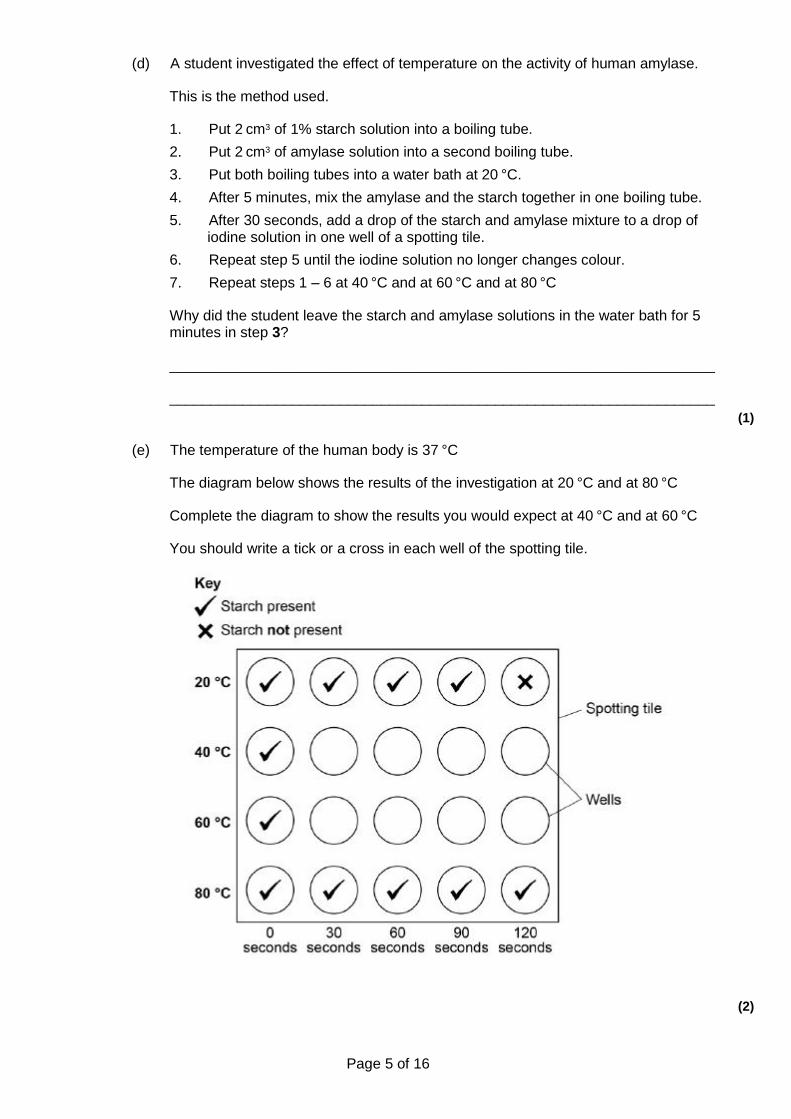
(e) The temperature of the human body is 37 °C
The diagram below shows the results of the investigation at 20 °C and at 80 °C
Complete the diagram to show the results you would expect at 40 °C and at 60 °C
You should write a tick or a cross in each well of the spotting tile.
(2)
Page 6 of 16
(f) There are different ways to investigate the breakdown of starch by amylase.
One other method is to measure the concentration of starch present in the solution every 30 seconds.
Why is this method better than the method the student used?
___________________________________________________________________
___________________________________________________________________
_________________________________________________________________(2)
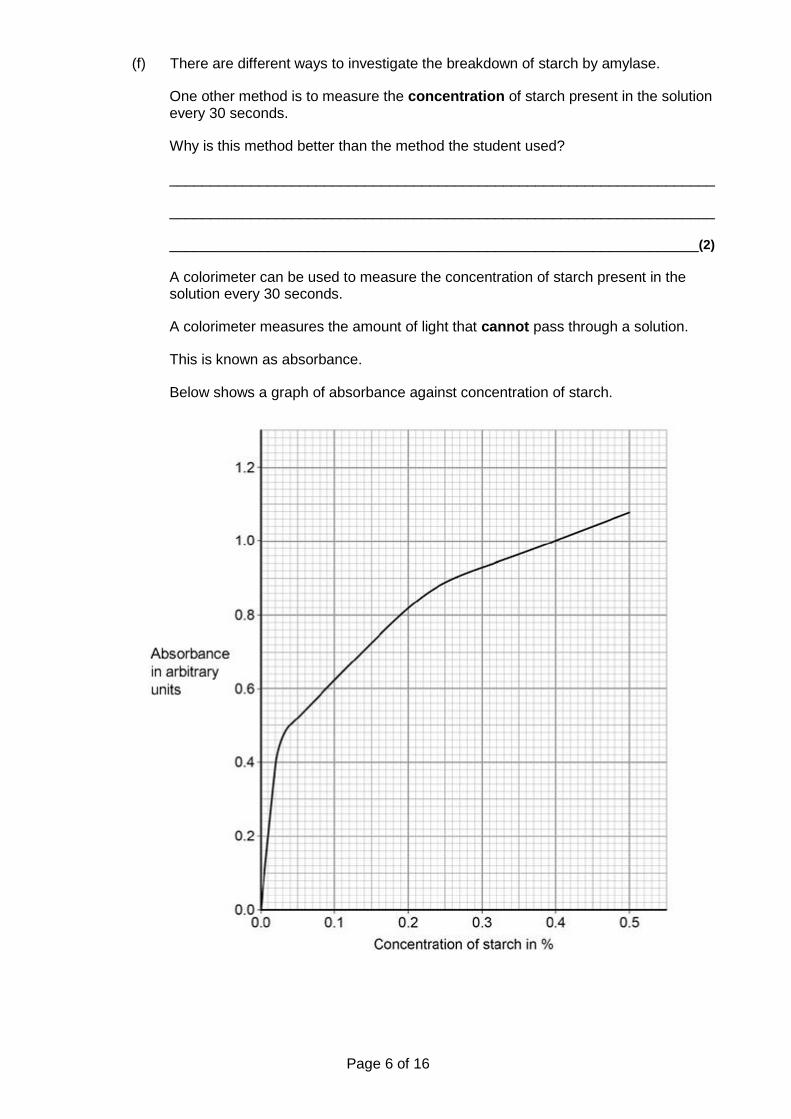
A colorimeter can be used to measure the concentration of starch present in the solution every 30 seconds.
A colorimeter measures the amount of light that cannot pass through a solution.
This is known as absorbance.
Below shows a graph of absorbance against concentration of starch.
Page 7 of 16
(g) The absorbance of the solution at 40 °C was 0.56 arbitrary units after 30 seconds.
What was the concentration of starch in this solution?
___________________________________________________________________
Concentration of starch = ____________________ %
(1)
(h) The concentration of starch in the solution at 20 °C after 1 minute is different from the concentration at 40 °C after 1 minute.
Explain why.
___________________________________________________________________
___________________________________________________________________
___________________________________________________________________
(2)
(i) Predict the absorbance for the solution at 80 °C after 30 seconds.
Give a reason for your answer.
Absorbance = ______________________ arbitrary units
Reason ____________________________________________________________
___________________________________________________________________
___________________________________________________________________
(3)
(Total 16 marks)
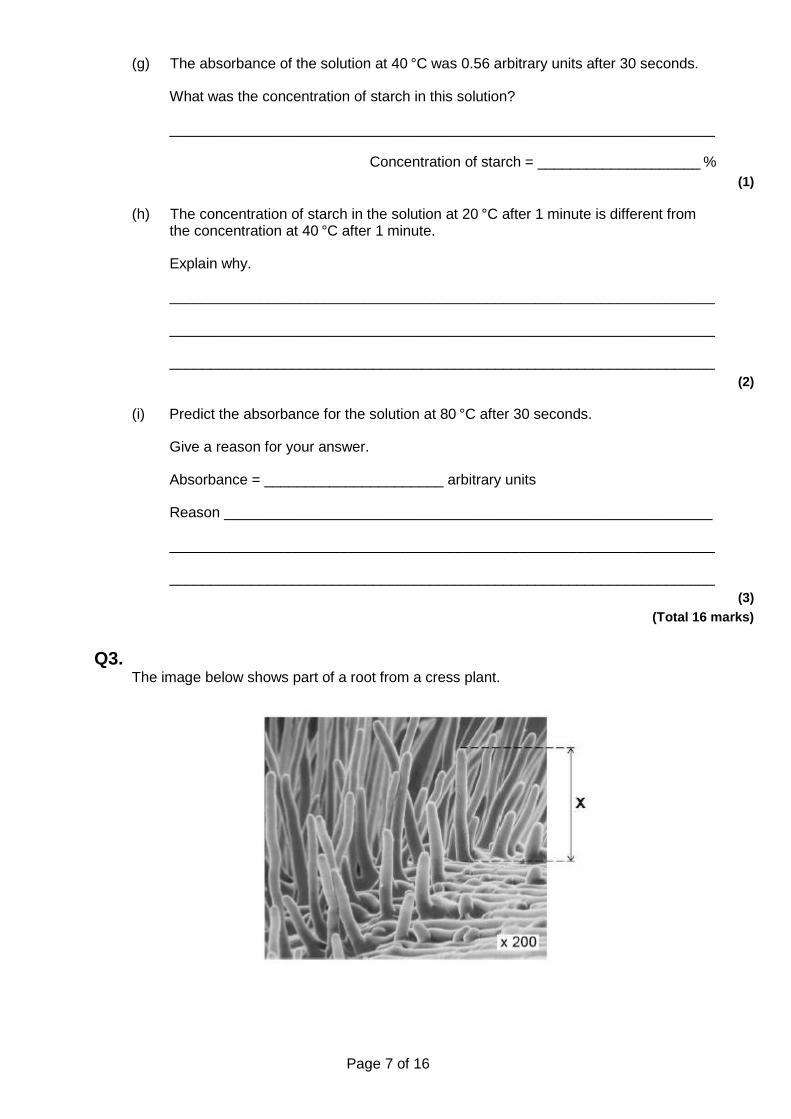
Q3. The image below shows part of a root from a cress plant.
Page 8 of 16
(a) What type of microscope was used to create the image above?
___________________________________________________________________
(1)
(b) The magnification of the cress root in the image above is × 200.
There are 1000 micrometres (μm) in a millimetre (mm).
Calculate the real length of the root hair, X.
Give your answer in micrometres (μm).
___________________________________________________________________
___________________________________________________________________
Real length X = ____________________ μm
(2)
(c) Root hair cells take up water from the soil.
Explain one way in which the root hair cell is adapted to this function.
___________________________________________________________________
___________________________________________________________________
___________________________________________________________________
___________________________________________________________________
(2)
The table shows the water uptake by a plant’s roots on two different days.
Mean water uptake in cm3 per hour
Cold day 1.8
Hot day 3.4
(d) Explain why the mean rate of water uptake is higher on a hot day than on a cold day.
___________________________________________________________________
___________________________________________________________________
___________________________________________________________________
___________________________________________________________________
___________________________________________________________________
___________________________________________________________________
(3)
Page 9 of 16
(e) The concentration of mineral ions in the soil is lower than in root hair cells.
Root hair cells take up mineral ions from the soil.
Root hair cells contain mitochondria.
Explain why root hair cells contain mitochondria.
___________________________________________________________________
___________________________________________________________________
___________________________________________________________________
___________________________________________________________________
___________________________________________________________________
___________________________________________________________________
(4)
(Total 12 marks)
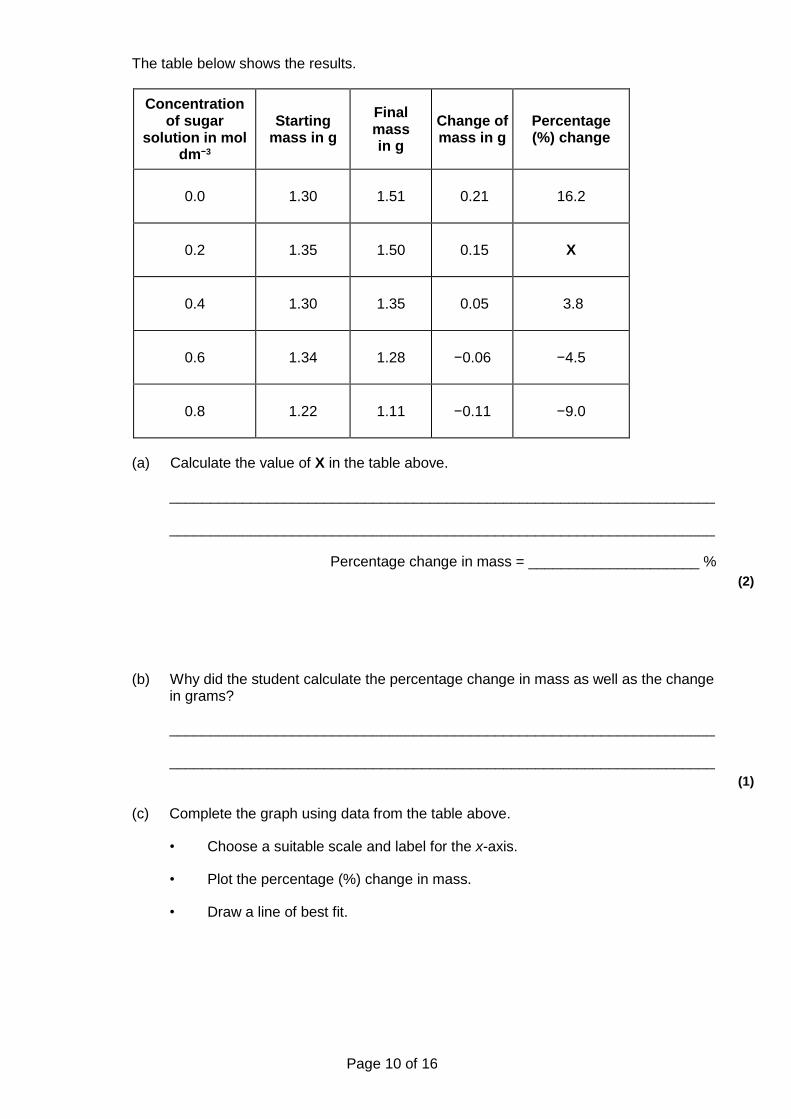
Q4. A student investigated the effect of different sugar solutions on potato tissue.
This is the method used.
1. Add 30 cm3 of 0.8 mol dm−3 sugar solution to a boiling tube.
2. Repeat step 1 with equal volumes of 0.6, 0.4 and 0.2 mol dm−3 sugar solutions.
3. Use water to give a concentration of 0.0 mol dm−3.
4. Cut five cylinders of potato of equal size using a cork borer.
5. Weigh each potato cylinder and place one in each tube.
6. Remove the potato cylinders from the solutions after 24 hours.
7. Dry each potato cylinder with a paper towel.
8. Reweigh the potato cylinders.
Page 10 of 16
The table below shows the results.
Concentration of sugar
solution in mol dm−3
Starting mass in g
Final mass in g
Change of mass in g
Percentage (%) change
0.0 1.30 1.51 0.21 16.2
0.2 1.35 1.50 0.15 X
0.4 1.30 1.35 0.05 3.8
0.6 1.34 1.28 −0.06 −4.5
0.8 1.22 1.11 −0.11 −9.0
(a) Calculate the value of X in the table above.
___________________________________________________________________
___________________________________________________________________
Percentage change in mass = _____________________ %
(2)
(b) Why did the student calculate the percentage change in mass as well as the change in grams?
___________________________________________________________________
___________________________________________________________________
(1)
(c) Complete the graph using data from the table above.
• Choose a suitable scale and label for the x-axis.
• Plot the percentage (%) change in mass.
• Draw a line of best fit.
Page 11 of 16
(4)
(d) Use your graph to estimate the concentration of the solution inside the potato cells.
Concentration = ________________________ mol dm−3
(1)
(e) The results in the table above show the percentage change in mass of the potato cylinders.
Explain why the percentage change results are positive and negative.
___________________________________________________________________
___________________________________________________________________
___________________________________________________________________
___________________________________________________________________
___________________________________________________________________
___________________________________________________________________
___________________________________________________________________
(3)
Page 12 of 16
(f) Suggest two possible sources of error in the method given above.
1. _________________________________________________________________
___________________________________________________________________
2. _________________________________________________________________
___________________________________________________________________
(2)
(Total 13 marks)
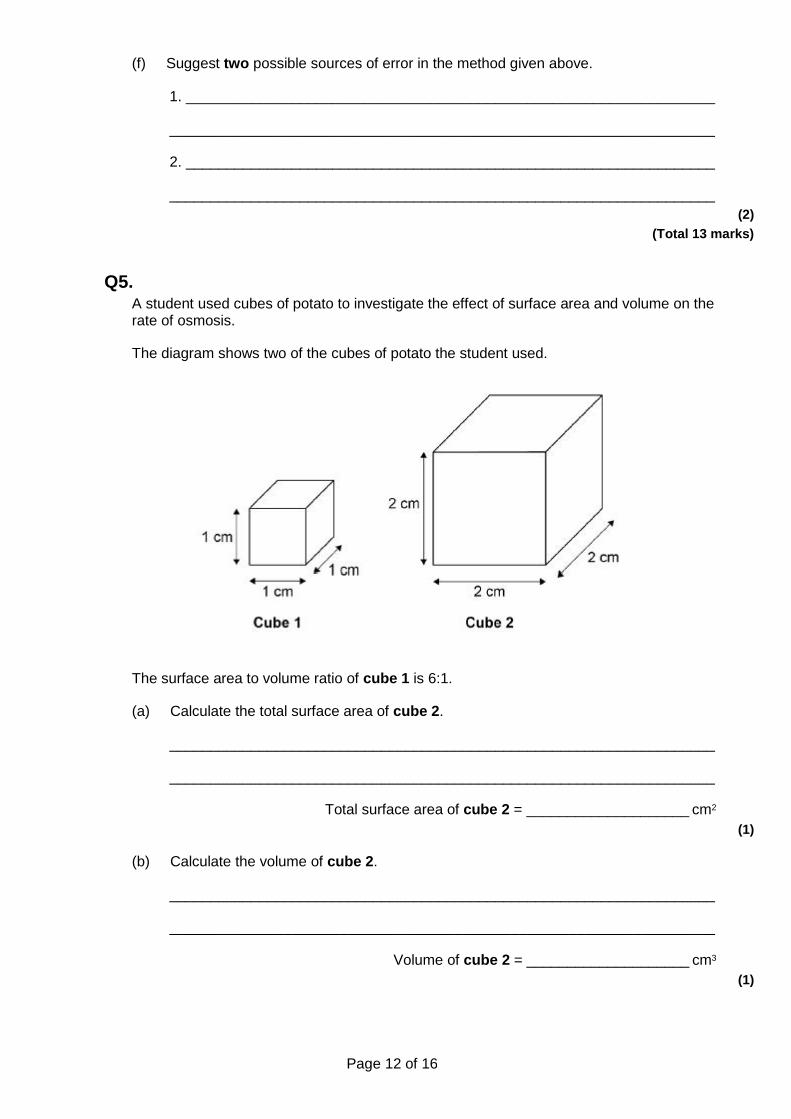
Q5. A student used cubes of potato to investigate the effect of surface area and volume on the rate of osmosis.
The diagram shows two of the cubes of potato the student used.
The surface area to volume ratio of cube 1 is 6:1.
(a) Calculate the total surface area of cube 2.
___________________________________________________________________
___________________________________________________________________
Total surface area of cube 2 = ____________________ cm2
(1)
(b) Calculate the volume of cube 2.
___________________________________________________________________
___________________________________________________________________
Volume of cube 2 = ____________________ cm3
(1)
Page 13 of 16
(c) Calculate the surface area to volume ratio of cube 2.
Use the equation:
___________________________________________________________________
___________________________________________________________________
Surface area to volume ratio of cube 2 = ____________________ : 1
(1)
This is the method used.
1. Cut two cubes of potato of size 2 cm × 2 cm × 2 cm
• Cut one of these cubes into 8 cubes of potato of size 1 cm × 1 cm × 1 cm (sample A).
• Do not cut the other cube (sample B).
2. Measure the mass of each sample A and the mass of sample B.
3. Place all the cubes into a beaker of distilled water.
4. Leave for 30 minutes.
5. Remove the cubes from the beaker and dry the surfaces with a paper towel.
6. Measure the mass of each sample of cubes.
(d) Why were 8 cubes of size 1 cm × 1 cm × 1 cm but only one cube of size 2 cm × 2 cm × 2 cm cube used?
___________________________________________________________________
___________________________________________________________________
(1)
(e) Why did the student dry the surface of each potato cube in step 5 of the method?
___________________________________________________________________
___________________________________________________________________
(1)
Page 14 of 16
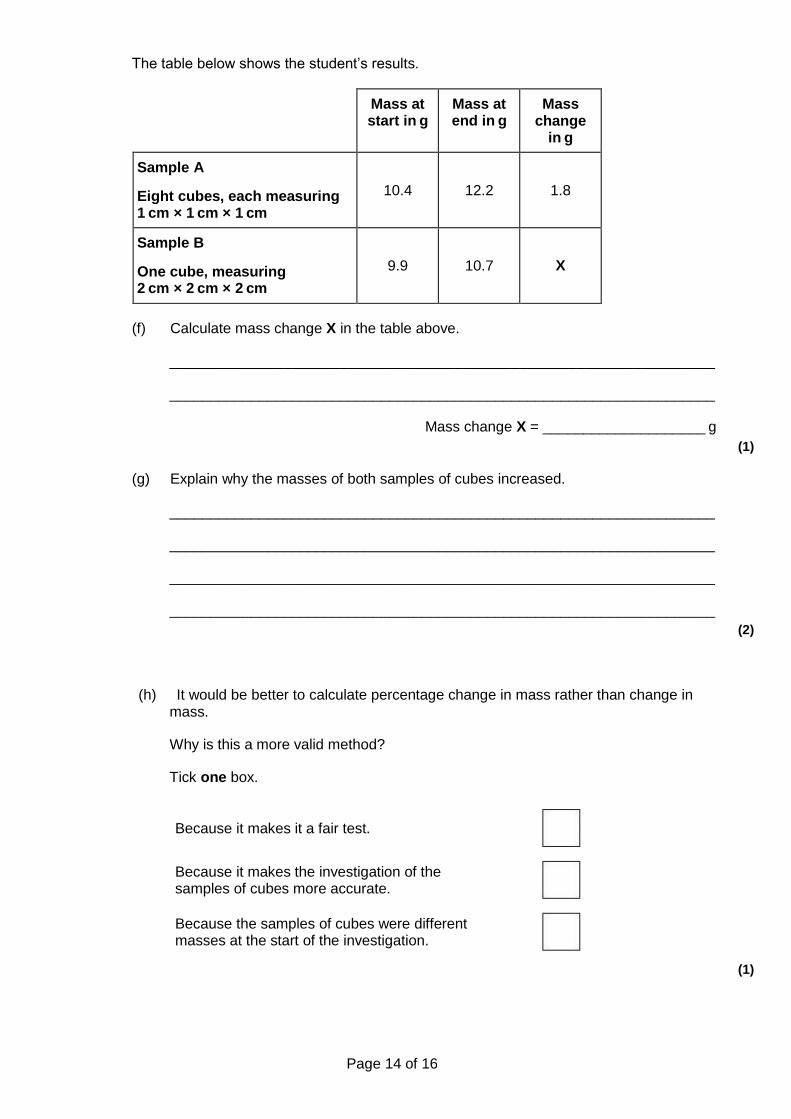
The table below shows the student’s results.
Mass at start in g
Mass at end in g
Mass change
in g
Sample A
Eight cubes, each measuring 1 cm × 1 cm × 1 cm
10.4 12.2 1.8
Sample B
One cube, measuring 2 cm × 2 cm × 2 cm
9.9 10.7 X
(f) Calculate mass change X in the table above.
___________________________________________________________________
___________________________________________________________________
Mass change X = ____________________ g
(1)
(g) Explain why the masses of both samples of cubes increased.
___________________________________________________________________
___________________________________________________________________
___________________________________________________________________
___________________________________________________________________
(2)
(h) It would be better to calculate percentage change in mass rather than change in mass.
Why is this a more valid method?
Tick one box.
Because it makes it a fair test.
Because it makes the investigation of the samples of cubes more accurate.
Because the samples of cubes were different masses at the start of the investigation.
(1)
Page 15 of 16
(i) Explain why the mass of the cubes in sample A increased more than the mass of the cube in sample B.
___________________________________________________________________
___________________________________________________________________
___________________________________________________________________
___________________________________________________________________
(2)
(Total 11 marks)
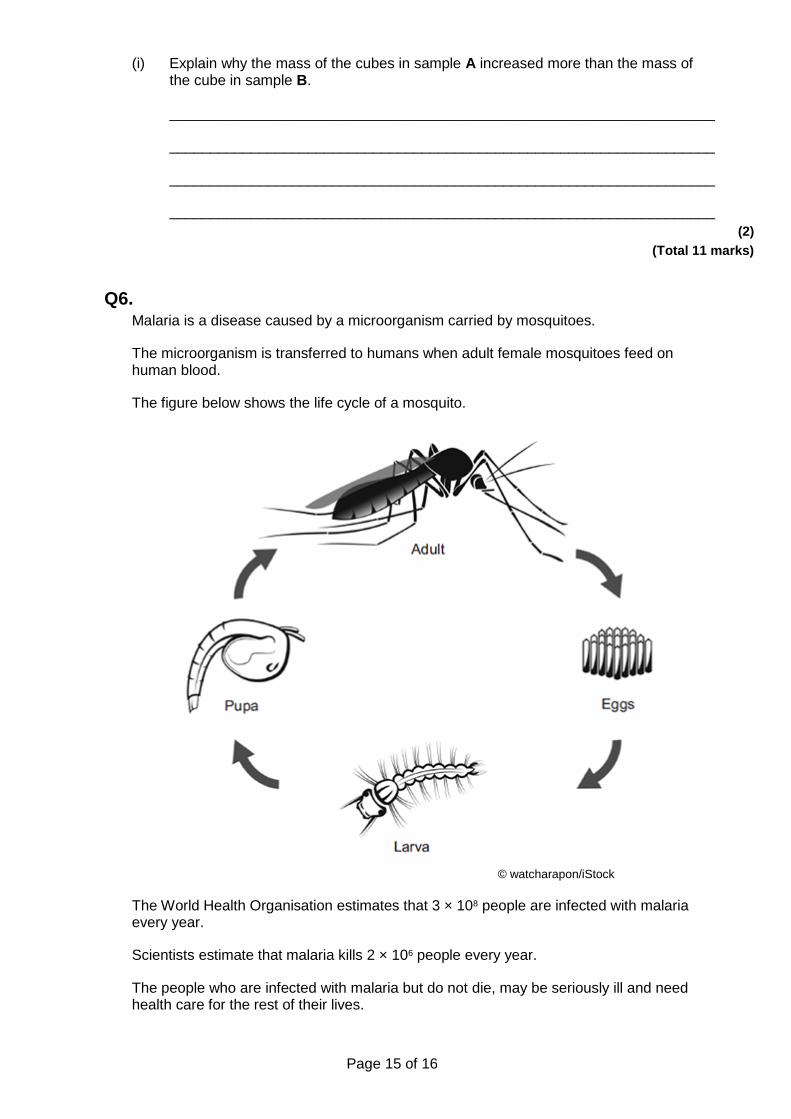
Q6. Malaria is a disease caused by a microorganism carried by mosquitoes.
The microorganism is transferred to humans when adult female mosquitoes feed on human blood.
The figure below shows the life cycle of a mosquito.
© watcharapon/iStock
The World Health Organisation estimates that 3 × 10⁸ people are infected with malaria every year.
Scientists estimate that malaria kills 2 × 10⁶ people every year.
The people who are infected with malaria but do not die, may be seriously ill and need health care for the rest of their lives.
Page 16 of 16
(a) Based on the estimated figures, what percentage of people infected with malaria die from the disease?
___________________________________________________________________
___________________________________________________________________
___________________________________________________________________
___________________________________________________________________
(2)
(b) An internet article states: 1 Mosquito larvae are at the start of the food chain for some fish. 2 Adult mosquitoes provide food for bats and birds. 3 Mosquitoes are also important in plant reproduction because they feed from
flowers of crop plants.
(i) The first sentence in the article is not correct.
Explain why.
______________________________________________________________
______________________________________________________________
(2)
(ii) A company plans to produce genetically modified (GM) adult male mosquitoes. The GM mosquitoes will carry a gene from bacteria. The gene causes the death of offspring before they become adults.
Male mosquitoes do not feed on blood. Scientists are considering releasing millions of adult male GM mosquitoes into the wild.
Do you think scientists should release millions of male GM mosquitoes into the wild? In your answer you should give advantages and disadvantages of releasing GM mosquitoes into the wild.
______________________________________________________________
______________________________________________________________
______________________________________________________________
______________________________________________________________
(4)
(iii) Describe the process for creating a GM mosquito.
______________________________________________________________
______________________________________________________________
______________________________________________________________
(3)
(Total 11 marks)