Embed Size (px)
Citation preview

ISSN 2087-8885
E-ISSN 2407-0610
Journal on Mathematics Education
Volume 9, No. 1, January 2018, pp. 129-144
129
MATHEMATICS SKILL OF FIFTEEN YEARS OLD STUDENTS IN
YOGYAKARTA IN SOLVING PROBLEMS LIKE PISA
Nidya Ferry Wulandari1, Jailani
2
1SMA Negeri 1 Seyegan, Tegal Gentan, Margoagung, Sleman, Yogyakarta, Indonesia 2Yogyakarta State University, Jl. Colombo No.1, Caturtunggal, Depok, Sleman, Yogyakarta, Indonesia
Email: [email protected]
Abstract
The aims of this research were to describe mathematics skill of 8th
fifteen-year old students in Yogyakarta in
solving problem of PISA. The sampling was combination of stratified and cluster random sampling. The
sample consisting of 400 students was selected from fifteen schools. The data collection was by tests. The
research finding revealed that mathematics skill of fifteen-year old students in Yogyakarta in solving problem
of PISA was low in category but it was better than Indonesian students in PISA 2012. Mathematics skill of
fifteen-year old students in Yogyakarta in solving problem of PISA was below the OECD average of PISA
2012.
Keywords: mathematics skill, fifteen years old students, problem solving, problem of PISA
Abstrak
Penelitian ini bertujuan untuk mendeskripsikan kemampuan matematika siswa usia 15 tahun di SMP dan SMA
di DIY dalam menyelesaikan soal model PISA. Teknik pengambilan sampel menggunakan teknik sampling
strata dan kelompok. Sampel berasal dari lima belas SMP dan SMA sebanyak 400 orang. Pengumpulan data
menggunakan tes dengan instrumen soal model PISA. Hasil penelitian menunjukkan bahwa kemampuan
matematika siswa usia 15 tahun di DIY dalam menyelesaikan soal model PISA lebih tinggi dari siswa
Indonesia dalam PISA 2012, akan tetapi masih termasuk kategori rendah. Kemampuan menyelesaikan soal
model PISA siswa di DIY masih di bawah rata-rata OECD pada PISA 2012.
Kata kunci: kemampuan matematika, siswa usia 15 tahun, penyelesaian masalah, soal model PISA
How to Cite: Wulandari, N.F. & Jailani. (2018). Mathematics skill of fifteen years old students in Yogyakarta in
solving problem like PISA. Journal on Mathematics Education, 9(1), 129-144.
Mathematics was a subject assessed in national exam and PISA study. It was the science that never
gets out of our life. Ker (2013) stated that good mathematics skill was one of basic thing in
developing latest and sophisticated technology. Therefore it was a basic and dynamic subject given in
school to the students for improving their understanding about the world and making their grade in
social life (Yore, Anderson, & Hung Chiu, 2010). In mathematical instructional of secondary school,
Kilpatrick & Swafford (2002) stated there was five standard must be attained by the students, (1)
mathematical understanding, (2) arithmetic fluency, (3) using concept to solve the problems, (4)
reasoning logically, and (5) mathematical usefulness. Whereas, PISA using innovative literacy
approach, a learning concept linked to students’ capability to apply their understanding and skill to
analyze, make a reason and judgment, communicate effectively, solve and interpret the problems in
many situations (OECD, 2013). Stacey (2012) underlined that mathematics literacy was used to all
range of age and all of skill field. He also stated that the content of PISA was described in wide range
different from content of TIMSS which taught at school.
However, Indonesian students’ mathematics achievement in both UN and PISA was low. Based

130 Journal on Mathematics Education, Volume 9, No. 1, January 2018, pp. 129-144
on data from BSNP Puspendik Balitbang that the mean of mathematics test in national exam year
2013/2014 was 6.10, while the mean of the test for special Region of Yogyakarta was 6.25
(Puspendik, 2014). UN was used to measure educational success for minimal competence, whereas
for international assessment using the PISA results. PISA was conducted every three years and in
2003 Indonesia got second lowest rank of the 40 countries. In PISA 2009 Indonesia got 61th rank of
65 participants. Indonesia's ranking in PISA 2012 was 64 out of 65 with mean value was 375 PISA
Indonesia is still below the international average is 494 (OECD, 2014).
Mathematics learning achievement of Indonesian students in PISA 2012 contained in the Table 1.
Table 1. Percentage of the number of students in each level mathematics skill in PISA 2012
Math Skill Level Indonesia International Average
Level 1 75.7% 92%
Level 2 16.8% 77%
Level 3 5.7% 54.5%
Level 4 1.5% 30.8%
Level 5 0.3% 12.6%
Level 6 0% 3.3%
Source: (OECD, 2014)
Contradiction with those, in some international mathematics event such as the mathematics
Olympiad, Indonesia got good and proud results. A lot of Indonesian students both the primary level
and secondary school won the prestigious mathematics event. There are many awards that earned by
Indonesian students in international mathematics Olympiad such as the IMO (International
Mathematics Olympiad). Indonesian student’s team won one gold medal, one silver medal and four
bronze medals in IMO 2013 in Colombia. Furthermore, Indonesia got 19th rank from 97 countries in
that competition. Beside of that, in IMO 2014 Indonesia got 29th rank from 101 countries, two silver
medals, 3 bronze medals and one honorable mention awards and in IMO 2015 Indonesia was in 29th
rank of 104 countries (Dolinar, 2014). Whereas in PISA study, there were fewer participant countries
than another mathematics competition, while in the prestigious event such as the mathematics
Olympiad or other event was participated many more countries. In addition, schools in DIY as the
sample of PISA 2012 was low category school. Therefore, there was a question about how the true of
Indonesian students’ achievement in the PISA, especially the for Yogyakarta students.
PISA mathematics achievement in national has already known, but we should know mapping of
students’ math skills for each region in Indonesia. The government and teachers also need to know
which school or region in Indonesia that has high score of PISA, so it can be used as a reference for
the improvement of the national curriculum. It was in line to statement from Lessani, Yunus, Tarmiz
& Mahmud (2014) that research can reveal comparison of students’ achievement in solving TIMSS or

Wulandari & Jailani, Mathematics skill of fifteen years old students in Yogyakarta … 131
PISA among participant countries or a group of students in a country. After that, Eklöf, Pavešič, &
Grønmo (2014) and Ker (2013) stated that the wide test such as TIMSS and PISA gave a lot of
information to educational stakeholder to plan better policy in education. It showed that how
important knowing students’ achievement in solving problem like PISA for each region is. While,
Yogyakarta is a city of students that has mathematics average of junior high school national exam
6.25 UN greater than the national average whose score 6.10 (Puspendik, 2014). But, students’
mathematics skills were not only minimum competency in national exam, but also oriented to
reasoning and mathematical problem solving in our everyday life such as the PISA standards.
Moreover, it should be known Yogyakarta students’ mathematics achievement in solving problem like
PISA that encourages higher order thinking skills.
The weakness of PISA study had been criticized by educational experts. According to
Alexander (2013), language and cultural differences could influence the difficulty level in PISA test.
Those differences in PISA context were not always same as the condition of participant countries
which affect the level of difficulty about PISA. Schleicher (2007) also stated that measuring and
comparing a wide range of competencies such as in PISA with language and cultural differences was
difficult challenge, but it had been done continually. It was also revealed by Stephen (2013), the
founder of High Master of ST Pauls School, that the quality of translation and cultural differences
could be biased in PISA assessment. Additionally Kreiner, statisticians from the University of
Copenhagen Denmark, also criticized about PISA. Kreiner (Alexander, 2013) in the BBC News
Magazine said that he not actually able to find two questions in PISA's test that function in exactly the
same way in different countries and he doesn’t think it's reliable at all. However, Naumann (Bloem,
2013) stated that there was no sufficient research revealed that performance differences of
mathematics skills in PISA cause of language differences or analysis of data on student outcomes
assessment.
Another opinion was also expressed by Wuttke (2007) that there are difficulties in assessment
of PISA caused of not all of the students solving on the same problem, there are 13 kinds of different
questions that need to be tested the difficulties level and in some countries there are invalid items
because of mistranslation. Cultures, social, and economy differences in some countries affect the
difficulty level of PISA. Ranking system should be based on the ability of students in a country, but in
the PISA 2012 China represented only by the city of Shanghai and Hong Kong, which is located on
the top ranks. This sampling difference also cause gaps in the PISA assessment for other countries. It
is as disclosed Wuttke (2007) that in some countries PISA sampling was not representative.
Nevertheless, Arikan (2015) had compared students’ skill in more sixty countries. Therefore, there
was question how the real mathematics skill of fifteen years old students in region of Yogyakarta in
solving problem like PISA?
Apart from those, there are a a lot of research about PISA or it has been trend of analysis to use
data from PISA, such as using PISA and TIMSS mathematics assessments to identify the relative
132 Journal on Mathematics Education, Volume 9, No. 1, January 2018, pp. 129-144
strengths of students in Western and Asian countries (Wu, 2011), comparing the similarities and
differences of PISA 2003 and TIMSS (Wu, 2010), moving PISA results into the policy arena:
perspectives on knowledge transfer for future considerations and preparations (Yore, Anderson &
Hung Chiu, 2010), and comparing adult mathematical literacy with PISA students: result of pilot
study (Kiel, Bielefeld & Bielefeld, 2005), etc. Moreover, in Indonesia there is a lot of developmental
and analysis research about problem of PISA such as developing the sixth level of PISA-like
mathematics problems for secondary school students (Kamaliyah, Zulkardi & Darmawijoyo, 2013),
difficulties in solving context-based PISA mathematics task: an analysis of student’ error (Wijaya, et
al, 2014), unfinished students answer in PISA mathematics contextual problem (Lutfianto, Zulkardi &
Hartono, 2013), and exploring primary student’s problem-solving ability by doing tasks like PISA’s
question (Novita, Zulkardi & Hartono, 2012), etc.
Then, based on those reasons and criticism in PISA’s test as well as to complete the research
and development PISA’s research, this study tried to answer the problem of how the true ability of
Indonesian students in solving problem like PISA especially for Yogyakarta province and then will be
known the mathematics skill of students in Yogyakarta in solving problem like PISA in the context of
Indonesian cultures, which can be used as reference for policy making or Indonesian curriculum
development related to the standard PISA. The objective of this study was to describe the
mathematical skills of fifteen years old students in Yogyakarta in solving problem like PISA.
METHOD
This research was a survey research with quantitative descriptive approach. The research was
conducted in 15 junior and senior high schools in Yogyakarta respectively from March 31th, 2015
until May 27th, 2015. The study population was 15 years old students in junior and senior high
schools. Determining the size of the sample used Krejcie & Morgan sampling table. Based on it, for
significance level of 5%, the sample size for the population size of 51,651 people or be rounded up to
75,000 people was 382 people or at least 382 people or could be more (Krejcie & Morgan, 1970).
The sampling technique used a combination of stratified and cluster random sampling. The
researcher took a random one school of each level of junior and senior high schools by stratified
random sampling technique, while when took a random one class in ninth and tenth grade in each
school level selected by cluster random sampling technique. Selection of 9th and 10
th grade students as
research subjects based on a consideration of cognitive development of high school students aged 11
and over, according to Piaget (Slavin, 2006) they were in stage of concrete operations to formal
operations that correspond to the characteristics of PISA’s test which includes understanding until
reasoning skill and the use of context in PISA’s test.
Beside of that, consideration of taking sample 9th and 10
th grade students was based on the age
range of approximately 15 years in appropriate to PISA standard. The age of the sample in PISA was
in the range of 15 years and 3 months to 16 years and 2 months as from the translation of technical

Wulandari & Jailani, Mathematics skill of fifteen years old students in Yogyakarta … 133
students aged less than 15 years (OECD, 2014). Similarly, for the OECD countries that most of the
students who was 15 years old was in 9th and 10
th grade (Bloem, 2013). Table 2 details the
composition of the sample used in this problem like PISA study.
Table 2. Composition of sample used in problem like PISA study
Grade Number of Students
Sum Age
Male Female Min Max
9 77 123 200 15 16.2
5
10 82 118 200 15 16.2
5
Sum 159 241 400
Data collection techniques used in this study was a test. The number of item in problem like
PISA was 30 with the limited time 80 minutes. The allocation of time to solve problem like PISA was
80 minutes for 30 questions which means the average time used to solve each problem was 2,67
minutes, while the allocation of time in PISA 2012 test was 30 minutes for each booklet (OECD,
2013). For each math problem booklet consisting of 12-13 items, which means the average time used
to solve each problem was in range 2.31 to 2.5 minutes (OECD, 2014).
Descriptive statistics used was standard deviation, maximum and minimum score. Then, data
were grouped according to school level (high, average, and low) and further classified based on each
domain according to the standard of PISA. In this study, data was tabulated by calculating the
percentage of correct answer for each item. Then, the quantitative data such as the mean scores
converted into the category of the students’ skill with normative standard deviation adapted of Ebel
and Frisbie (1991) can be seen in Table 3.
Table 3. Criteria score ability mathematical problem solving model students in PISA
Interval of Score Criterion
i i i iM 1,5Sd X M 3Sd Very High
i i i iM 0,5Sd X M 1,5Sd High
i i i iM 0,5Sd X M 0,5Sd Average
i i i iM 1,5Sd X M 0,5Sd Low
i i i iM 3Sd X M 1,5Sd Very Low
Statistical test used was t-test. Skewness test was used to know the normality. Myers & Well
(2003) stated that the alternative test for normality with a large sample can use statistical skewness
134 Journal on Mathematics Education, Volume 9, No. 1, January 2018, pp. 129-144
and kurtosis. Similarly, Kim (2013) stated that the formal normality test using Shapiro-Wilk and
Kolmogorov-Smirnov test may be used for a small sample size to moderate (n <300) because it will
be more sensitive and unreliable for a large sample size. Therefore, the alternative test was a statistical
skewness or kurtosis.
In the skewness test, data has normal distribution if the skewness value divided by standard
deviation or z-values in range -2.5 to 2.5. However, for a large sample size will tend to be not normal,
so the skewness value is in the range -1 and 1 as the alternative reference (Leech, Barrett & Morgan,
2005). Beside of that, Kim (2013) proposed that for a large sample size over 300 respondents, the
normality test depends on the absolute value of skewness and kurtosis without considering the z-
values. However, different reference from Kim (2013), data has normal distribution if the statistical
value of skewness was in range of 2 or -2 or data was not normal if the absolute value of skew was
more than 2 or the absolute value of kurtosis more than 7.
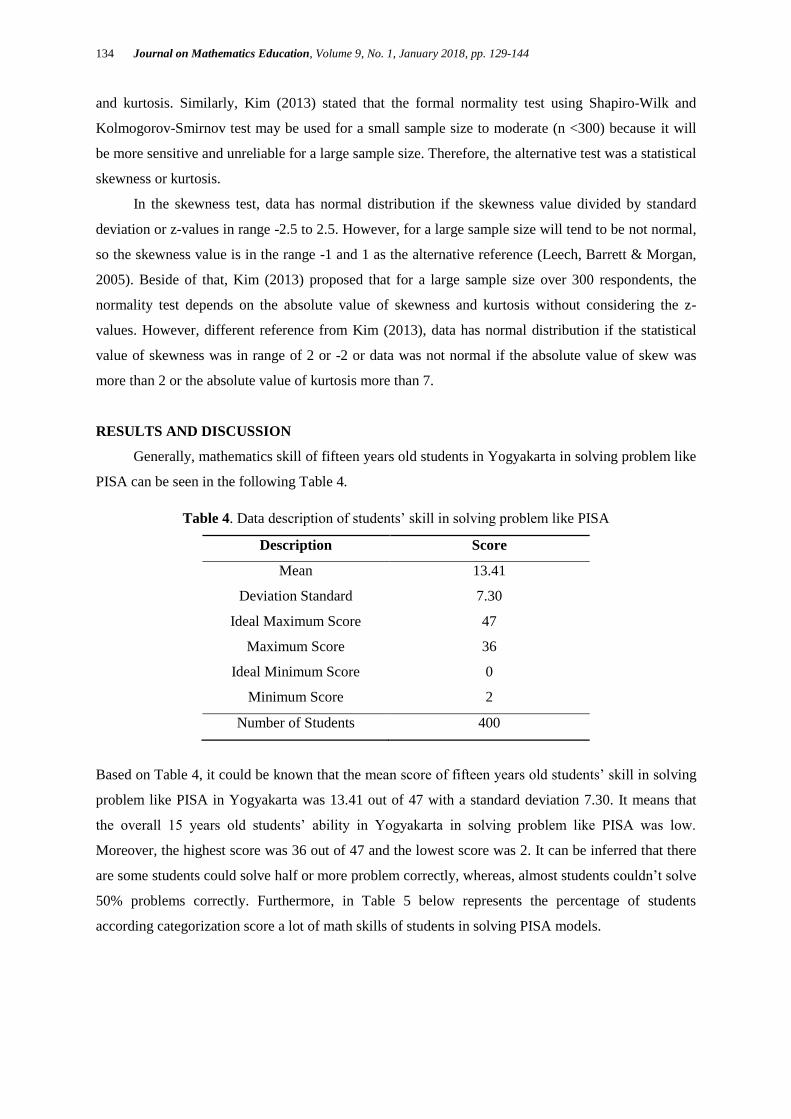
RESULTS AND DISCUSSION
Generally, mathematics skill of fifteen years old students in Yogyakarta in solving problem like
PISA can be seen in the following Table 4.
Table 4. Data description of students’ skill in solving problem like PISA
Description Score
Mean 13.41
Deviation Standard 7.30
Ideal Maximum Score 47
Maximum Score 36
Ideal Minimum Score 0
Minimum Score 2
Number of Students 400
Based on Table 4, it could be known that the mean score of fifteen years old students’ skill in solving
problem like PISA in Yogyakarta was 13.41 out of 47 with a standard deviation 7.30. It means that
the overall 15 years old students’ ability in Yogyakarta in solving problem like PISA was low.
Moreover, the highest score was 36 out of 47 and the lowest score was 2. It can be inferred that there
are some students could solve half or more problem correctly, whereas, almost students couldn’t solve
50% problems correctly. Furthermore, in Table 5 below represents the percentage of students
according categorization score a lot of math skills of students in solving PISA models.

Wulandari & Jailani, Mathematics skill of fifteen years old students in Yogyakarta … 135
Table 5. Classification of number of students in a solving problem like PISA
Score (X) Criteria f %
35,245 X 47 Very High 1 0%
27,415 X 35,245 High 14 4%
19,585 X 27,415 Average 75 19%
11,755 X 19,585 Low 119 30%
0 X 11,755 Very Low 191 48%
Table 5 showed that only 1 out of 400 students or almost 0% of students was in very high
category, 4% of students was in high category, 19% of students was in average category, 30% of
students was in low category, and 48% of students was in very low category. Further description of
the average of mathematical skills of 15 years old students in Yogyakarta in solving problem like
PISA for each domain was in Table 6.
Table 6. Category of students’ skill in solving problem like PISA for each domain
Domain Sub Domain Average Max.
Score Category
Content
Quantity 3.42 11 Low
Change and Relationship 2.24 9 Very Low
Space and Shape 2.18 10 Very Low
Uncertainty and data 5.57 17 Low
Process
Formulate 3.31 11 Low
Employ 7.75 17 Average
Interpret 2.34 19 Very Low
Context
Personal 3.11 15 Very Low
Occupational 3.52 9 Low
Societal 5.52 15 Low
Scientific 1.25 8 Very Low
Achievement Level
Level 1 4.54 6 High
Level 2 3.04 6 Average
Level 3 4.00 12 Low
Level 4 0.94 8 Very Low
Level 5 0.60 7 Very Low
Level 6 0.29 8 Very Low

136 Journal on Mathematics Education, Volume 9, No. 1, January 2018, pp. 129-144
Data submitted were described by each domain and category of school. Then, the explanation of
percentage correct answer based on difficulty level can be seen in Figure 1.
Figure 1. Percentage of correct answers based on level of problem like PISA
Based on Figure 1, the percentage of correct answer for level 1 problem was 76%, while for
level 2 was 51% and for level 3 was 33%. In addition, the percentage of correct answer for level 4 was
12%, for level 5 was 8% and for level 6 was 4%. Problem level 1 was the easiest one, while problem
level 6 was the most difficult one because problem 4, 5, and 6 require reasoning skill. For the higher
difficulty level, just fewer students were able to solve the problems properly. It means that fifteen
years old students in Yogyakarta still weak on reasoning skill. Students just familiar with routine
problem such as in problem level 1 until 3 without need reasoning competence. Then, in Figure 2
below, the result of this study compared to each category school.
Figure 2. Percentage of correct answers based on level of problem for each school’s level
Seen from Figure 2, students in high category school did better than average and low category
in solving problem like PISA. It means that mathematics skill of fifteen years old students in line with
school category. It can be seen from Figure 2 that overall skill students in Yogyakarta similar to

Wulandari & Jailani, Mathematics skill of fifteen years old students in Yogyakarta … 137
students in average school. Moreover, the result of this study compared to Indonesian students skill
and OECD average in PISA 2012 that can be seen in Figure 3.
Figure 3. Percentage of the number of students in solving problem like PISA
Viewed from the number of students could solve problem like PISA and compared to
Indonesian students and OECD average in PISA 2012, based on Figure 3 above, mathematics skill of
students in Yogyakarta in solving problem like PISA was higher than Indonesian students in PISA
2012. While, it was lower than OECD average in PISA 2012. Percentage of the number of students in
Yogyakarta who are able to solve problem like PISA from level 1 to level 6 was still below the OECD
average. Its results appropriate to previous research from Ariyadi Wijaya, Van den Heuvel-Panhuizen,
Doorman, dan Robitzsch (Wijaya, et al., 2014) that reveals students’ achievement in Yogyakarta in
CoMTI test show better performance than Indonesian students in PISA test 2003. Therefore, students
in Yogyakarta which have better performance in national exam also showed their better achievement
than Indonesian students at all. Then, the result viewed from domain of content of PISA test such as
international report. Therefore, in Figure 4, it will be explained.
Figure 4. Percentage of correct answer based on content domain
138 Journal on Mathematics Education, Volume 9, No. 1, January 2018, pp. 129-144
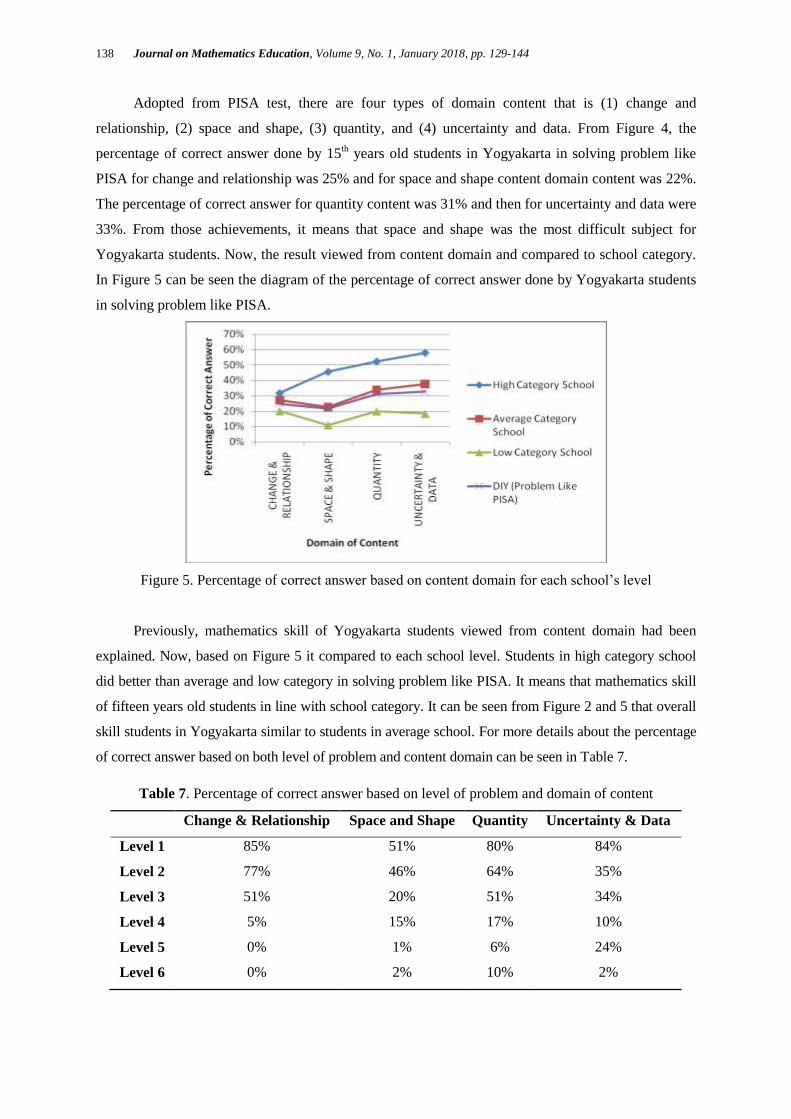
Adopted from PISA test, there are four types of domain content that is (1) change and
relationship, (2) space and shape, (3) quantity, and (4) uncertainty and data. From Figure 4, the
percentage of correct answer done by 15th years old students in Yogyakarta in solving problem like
PISA for change and relationship was 25% and for space and shape content domain content was 22%.
The percentage of correct answer for quantity content was 31% and then for uncertainty and data were
33%. From those achievements, it means that space and shape was the most difficult subject for
Yogyakarta students. Now, the result viewed from content domain and compared to school category.
In Figure 5 can be seen the diagram of the percentage of correct answer done by Yogyakarta students
in solving problem like PISA.
Figure 5. Percentage of correct answer based on content domain for each school’s level
Previously, mathematics skill of Yogyakarta students viewed from content domain had been
explained. Now, based on Figure 5 it compared to each school level. Students in high category school
did better than average and low category in solving problem like PISA. It means that mathematics skill
of fifteen years old students in line with school category. It can be seen from Figure 2 and 5 that overall
skill students in Yogyakarta similar to students in average school. For more details about the percentage
of correct answer based on both level of problem and content domain can be seen in Table 7.
Table 7. Percentage of correct answer based on level of problem and domain of content
Change & Relationship Space and Shape Quantity Uncertainty & Data
Level 1 85% 51% 80% 84%
Level 2 77% 46% 64% 35%
Level 3 51% 20% 51% 34%
Level 4 5% 15% 17% 10%
Level 5 0% 1% 6% 24%
Level 6 0% 2% 10% 2%

Wulandari & Jailani, Mathematics skill of fifteen years old students in Yogyakarta … 139
Table 7 explained that 15th years old students in Yogyakarta was still weak in solving reasoning
problem in level 4 to 6 for all of domain of content. Almost all students could answer problem in level
1 to 3. From Table 7, change and relationship became the most difficult content in problem like PISA.
Then, this study results were described by domain process and context. Figure 6 showed the
percentage of correct answer in solving problem like PISA viewed from domain of process.
Figure 6. Percentage of Correct Answer Based on Domain of Process
There are three process assessed in PISA, so, in this study adopted it. First, formulating mathematical
situations, then employing which using concepts, facts, procedures, and mathematical reasoning, and the last
interpreting, implementing, and evaluating the results of mathematics. According to Figure 6 above, the
percentage of correct answer for formulating process was 30% and employing process was 46%, then for
interpreting process was 12%. Beside of that, mathematics skill of 15th years old students in Yogyakarta for
formulating process was in low category with an average score 3.31 out of a maximum score of 11, while for
employing process was in medium category with an average score 7.75 out of 17 and for interpreting process
was in very low category with an average 2.34 out of 19.
Figure 7. Percentage of correct answer based on domain of process for each schools level
Based on Figure 7 students in high category school did better than average and low category in
solving problem like PISA. It means that mathematics skill of fifteen years old students in line with

140 Journal on Mathematics Education, Volume 9, No. 1, January 2018, pp. 129-144
school category. It can be seen from Figure 2, 5 and 7 that overall skill students in Yogyakarta similar
to students in average school. From those sub domains, interpreting process was being the most
difficult for students in all school level. Problem requiring employing process was the easiest one.
Other than two domains explained previously, further description of students' skill in solving
mathematics problem like PISA viewed from domain context was in the Figure 8.
Figure 8. Percentage of correct answer based on domain of context
There are four context used in PISA test, that is personal, occupational, societal, and scientific
context. Based on Figure 8, students had many errors when solving problem with scientific context.
Precisely, students got good achievement when solving problem with occupational context. It
happened because its context was around students’ life. Students’ skill in solving problem whose
personal and scientific context belongs to very low category. It could be because they had mean 3.11
out of 15 and 1.25 out of 8 successively. While for occupational and societal context included low
category with mean 3.52 out of 9 and 5.52 out of 15 respectively. After all, this result compared for
school level which explicit in this following figure.
Figure 9. Percentage of correct answer based on domain of context for each school level
Based on Figure 9, problem using occupational context became the easiest one for both high
and average school level, but not for low school level. Low school students got the most error when

Wulandari & Jailani, Mathematics skill of fifteen years old students in Yogyakarta … 141
solving societal problem. Then, seen from domain of context, mathematics skill of 15th years old
Yogyakarta students closed to students in average school level. After all, this study result also found
out which students’ answer belong to full credit, partial credit, no credit or missing answer based on
quantitative data analysis. Figure 10 below described the percentage of the number of students who
had full credit, partial credit, no credit or missing answer in solving problem like PISA.
Figure 10. Percentage of students answer type in solving problem like PISA
According to Figure 10, the number of students whose full credit answer was 33%, while
whose partial credit answer was 4%. Then, the number of students had wrong answers or no credit
was 19% and with missing answer was 44%. The reason why almost half students had missing answer
was they couldn’t solve their problem and they skipped due to insufficient time. Furthermore, in
Figure 11 can be known how students’ answer in solving problem level 1 to level 6.
Figure 11. Percentage of students answer type in solving problem like PISA for each level
From Figure 11, almost all students had full credit answer for problem level 1 and just a few of
students had no credit and missing answer. In line with the difficulty level, more difficult the problem,

142 Journal on Mathematics Education, Volume 9, No. 1, January 2018, pp. 129-144
less students could get full credit answer. Contrary to it, almost half and more students had missing
answer for problem level 4, 5, and 6. Not only that, but also almost no students whose full credit
answer for reasoning problem level 6. It showed that the majority of students didn’t finish problem
level 4, 5, and 6 because of lack of time or they couldn’t answer properly because they are too
complicated and difficult.
Students’ mathematics skill level was linear with the school level. High school level showed
better skill than average and low school level. This result in line with the study results from
Rumasoreng & Sugiman (2014, p. 32) that the students’ difficulties in solving problem like national
exam (UN) was linear to the school level. Low level schools had highest difficulties and average level
school had moderate difficulties, then high level school had lowest difficulty. Those encouraged this
study result.
CONCLUSION
Mathematics skills of 15th years old students in Yogyakarta in solving problem like PISA was
better than Indonesian students in PISA 2012, but it was still included in low category. Mathematics
skill for quantity, uncertainty and data sub domain of content were in low category, while for change
and relationship, space and shape content included very low category. Mathematics skill for
formulating process was in low category, for employing process was in average category, and for
interpreting process was in very low category. Based on these results further research was needed to
find the reason why students had low skill in solving problem like PISA or similar research for other
region. In addition, from this study result students should improve their mathematics skill to formulate
mathematical situations, solve reasoning problem, interpret and evaluate arguments.
REFERENCES
Alexander, R. (2013). How accurate is the PISA test? BBC News Magazine December 10th, 2013.
Accessed from: http://www.bbc.com/news/magazine-25299445 on September 21st, 2014.
Arıkan, S. (2015). Construct validity of TIMSS 2011 mathematics cognitive domains for Turkish
students. International Online Journal of Educational Sciences, 7(1), 29-44.
Bloem, S. (2013). PISA in low and middle income countries. OECD Education Working Papers, No.
93, OECD Publishing.
Dolinar, G. (2014). International Mathematics Olympiad (IMO 2014): Indonesia Team Results.
Accessed from: http://www.imo-official.org/country_team_r.aspx?code=IDN&column=year&order=desc on
September 15th, 2014.
Ebel, R. L. & Frisbie, D. A. (1991). Essentials of educational measurement (5th ed). Englewood
Cliffs, NJ: Prentice-Hall, Inc.
Eklöf, H., Pavešič, B. J., & Grønmo, L. S. (2014). A Cross-National Comparison of Reported Effort
and Mathematics Performance in TIMSS Advanced. Applied Measurement in Education, 27(1),
31-45.

Wulandari & Jailani, Mathematics skill of fifteen years old students in Yogyakarta … 143
Kamaliyah, Zulkardi, & Darmawijoyo. (2013). Developing the sixth level of PISA-like mathematics
problems for secondary school students. Journal on Mathematics Education, 4(1), 9-28.
Ker, H. W. (2013). Trend analysis on mathematics achievements: a comparative study using TIMSS
data. Universal Journal of Educational Research, 1(3), 200-203.
Kiel, T. E., Bielefeld, E. W., & Bielefeld, T. M. (2005). Comparing adult mathematical literacy with
PISA students: results of pilot study. ZDM, 37(3).
Kilpatrick, J. & Swafford, J. (2002). Helping children learn mathematics. Washington, Maryland:
National Academy Press.
Kim, H. Y. (2013). Statistical notes for clinical researchers: assessing normal distribution (2) using
skewness and kurtosis. Restorative dentistry & endodontics, 38(1), 52-54.
Krejcie, R. V. & Morgan, D. W. (1970). Determining sample size for research activities. Educational
and psychological measurement, 30, 607-610.
Leech, N. L., Barrett, K. C. & Morgan, G. A. (2005). SPSS for intermediate statistics: use and
interpretation (2nd
ed). Mahwah, NJ: LEA (Lawrence Erlbaum Associates Publishers).
Lessani, A., Yunus, A. S. Md., Tarmiz, R. A. & Mahmud, R. (2014). Effects of Malaysian Secondary
Schools Mathematics Teachers’ Familiarity with TIMSS on Students’ Achievement in
Mathematics. International Journal of Education and Research, 2(8), 99-110.
Lutfianto, M., Zulkardi, & Hartono, Y. (2013). Unfinished student answer in PISA mathematics
contextual problem. Journal on Mathematics Education, 4(2), 188-193.
Myers, J. L. & Well, A. D. (2003). Research design and statistical analysis (2nd
ed). Mahwah, NJ:
LEA (Lawrence Erlbaum Associates Publishers).
Novita, R., Zulkardi, & Hartono, Y. (2012). Exploring primary student’s problem-solving ability by
doing tasks like PISA’s question. Journal on Mathematics Education, 3(2), 133-150.
OECD. (2013). PISA 2012 Assessment and analytical framework: mathematics, reading, science,
problem solving and financial literacy. Paris. OECD Publishing.
OECD. (2014). PISA 2012 results: what students know and can do - student performance in
mathematics, reading and science (Volume 1, Revised Edition, February 2014). Paris: OECD
Publishing.
Puspendik. (2014). Laporan hasil ujian nasional SMP/MTs tahun pelajaran 2013-2014. Jakarta:
BSNP.
Rumasoreng, M., & Sugiman, S. (2014). Analisis kesulitan matematika siswa SMA/MA dalam
menyelesaikan soal setara UN di kabupaten maluku tengah. Jurnal Riset Pendidikan
Matematika, 1(1), 22-34.
Schleicher, A. (2007). Can competencies assessed by PISA be considered the fundamental school
knowledge 15-year-olds should possess?. Journal of Educational Change, 8, 349-357.
Slavin, R. E. (2006). Educational psychology: theory and practice (8th ed). Boston: Allyn and Bacon,
Pearson Education, Inc.
Stacey, K. (2012). The international assessment of mathematical literacy: PISA 2012 frameworks and
items. 12 th International Congress on Mathematical Education, on July 8th – 15
th, 2012 in
COEX, Seoul, Korea.

144 Journal on Mathematics Education, Volume 9, No. 1, January 2018, pp. 129-144
Stephen, M. (2013). PISA: Poor academic standards and an even poorer test. Accessed from
http://www.telegraph.co.uk/education/10488665/PISA-Poor-academic-standards-and-an-even-
poorer-test.html on September 21st, 2014.
Wijaya, A., Van den Heuvel-Panhuizen, M., Doorman, M. & Robitzsch, A. (2014). Difficulties in
solving context-based PISA mathematics tasks: An analysis of students’ error. The
Mathematics Enthusiast, 11(3), 555-584.
Wu, M. (2010). Comparing the similarities and differences of PISA 2003 and TIMSS. OECD
Education Working Papers, No. 32, OECD Publishing, Proquest Education Journals. Accessed
from search.proquest.com/docview/872082780?accountid=31324 on September 23rd
, 2014.
Wu, M. (2011). Using PISA and TIMSS mathematics assessments to identify the relative strengths of
students in western and Asian countries. Journal of Research in Education Sciences, 56(1), 67-
89.
Wuttke, J. (2007). Uncertainties and bias in PISA. PISA According to PISA: Does PISA Keep What It
Promises. pp 1-3. Editor: S. T. Hopmann, G. Brinek, & M. Retzl. Wien: Lit-Verlag. Accessed
from http://papers.ssrn.com/sol3/papers.cfm?abstract_id=1159042 on September 21st, 2014.
Yore, L. D., Anderson, J. O., & Hung Chiu, M. (2010). Moving PISA results into the policy arena:
perspectives on knowledge transfer for future considerations and preparations. International
Journal of Science and Mathematics Education, 8, 593-609.