Embed Size (px)
Citation preview

1 | P a g e
MATHEMATICS
Business Math: Unit 2
Overview of Math Proficiencies
2 | P a g e
Course Philosophy/Description
Business Mathematics is an elective Mathematics course of which students learn to use mathematics effectively as a tool in their
personal and business lives. After students have completed this course, they will be able to apply mathematical concepts in
various personal and business situations. All standards are aligned to New Jersey Student Learning Standards of Mathematics
and the New Jersey Personal Financial Literacy Standards.
Students will review and apply mathematical concepts that they learned in four of the conceptual categories, namely Number
and Quantity, Algebra, Functions, and Statistics and Probability. They will understand terminology relating to personal and
business mathematics applications and apply basic math skills to the solution of both personal and business applications. They
will use common mathematical formulas to solve a variety of personal and business mathematics as well as apply knowledge of
computer and calculator use. Students will also learn strategies for critical thinking and problem solving both in finance and
business ethics.

3 | P a g e
Pacing Chart – Unit 2
# Student Learning Objective: Number and Quantity NJSLS
Marking Period 2
1 Solve multi-step contextual problems, about numbers and number systems.
Develop descriptive models by defining appropriate quantities.
N.Q.A.1
N.Q.A.2
N.Q.A.3
2 Apply properties of rational and irrational numbers to identify rational and
irrational numbers and perform arithmetic operations on them. Construct chains
of reasoning that will justify or refute propositions or conjectures about
numbers or number systems.
N.RN.A.1
N.RN.B.3 N.RN.A.2. N-RN-B-1
3 Create linear equations and inequalities in one variable and use them in contextual
situations to solve single or multistep problems. Create linear and quadratic
equations and inequalities in two variables and graph them. Solve systems of
linear equations or inequalities in two variables algebraically and graphically.
A.REI.B.3 A.REI.A.1 A.CED.A.4 A.SSE.A.1 A.CED.A.1 A.REI.C.6.
A.REI.C.5 A.CED.A.3 A.REI.D.12
A.REI.D.10
N.Q.A.1 A.CED.A.2 A.REI.B.4. A.SSE.B.3
4 Construct chains of reasoning that will justify or refute proposition or
conjectures about algebraic equations or systems. .
A.REI.D.11. A.REI.B.4 A.CED.A.1. A.APR.A.1 A.SSE.B.3 A.SSE.A.2.
4 | P a g e
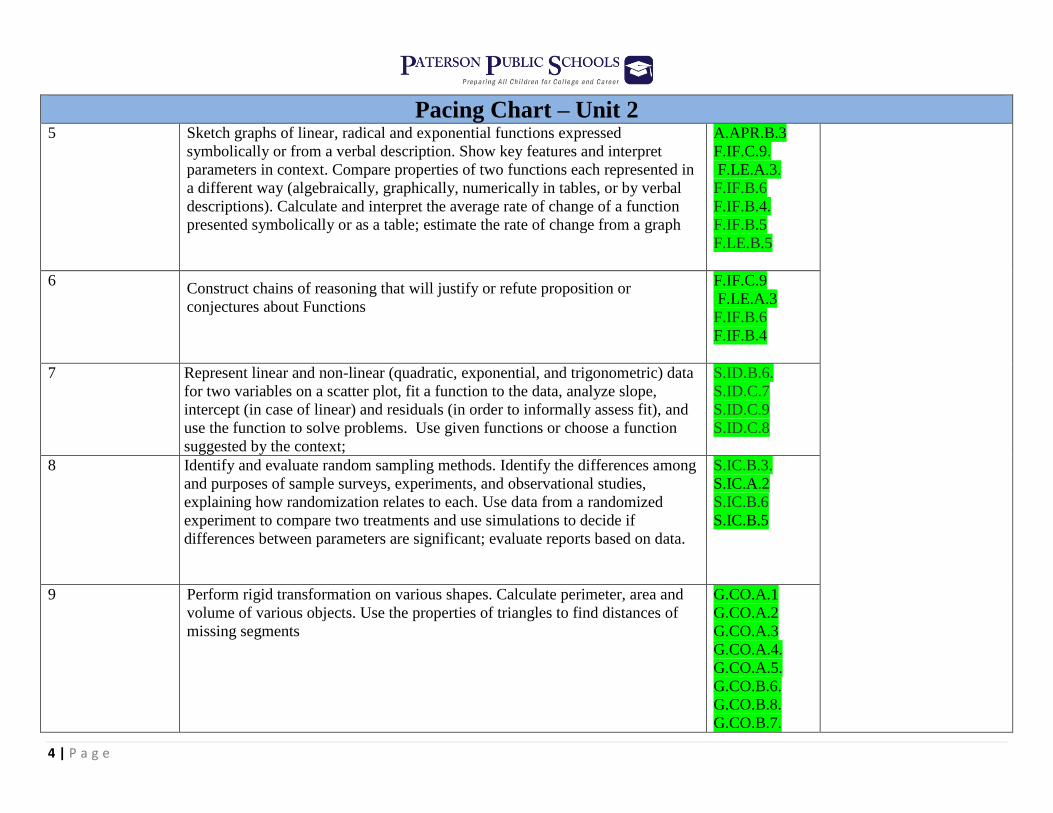
Pacing Chart – Unit 2 5 Sketch graphs of linear, radical and exponential functions expressed
symbolically or from a verbal description. Show key features and interpret
parameters in context. Compare properties of two functions each represented in
a different way (algebraically, graphically, numerically in tables, or by verbal
descriptions). Calculate and interpret the average rate of change of a function
presented symbolically or as a table; estimate the rate of change from a graph
A.APR.B.3 F.IF.C.9. F.LE.A.3.
F.IF.B.6 F.IF.B.4.
F.IF.B.5 F.LE.B.5
6 Construct chains of reasoning that will justify or refute proposition or
conjectures about Functions
F.IF.C.9
F.LE.A.3 F.IF.B.6
F.IF.B.4
7 Represent linear and non-linear (quadratic, exponential, and trigonometric) data
for two variables on a scatter plot, fit a function to the data, analyze slope,
intercept (in case of linear) and residuals (in order to informally assess fit), and
use the function to solve problems. Use given functions or choose a function
suggested by the context;
S.ID.B.6. S.ID.C.7
S.ID.C.9 S.ID.C.8
8 Identify and evaluate random sampling methods. Identify the differences among
and purposes of sample surveys, experiments, and observational studies,
explaining how randomization relates to each. Use data from a randomized
experiment to compare two treatments and use simulations to decide if
differences between parameters are significant; evaluate reports based on data.
S.IC.B.3. S.IC.A.2
S.IC.B.6
S.IC.B.5
9 Perform rigid transformation on various shapes. Calculate perimeter, area and
volume of various objects. Use the properties of triangles to find distances of
missing segments
G.CO.A.1
G.CO.A.2
G.CO.A.3 G.CO.A.4. G.CO.A.5. G.CO.B.6. G.CO.B.8. G.CO.B.7.
5 | P a g e
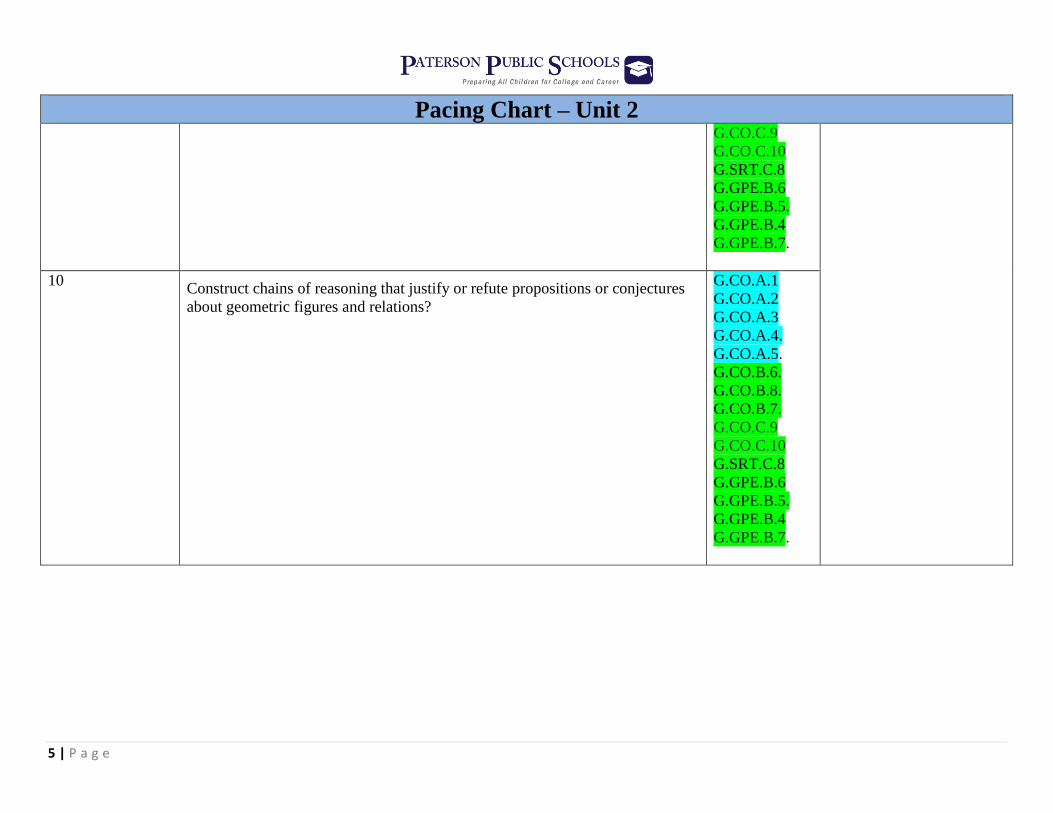
Pacing Chart – Unit 2 G.CO.C.9 G.CO.C.10 G.SRT.C.8
G.GPE.B.6 G.GPE.B.5.
G.GPE.B.4 G.GPE.B.7.
10 Construct chains of reasoning that justify or refute propositions or conjectures
about geometric figures and relations?
G.CO.A.1
G.CO.A.2 G.CO.A.3
G.CO.A.4. G.CO.A.5. G.CO.B.6.
G.CO.B.8. G.CO.B.7.
G.CO.C.9
G.CO.C.10
G.SRT.C.8 G.GPE.B.6
G.GPE.B.5. G.GPE.B.4 G.GPE.B.7.
6 | P a g e
Research about Teaching and Learning Mathematics Structure teaching of mathematical concepts and skills around problems to be solved (Checkly, 1997; Wood & Sellars, 1996; Wood & Sellars, 1997)
Encourage students to work cooperatively with others (Johnson & Johnson, 1975; Davidson, 1990)
Use group problem-solving to stimulate students to apply their mathematical thinking skills (Artzt & Armour-Thomas, 1992)
Students interact in ways that support and challenge one another’s strategic thinking (Artzt, Armour-Thomas, & Curcio, 2008)
Activities structured in ways allowing students to explore, explain, extend, and evaluate their progress (National Research Council, 1999)
There are three critical components to effective mathematics instruction (Shellard & Moyer, 2002):
Teaching for conceptual understanding
Developing children’s procedural literacy
Promoting strategic competence through meaningful problem-solving investigations
Teachers should be:
Demonstrating acceptance and recognition of students’ divergent ideas.
Challenging students to think deeply about the problems they are solving, extending thinking beyond the solutions and algorithms
required to solve the problem
Influencing learning by asking challenging and interesting questions to accelerate students’ innate inquisitiveness and foster them to
examine concepts further.
Projecting a positive attitude about mathematics and about students’ ability to “do” mathematics
Students should be:
Actively engaging in “doing” mathematics
Solving challenging problems
Investigating meaningful real-world problems
Making interdisciplinary connections
Developing an understanding of mathematical knowledge required to “do” mathematics and connect the language of mathematical
ideas with numerical representations
Sharing mathematical ideas, discussing mathematics with one another, refining and critiquing each other’s ideas and understandings
Communicating in pairs, small group, or whole group presentations
Using multiple representations to communicate mathematical ideas
Using connections between pictures, oral language, written symbols, manipulative models, and real-world situations
Using technological resources and other 21st century skills to support and enhance mathematical understanding
7 | P a g e
Mathematics is not a stagnate field of textbook problems; rather, it is a dynamic way of constructing meaning about the world around
us, generating knowledge and understanding about the real world every day. Students should be metaphorically rolling up their
sleeves and “doing mathematics” themselves, not watching others do mathematics for them or in front of them. (Protheroe, 2007)
Conceptual-Based Model
The purpose of the Conceptual-Based Model is to allow students the time to explore mathematical concepts to promote academic rigor and high level
of student discourse to concurrently develop conceptual understanding, procedural fluency, and problem-solving skills. During the Mathematics
block of instruction, teachers will select and set up a mathematical task that targets the mathematical goal(s) for the lesson. The teacher sets the stage
for learning by ensuring the objective/rationale of the lesson is well-defined and connected to the task. The task should build on student’s prior
knowledge, life experiences, and culture allowing students to share their prior knowledge and life/cultural experiences as it relates to the task to
ensure that students understand the context of the problem. The instructional goal is to introduce the activity/task to the students allowing them to
have access to learning while maintaining the cognitive demands of the task. Teachers will then support the students’ exploration of the task; this can
be done independently, in pairs or in small groups or a combination of all. It is highly recommended that students be given the opportunity to
privately work on a task to generate solutions on their own. Students are encouraged to share their findings with their peers in small group to
compare their solutions. As students are actively engaged in constructing meaning of the mathematical concept(s) being taught and communicating
their understanding of the concept(s) with their peers, the teacher monitors the development of student understanding by observing student thinking
and using questions to stimulate thinking to drive students toward the aimed mathematical goal(s). The teacher assesses students’ understanding of
key mathematical ideas, problem-solving strategies, and the use of and connection between models and representations to determine what the student
knows. The teacher advances the students’ understanding to move the student beyond their present thinking and expand what they know to an
additional situation. Teachers have been trained to strategically select groups of students who have different solution paths to the same task, different
representations and errors/misconceptions to share, discuss, and analyze as a whole group. By providing these instructional opportunities, the teacher
will then be able to orchestrate the class discussion by providing students with the opportunities to make their learning public as students share,
discuss, analyze, clarify, extend, connect, strengthen, and record their thinking strategies. After students discuss, justify, and challenge the various
solution paths that were shared, a summary of the learning is articulated and connected to the objective of the lesson. Students should be given an
opportunity to close the lesson with a reflection on their learning.
8 | P a g e
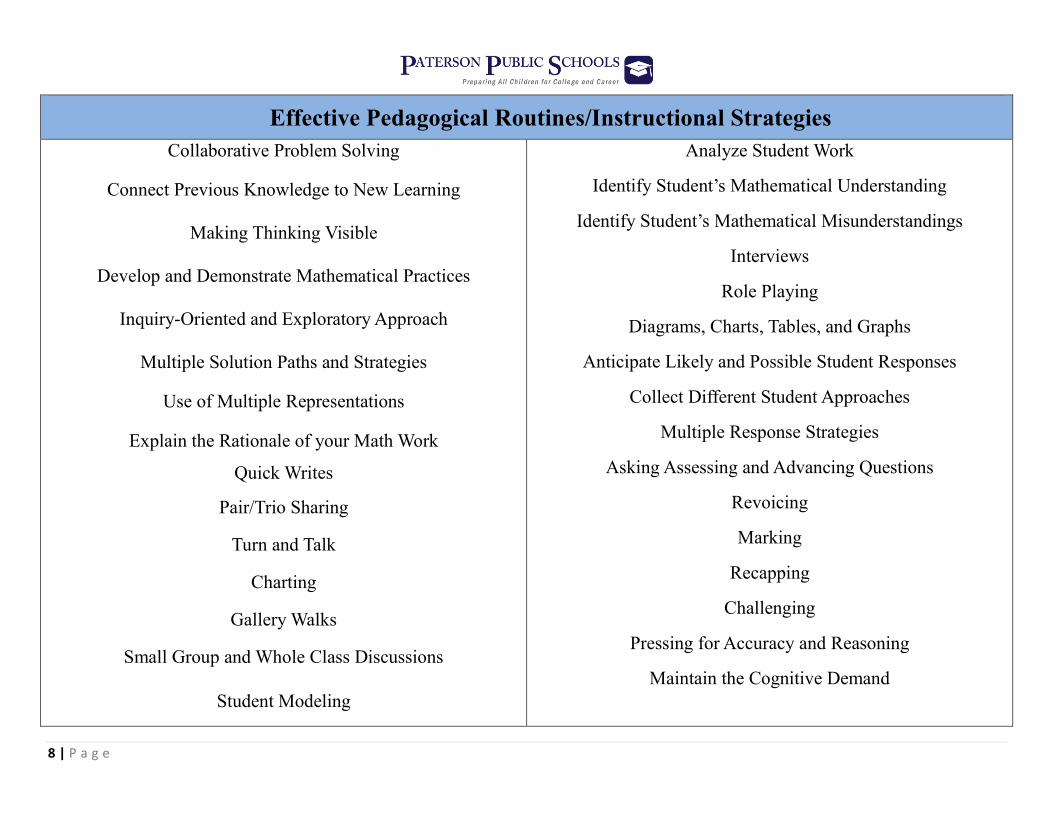
Effective Pedagogical Routines/Instructional Strategies
Collaborative Problem Solving
Connect Previous Knowledge to New Learning
Making Thinking Visible
Develop and Demonstrate Mathematical Practices
Inquiry-Oriented and Exploratory Approach
Multiple Solution Paths and Strategies
Use of Multiple Representations
Explain the Rationale of your Math Work
Quick Writes
Pair/Trio Sharing
Turn and Talk
Charting
Gallery Walks
Small Group and Whole Class Discussions
Student Modeling
Analyze Student Work
Identify Student’s Mathematical Understanding
Identify Student’s Mathematical Misunderstandings
Interviews
Role Playing
Diagrams, Charts, Tables, and Graphs
Anticipate Likely and Possible Student Responses
Collect Different Student Approaches
Multiple Response Strategies
Asking Assessing and Advancing Questions
Revoicing
Marking
Recapping
Challenging
Pressing for Accuracy and Reasoning
Maintain the Cognitive Demand
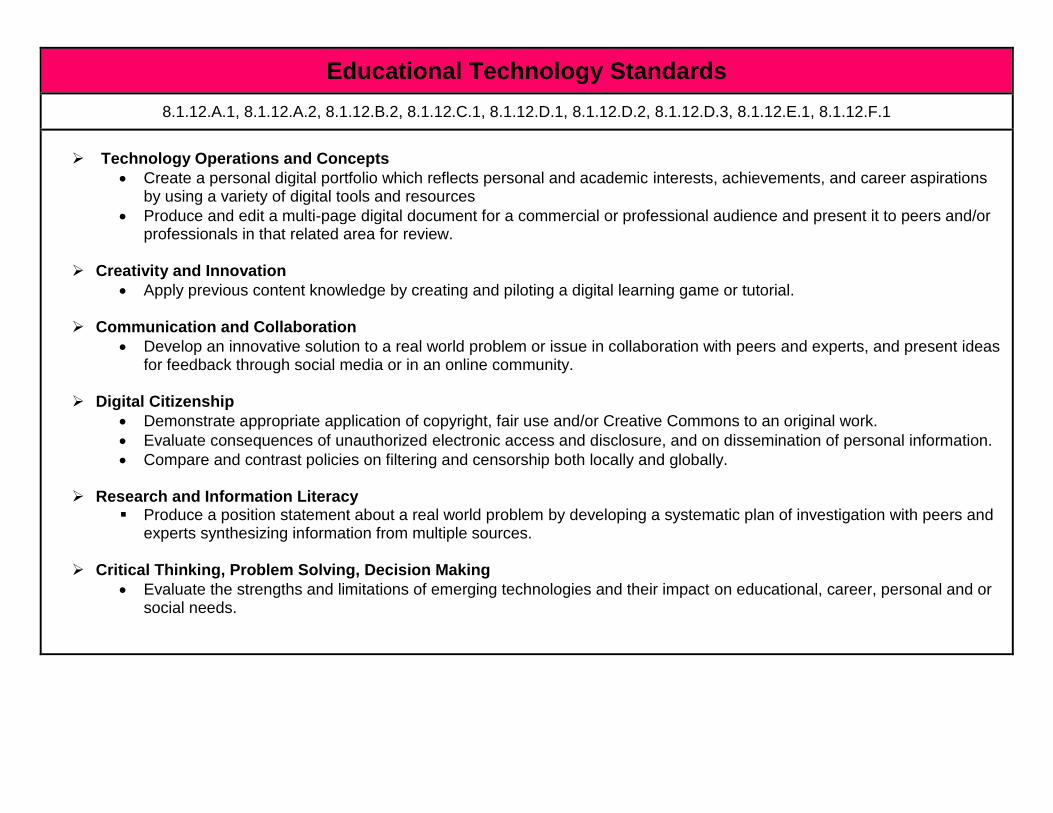
Educational Technology Standards
8.1.12.A.1, 8.1.12.A.2, 8.1.12.B.2, 8.1.12.C.1, 8.1.12.D.1, 8.1.12.D.2, 8.1.12.D.3, 8.1.12.E.1, 8.1.12.F.1
Technology Operations and Concepts
Create a personal digital portfolio which reflects personal and academic interests, achievements, and career aspirations by using a variety of digital tools and resources
Produce and edit a multi-page digital document for a commercial or professional audience and present it to peers and/or professionals in that related area for review.
Creativity and Innovation
Apply previous content knowledge by creating and piloting a digital learning game or tutorial.
Communication and Collaboration
Develop an innovative solution to a real world problem or issue in collaboration with peers and experts, and present ideas for feedback through social media or in an online community.
Digital Citizenship
Demonstrate appropriate application of copyright, fair use and/or Creative Commons to an original work.
Evaluate consequences of unauthorized electronic access and disclosure, and on dissemination of personal information.
Compare and contrast policies on filtering and censorship both locally and globally.
Research and Information Literacy Produce a position statement about a real world problem by developing a systematic plan of investigation with peers and
experts synthesizing information from multiple sources.
Critical Thinking, Problem Solving, Decision Making
Evaluate the strengths and limitations of emerging technologies and their impact on educational, career, personal and or social needs.
10 | P a g e
Career Ready Practices
Career Ready Practices describe the career-ready skills that all educators in all content areas should seek to develop in their students. They are
practices that have been linked to increase college, career, and life success. Career Ready Practices should be taught and reinforced in all career
exploration and preparation programs with increasingly higher levels of complexity and expectation as a student advances through a program of
study.
CRP1. Act as a responsible and contributing citizen and employee
Career-ready individuals understand the obligations and responsibilities of being a member of a community, and they demonstrate this understanding
every day through their interactions with others. They are conscientious of the impacts of their decisions on others and the environment around them. They
think about the near-term and long-term consequences of their actions and seek to act in ways that contribute to the betterment of their teams, families,
community and workplace. They are reliable and consistent in going beyond the minimum expectation and in participating in activities that serve the
greater good.
CRP2. Apply appropriate academic and technical skills.
Career-ready individuals readily access and use the knowledge and skills acquired through experience and education to be more productive. They make
connections between abstract concepts with real-world applications, and they make correct insights about when it is appropriate to apply the use of an
academic skill in a workplace situation
CRP4. Communicate clearly and effectively and with reason.
Career-ready individuals communicate thoughts, ideas, and action plans with clarity, whether using written, verbal, and/or visual methods. They
communicate in the workplace with clarity and purpose to make maximum use of their own and others’ time. They are excellent writers; they master
conventions, word choice, and organization, and use effective tone and presentation skills to articulate ideas. They are skilled at interacting with others;
they are active listeners and speak clearly and with purpose. Career-ready individuals think about the audience for their communication and prepare
accordingly to ensure the desired outcome.
CRP6. Demonstrate creativity and innovation.
Career-ready individuals regularly think of ideas that solve problems in new and different ways, and they contribute those ideas in a useful and productive
manner to improve their organization. They can consider unconventional ideas and suggestions as solutions to issues, tasks or problems, and they discern
which ideas and suggestions will add greatest value. They seek new methods, practices, and ideas from a variety of sources and seek to apply those ideas
to their own workplace. They take action on their ideas and understand how to bring innovation to an organization.
CRP7. Employ valid and reliable research strategies.
Career-ready individuals are discerning in accepting and using new information to make decisions, change practices or inform strategies. They use reliable
research process to search for new information. They evaluate the validity of sources when considering the use and adoption of external information or
practices in their workplace situation.
11 | P a g e
Career Ready Practices
CRP8. Utilize critical thinking to make sense of problems and persevere in solving them.
Career-ready individuals readily recognize problems in the workplace, understand the nature of the problem, and devise effective plans to solve the
problem. They are aware of problems when they occur and take action quickly to address the problem; they thoughtfully investigate the root cause of the
problem prior to introducing solutions. They carefully consider the options to solve the problem. Once a solution is agreed upon, they follow through to
ensure the problem is solved, whether through their own actions or the actions of others.
CRP11. Use technology to enhance productivity.
Career-ready individuals find and maximize the productive value of existing and new technology to accomplish workplace tasks and solve workplace
problems. They are flexible and adaptive in acquiring new technology. They are proficient with ubiquitous technology applications. They understand the
inherent risks-personal and organizational-of technology applications, and they take actions to prevent or mitigate these risks.
CRP12. Work productively in teams while using cultural global competence.
Career-ready individuals positively contribute to every team, whether formal or informal. They apply an awareness of cultural difference to avoid barriers
to productive and positive interaction. They find ways to increase the engagement and contribution of all team members. They plan and facilitate effective
team meetings.
12 | P a g e
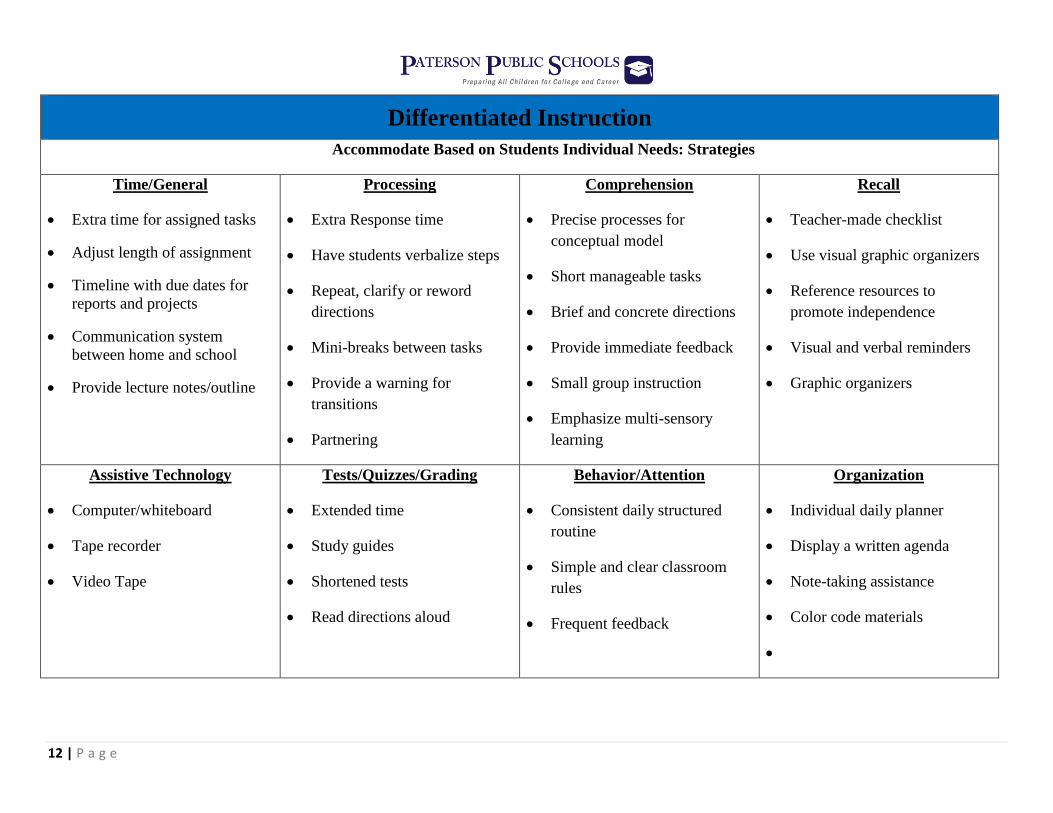
Differentiated Instruction
Accommodate Based on Students Individual Needs: Strategies
Time/General
Extra time for assigned tasks
Adjust length of assignment
Timeline with due dates for
reports and projects
Communication system
between home and school
Provide lecture notes/outline
Processing
Extra Response time
Have students verbalize steps
Repeat, clarify or reword
directions
Mini-breaks between tasks
Provide a warning for
transitions
Partnering
Comprehension
Precise processes for
conceptual model
Short manageable tasks
Brief and concrete directions
Provide immediate feedback
Small group instruction
Emphasize multi-sensory
learning
Recall
Teacher-made checklist
Use visual graphic organizers
Reference resources to
promote independence
Visual and verbal reminders
Graphic organizers
Assistive Technology
Computer/whiteboard
Tape recorder
Video Tape
Tests/Quizzes/Grading
Extended time
Study guides
Shortened tests
Read directions aloud
Behavior/Attention
Consistent daily structured
routine
Simple and clear classroom
rules
Frequent feedback
Organization
Individual daily planner
Display a written agenda
Note-taking assistance
Color code materials
13 | P a g e
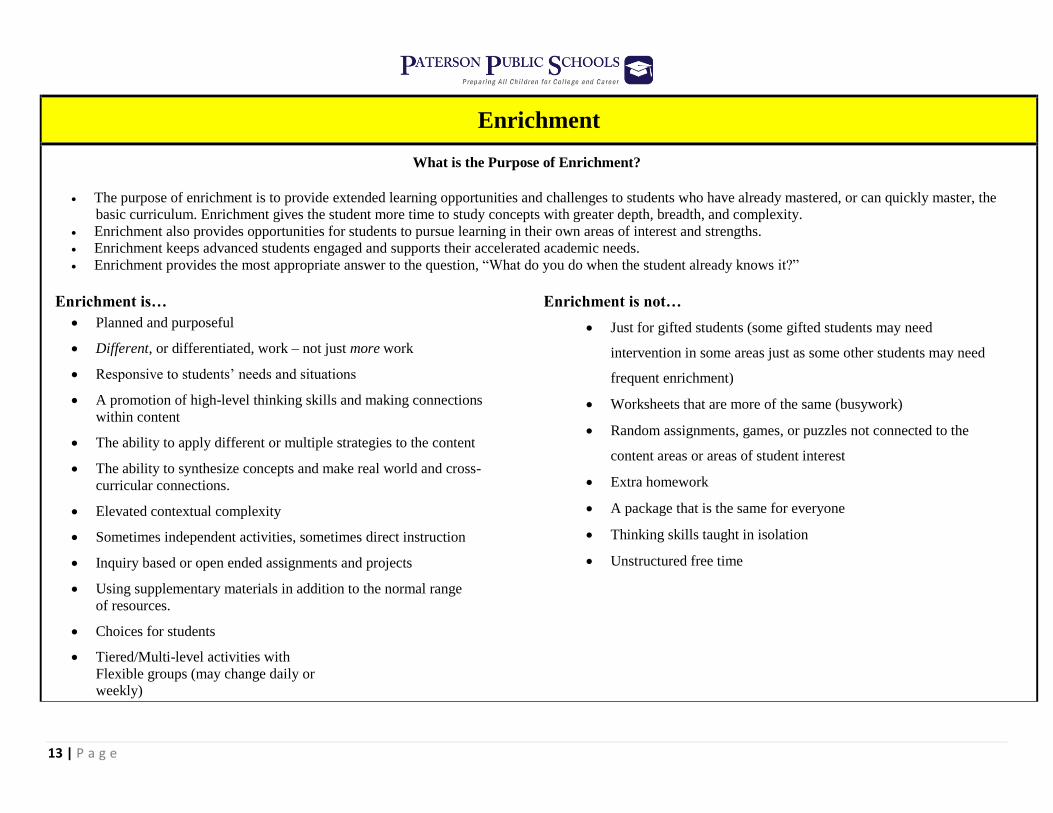
Enrichment
What is the Purpose of Enrichment?
The purpose of enrichment is to provide extended learning opportunities and challenges to students who have already mastered, or can quickly master, the
basic curriculum. Enrichment gives the student more time to study concepts with greater depth, breadth, and complexity.
Enrichment also provides opportunities for students to pursue learning in their own areas of interest and strengths.
Enrichment keeps advanced students engaged and supports their accelerated academic needs.
Enrichment provides the most appropriate answer to the question, “What do you do when the student already knows it?”
Enrichment is…
Planned and purposeful
Different, or differentiated, work – not just more work
Responsive to students’ needs and situations
A promotion of high-level thinking skills and making connections
within content
The ability to apply different or multiple strategies to the content
The ability to synthesize concepts and make real world and cross-
curricular connections.
Elevated contextual complexity
Sometimes independent activities, sometimes direct instruction
Inquiry based or open ended assignments and projects
Using supplementary materials in addition to the normal range
of resources.
Choices for students
Tiered/Multi-level activities with
Flexible groups (may change daily or
weekly)
Enrichment is not…
Just for gifted students (some gifted students may need
intervention in some areas just as some other students may need
frequent enrichment)
Worksheets that are more of the same (busywork)
Random assignments, games, or puzzles not connected to the
content areas or areas of student interest
Extra homework
A package that is the same for everyone
Thinking skills taught in isolation
Unstructured free time
14 | P a g e
Assessments
Suggested Formative/Summative Classroom Assessments Describe Learning Vertically
Identify Key Building Blocks
Make Connections (between and among key building blocks)
Short/Extended Constructed Response Items
Multiple-Choice Items (where multiple answer choices may be correct)
Drag and Drop Items
Use of Equation Editor
Quizzes
Journal Entries/Reflections/Quick-Writes
Accountable talk
Projects
Portfolio
Observation
Graphic Organizers/ Concept Mapping
Presentations
Role Playing
Teacher-Student and Student-Student Conferencing
Homework
15 | P a g e
New Jersey Student Learning Standards
N.Q.A.1: Use units as a way to understand problems and to guide the solution of multi-step problems; Choose and interpret units consistently in
formulas; Choose and interpret the scale and the origin in graphs and data displays.
N.Q.A.2: Define appropriate quantities for the purpose of descriptive modeling.
N.Q.A.3: Choose a level of accuracy appropriate to limitations on measurement when reporting quantities.
N.RN.A.1: Explain how the definition of the meaning of rational exponents follows from extending the properties of integer exponents to those
values, allowing for a notation for radicals in terms of rational exponents. For example, we define 51/3
to be the cube root of 5 because we want (51/3
)3
= 5(1/3
)3 to hold, so (5
1/3)3 must equal 5.
N.RN.A.2: Rewrite expressions involving radicals and rational exponents using the properties of exponents.
N-RN-B-3: Explain why the sum or product of two rational numbers is rational; that the sum of a rational number and an irrational number is
irrational; and that the product of a nonzero rational number and an irrational number is irrational.
N.CN.A.1: Know there is a complex number i such that i2 = –1, and every complex number has the form a + bi with a and b real.
N.CN.A.2: Use the relation i2 = –1 and the commutative, associative, and distributive properties to add, subtract, and multiply complex numbers.
A.REI.B.3: Solve linear equations and inequalities in one variable, including equations with coefficients represented by letters.
A.REI.A.1: Explain each step in solving a simple equation as following from the equality of numbers asserted at the previous step, starting from the
assumption that the original equation has a solution. Construct a viable argument to justify a solution method.
A.CED.A.4: Rearrange formulas to highlight a quantity of interest, using the same reasoning as in solving equations. For example, rearrange Ohm's
law V = IR to highlight resistance R.
A.SSE.A.1: Interpret expressions that represent a quantity in terms of its context.
A.SSE.A.1a. Interpret parts of an expression, such as terms, factors, and coefficients.
16 | P a g e
New Jersey Student Learning Standards
A.CED.A.1: Create equations and inequalities in one variable and use them to solve problems. Include equations arising from linear functions and
quadratic functions, and simple rational and exponential functions.
A.CED.A.2: Create equations in two or more variables to represent relationships between quantities; Graph equations on coordinate axes with
labels and scales.
A.REI.D.10: Understand that the graph of an equation in two variables is the set of all its solutions plotted in the coordinate plane, often forming a
curve (which could be a line). [Focus on linear equations.]
A.REI.D.12: Graph the solutions to a linear inequality in two variables as a half-plane (excluding the boundary in the case of a strict inequality),
and graph the solution set to a system of linear inequalities in two variables as the intersection of the corresponding half-planes.
A.REI.C.6: Solve systems of linear equations exactly and approximately (e.g., with graphs), focusing on pairs of linear equations in two variables.
A.REI.C.5: Prove that, given a system of two equations in two variables, replacing one equation by the sum of that equation and a multiple of the
other produces a system with the same solutions.
A.CED.A.3: Represent constraints by equations or inequalities, and by systems of equations and/or inequalities, and interpret solutions as viable or
nonviable options in a modeling context. For example, represent inequalities describing nutritional and cost constraints on combinations of different
foods.
A.REI.D.11: Explain why the x-coordinates of the points where the graphs of the equations y = f(x) and y = g(x) intersect are the solutions of the
equation f(x) = g(x); find the solutions approximately, e.g., using technology to graph the functions, make tables of values, or find successive
approximations. Include cases where f(x) and/or g(x) are linear, polynomial, rational, absolute value, exponential, and logarithmic functions.* [Focus
on linear equations.]
A.REI.B.4: Solve quadratic equations in one variable.
A.REI.B.4a: Use the method of completing the square to transform any quadratic equation in x into an equation of the form (x - p)2 = q that has
the same solutions. Derive the quadratic formula from this form.
A.REI.B.4b: Solve quadratic equations by inspection (e.g., for x2 = 49), taking square roots, completing the square, the quadratic formula and
17 | P a g e
New Jersey Student Learning Standards
factoring, as appropriate to the initial form of the equation. Recognize when the quadratic formula gives complex solutions and write them
as a ± bi for real numbers a and b.
A.APR.A.1: Understand that polynomials form a system analogous to the integers, namely, they are closed under the operations of addition,
subtraction, and multiplication; add, subtract, and multiply polynomials.
A.SSE.A.2: Use the structure of an expression to identify ways to rewrite it. For example, see x4 - y
4 as (x
2)2 - (y
2)2, thus recognizing it as a
difference of squares that can be factored as (x2 - y
2)(x
2 + y
2).
A.SSE.B.3: Choose and produce an equivalent form of an expression to reveal and explain properties of the quantity represented by the expression.
A.SSE.B.3a: Factor a quadratic expression to reveal the zeros of the function it defines.
A.SSE.B.3b: Complete the square in a quadratic expression to reveal the maximum or minimum value of the function it defines.
A.SSE.B.4: Derive and/or explain the derivation of the formula for the sum of a finite geometric series (when the common ratio is not 1), and use
the formula to solve problems. For example, calculate mortgage payments.
F.IF.A.1: Understand that a function from one set (called the domain) to another set (called the range) assigns to each element of the domain exactly
one element of the range. If f is a function and x is an element of its domain, then f(x) denotes the output of f corresponding to the input x. The graph
of f is the graph of the equation y = f(x).
F.IF.A.2: Use function notation, evaluate functions for inputs in their domains, and interpret statements that use function notation in terms of a
context.
F.IF.B.4: For a function that models a relationship between two quantities, interpret key features of graphs and tables in terms of the quantities, and
sketch graphs showing key features given a verbal description of the relationship. Key features include: intercepts; intervals where the function is
increasing, decreasing, positive, or negative; relative maximums and minimums; symmetries; end behavior; and periodicity.
F.IF.B.5: Relate the domain of a function to its graph and, where applicable, to the quantitative relationship it describes. For example, if the function
h(n) gives the number of person-hours it takes to assemble n engines in a factory, then the positive integers would be an appropriate domain for the
function.

18 | P a g e
New Jersey Student Learning Standards
F.IF.B.6: Calculate and interpret the average rate of change of a function (presented symbolically or as a table) over a specified interval. Estimate the
rate of change from a graph.
F.IF.C.9: Compare properties of two functions each represented in a different way (algebraically, graphically, numerically in tables, or by verbal
descriptions). For example, given a graph of one quadratic function and an algebraic expression for another, say which has the larger maximum.
F.LE.A.1: Distinguish between situations that can be modeled with linear functions and with exponential functions.
F.LE.A.1a: Prove that linear functions grow by equal differences over equal intervals, and that exponential functions grow by equal factors
over equal intervals.
F.LE.A.1b: Recognize situations in which one quantity changes at a constant rate per unit interval relative to another.
F.LE.A.1c: Recognize situations in which a quantity grows or decays by a constant percent rate per unit interval relative to another.
F.LE.A.2: Construct linear and exponential functions, including arithmetic and geometric sequences, given a graph, a description of a relationship,
or two input-output pairs (include reading these from a table).
F.LE.A.3: Observe using graphs and tables that a quantity increasing exponentially eventually exceeds a quantity increasing linearly, quadratically,
or (more generally) as a polynomial function.
F.LE.B.5: Interpret the parameters in a linear or exponential function in terms of a context.
F.BF.A.1. Write a function that describes a relationship between two quantities.
F.BF.A.1a: Determine an explicit expression, a recursive process, or steps for calculation from a context
F.BF.A.1b: Combine standard function types using arithmetic operations. For example, build a function that models the temperature of a
cooling body by adding a constant function to a decaying exponential, and relate these functions to the model.
F.BF.A.2: Write arithmetic and geometric sequences both recursively and with an explicit formula, use them to model situations, and translate
between the two forms.
19 | P a g e
New Jersey Student Learning Standards
F.BF.B.3: Identify the effect on the graph of replacing f(x) by f(x) + k, k f(x), f(kx), and f(x + k) for specific values of k (both positive and negative);
find the value of k given the graphs. Experiment with cases and illustrate an explanation of the effects on the graph using technology. Include
recognizing even and odd functions from their graphs and algebraic expressions for them.
S.IC.A.2: Decide if a specified model is consistent with results from a given data-generating process, e.g., using simulation. For example, a model
says a spinning coin falls heads up with probability 0.5. Would a result of 5 tails in a row cause you to question the model?
S.IC.B.3: Recognize the purposes of and differences among sample surveys, experiments, and observational studies; explain how randomization
relates to each.
S.IC.B.4: Use data from a sample survey to estimate a population mean or proportion; develop a margin of error through the use of simulation
models for random sampling.
S.IC.B.5: Use data from a randomized experiment to compare two treatments; use simulations to decide if differences between parameters are
significant.
S.IC.B.6: Evaluate reports based on data.
S.ID.A.4: Use the mean and standard deviation of a data set to fit it to a normal distribution and to estimate population percentages. Recognize that
there are data sets for which such a procedure is not appropriate. Use calculators, spreadsheets, and tables to estimate areas under the normal curve.
S.ID.B.6: Represent data on two quantitative variables on a scatter plot, and describe how the variables are related.
S.ID.B.6a: Fit a function to the data (including the use of technology); use functions fitted to data to solve problems in the context of the data.
Use given functions or choose a function suggested by the context. Emphasize linear, quadratic, and exponential models.
S.ID.B.6c: Fit a linear function for a scatter plot that suggests a linear association.
S.ID.C.7: Interpret the slope (rate of change) and the intercept (constant term) of a linear model in the context of the data.
S.ID.C.8: Compute (using technology) and interpret the correlation coefficient of a linear fit.
S.ID.C.9: Distinguish between correlation and causation.

20 | P a g e
New Jersey Student Learning Standards
G.CO.A.1: Know precise definitions of angle, circle, perpendicular line, parallel line, and line segment, based on the undefined notions of point,
line, distance along a line, and distance around a circular arc.
G.CO.A.2: Represent transformations in the plane using, e.g., transparencies and geometry software; describe transformations as functions that take
points in the plane as inputs and give other points as outputs. Compare transformations that preserve distance and angle to those that do not (e.g.,
translation versus horizontal stretch).
G.CO.A.3: Given a rectangle, parallelogram, trapezoid, or regular polygon, describe the rotations and reflections that carry it onto itself.
G.CO.A.4: Develop definitions of rotations, reflections, and translations in terms of angles, circles, perpendicular lines, parallel lines, and line
segments.
G.CO.A.5: Given a geometric figure and a rotation, reflection, or translation, draw the transformed figure using, e.g., graph paper, tracing paper, or
geometry software. Specify a sequence of transformations that will carry a given figure onto another.
G.CO.B.6: Use geometric descriptions of rigid motions to transform figures and to predict the effect of a given rigid motion on a given figure;
given two figures, use the definition of congruence in terms of rigid motions to decide if they are congruent.
G.CO.B.8: Explain how the criteria for triangle congruence (ASA, SAS, and SSS) follow from the definition of congruence in terms of rigid
motions.
G.CO.B.7: Use the definition of congruence in terms of rigid motions to show that two triangles are congruent if and only if corresponding pairs of
sides and corresponding pairs of angles are congruent.
G.CO.C.9: Prove theorems about lines and angles. Theorems include: vertical angles are congruent; when a transversal crosses parallel lines,
alternate interior angles are congruent and corresponding angles are congruent; points on a perpendicular bisector of a line segment are exactly
those equidistant from the segment’s endpoints.
G.CO.C.10: Prove theorems about triangles. Theorems include: measures of interior angles of a triangle sum to 180°; base angles of isosceles
triangles are congruent; the segment joining midpoints of two sides of a triangle is parallel to the third side and half the length; the medians of a

21 | P a g e
New Jersey Student Learning Standards
triangle meet at a point.
G.SRT.C.8: Use trigonometric ratios and the Pythagorean Theorem to solve right triangles in applied problems.
G.GPE.B.6: Find the point on a directed line segment between two given points that partitions the segment in a given ratio.
G.GPE.B.7: Use coordinates to compute perimeters of polygons and areas of triangles and rectangles, e.g., using the distance formula.
G.GPE.B.4: Use coordinates to prove simple geometric theorems algebraically. For example, prove or disprove that a figure defined by four given
points in the coordinate plane is a rectangle; prove or disprove that the point (1, 3) lies on the circle centered at the origin and containing the point
(0, 2).
G.GPE.B.5: Prove the slope criteria for parallel and perpendicular lines and use them to solve geometric problems (e.g., find the equation of a line
parallel or perpendicular to a given line that passes through a given point).
22 | P a g e
Mathematical Practices
1. Make sense of problems and persevere in solving them.
2. Reason abstractly and quantitatively.
3. Construct viable arguments and critique the reasoning of others.
4. Model with mathematics.
5. Use appropriate tools strategically.
6. Attend to precision.
7. Look for and make use of structure.
8. Look for and express regularity in repeated reasoning
23 | P a g e
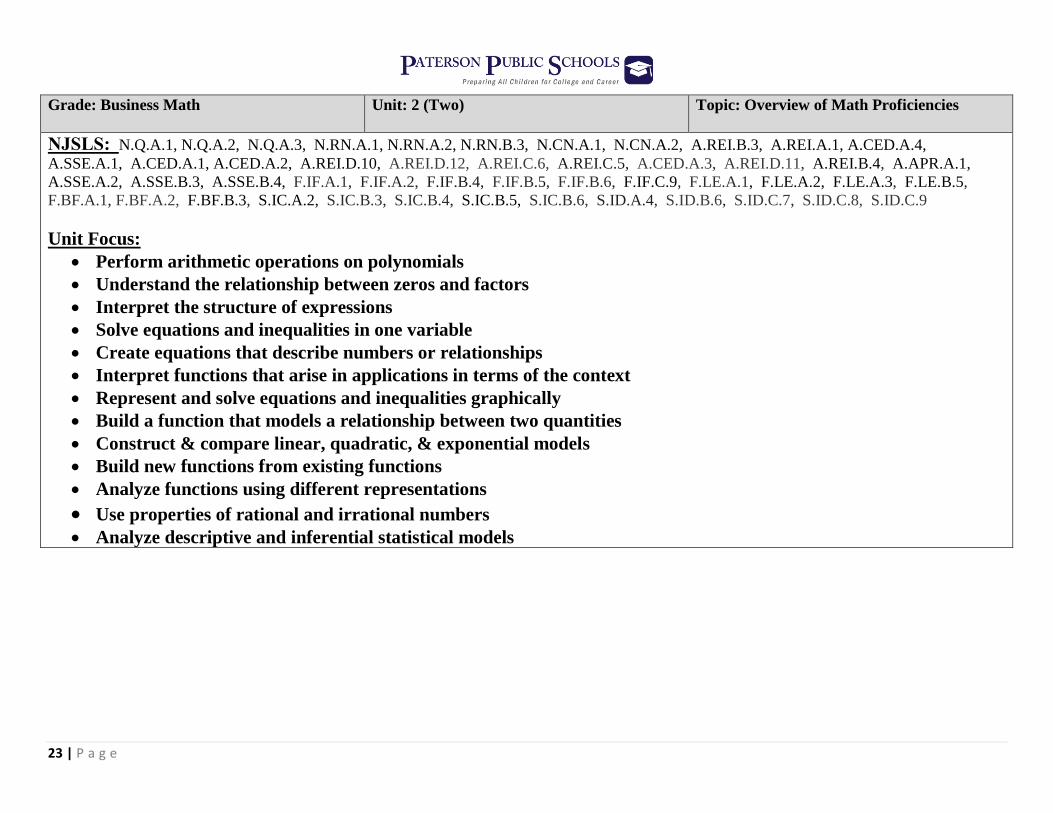
Grade: Business Math
Unit: 2 (Two) Topic: Overview of Math Proficiencies
NJSLS: N.Q.A.1, N.Q.A.2, N.Q.A.3, N.RN.A.1, N.RN.A.2, N.RN.B.3, N.CN.A.1, N.CN.A.2, A.REI.B.3, A.REI.A.1, A.CED.A.4,
A.SSE.A.1, A.CED.A.1, A.CED.A.2, A.REI.D.10, A.REI.D.12, A.REI.C.6, A.REI.C.5, A.CED.A.3, A.REI.D.11, A.REI.B.4, A.APR.A.1,
A.SSE.A.2, A.SSE.B.3, A.SSE.B.4, F.IF.A.1, F.IF.A.2, F.IF.B.4, F.IF.B.5, F.IF.B.6, F.IF.C.9, F.LE.A.1, F.LE.A.2, F.LE.A.3, F.LE.B.5,
F.BF.A.1, F.BF.A.2, F.BF.B.3, S.IC.A.2, S.IC.B.3, S.IC.B.4, S.IC.B.5, S.IC.B.6, S.ID.A.4, S.ID.B.6, S.ID.C.7, S.ID.C.8, S.ID.C.9
Unit Focus:
Perform arithmetic operations on polynomials
Understand the relationship between zeros and factors
Interpret the structure of expressions
Solve equations and inequalities in one variable
Create equations that describe numbers or relationships
Interpret functions that arise in applications in terms of the context
Represent and solve equations and inequalities graphically
Build a function that models a relationship between two quantities
Construct & compare linear, quadratic, & exponential models
Build new functions from existing functions
Analyze functions using different representations
Use properties of rational and irrational numbers Analyze descriptive and inferential statistical models
24 | P a g e
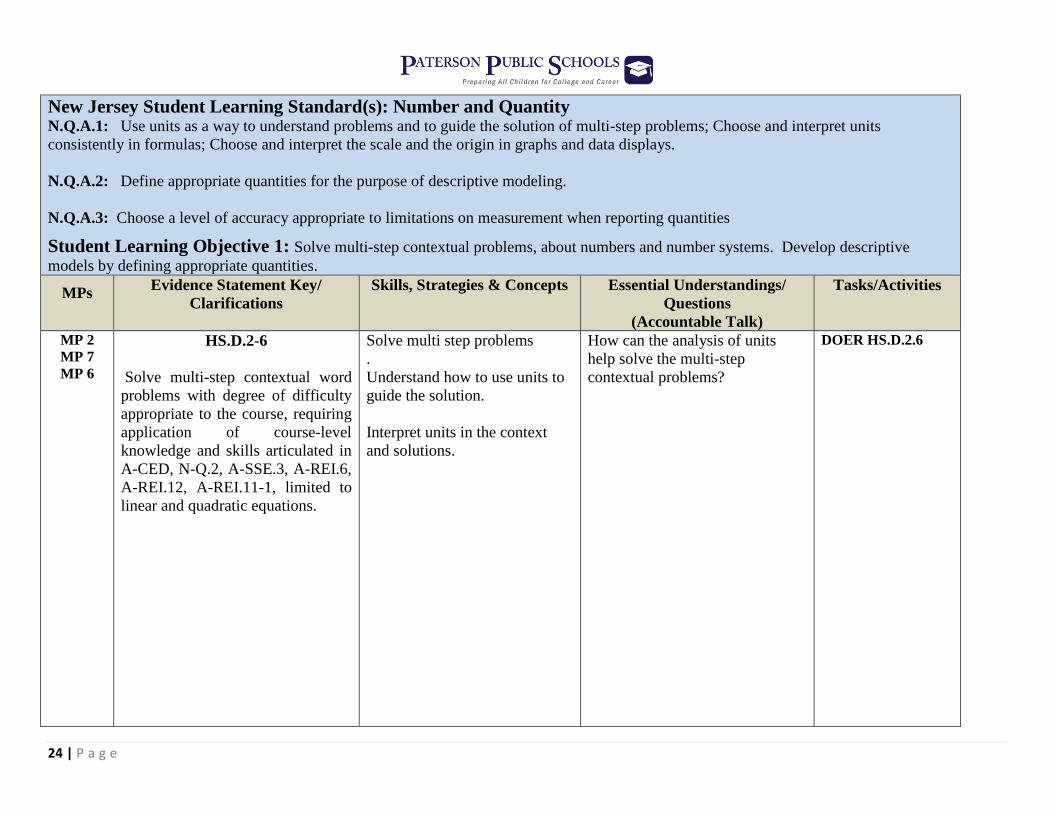
New Jersey Student Learning Standard(s): Number and Quantity N.Q.A.1: Use units as a way to understand problems and to guide the solution of multi-step problems; Choose and interpret units
consistently in formulas; Choose and interpret the scale and the origin in graphs and data displays.
N.Q.A.2: Define appropriate quantities for the purpose of descriptive modeling.
N.Q.A.3: Choose a level of accuracy appropriate to limitations on measurement when reporting quantities
Student Learning Objective 1: Solve multi-step contextual problems, about numbers and number systems. Develop descriptive
models by defining appropriate quantities.
MPs Evidence Statement Key/
Clarifications
Skills, Strategies & Concepts Essential Understandings/
Questions
(Accountable Talk)
Tasks/Activities
MP 2
MP 7
MP 6
HS.D.2-6
Solve multi-step contextual word
problems with degree of difficulty
appropriate to the course, requiring
application of course-level
knowledge and skills articulated in
A-CED, N-Q.2, A-SSE.3, A-REI.6,
A-REI.12, A-REI.11-1, limited to
linear and quadratic equations.
Solve multi step problems
.
Understand how to use units to
guide the solution.
Interpret units in the context
and solutions.
How can the analysis of units
help solve the multi-step
contextual problems?
DOER HS.D.2.6
25 | P a g e
New Jersey Student Learning Standard(s): Number and Quantity N.RN.A.1:Explain how the definition of the meaning of rational exponents follows from extending the properties of integer exponents to those values,
allowing for a notation for radicals in terms of rational exponents. For example, we define 51/3
to be the cube root of 5 because we want (51/3
)3 = 5(
1/3)
3 to
hold, so (51/3
)3 must equal 5.
N.RN.A.2: Rewrite expressions involving radicals and rational exponents using the properties of exponents.
N-RN-B.1: Apply properties of rational and irrational numbers to identify rational and irrational numbers
N-RN-B.3: Explain why the sum or product of two rational numbers is rational; that the sum of a rational number and an irrational number is
irrational; and that the product of a nonzero rational number and an irrational number is irrational.
Student Learning Objective 2: Apply properties of rational and irrational numbers to identify rational and irrational numbers and perform
arithmetic operations on them. Construct chains of reasoning that will justify or refute propositions or conjectures about numbers or number
systems.
MPs Evidence Statement Key/
Clarifications
Skills, Strategies & Concepts Essential Understandings/
Questions
(Accountable Talk)
Tasks/Activities
MP 1
MP 3
MP 5
MP 7
HS.C.2.1
Base explanations/reasoning on
the properties of rational and
irrational numbers Content scope:
N-RN.3.
For rational solutions, exact
values are required. For
irrational solutions, exact or
decimal approximations may
be required. Simplifying or
rewriting radicals is not
required; however, students
will not be penalized if they
simplify the radicals correctly.
Identify rational and irrational
numbers.
Perform arithmetic operations and
analyze the solution type.
Simplify radical expressions
How can I differentiate between
rational and irrational numbers?
Do arithmetic operations affect
the nature of the numbers?
DOER HS.C.2.1
INT MATH 2
HS.C.2.1
HS.C.3.2
HS.C.2.1
26 | P a g e
HS.C.3.1
Construct, autonomously, chains
of reasoning that will justify or
refute propositions or conjectures
about numbers or number systems.
Content Scope: N-RN, N-CN.
HS.C.3.2
Base explanations/reasoning on
the properties of exponents.
Content Scope: N-RN.A.
HS.C.18.4
Construct, autonomously, chains of
reasoning that will justify or refute
propositions or conjectures about
polynomials, rational expressions, or
rational exponents. Content scope: N-
RN, A-APR.(2, 3, 4, 6)

27 | P a g e
New Jersey Student Learning Standard(s): Algebra A.REI.B.3: Solve linear equations and inequalities in one variable, including equations with coefficients represented by letters.
A.REI.A.1: Explain each step in solving a simple equation as following from the equality of numbers asserted at the previous step, starting from the assumption
that the original equation has a solution. Construct a viable argument to justify a solution method.
A.CED.A.4: Rearrange formulas to highlight a quantity of interest, using the same reasoning as in solving equations. For example, rearrange Ohm's law V = IR
to highlight resistance R.
A.SSE.A.1: Interpret expressions that represent a quantity in terms of its context.
A.SSE.A.1a: Interpret parts of an expression, such as terms, factors, and coefficients.
A.CED.A.1: Create equations and inequalities in one variable and use them to solve problems. Include equations arising from linear functions and quadratic
functions, and simple rational and exponential functions.
A.REI.C.6: Solve systems of linear equations exactly and approximately (e.g., with graphs), focusing on pairs of linear equations in two variables.
A.REI.C.5: Prove that, given a system of two equations in two variables, replacing one equation by the sum of that equation and a multiple of the
other produces a system with the same solutions.
A.CED.A.3: Represent constraints by equations or inequalities, and by systems of equations and/or inequalities, and interpret solutions as viable or
nonviable options in a modeling context. For example, represent inequalities describing nutritional and cost constraints on combinations of different
foods.
A.REI.D.12: Graph the solutions to a linear inequality in two variables as a half-plane (excluding the boundary in the case of a strict inequality), and
graph the solution set to a system of linear inequalities in two variables as the intersection of the corresponding half-planes.
A.CED.A.2: Create equations in two or more variables to represent relationships between quantities; Graph equations on coordinate axes with
labels and scales.
A.REI.D.10: Understand that the graph of an equation in two variables is the set of all its solutions plotted in the coordinate plane, often forming a
curve (which could be a line). [Focus on linear equations.]
N.Q.A.1: Use units as a way to understand problems and to guide the solution of multi-step problems; Choose and interpret units consistently in
formulas; Choose and interpret the scale and the origin in graphs and data displays.
28 | P a g e
A.REI.B.4: Solve quadratic equations in one variable.
A.REI.B.4a: Use the method of completing the square to transform any quadratic equation in x into an equation of the form (x - p)2 = q that has
the same solutions. Derive the quadratic formula from this form.
A.REI.B.4b: Solve quadratic equations by inspection (e.g., for x2 = 49), taking square roots, completing the square, the quadratic formula and
factoring, as appropriate to the initial form of the equation. Recognize when the quadratic formula gives complex solutions and write them
as a ± bi for real numbers a and b.
A.SSE.B.3: Choose and produce an equivalent form of an expression to reveal and explain properties of the quantity represented by the expression
Student Learning Objective 3: Create linear equations and inequalities in one variable and use them in contextual situations to solve single or multistep
problems. Create linear and quadratic equations and inequalities in two variables and graph them. Solve systems of linear equations or inequalities in
two variables algebraically and graphically.
MPs Evidence Statement Key/
Clarifications
Skills, Strategies & Concepts Essential Understandings/
Questions
(Accountable Talk)
Tasks/Activities
MP 4
MP 6
HS.D.2-7
Solve multi-step contextual word
problems with degree of difficulty
appropriate to the course, requiring
application of course-level
knowledge and skills articulated in
A-CED, N-Q.2, A-SSE.3, AREI.6,
A-REI.7, A-REI.12, A-REI.11-2.
HS.D.2-5 Solve multi-step contextual word
problems with degree of difficulty
appropriate to the course, requiring
application of course-level
knowledge and skills articulated in
A-CED, N-Q, A-SSE.3, AREI.6,
Identify and describe relationships
between quantities in word problems.
Create linear equations in one variable.
Create linear inequalities in one
variable.
Use equations and inequalities to solve
real world problems.
Explain each step in the solution
process.
Create linear equations in two variables,
including those from a context.
How do equations and
inequalities describe
relationships?
How can equations represent
real-world and mathematical
problems?
How can equations represent
quantitative relationships?
DOER HS.D.2-7 REI.12
DOER HS.D.2.6-A-
REI6-2
DOER HS.D.2.6-A-
REI.6
DOER HS.D.2.6-A-CED
HS.D.2.6
HS.D.3-3A
HS.D.2.5
29 | P a g e
A-REI.12, A-REI.11-1, limited to
linear equations and exponential
equations with integer exponents.
A-CED is the primary content;
other listed content elements
may be involved in tasks as
well.
HS.D.2-6
Solve multi-step contextual word
problems with degree of difficulty
appropriate to the course, requiring
application of course-level
knowledge and skills articulated in
A-CED, N-Q.2, A-SSE.3, A-REI.6,
A-REI.12, A-REI.11-1, limited to
linear and quadratic equations.
A-CED is the primary content;
other listed content elements
may be involved in tasks as
well.
HS.D.1-1
Solve multi-step contextual
problems with degree of difficulty
appropriate to the course, requiring
application of knowledge and skills
articulated in 7.RP.A, 7.NS.3,
7.EE, and/or 8.EE.
Select appropriate scales for
constructing a graph.
Interpret the origin in graphs.
Graph equations on coordinate axes,
including labels and scales.
Identify and describe the solutions in the
graph of an equation.
30 | P a g e
New Jersey Student Learning Standards (s): Algebra A.REI.D.11: Explain why the x-coordinates of the points where the graphs of the equations y = f(x) and y = g(x) intersect are the solutions of the equation
f(x) = g(x); find the solutions approximately, e.g., using technology to graph the functions, make tables of values, or find successive approximations. Include
cases where f(x) and/or g(x) are linear, polynomial, rational, absolute value, exponential, and logarithmic functions.* [Focus on linear equations.]
A.REI.B.4: Solve quadratic equations in one variable.
A.REI.B.4a: Use the method of completing the square to transform any quadratic equation in x into an equation of the form (x - p)2 = q that
has the same solutions. Derive the quadratic formula from this form.
A.REI.B.4b: Solve quadratic equations by inspection (e.g., for x2 = 49), taking square roots, completing the square, the quadratic formula
and factoring, as appropriate to the initial form of the equation. Recognize when the quadratic formula gives complex solutions and write
them as a ± bi for real numbers a and b.
A.CED.A.1: Create equations and inequalities in one variable and use them to solve problems. Include equations arising from linear functions
and quadratic functions, and simple rational and exponential functions.
A.APR.A.1: Understand that polynomials form a system analogous to the integers, namely, they are closed under the operations of addition,
subtraction, and multiplication; add, subtract, and multiply polynomials.
A.SSE.A.2: Use the structure of an expression to identify ways to rewrite it.
For example, see x4 - y
4 as (x
2)2 - (y
2)2, thus recognizing it as a difference of squares that can be factored as (x
2 - y
2)(x
2 + y
2).
A.SSE.B.3: Choose and produce an equivalent form of an expression to reveal and explain properties of the quantity represented by the
expression.
A.SSE.B.3a: Factor a quadratic expression to reveal the zeros of the function it defines.
A.SSE.B.3b: Complete the square in a quadratic expression to reveal the maximum or minimum value of the function it defines.
Student Learning Objective 4: Construct chains of reasoning that will justify or refute proposition or conjectures about algebraic
equations or systems.

31 | P a g e
MPs Evidence Statement Key/
Clarifications
Skills, Strategies & Concepts Essential Understandings/
Questions
(Accountable Talk)
Tasks/Activities
MP 1
MP 3
MP 5
MP 6
MP 8
HS.C.5.10-1
Given an equation or system of
equations, reason about the
number or nature of the
solutions. Content scope: A-
REI.11, limited to equations of
the form f(x) = g(x) where f and
g are linear or quadratic
HS.C.8.1
Construct, autonomously, chains
of reasoning that will justify or
refute algebraic propositions or
conjectures. Content scope: A-
APR.1
HS.C.8.3
Construct, autonomously, chains
of reasoning that will justify or
refute algebraic propositions or
conjectures. Content Scope: A-
APR.
HS.C.5.5
Given an equation or system of
equations, reason about the
number or nature of the solutions
Content scope: A-REI.4a, A-
REI.4b, limited to real solutions
only.
Explain the relationship between the
x-coordinate of a point of
intersection and the solution to the
equation f(x) = g(x) for linear
equations y = f(x) and y = g(x).
Find approximate solutions to the
system by making a table of values,
graphing, and finding successive
approximations.
Add and subtract polynomials.
Multiply polynomials.
Recognize numerical expressions as
a difference of squares and rewrite
the expression as the product of
sums/differences.
Recognize polynomial expressions
in one variable as a difference of
squares and rewrite the expression
as the product of sums/differences.
y = f(x), y=g(x) represent a
system of equations.
Systems of equations can
be solved graphically
DOER HS.C.16.2
DOER HS.C.8.3
HS.C.16.2-2
HS.C.16.2
32 | P a g e
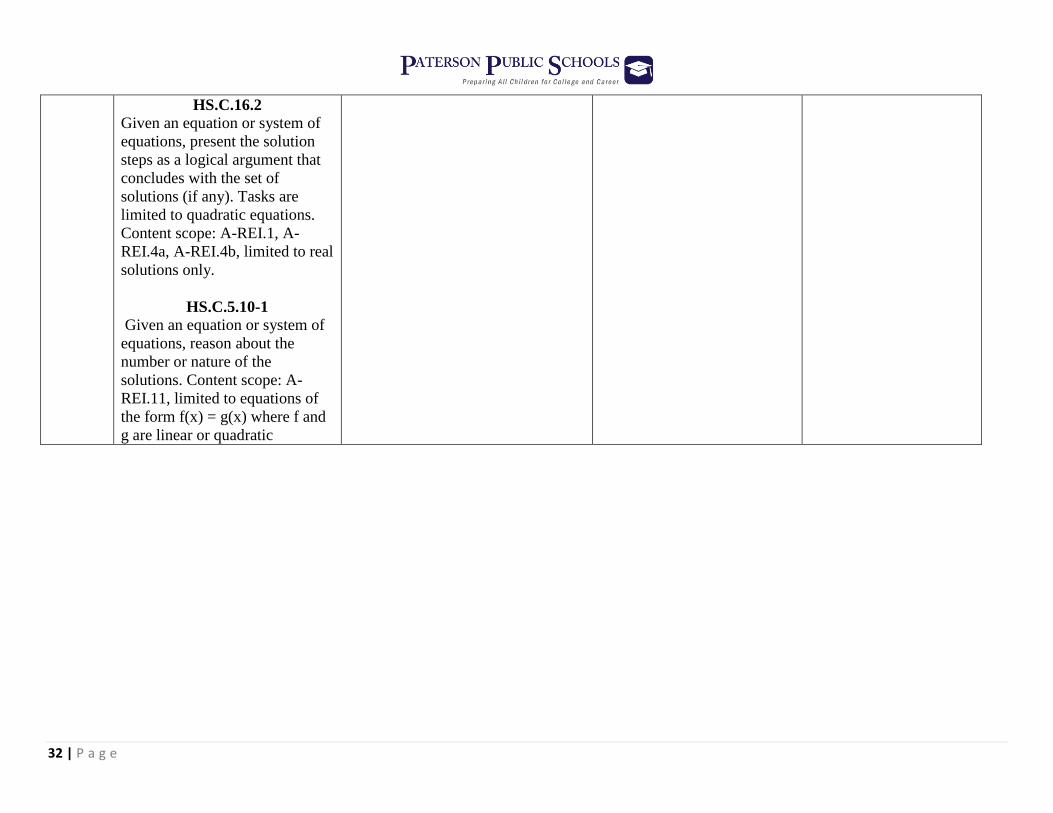
HS.C.16.2
Given an equation or system of
equations, present the solution
steps as a logical argument that
concludes with the set of
solutions (if any). Tasks are
limited to quadratic equations.
Content scope: A-REI.1, A-
REI.4a, A-REI.4b, limited to real
solutions only.
HS.C.5.10-1
Given an equation or system of
equations, reason about the
number or nature of the
solutions. Content scope: A-
REI.11, limited to equations of
the form f(x) = g(x) where f and
g are linear or quadratic
33 | P a g e
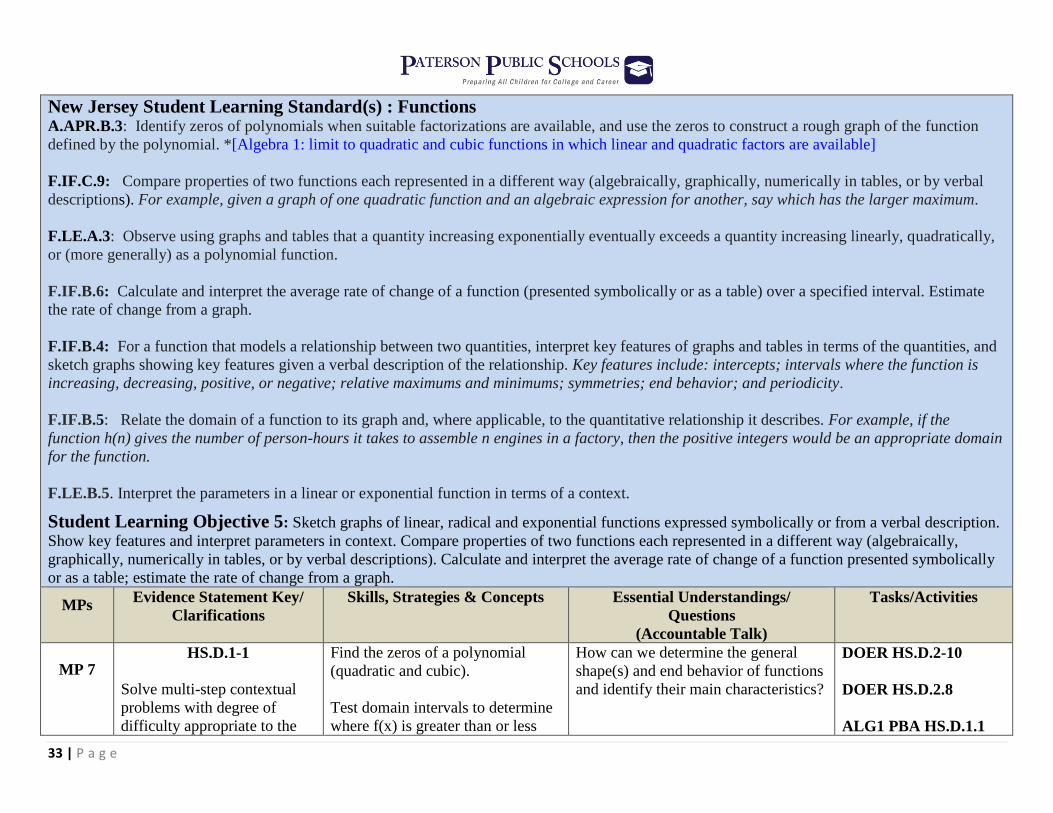
New Jersey Student Learning Standard(s) : Functions A.APR.B.3: Identify zeros of polynomials when suitable factorizations are available, and use the zeros to construct a rough graph of the function
defined by the polynomial. *[Algebra 1: limit to quadratic and cubic functions in which linear and quadratic factors are available]
F.IF.C.9: Compare properties of two functions each represented in a different way (algebraically, graphically, numerically in tables, or by verbal
descriptions). For example, given a graph of one quadratic function and an algebraic expression for another, say which has the larger maximum.
F.LE.A.3: Observe using graphs and tables that a quantity increasing exponentially eventually exceeds a quantity increasing linearly, quadratically,
or (more generally) as a polynomial function.
F.IF.B.6: Calculate and interpret the average rate of change of a function (presented symbolically or as a table) over a specified interval. Estimate
the rate of change from a graph.
F.IF.B.4: For a function that models a relationship between two quantities, interpret key features of graphs and tables in terms of the quantities, and
sketch graphs showing key features given a verbal description of the relationship. Key features include: intercepts; intervals where the function is
increasing, decreasing, positive, or negative; relative maximums and minimums; symmetries; end behavior; and periodicity.
F.IF.B.5: Relate the domain of a function to its graph and, where applicable, to the quantitative relationship it describes. For example, if the
function h(n) gives the number of person-hours it takes to assemble n engines in a factory, then the positive integers would be an appropriate domain
for the function.
F.LE.B.5. Interpret the parameters in a linear or exponential function in terms of a context.
Student Learning Objective 5: Sketch graphs of linear, radical and exponential functions expressed symbolically or from a verbal description.
Show key features and interpret parameters in context. Compare properties of two functions each represented in a different way (algebraically,
graphically, numerically in tables, or by verbal descriptions). Calculate and interpret the average rate of change of a function presented symbolically
or as a table; estimate the rate of change from a graph.
MPs Evidence Statement Key/
Clarifications
Skills, Strategies & Concepts Essential Understandings/
Questions
(Accountable Talk)
Tasks/Activities
MP 7
HS.D.1-1
Solve multi-step contextual
problems with degree of
difficulty appropriate to the
Find the zeros of a polynomial
(quadratic and cubic).
Test domain intervals to determine
where f(x) is greater than or less
How can we determine the general
shape(s) and end behavior of functions
and identify their main characteristics?
DOER HS.D.2-10
DOER HS.D.2.8
ALG1 PBA HS.D.1.1
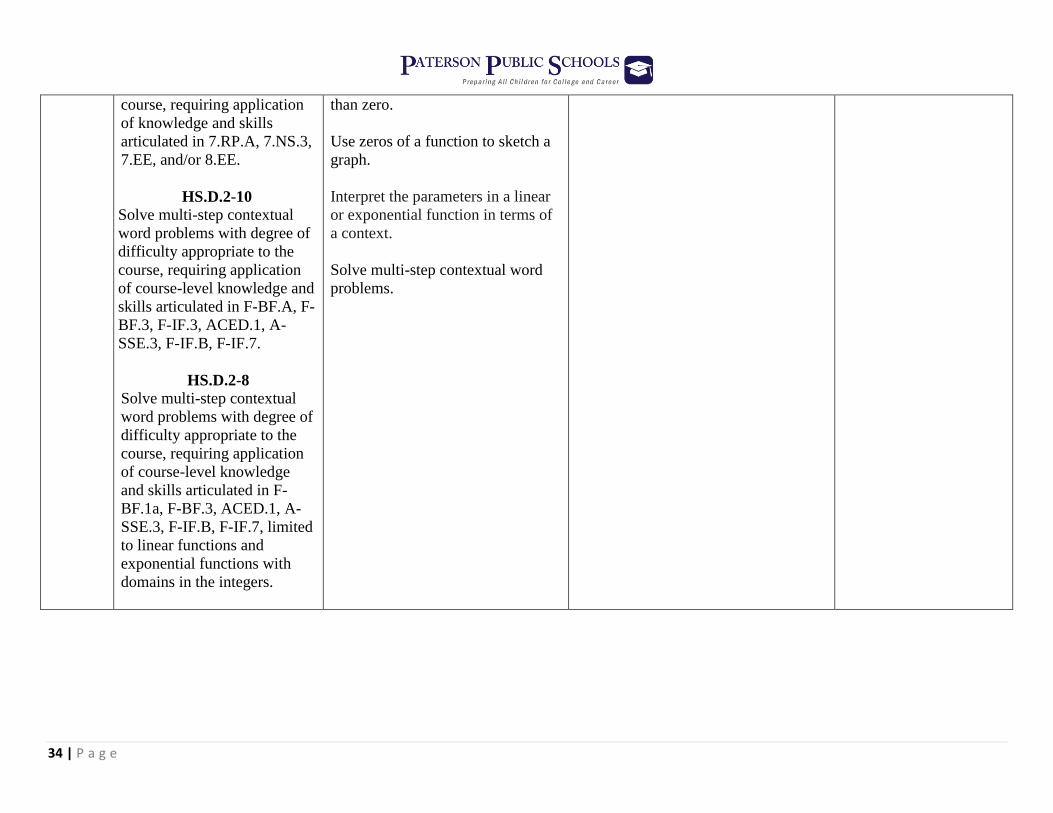
34 | P a g e
course, requiring application
of knowledge and skills
articulated in 7.RP.A, 7.NS.3,
7.EE, and/or 8.EE.
HS.D.2-10
Solve multi-step contextual
word problems with degree of
difficulty appropriate to the
course, requiring application
of course-level knowledge and
skills articulated in F-BF.A, F-
BF.3, F-IF.3, ACED.1, A-
SSE.3, F-IF.B, F-IF.7.
HS.D.2-8
Solve multi-step contextual
word problems with degree of
difficulty appropriate to the
course, requiring application
of course-level knowledge
and skills articulated in F-
BF.1a, F-BF.3, ACED.1, A-
SSE.3, F-IF.B, F-IF.7, limited
to linear functions and
exponential functions with
domains in the integers.
than zero.
Use zeros of a function to sketch a
graph.
Interpret the parameters in a linear
or exponential function in terms of
a context.
Solve multi-step contextual word
problems.
35 | P a g e
New Jersey Student Learning Standard(s): Functions F.IF.C.9: Compare properties of two functions each represented in a different way (algebraically, graphically, numerically in tables, or by verbal
descriptions). For example, given a graph of one quadratic function and an algebraic expression for another, say which has the larger maximum.
F.LE.A.3: Observe using graphs and tables that a quantity increasing exponentially eventually exceeds a quantity increasing linearly, quadratically,
or (more generally) as a polynomial function.
F.IF.B.6: Calculate and interpret the average rate of change of a function (presented symbolically or as a table) over a specified interval. Estimate
the rate of change from a graph.
F.IF.B.4: For a function that models a relationship between two quantities, interpret key features of graphs and tables in terms of the quantities, and
sketch graphs showing key features given a verbal description of the relationship. Key features include: intercepts; intervals where the function is
increasing, decreasing, positive, or negative; relative maximums and minimums; symmetries; end behavior; and periodicity.
Student Learning Objective 6: Construct chains of reasoning that will justify or refute proposition or conjectures about functions.
MPs Evidence Statement Key/
Clarifications
Skills, Strategies & Concepts Essential Understandings/
Questions
(Accountable Talk)
Tasks/Activities
MP 7
HS.C.12.2 Construct, autonomously,
chains of reasoning that will
justify or refute propositions
or conjectures about
functions.
HS.C.CCR Solve multi-step mathematical
problems requiring extended
chains of reasoning and
drawing on a synthesis of the
knowledge and skills
articulated across: 7-RP.A.3,
7-NS.A.3, 7-EE.B.3, 8-
EE.C.7B, 8-EE.C.8c, N-
RN.A.2, ASSE.A.1b, A-
Find the zeros of a polynomial
(quadratic and cubic).
Test domain intervals to determine
where f(x) is greater than or less
than zero.
Use zeros of a function to sketch a
graph.
Interpret the parameters in a linear
or exponential function in terms of
a context.
Solve multi-step contextual word
problems.
How can we determine the general
shape(s) and end behavior of functions
and identify their main characteristics?
DOER HS.C.12.2
ALG 1 PBA HS.C.18.1
INT MATH 3
HS.C.CCR
HS.C.CCR

36 | P a g e
REI.A.1, A-REI.B.3, A-
REI.B.4b, F-IF.A.2, F-
IF.C.7a, F-IF.C.7e, G-
SRT.B.5 and G-SRT.C.7.
HS.C.18.1 Construct, autonomously,
chains of reasoning that will
justify or refute propositions
or conjectures about linear
equations in one or two
variables. Content scope:
8.EE.B
37 | P a g e
New Jersey Student Learning Standard(s): Probability and Statistics S.ID.B.6: Represent data on two quantitative variables on a scatter plot, and describe how the variables are related.
S.ID.B.6a: Fit a function to the data (including the use of technology); use functions fitted to data to solve problems in the context of the data.
Use given functions or choose a function suggested by the context. Emphasize linear, quadratic, and exponential models.
S.ID.B.6c: Fit a linear function for a scatter plot that suggests a linear association.
S.ID.C.7: Interpret the slope (rate of change) and the intercept (constant term) of a linear model in the context of the data.
S.ID.C.8: Compute (using technology) and interpret the correlation coefficient of a linear fit.
S.ID.C.9: Distinguish between correlation and causation.
Student Learning Objective 7: Represent linear and non-linear (quadratic, exponential, and trigonometric) data for two variables on a scatter
plot, fit a function to the data, analyze slope, intercept (in case of linear) and residuals (in order to informally assess fit), and use the function to solve
problems. Use given functions or choose a function suggested by the context.
MPs Evidence Statement Key/
Clarifications
Skills, Strategies & Concepts Essential Understandings/
Questions
(Accountable Talk)
Tasks/Activities
MP 3
MP 6
MP 4
HS.D.2-13
Solve multi-step contextual word
problems with degree of difficulty
appropriate to the course, requiring
application of course-level
knowledge and skills articulated in
S-ID and S-IC.
If the content is only S-ID, the
task must include Algebra 2 /
Math 3 content (S-ID.4 or S-
ID.6).
Create scatter plots for linear and
non linear data relationships.
Create functions of best fit.
Interpret slope, rate of change,
intercepts and key coefficients of
the function.
How can we identify correlation
between variables given a set of
data?
How does the interpretation of data
deepen understanding of
relationships?
DOER HS.D.2-13
DOER HS.D.2-13-2
HS.D.2-13
38 | P a g e
Longer tasks may require some
or all of the steps of the
modeling cycle (CCSSM, pp.
72, 73); for example, see ITN
Appendix F, "Karnataka" task
(Section A "Illustrations of
innovative task characteristics,"
subsection 7
"Modeling/Application,"
subsection f "Full Models"). As
in the Karnataka example,
algebra and function skills may
be used.
Predictions should not
extrapolate far beyond the set of
data provided.
Line of best fit is always based
on the equation of the least
squares regression line either
provided or calculated through
the use of technology. Tasks
may involve linear, exponential,
or quadratic regressions. If the
linear regression is in the task,
the task must be written to allow
students to choose the
regression.
To investigate associations,
students may be asked to
evaluate scatterplots that may be
provided or created using
technology. Evaluation includes
shape, direction, strength,
presence of outliers, and gaps.
39 | P a g e
Analysis of residuals may
include the identification of a
pattern in a residual plot as an
indication of a poor fit.
Models may assess key features
of the graph of the fitted model.
Tasks that involve S-IC.2 might
ask the students to look at the
results of a simulation and
decide how plausible the
observed value is with respect to
the simulation. For an example,
see question 7 on the calculator
section of the online practice test
(http://practice.parcc.testnav.co
m/#).
Tasks that involve S-ID.4, may
require finding the area
associated with a z-score using
technology. Use of a z-score
table will not be required. x.)
Tasks may involve finding a
value at a given percentile based
on a normal distribution.

40 | P a g e
New Jersey Student Learning Standard(s): Probability and Statistics S.IC.B.3: Recognize the purposes of and differences among sample surveys, experiments, and observational studies; explain how randomization
relates to each.
S.IC.A.2: Decide if a specified model is consistent with results from a given data-generating process, e.g., using simulation. For example, a model says
a spinning coin falls heads up with probability 0.5. Would a result of 5 tails in a row cause you to question the model?
S.IC.B.5: Use data from a randomized experiment to compare two treatments; use simulations to decide if differences between parameters are
significant.
S.IC.B.6. Evaluate reports based on data.
Student Learning Objective 8: Identify and evaluate random sampling methods. Identify the differences among and purposes of sample surveys,
experiments, and observational studies, explaining how randomization relates to each. Use data from a randomized experiment to compare two
treatments and use simulations to decide if differences between parameters are significant; evaluate reports based on data.
MPs Evidence Statement Key/
Clarifications
Skills, Strategies &
Concepts
Essential Understandings/
Questions
(Accountable Talk)
Tasks/Activities
MP 1
MP 3
*HS.C.17.2
Make inferences and justify
conclusions from data. Content scope:
S-IC.
For tasks that address simple
random sample: A simple random
sample requires that every possible
group of the given sample size has
an equal chance of being selected,
not that every unit in the population
has an equal chance of being
selected.
For tasks that address comparing
two data distributions:
Comparisons of center, shape, and
spread are required.
Create scatter plots for
linear and non linear
data relationships.
Create functions of best
fit.
Interpret slope, rate of
change, intercepts and
key coefficients of the
function.
How can we identify correlation between
variables given a set of data?
INT MATH 3
HS.C.17.5
41 | P a g e
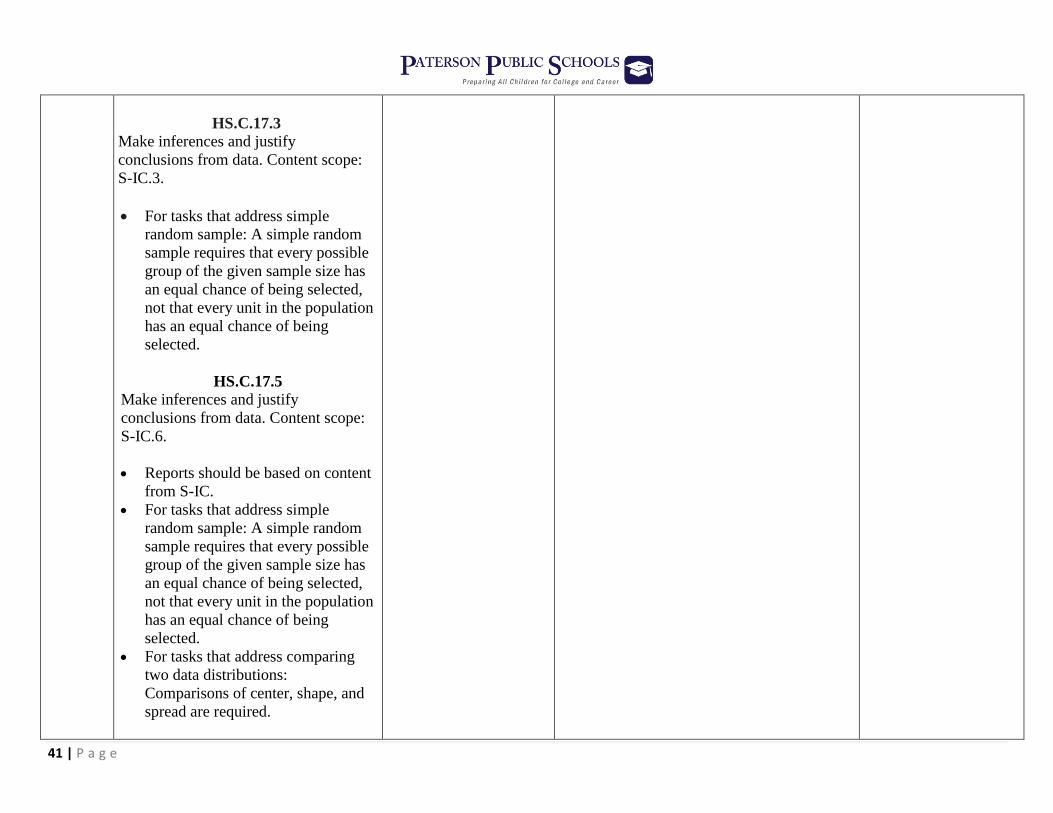
HS.C.17.3 Make inferences and justify
conclusions from data. Content scope:
S-IC.3.
For tasks that address simple
random sample: A simple random
sample requires that every possible
group of the given sample size has
an equal chance of being selected,
not that every unit in the population
has an equal chance of being
selected.
HS.C.17.5 Make inferences and justify
conclusions from data. Content scope:
S-IC.6.
Reports should be based on content
from S-IC. For tasks that address simple
random sample: A simple random
sample requires that every possible
group of the given sample size has
an equal chance of being selected,
not that every unit in the population
has an equal chance of being
selected.
For tasks that address comparing
two data distributions:
Comparisons of center, shape, and
spread are required.
42 | P a g e
New Jersey Student Learning Standard(s): Geometry G.CO.A.1: Know precise definitions of angle, circle, perpendicular line, parallel line, and line segment, based on the undefined notions of point,
line, distance along a line, and distance around a circular arc.
G.CO.A.2: Represent transformations in the plane using, e.g., transparencies and geometry software; describe transformations as functions that take
points in the plane as inputs and give other points as outputs. Compare transformations that preserve distance and angle to those that do not (e.g.,
translation versus horizontal stretch).
G.CO.A.3: Given a rectangle, parallelogram, trapezoid, or regular polygon, describe the rotations and reflections that carry it onto itself.
G.CO.A.4: Develop definitions of rotations, reflections, and translations in terms of angles, circles, perpendicular lines, parallel lines, and line
segments.
G.CO.A.5: Given a geometric figure and a rotation, reflection, or translation, draw the transformed figure using, e.g., graph paper, tracing paper, or
geometry software. Specify a sequence of transformations that will carry a given figure onto another.
G.CO.B.6: Use geometric descriptions of rigid motions to transform figures and to predict the effect of a given rigid motion on a given figure; given
two figures, use the definition of congruence in terms of rigid motions to decide if they are congruent.
G.CO.B.8: Explain how the criteria for triangle congruence (ASA, SAS, and SSS) follow from the definition of congruence in terms of rigid
motions.
G.CO.B.7: Use the definition of congruence in terms of rigid motions to show that two triangles are congruent if and only if corresponding pairs of
sides and corresponding pairs of angles are congruent.
G.CO.C.9: Prove theorems about lines and angles. Theorems include: vertical angles are congruent; when a transversal crosses parallel lines,
alternate interior angles are congruent and corresponding angles are congruent; points on a perpendicular bisector of a line segment are exactly
those equidistant from the segment’s endpoints.
G.CO.C.10: Prove theorems about triangles. Theorems include: measures of interior angles of a triangle sum to 180°; base angles of isosceles
triangles are congruent; the segment joining midpoints of two sides of a triangle is parallel to the third side and half the length; the medians of a
triangle meet at a point.
43 | P a g e
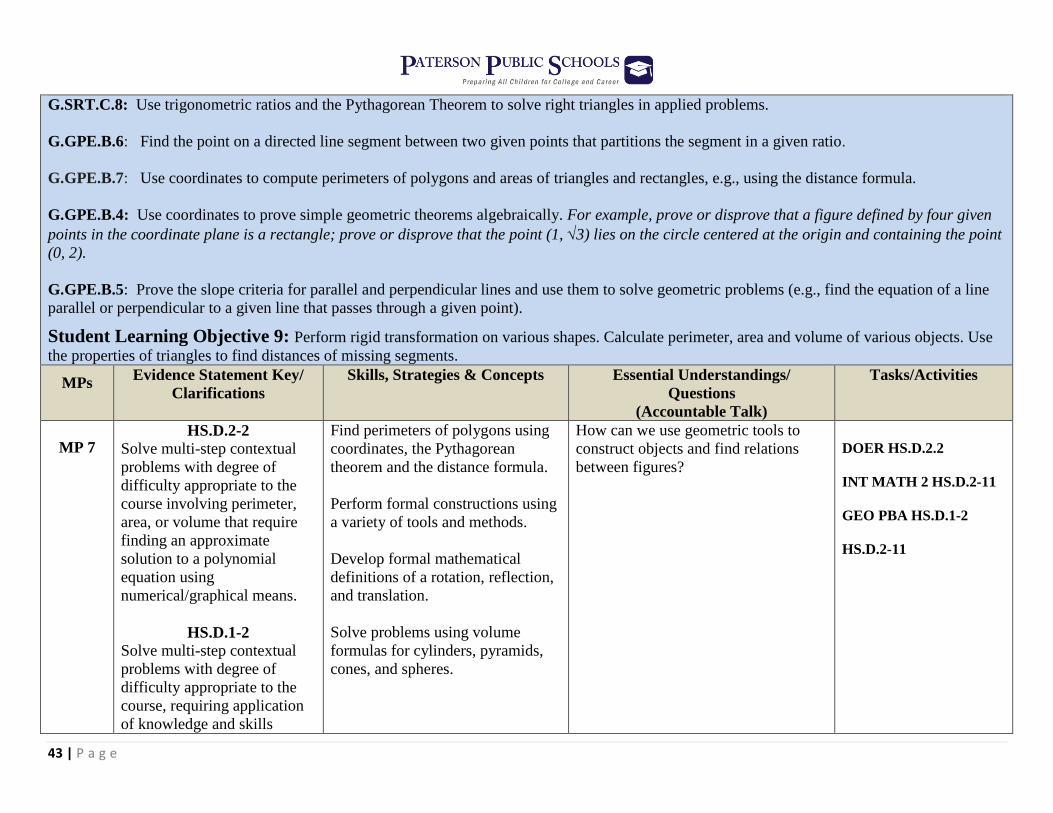
G.SRT.C.8: Use trigonometric ratios and the Pythagorean Theorem to solve right triangles in applied problems.
G.GPE.B.6: Find the point on a directed line segment between two given points that partitions the segment in a given ratio.
G.GPE.B.7: Use coordinates to compute perimeters of polygons and areas of triangles and rectangles, e.g., using the distance formula.
G.GPE.B.4: Use coordinates to prove simple geometric theorems algebraically. For example, prove or disprove that a figure defined by four given
points in the coordinate plane is a rectangle; prove or disprove that the point (1, 3) lies on the circle centered at the origin and containing the point
(0, 2).
G.GPE.B.5: Prove the slope criteria for parallel and perpendicular lines and use them to solve geometric problems (e.g., find the equation of a line
parallel or perpendicular to a given line that passes through a given point).
Student Learning Objective 9: Perform rigid transformation on various shapes. Calculate perimeter, area and volume of various objects. Use
the properties of triangles to find distances of missing segments.
MPs Evidence Statement Key/
Clarifications
Skills, Strategies & Concepts Essential Understandings/
Questions
(Accountable Talk)
Tasks/Activities
MP 7
HS.D.2-2
Solve multi-step contextual
problems with degree of
difficulty appropriate to the
course involving perimeter,
area, or volume that require
finding an approximate
solution to a polynomial
equation using
numerical/graphical means.
HS.D.1-2
Solve multi-step contextual
problems with degree of
difficulty appropriate to the
course, requiring application
of knowledge and skills
Find perimeters of polygons using
coordinates, the Pythagorean
theorem and the distance formula.
Perform formal constructions using
a variety of tools and methods.
Develop formal mathematical
definitions of a rotation, reflection,
and translation.
Solve problems using volume
formulas for cylinders, pyramids,
cones, and spheres.
How can we use geometric tools to
construct objects and find relations
between figures?
DOER HS.D.2.2
INT MATH 2 HS.D.2-11
GEO PBA HS.D.1-2
HS.D.2-11

44 | P a g e
articulated in 6.G, 7.G, and/or
8.G.
HS.D.2-11
Solve multi-step contextual
word problems with degree of
difficulty appropriate to the
course, requiring application
of course-level knowledge
and skills articulated in G-
SRT.8, involving right
triangles in an applied setting.
45 | P a g e
New Jersey Student Learning Standard(s): Functions
G.CO.A.1: Know precise definitions of angle, circle, perpendicular line, parallel line, and line segment, based on the undefined notions of point,
line, distance along a line, and distance around a circular arc.
G.CO.A.2: Represent transformations in the plane using, e.g., transparencies and geometry software; describe transformations as functions that take
points in the plane as inputs and give other points as outputs. Compare transformations that preserve distance and angle to those that do not (e.g.,
translation versus horizontal stretch).
G.CO.A.3: Given a rectangle, parallelogram, trapezoid, or regular polygon, describe the rotations and reflections that carry it onto itself.
G.CO.A.4: Develop definitions of rotations, reflections, and translations in terms of angles, circles, perpendicular lines, parallel lines, and line
segments.
G.CO.A.5: Given a geometric figure and a rotation, reflection, or translation, draw the transformed figure using, e.g., graph paper, tracing paper, or
geometry software. Specify a sequence of transformations that will carry a given figure onto another.
G.CO.B.6: Use geometric descriptions of rigid motions to transform figures and to predict the effect of a given rigid motion on a given figure; given
two figures, use the definition of congruence in terms of rigid motions to decide if they are congruent.
G.CO.B.8: Explain how the criteria for triangle congruence (ASA, SAS, and SSS) follow from the definition of congruence in terms of rigid
motions.
G.CO.B.7: Use the definition of congruence in terms of rigid motions to show that two triangles are congruent if and only if corresponding pairs of
sides and corresponding pairs of angles are congruent.
G.CO.C.9: Prove theorems about lines and angles. Theorems include: vertical angles are congruent; when a transversal crosses parallel lines,
alternate interior angles are congruent and corresponding angles are congruent; points on a perpendicular bisector of a line segment are exactly
those equidistant from the segment’s endpoints.
G.CO.C.10: Prove theorems about triangles. Theorems include: measures of interior angles of a triangle sum to 180°; base angles of isosceles
triangles are congruent; the segment joining midpoints of two sides of a triangle is parallel to the third side and half the length; the medians of a
triangle meet at a point.
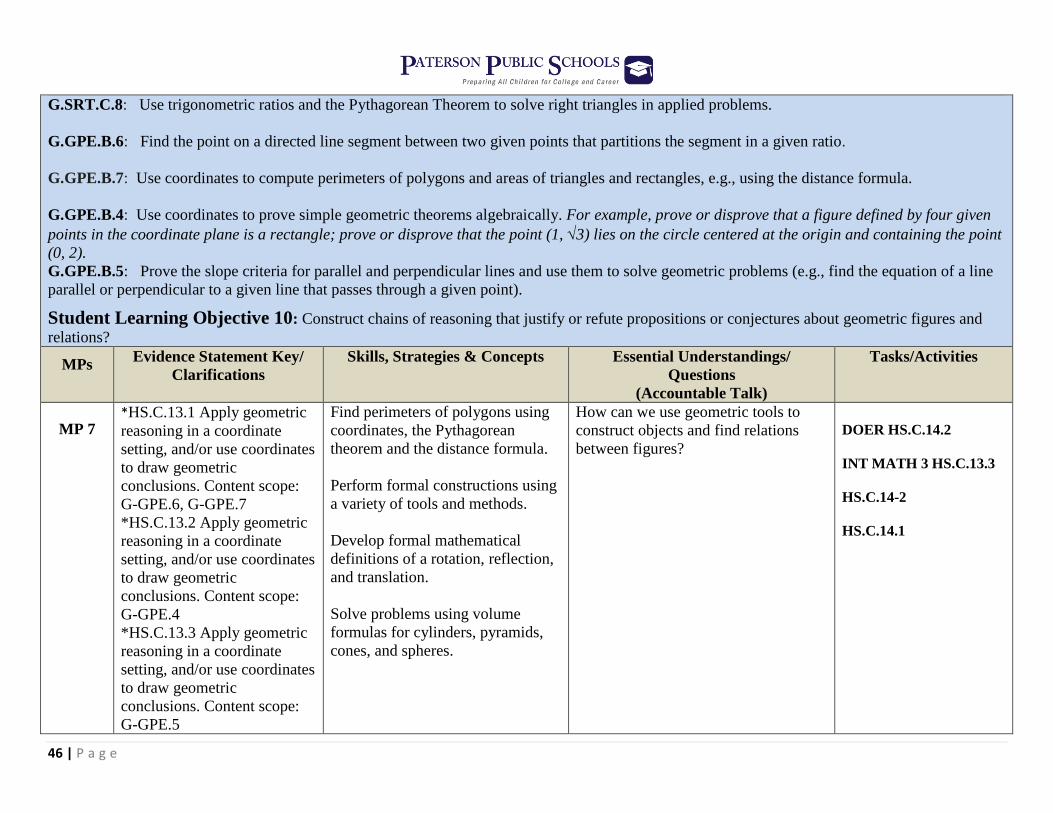
46 | P a g e
G.SRT.C.8: Use trigonometric ratios and the Pythagorean Theorem to solve right triangles in applied problems.
G.GPE.B.6: Find the point on a directed line segment between two given points that partitions the segment in a given ratio.
G.GPE.B.7: Use coordinates to compute perimeters of polygons and areas of triangles and rectangles, e.g., using the distance formula.
G.GPE.B.4: Use coordinates to prove simple geometric theorems algebraically. For example, prove or disprove that a figure defined by four given
points in the coordinate plane is a rectangle; prove or disprove that the point (1, 3) lies on the circle centered at the origin and containing the point
(0, 2).
G.GPE.B.5: Prove the slope criteria for parallel and perpendicular lines and use them to solve geometric problems (e.g., find the equation of a line
parallel or perpendicular to a given line that passes through a given point).
Student Learning Objective 10: Construct chains of reasoning that justify or refute propositions or conjectures about geometric figures and
relations?
MPs Evidence Statement Key/
Clarifications
Skills, Strategies & Concepts Essential Understandings/
Questions
(Accountable Talk)
Tasks/Activities
MP 7
*HS.C.13.1 Apply geometric
reasoning in a coordinate
setting, and/or use coordinates
to draw geometric
conclusions. Content scope:
G-GPE.6, G-GPE.7
*HS.C.13.2 Apply geometric
reasoning in a coordinate
setting, and/or use coordinates
to draw geometric
conclusions. Content scope:
G-GPE.4
*HS.C.13.3 Apply geometric
reasoning in a coordinate
setting, and/or use coordinates
to draw geometric
conclusions. Content scope:
G-GPE.5
Find perimeters of polygons using
coordinates, the Pythagorean
theorem and the distance formula.
Perform formal constructions using
a variety of tools and methods.
Develop formal mathematical
definitions of a rotation, reflection,
and translation.
Solve problems using volume
formulas for cylinders, pyramids,
cones, and spheres.
How can we use geometric tools to
construct objects and find relations
between figures?
DOER HS.C.14.2
INT MATH 3 HS.C.13.3
HS.C.14-2
HS.C.14.1
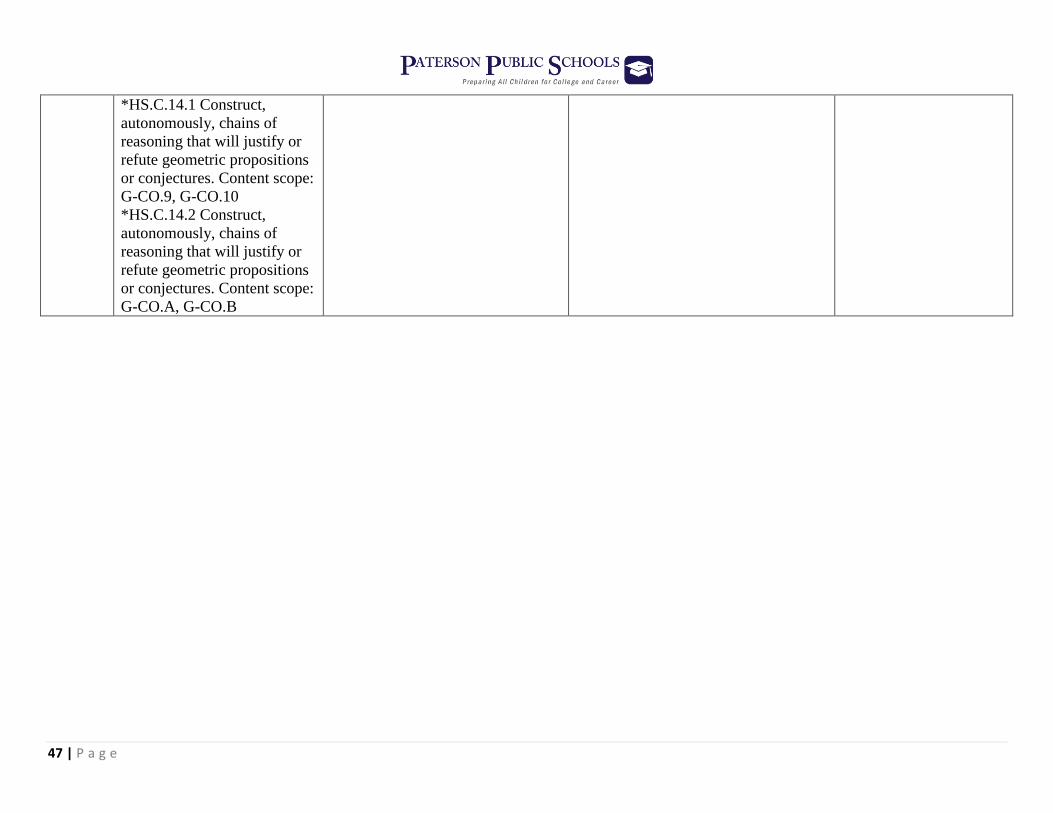
47 | P a g e
*HS.C.14.1 Construct,
autonomously, chains of
reasoning that will justify or
refute geometric propositions
or conjectures. Content scope:
G-CO.9, G-CO.10
*HS.C.14.2 Construct,
autonomously, chains of
reasoning that will justify or
refute geometric propositions
or conjectures. Content scope:
G-CO.A, G-CO.B

48 | P a g e
Unit 2 Vocabulary
Average rate of change
Axis of symmetry
Completing the square
Conjugates
Counterexample
Discriminant
Even function
Intercept form
Irrational
Like radicals
Maximum value
Minimum value
Odd function
Parabola
Quadratic equation
Quadratic function
Radical expression
Rational
Rationalizing the denominator
Simplest form
System of nonlinear equations
Vertex form of a quadratic function
Vertex of a parabola
Zero of a function
49 | P a g e
References & Suggested Instructional Websites
http://illuminations.nctm.org.index
https://prc.parcconline.org/system/files/Algebra%201%20-%20PBA%20-%20Item%20Set_0.pdf
https://prc.parcconline.org/system/files/Geometry%20-%20PBA%20-%20Item%20Set_0.pdf
https://prc.parcconline.org/system/files/Integrated%20Math%201%20-%20PBA%20-%20Item%20Set.pdf
https://prc.parcconline.org/system/files/Algebra%202%20-%20PBA%20-%20Item%20Set.pdf
https://prc.parcconline.org/system/files/Integrated%20Math%202%20-%20PBA%20-%20Item%20Set.pdf
https://prc.parcconline.org/system/files/Integrated%20Math%203%20-%20PBA%20-%20Item%20Set.pdf
www.illustrativemathematics.org/
http://www.njcore.org/
https://www.edcite.com/apps/QuestionsLib?subject=math&grades=9,10,11,12&showpub=true
http://cp.mcafee.com/d/1jWVIp6gUSyM--CYYOeodTdETophjuvvKrhKMOyCYVtcSztxB5dVZZ4SztwszsQsTpjdycWilmZ3W
https://www.frbatlanta.org/education/publications/extra-credit/2015/spring/lessons-and-activities/high-school/personal-finance/project-based-
learning-for-personal-finance-classroom
file:///C:/Users/dandanr/Downloads/High%20School%20Business%20Math%20Curriculum.pdf
http://mathforum.org/pow/financialed/
http://www.sde.ct.gov/sde/lib/sde/PDF/DEPS/Career/Business/Personal_Finance_RG.pdf
http://www.bizmove.com/marketing/m2y3.htm
https://connected.mcgraw-hill.com/c2j/dashboard.do?bookId=O4FRD4OWPJQTEDMK4YQ4GCMQTE

50 | P a g e
Field Trip Ideas
MUSEUM OF AMERICAN FINANCE (New York, NY) – For more than 20 years, educators from around the country have been bringing
students to the Museum to help them understand how finance impacts their daily lives. The Museum offers discounted admission for pre-booked
groups of eight or more, as well as a variety of classes for students in middle school through college.
http://www.moaf.org/index
MUSEUM of MATHEMATICS (New York) Mathematics illuminates the patterns that abound in our world. The National Museum of
Mathematics strives to enhance public understanding and perception of mathematics. Its dynamic exhibits and programs stimulate inquiry, spark
curiosity, and reveal the wonders of mathematics. The Museum’s activities lead a broad and diverse audience to understand the evolving, creative,
human, and aesthetic nature of mathematics.
www.momath.org
FEDERAL RESERVE BANK of NEW YORK (New York) Learn about the role of the New York Fed and the Federal Reserve System in
setting monetary policy, promoting financial stability, and serving communities to advance economic growth.
https://www.newyorkfed.org/aboutthefed/visiting.html