Embed Size (px)
DESCRIPTION
Mathematics Collection of Evidence (COE). Anton Jackson Mathematics Assessment Specialist. What is the COE?. A legislatively approved alternative to the WASL that is comparable in rigor to the WASL; WASL is still the standard for assessing a student’s skills and knowledge - PowerPoint PPT Presentation
Citation preview

WERA December 2008WERA December 2008Mathematics Assessment
Office of Superintendent
of Public Instruction
Mathematics Assessment
Office of Superintendent
of Public Instruction
Mathematics Collection of Evidence (COE)
Anton JacksonMathematics Assessment Specialist
WERA December 2008WERA December 2008Mathematics Assessment
Office of Superintendent
of Public Instruction
What is the COE?
• A legislatively approved alternative to the WASL that is comparable in rigor to the WASL; WASL is still the standard for assessing a student’s skills and knowledge
• One way a student can meet requirements for a Certificate of Academic Achievement (CAA)
• Designed for students who have the skills and knowledge assessed on the WASL

WERA December 2008WERA December 2008Mathematics Assessment
Office of Superintendent
of Public Instruction
What’s in a COE• Student work samples developed over time in
academic and/or career and technical classes• Each work sample demonstrates both
mathematical content and process• The work is aligned to the grade 10 Essential
Academic Learning Requirements (EALRs), Grade Level Expectations (GLEs) and Washington Assessment of Student Learning (WASL)
WERA December 2008WERA December 2008Mathematics Assessment
Office of Superintendent
of Public Instruction
Student Participation – June 2008
• 2,705 Mathematics COE received• 2, 670 eligible collections– Ineligible: no WASL score, unenrolled,
no form for out-of-state/country student
• 2,662 scored collections– 4 failed sufficiency 1 checks (signatures, forms)– 4 failed sufficiency 2 checks (< 8 work samples)
WERA December 2008WERA December 2008Mathematics Assessment
Office of Superintendent
of Public Instruction
Student Participation – June 2008• By grade:– 9th – 7 students*– 10th – 84 students*– 11th – 1,606 students– 12th – 965 students
• By population:– Special Education – 180 students– Bilingual/ELL – 194 students– Low Income – 999 students
*small n count
WERA December 2008WERA December 2008Mathematics Assessment
Office of Superintendent
of Public Instruction
Student Participation – June 2008• By ethnicity:– American Indian/Alaska Native – 78 students*– Asian – 117 students– Black/African American – 140 students– Caucasian/White – 1,810 students– Hispanic/Latino – 470 students– Native Hawaiian/Pacific Islander – 13 students*– Not Provided – 8 students*– Multiracial – 26 students*
*small n count

WERA December 2008WERA December 2008Mathematics Assessment
Office of Superintendent
of Public Instruction
Student Proficiency – June 2008
• Proficiency– The student has demonstrated what students
should know and be able to do in that subject and grade based on the state standards
• Earned 78 or more points (out of 128 possible) on their Mathematics COE

WERA December 2008WERA December 2008Mathematics Assessment
Office of Superintendent
of Public Instruction
Student Proficiency – June 2008
1 4 . 2 9 %
5 5 . 2 9 %7 1 . 7 4 % 6 6 . 6 3 %
0 . 0 0 %
2 0 . 0 0 %
4 0 . 0 0 %
6 0 . 0 0 %
8 0 . 0 0 %
1 0 0 . 0 0 %
9 t h g r a d e 1 0 t h g r a d e 1 1 t h g r a d e 1 2 t h g r a d e
Profici
ent R
ate (%
)
G r a d e l e v e l
S t u d e n t P r o fi c i e n c y b y G r a d e
WERA December 2008WERA December 2008Mathematics Assessment
Office of Superintendent
of Public Instruction
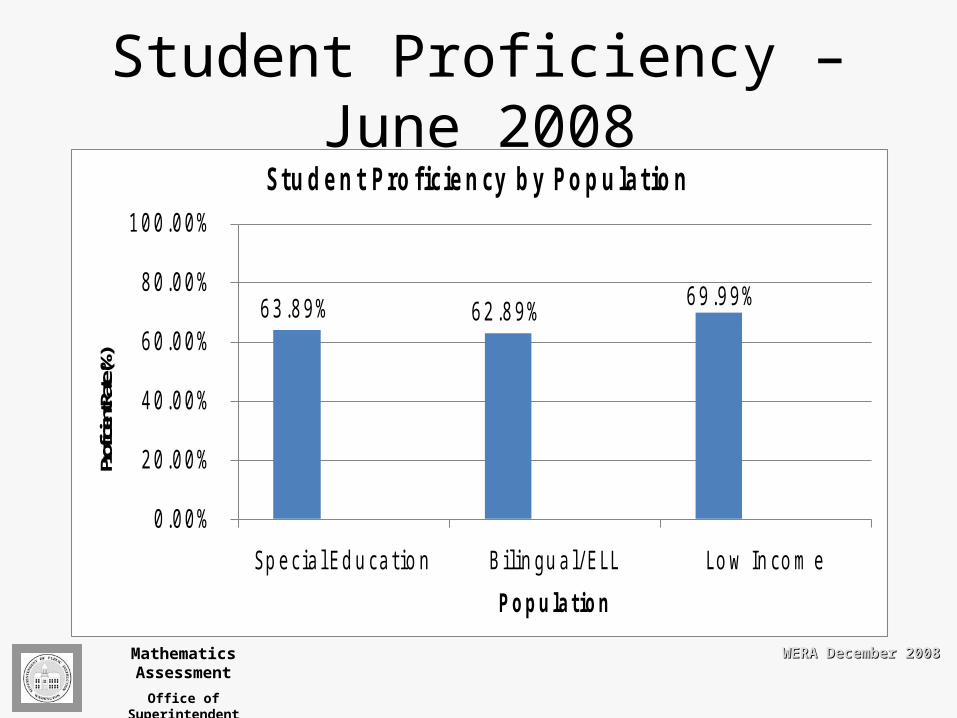
Student Proficiency – June 2008
6 3 . 8 9 % 6 2 . 8 9 % 6 9 . 9 9 %
0 . 0 0 %
2 0 . 0 0 %
4 0 . 0 0 %
6 0 . 0 0 %
8 0 . 0 0 %
1 0 0 . 0 0 %
S p e c i a l E d u c a ti o n B i l i n g u a l / E L L L o w I n c o m e
Profici
ent R
ate (%
)
P o p u l a ti o n
S t u d e n t P r o fi c i e n c y b y P o p u l a ti o n

WERA December 2008WERA December 2008Mathematics Assessment
Office of Superintendent
of Public Instruction
Student Proficiency – June 2008
Ethnicity ProficiencyAmerican Indian/Alaska Native 61.54%Asian 69.23%Black/African American 65.00%Caucasian/White 68.98%Hispanic/Latino 72.13%Native Hawaiian/Pacific Islander 53.85%Not Provided 87.50%Multiracial 80.77%
WERA December 2008WERA December 2008Mathematics Assessment
Office of Superintendent
of Public Instruction
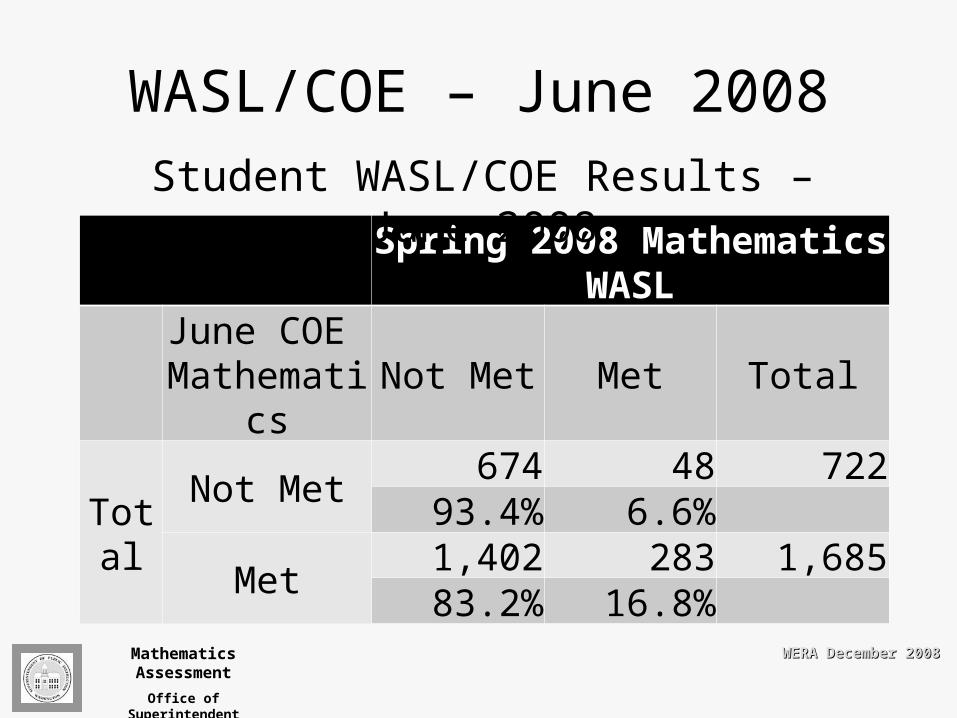
WASL/COE – June 2008
Spring 2008 Mathematics WASLJune COE
Mathematics Not Met Met Total
TotalNot Met
674 48 72293.4% 6.6%
Met1,402 283 1,68583.2% 16.8%
Student WASL/COE Results – June 2008
WERA December 2008WERA December 2008Mathematics Assessment
Office of Superintendent
of Public Instruction
Scoring the COE
• Rubric• Training Papers– Anchor– Practice
• Score paper COE • Capture scores electronically• Capture irregularities electronically

WERA December 2008WERA December 2008Mathematics Assessment
Office of Superintendent
of Public Instruction
COE Scoring Program
WERA December 2008WERA December 2008Mathematics Assessment
Office of Superintendent
of Public Instruction
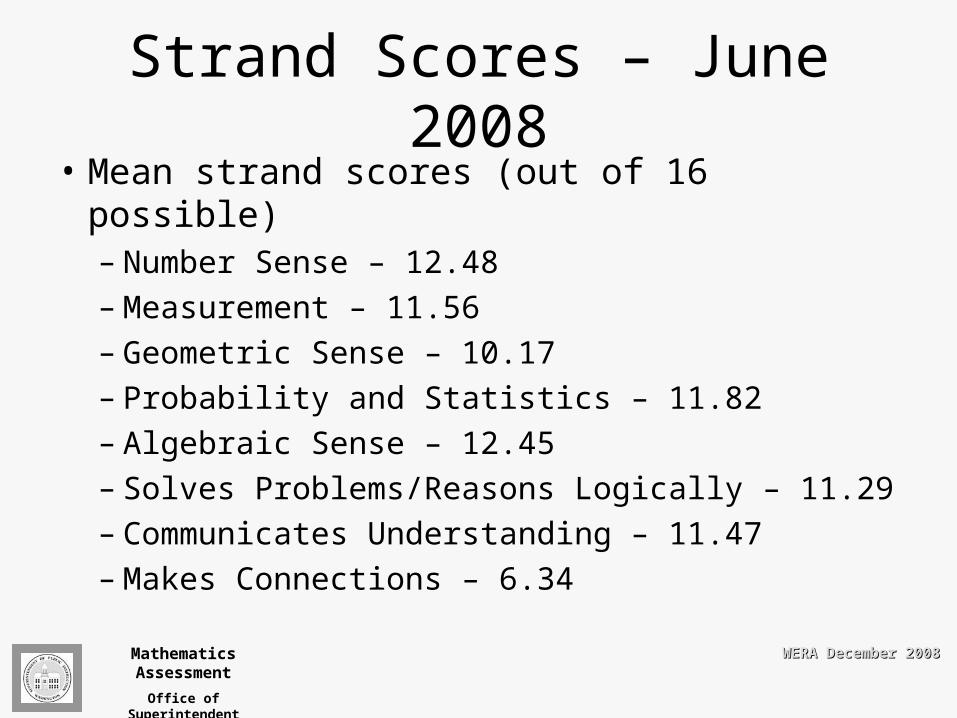
Strand Scores – June 2008• Mean strand scores (out of 16 possible)– Number Sense – 12.48– Measurement – 11.56– Geometric Sense – 10.17– Probability and Statistics – 11.82– Algebraic Sense – 12.45– Solves Problems/Reasons Logically – 11.29– Communicates Understanding – 11.47– Makes Connections – 6.34

WERA December 2008WERA December 2008Mathematics Assessment
Office of Superintendent
of Public Instruction
Collections with Strand Scores of 0
• June 2008 (out of ~2,700 COEs) – Number Sense – 0– Measurement – 2– Geometric Sense – 2– Probability and Statistics – 6– Algebraic Sense – 4– Solves Problems/Reasons Logically – 4– Communicates Understanding – 4– Makes Connections – 256

WERA December 2008WERA December 2008Mathematics Assessment
Office of Superintendent
of Public Instruction
Makes Connections – June 2008• Those COEs with MC strand score of 0– Majority came from 6 school districts• 184 out of the 256 (See District Score Report)
– Number of MC tasks in these 256 collections• 0 MC tasks: 74 collections (0 possible strand points)• 1 MC task: 118 collections (8 possible strand points)• 2 MC tasks: 60 collections (16 possible strand points)• 3 MC tasks: 4 collections (16 possible strand points)

WERA December 2008WERA December 2008Mathematics Assessment
Office of Superintendent
of Public Instruction
June 2008 to February 2009
• COEs with MC strand score of 0– Mean COE score of 70.83– 95 meet standard (37.1% of 256)– 44 are eligible to augment in February
(27.3% of 161 who did not meet standard)
• All COEs– Mean COE score of 87.60– 1,876 meet standard (69.6% of 2, 697)– 285 are eligible to augment in February
(34.7% of 821 who did not meet standard)

WERA December 2008WERA December 2008Mathematics Assessment
Office of Superintendent
of Public Instruction
Contact Information• Anton Jackson, Mathematics Specialist– [email protected]– (360) 725-6437
• Lesley Klenk, COE Administrator– [email protected]– (360) 725-6330
• Amanda Mount, COE Specialist– [email protected]– (360) 725-6037