Embed Size (px)
Citation preview
Centre Number Candidate Number
Surname
Other Names
Candidate Signature
GCSE Mathematics (Calculator Paper) Practice Paper Style Questions – Topic: Scatter Graphs (Higher Tier)
For this paper you must have:
black pen
HB pencil
ruler (with cm & mm)
rubber
protractor
compass
pencil sharpener
calculator
Time allowed
1 hour
Instructions
Use black ink or black ball-point pen. Draw diagrams in pencil.
Fill in the boxes at the top of this page.
Answer all questions.
You must answer the questions in the space provided. Do not write outside the
box around each page or on blank pages.
Do all rough work in this book. Cross through any work that you do not want to
be marked.
Information
The marks for questions are shown in brackets.
The maximum mark for this paper is 32.
The quality of your written communication is specifically assessed in questions
indicated with an asterisk (*)
You may ask for more answer paper and graph paper.
These must be tagged securely to this answer booklet.
A calculator MAY be used.
Advice
Read each question carefully before you answer it.
In all calculations, show clearly how you work out your answer.
Check your answers if you have time at the end.
For Examiner’s Use
Examiner’s Initials
Pages Mark
3
4 – 5
6 – 7
8 – 9
10 – 11
12 – 13
TOTAL
2
There are no questions printed on this page
DO NOT WRITE ON THIS PAGE ANSWER IN THE SPACES PROVIDED
3
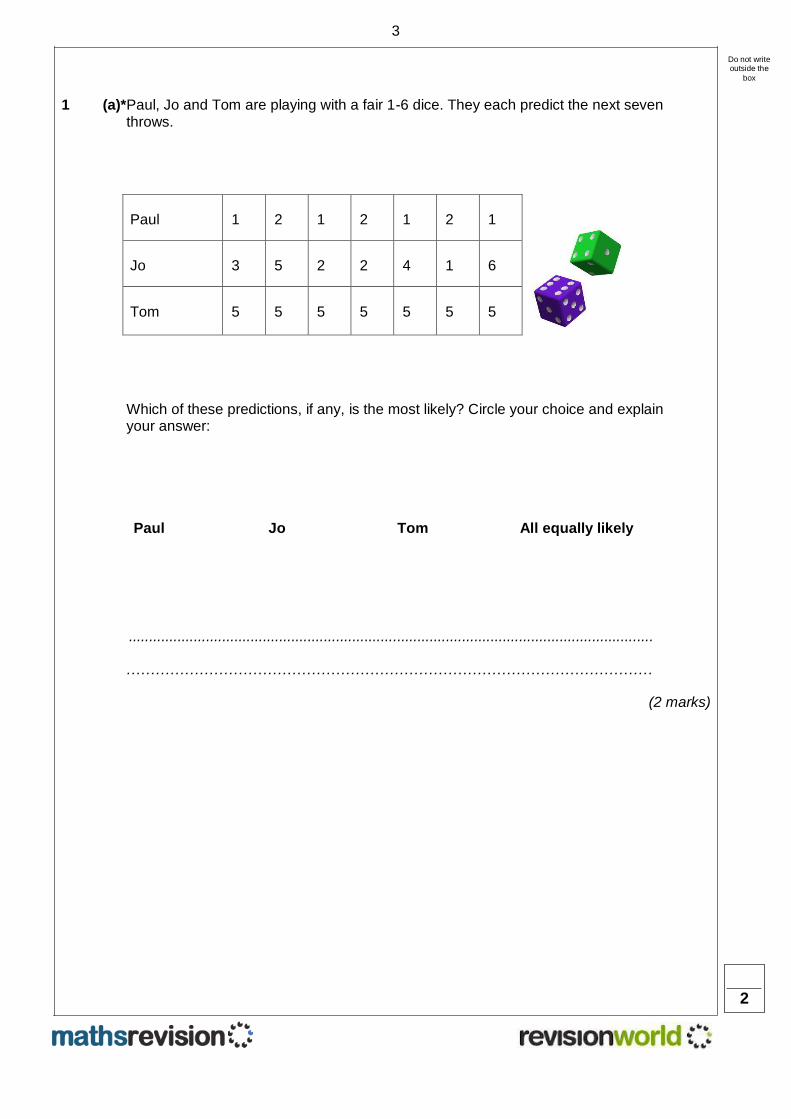
1 (a)* Paul, Jo and Tom are playing with a fair 1-6 dice. They each predict the next seven throws.
Which of these predictions, if any, is the most likely? Circle your choice and explain your answer:
Paul Jo Tom All equally likely
...............................................................................................................................................
…………………………………………………………………………………………………………
(2 marks)
Paul 1 2 1 2 1 2 1
Jo 3 5 2 2 4 1 6
Tom 5 5 5 5 5 5 5
Do not write outside the
box
2
4
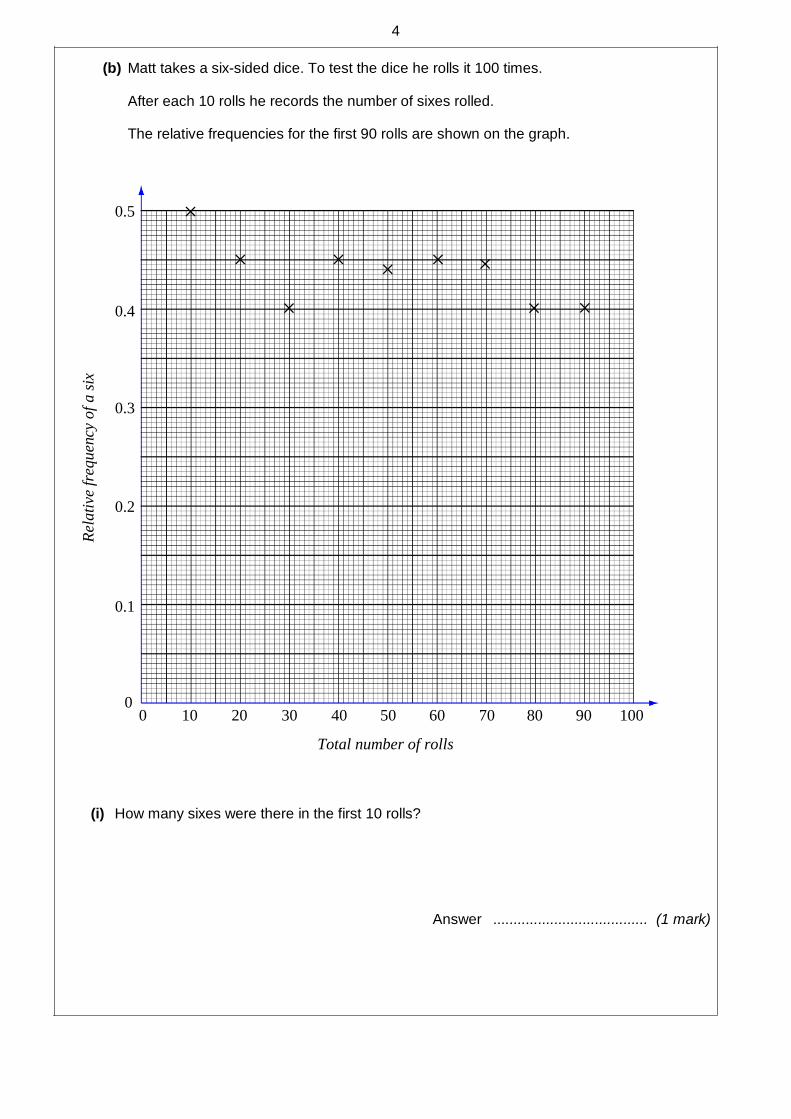
(b) Matt takes a six-sided dice. To test the dice he rolls it 100 times.
After each 10 rolls he records the number of sixes rolled.
The relative frequencies for the first 90 rolls are shown on the graph.
(i) How many sixes were there in the first 10 rolls?
Answer ...................................... (1 mark)
10 20 30 40 50 60 70 80 90 100 0
0.1
0.2
0.3
0.4
0.5
Total number of rolls
Rel
ati
ve f
requen
cy o
f a s
ix
×
×
×
× ×
× ×
× ×
0
5
(ii) After 100 rolls there were 48 sixes.
Calculate and plot the relative frequency of a six after 100 rolls.
(2 marks)
(iii) How many sixes would you expect to get after 100 rolls of a fair dice?
Answer ...................................... (1 mark)
(iv) *Is Matt’s a fair dice?
Tick the correct box.
Give a reason for your answer.
...............................................................................................................................................
…………………………………………………………………………………………………………
(1 mark)
Yes No
5
6
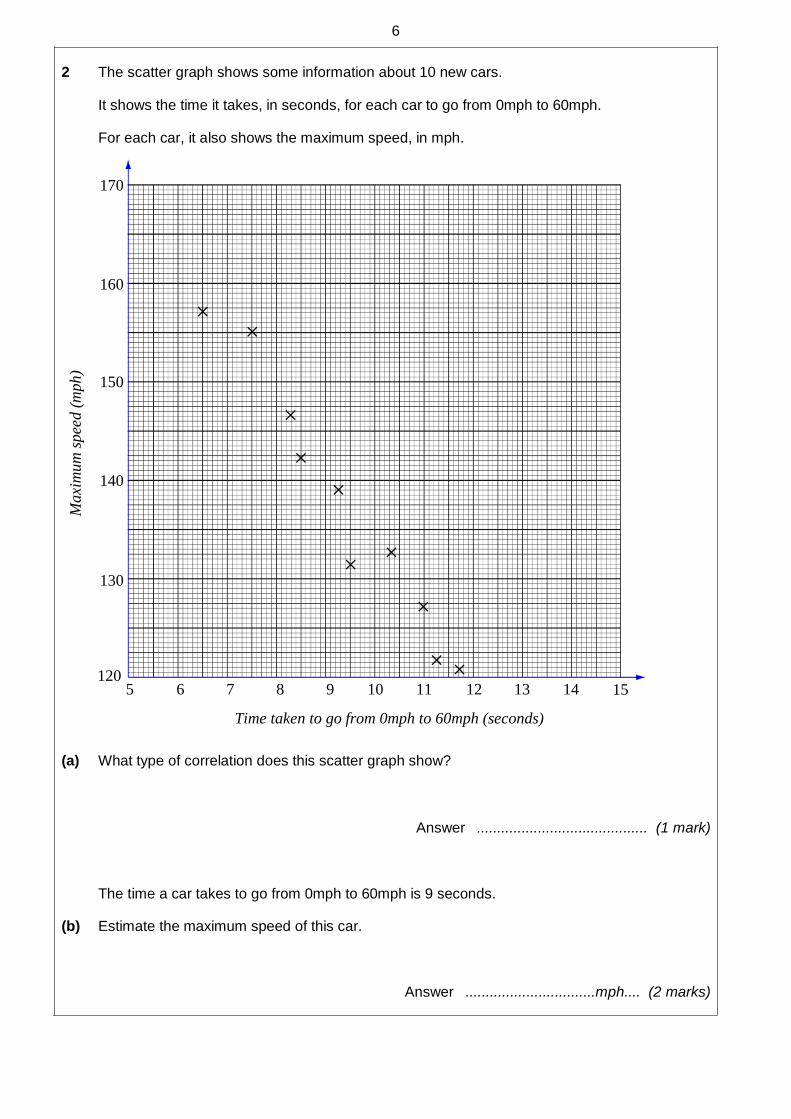
2 The scatter graph shows some information about 10 new cars.
It shows the time it takes, in seconds, for each car to go from 0mph to 60mph.
For each car, it also shows the maximum speed, in mph.
(a) What type of correlation does this scatter graph show?
Answer .......................................... (1 mark)
The time a car takes to go from 0mph to 60mph is 9 seconds.
(b) Estimate the maximum speed of this car.
Answer ................................mph.... (2 marks)
6 7 8 9 10 11 12 13 14 15 5
130
140
150
160
170
Time taken to go from 0mph to 60mph (seconds)
Maxi
mum
spee
d (
mph)
× ×
×
×
×
×
×
×
× 120 ×
7
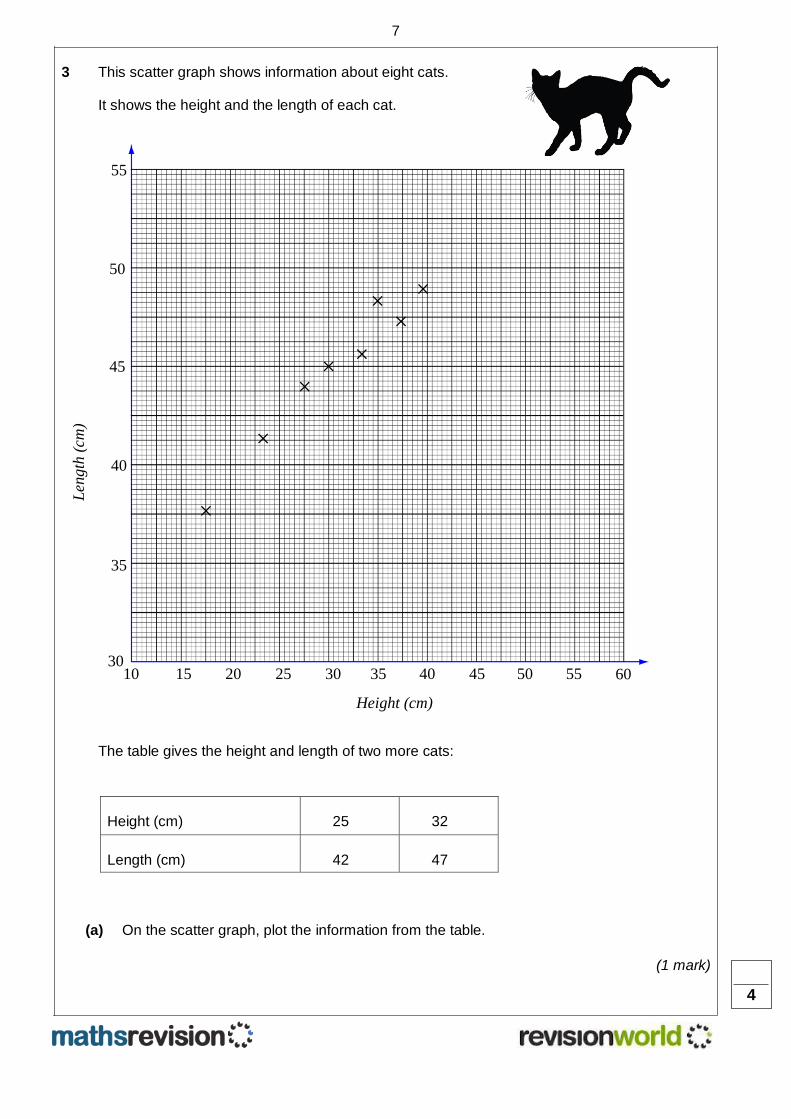
3 This scatter graph shows information about eight cats.
It shows the height and the length of each cat.
The table gives the height and length of two more cats:
Height (cm) 25 32
Length (cm) 42 47
(a) On the scatter graph, plot the information from the table.
(1 mark)
4
15 20 25 30 35 40 45 50 55 30
10
35
40
45
50
55
Height (cm)
Len
gth
(cm
)
×
×
× ×
×
× ×
60
×
8
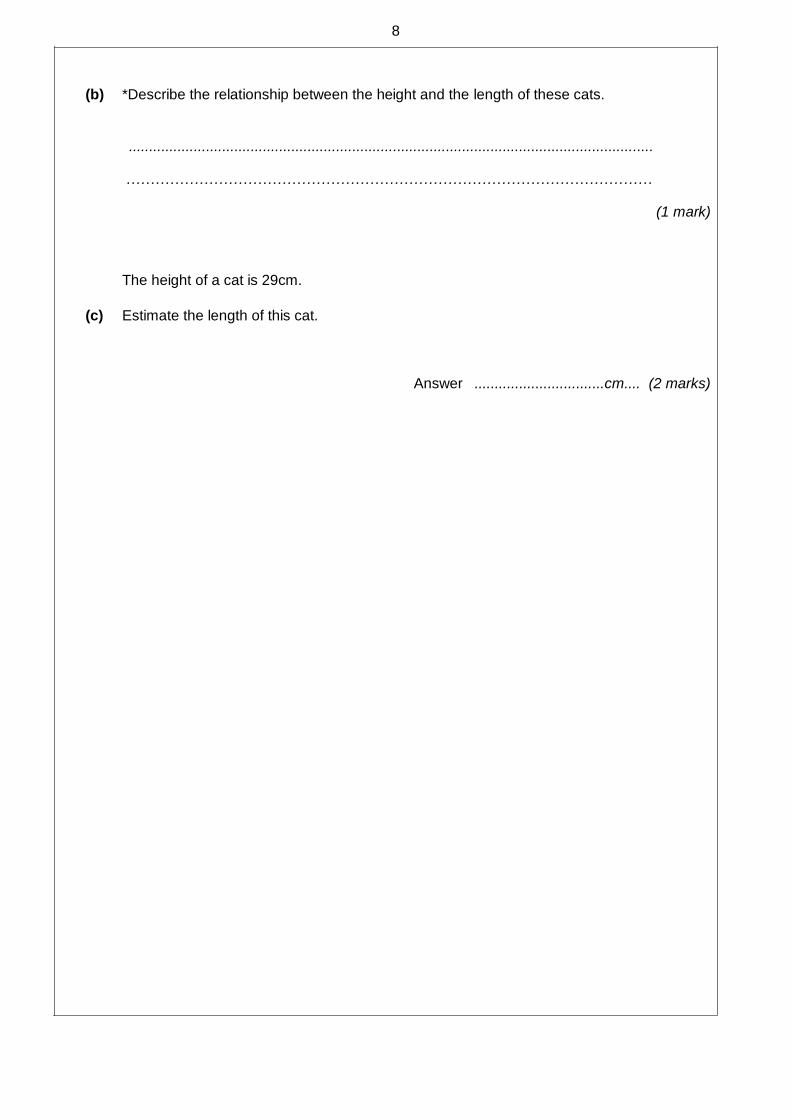
(b) *Describe the relationship between the height and the length of these cats.
...............................................................................................................................................
…………………………………………………………………………………………………………
(1 mark)
The height of a cat is 29cm.
(c) Estimate the length of this cat.
Answer ................................cm.... (2 marks)
marks)
ma
9
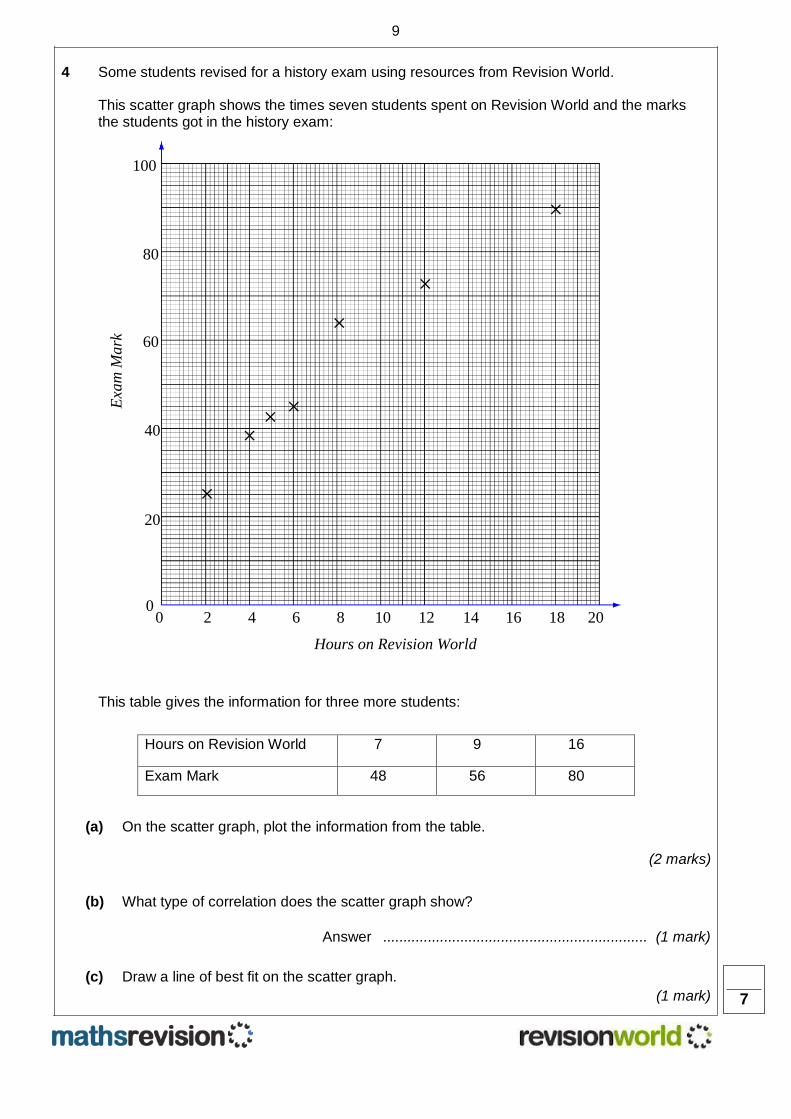
4 Some students revised for a history exam using resources from Revision World.
This scatter graph shows the times seven students spent on Revision World and the marks the students got in the history exam:
This table gives the information for three more students:
Hours on Revision World 7 9 16
Exam Mark 48 56 80
(a) On the scatter graph, plot the information from the table.
(2 marks)
(b) What type of correlation does the scatter graph show?
Answer ................................................................. (1 mark)
(c) Draw a line of best fit on the scatter graph.
(1 mark)
7
2 4 6 8 10 12 14 16 18 0
0
20
40
60
80
100
Hours on Revision World
Exa
m M
ark
×
×
× ×
×
×
×
20
10
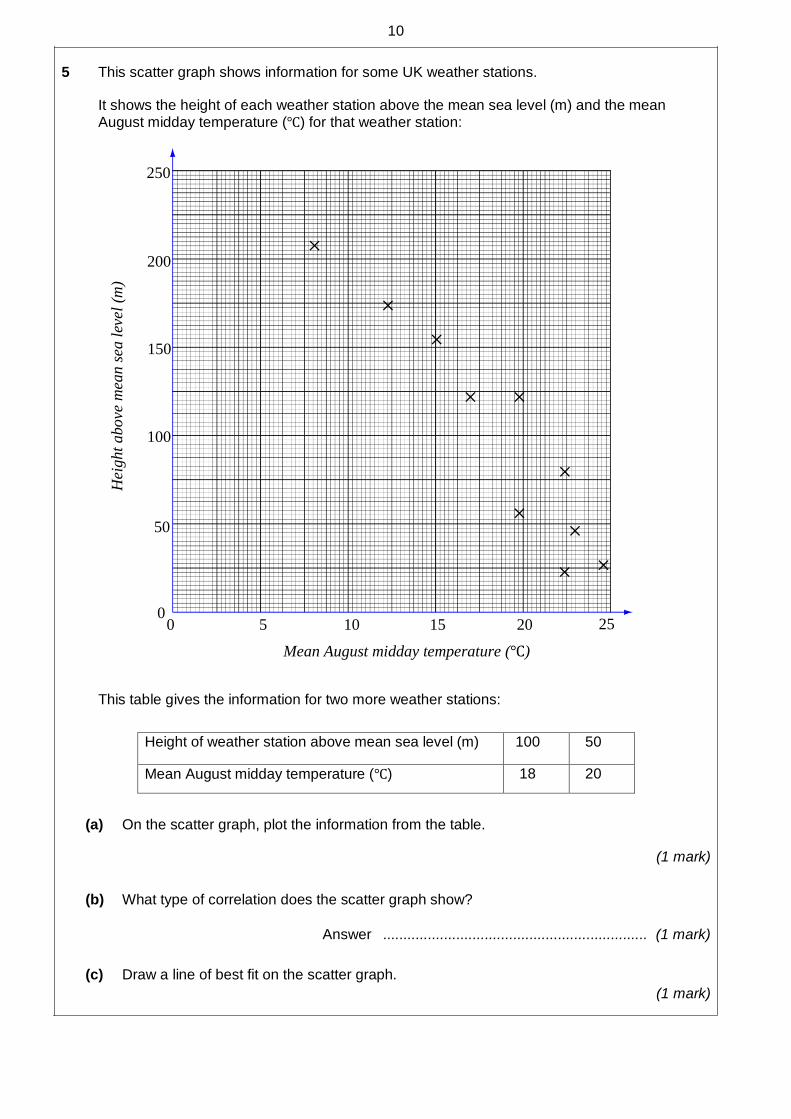
5 This scatter graph shows information for some UK weather stations.
It shows the height of each weather station above the mean sea level (m) and the mean August midday temperature (℃) for that weather station:
This table gives the information for two more weather stations:
Height of weather station above mean sea level (m) 100 50
Mean August midday temperature (℃) 18 20
(a) On the scatter graph, plot the information from the table.
(1 mark)
(b) What type of correlation does the scatter graph show?
Answer ................................................................. (1 mark)
(c) Draw a line of best fit on the scatter graph.
(1 mark)
5 10 15 20 25 0
0
50
100
150
200
250
Mean August midday temperature (℃)
Hei
ght
above
mea
n s
ea l
evel
(m
)
×
×
×
×
×
×
×
×
×
×
11
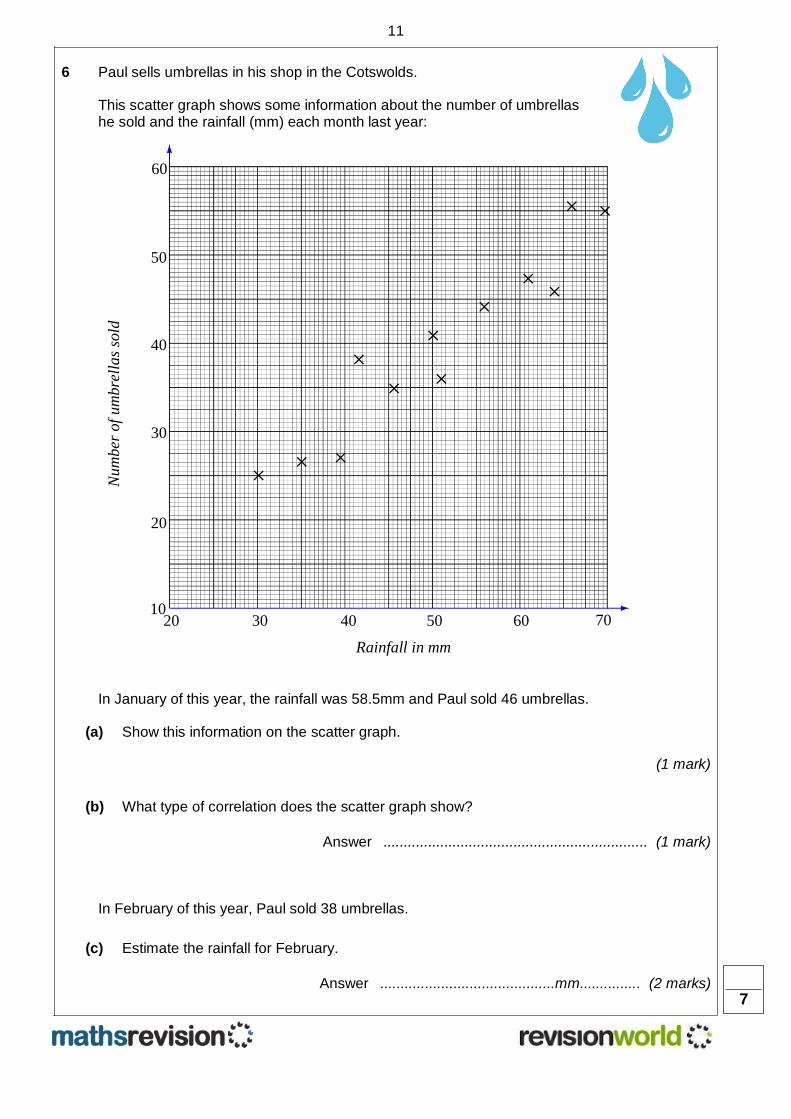
6 Paul sells umbrellas in his shop in the Cotswolds.
This scatter graph shows some information about the number of umbrellas he sold and the rainfall (mm) each month last year:
In January of this year, the rainfall was 58.5mm and Paul sold 46 umbrellas.
(a) Show this information on the scatter graph.
(1 mark)
(b) What type of correlation does the scatter graph show?
Answer ................................................................. (1 mark)
In February of this year, Paul sold 38 umbrellas.
(c) Estimate the rainfall for February.
Answer ...........................................mm............... (2 marks)
30 40 50 60 70 10
20
20
30
40
50
60
Rainfall in mm
Num
ber
of
um
bre
llas
sold
× ×
×
×
× × ×
×
× ×
× ×
7
12
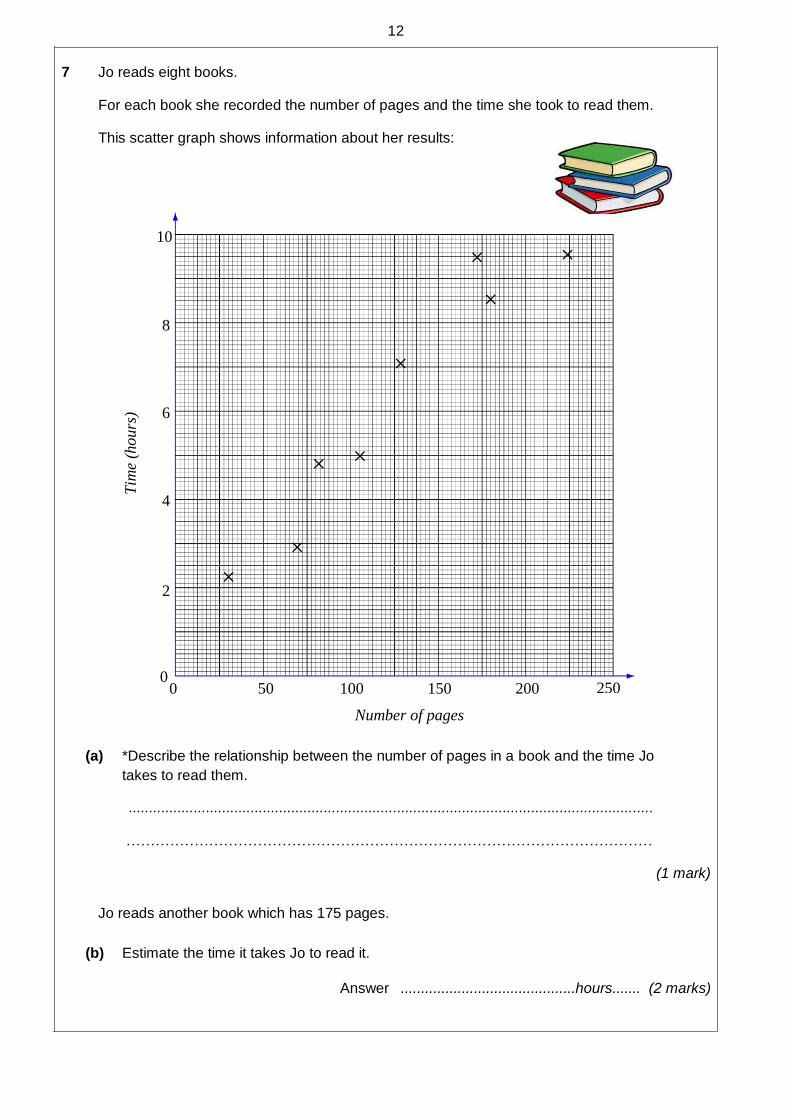
7 Jo reads eight books.
For each book she recorded the number of pages and the time she took to read them.
This scatter graph shows information about her results:
(a) *Describe the relationship between the number of pages in a book and the time Jo
takes to read them.
...............................................................................................................................................
…………………………………………………………………………………………………………
(1 mark)
Jo reads another book which has 175 pages.
(b) Estimate the time it takes Jo to read it.
Answer ...........................................hours....... (2 marks)
50 100 150 200 250 0
0
2
4
6
8
10
Number of pages
Tim
e (h
ours
)
×
×
×
×
×
×
×
×
13
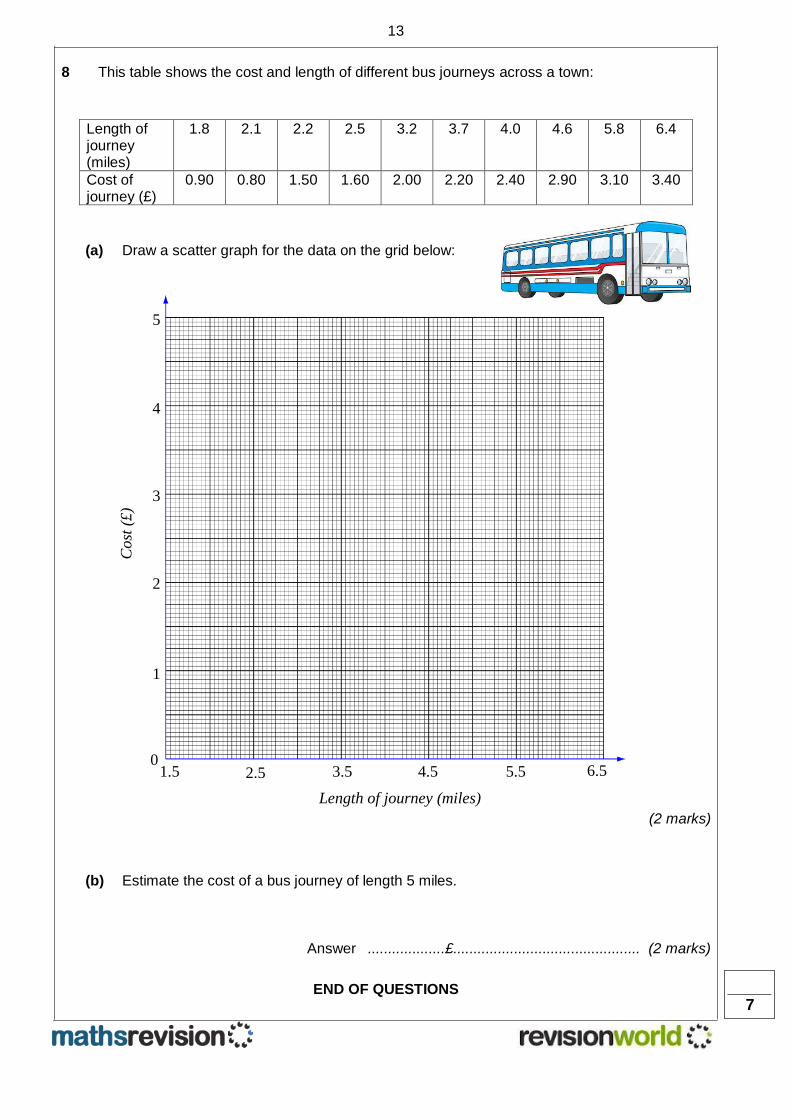
8 This table shows the cost and length of different bus journeys across a town:
Length of journey (miles)
1.8 2.1 2.2 2.5 3.2 3.7 4.0 4.6 5.8 6.4
Cost of journey (£)
0.90 0.80 1.50 1.60 2.00 2.20 2.40 2.90 3.10 3.40
(a) Draw a scatter graph for the data on the grid below:
(2 marks)
(b) Estimate the cost of a bus journey of length 5 miles.
Answer ...................£.............................................. (2 marks)
END OF QUESTIONS
7
2.5 3.5 4.5 5.5 6.5 0
1.5
1
2
3
4
5
Length of journey (miles)
Cost
(£)
14
There are no questions printed on this page
DO NOT WRITE ON THIS PAGE ANSWER IN THE SPACES PROVIDED

15

n