Embed Size (px)
Citation preview
28EP01
Candidate session number
Mathematical studiesStandard levelPaper 1
25 pages
Wednesday 2 May 2018 (afternoon)
1 hour 30 minutes
Instructions to candidates
y Write your session number in the boxes above. y Do not open this examination paper until instructed to do so. y A graphic display calculator is required for this paper. y A clean copy of the mathematical studies SL formula booklet is required for this paper. y Answer all questions. y Answers must be written within the answer boxes provided. y Unless otherwise stated in the question, all numerical answers should be given exactly or
correct to three significant figures. y The maximum mark for this examination paper is [90 marks].
© International Baccalaureate Organization 2018
M18/5/MATSD/SP1/ENG/TZ1/XX
2218 – 7403
Please do not write on this page.
Answers written on this page will not be marked.
28EP02
– 2 – M18/5/MATSD/SP1/ENG/TZ1/XX
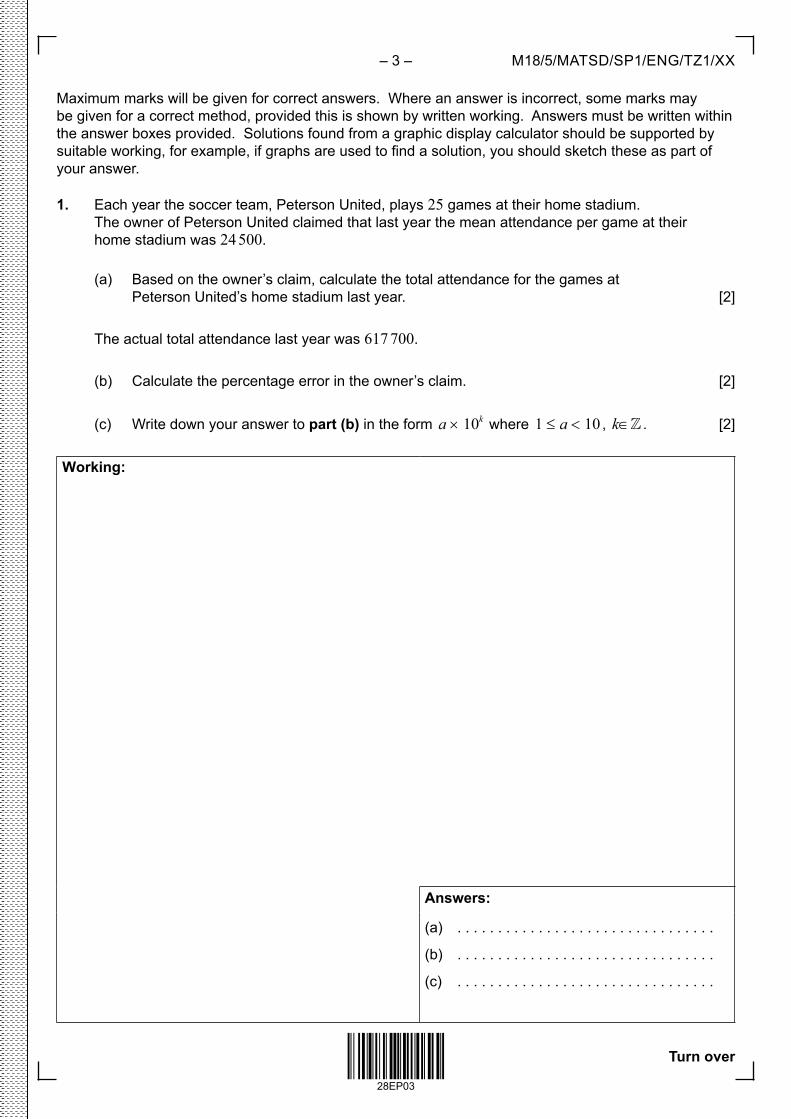
Maximum marks will be given for correct answers. Where an answer is incorrect, some marks may be given for a correct method, provided this is shown by written working. Answers must be written within the answer boxes provided. Solutions found from a graphic display calculator should be supported by suitable working, for example, if graphs are used to find a solution, you should sketch these as part of your answer.
1. Each year the soccer team, Peterson United, plays 25 games at their home stadium. The owner of Peterson United claimed that last year the mean attendance per game at their home stadium was 24 500.
(a) Based on the owner’s claim, calculate the total attendance for the games at Peterson United’s home stadium last year. [2]
The actual total attendance last year was 617 700.
(b) Calculate the percentage error in the owner’s claim. [2]
(c) Write down your answer to part (b) in the form a × 10k where 1 ≤ a < 10 , k∈ . [2]
Working:
Answers:
(a) . . . . . . . . . . . . . . . . . . . . . . . . . . . . . . . .
(b) . . . . . . . . . . . . . . . . . . . . . . . . . . . . . . . .
(c) . . . . . . . . . . . . . . . . . . . . . . . . . . . . . . . .
28EP03
– 3 –
Turn over
M18/5/MATSD/SP1/ENG/TZ1/XX
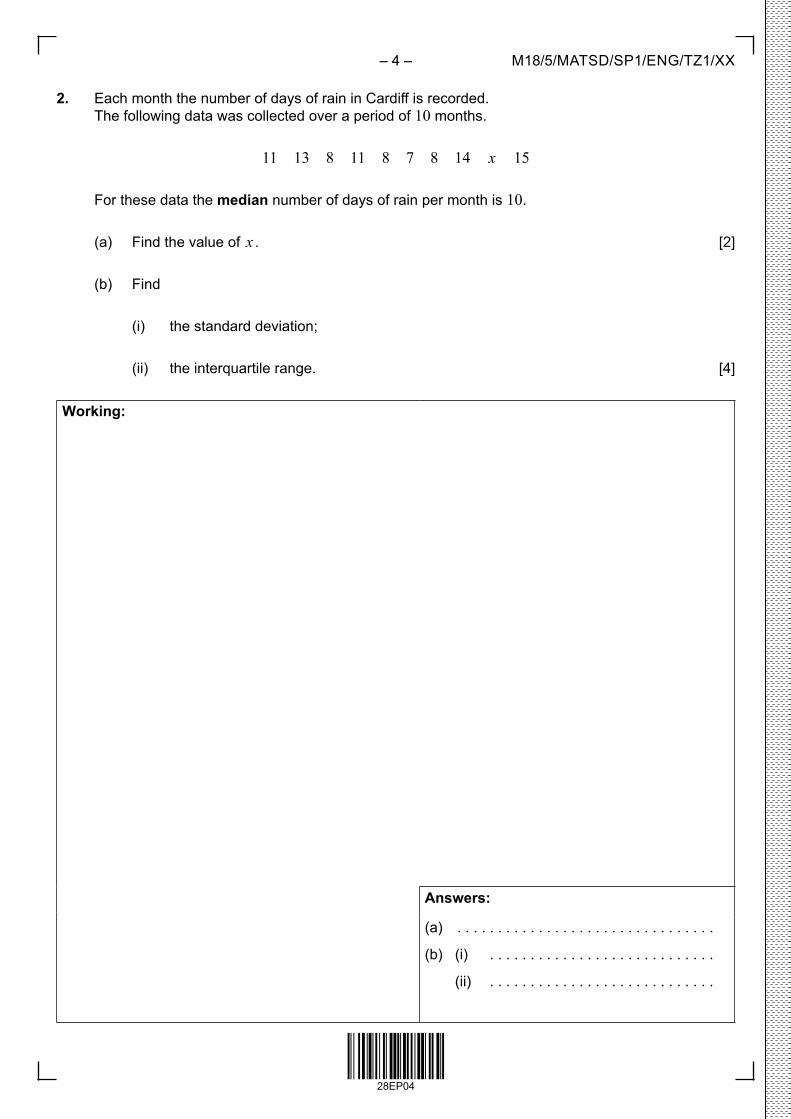
2. Each month the number of days of rain in Cardiff is recorded. The following data was collected over a period of 10 months.
11 13 8 11 8 7 8 14 x 15
For these data the median number of days of rain per month is 10.
(a) Find the value of x . [2]
(b) Find
(i) the standard deviation;
(ii) the interquartile range. [4]
Working:
Answers:
(a) . . . . . . . . . . . . . . . . . . . . . . . . . . . . . . . .
(b) (i) . . . . . . . . . . . . . . . . . . . . . . . . . . . .
(ii) . . . . . . . . . . . . . . . . . . . . . . . . . . . .
28EP04
– 4 – M18/5/MATSD/SP1/ENG/TZ1/XX
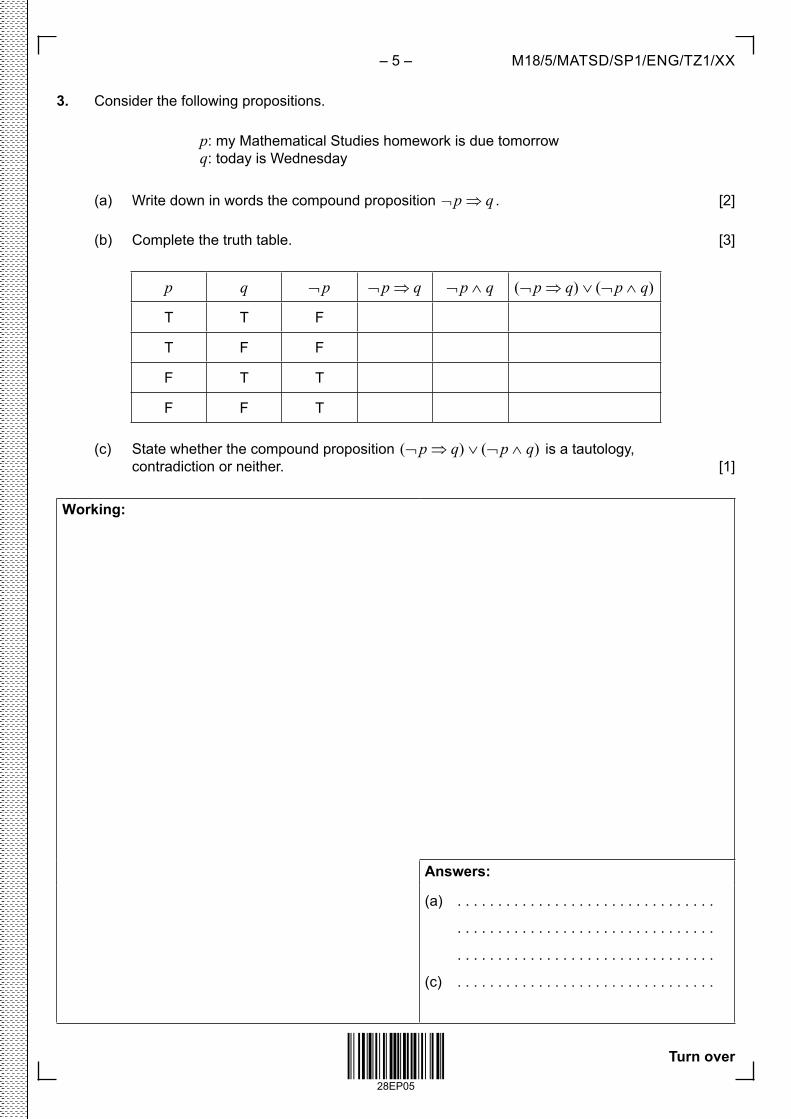
3. Consider the following propositions.
p: my Mathematical Studies homework is due tomorrowq: today is Wednesday
(a) Write down in words the compound proposition ¬ p ⇒ q . [2]
(b) Complete the truth table. [3]
p q ¬ p ¬ p ⇒ q ¬ p ∧ q (¬ p ⇒ q) ∨ (¬ p ∧ q)
T T F
T F F
F T T
F F T
(c) State whether the compound proposition (¬ p ⇒ q) ∨ (¬ p ∧ q) is a tautology, contradiction or neither. [1]
Working:
Answers:
(a) . . . . . . . . . . . . . . . . . . . . . . . . . . . . . . . .
. . . . . . . . . . . . . . . . . . . . . . . . . . . . . . . .
. . . . . . . . . . . . . . . . . . . . . . . . . . . . . . . .
(c) . . . . . . . . . . . . . . . . . . . . . . . . . . . . . . . .
28EP05
– 5 –
Turn over
M18/5/MATSD/SP1/ENG/TZ1/XX
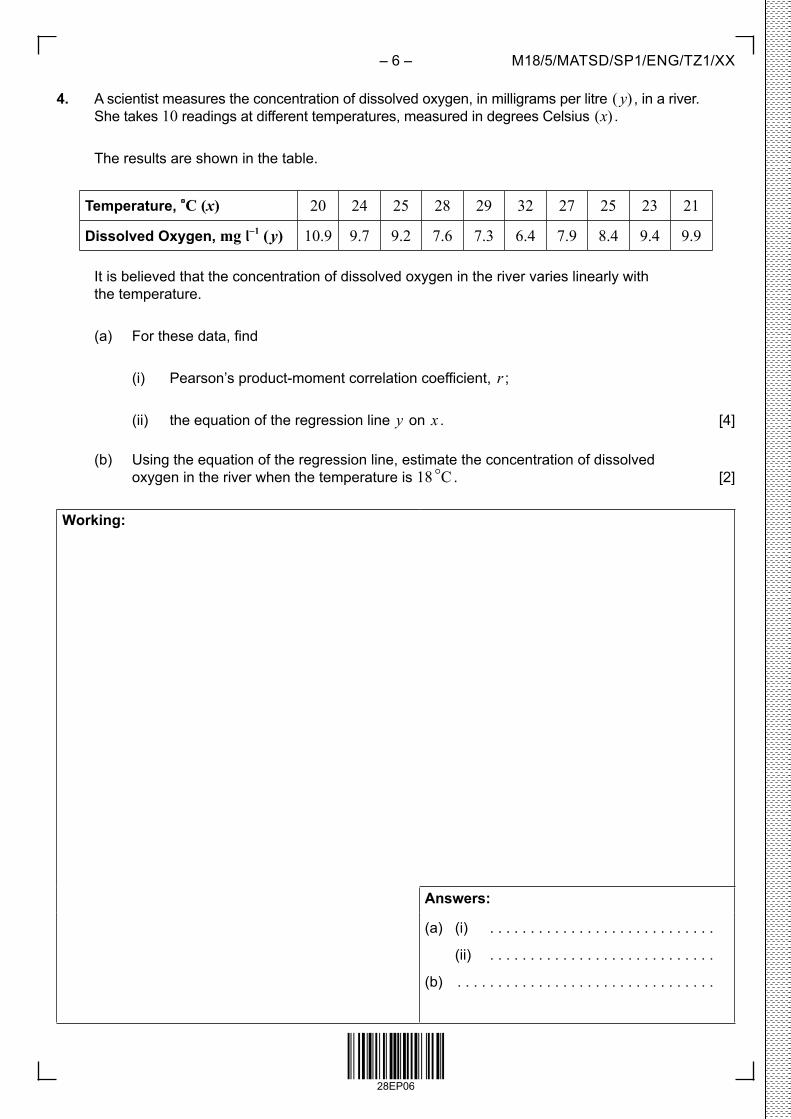
4. A scientist measures the concentration of dissolved oxygen, in milligrams per litre ( y) , in a river. She takes 10 readings at different temperatures, measured in degrees Celsius (x) .
The results are shown in the table.
Temperature, C (x) 20 24 25 28 29 32 27 25 23 21
Dissolved Oxygen, mg l-1 ( y) 10.9 9.7 9.2 7.6 7.3 6.4 7.9 8.4 9.4 9.9
It is believed that the concentration of dissolved oxygen in the river varies linearly with the temperature.
(a) For these data, find
(i) Pearson’s product-moment correlation coefficient, r ;
(ii) the equation of the regression line y on x . [4]
(b) Using the equation of the regression line, estimate the concentration of dissolved oxygen in the river when the temperature is 18 C . [2]
Working:
Answers:
(a) (i) . . . . . . . . . . . . . . . . . . . . . . . . . . . .
(ii) . . . . . . . . . . . . . . . . . . . . . . . . . . . .
(b) . . . . . . . . . . . . . . . . . . . . . . . . . . . . . . . .
28EP06
– 6 – M18/5/MATSD/SP1/ENG/TZ1/XX
5. The point A has coordinates (4 , -8) and the point B has coordinates (-2 , 4) .
(a) Write down the coordinates of C, the midpoint of line segment AB. [2]
The point D has coordinates (-3 , 1) .
(b) Find the gradient of the line DC. [2]
(c) Find the equation of the line DC. Write your answer in the form ax + by + d = 0 where a , b and d are integers. [2]
Working:
Answers:
(a) . . . . . . . . . . . . . . . . . . . . . . . . . . . . . . . .
(b) . . . . . . . . . . . . . . . . . . . . . . . . . . . . . . . .
(c) . . . . . . . . . . . . . . . . . . . . . . . . . . . . . . . .
28EP07
– 7 –
Turn over
M18/5/MATSD/SP1/ENG/TZ1/XX
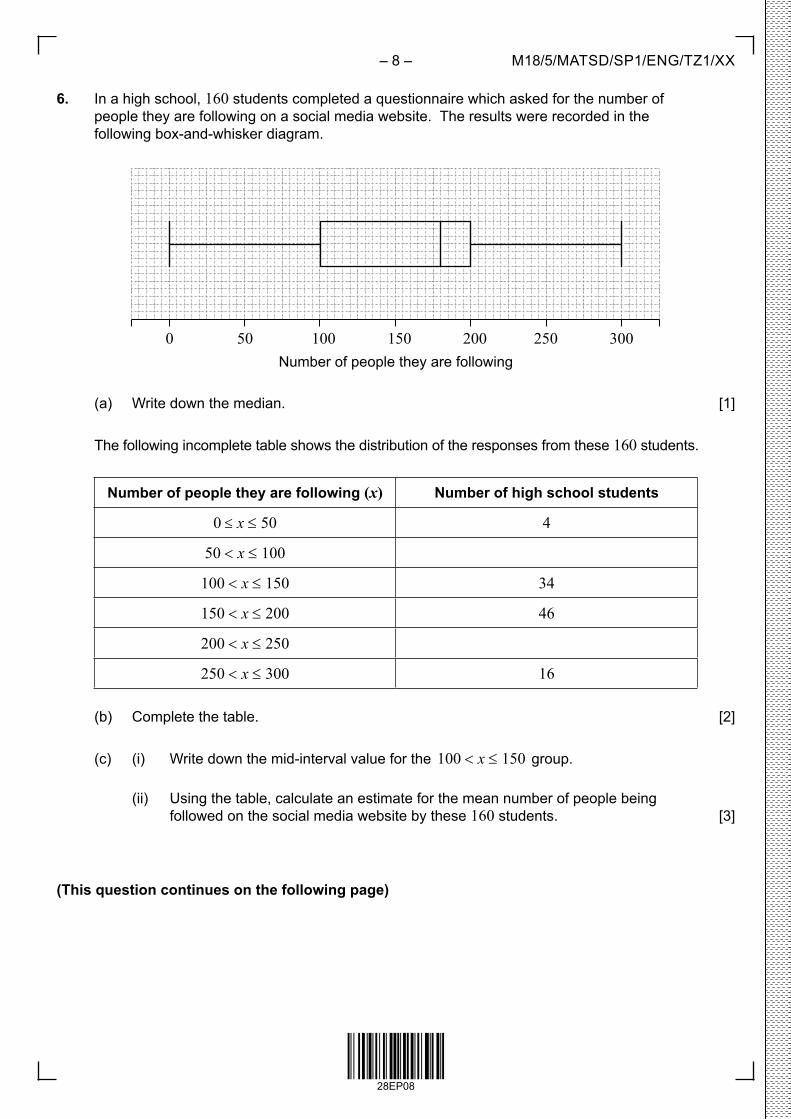
6. In a high school, 160 students completed a questionnaire which asked for the number of people they are following on a social media website. The results were recorded in the following box-and-whisker diagram.
0 50 100 150 200 250 300Number of people they are following
(a) Write down the median. [1]
The following incomplete table shows the distribution of the responses from these 160 students.
Number of people they are following (x) Number of high school students
0 ≤ x ≤ 50 4
50 < x ≤ 100
100 < x ≤ 150 34
150 < x ≤ 200 46
200 < x ≤ 250
250 < x ≤ 300 16
(b) Complete the table. [2]
(c) (i) Write down the mid-interval value for the 100 < x ≤ 150 group.
(ii) Using the table, calculate an estimate for the mean number of people being followed on the social media website by these 160 students. [3]
(This question continues on the following page)
28EP08
– 8 – M18/5/MATSD/SP1/ENG/TZ1/XX

(Question 6 continued)
Working:
Answers:
(a) . . . . . . . . . . . . . . . . . . . . . . . . . . . . . . . .
(c) (i) . . . . . . . . . . . . . . . . . . . . . . . . . . . .
(ii) . . . . . . . . . . . . . . . . . . . . . . . . . . . .
28EP09
– 9 –
Turn over
M18/5/MATSD/SP1/ENG/TZ1/XX

Please do not write on this page.
Answers written on this page will not be marked.
28EP10
– 10 – M18/5/MATSD/SP1/ENG/TZ1/XX
7. Sergei is training to be a weightlifter. Each day he trains at the local gym by lifting a metal bar that has heavy weights attached. He carries out successive lifts. After each lift, the same amount of weight is added to the bar to increase the weight to be lifted.
The weights of each of Sergei’s lifts form an arithmetic sequence.
Sergei’s friend, Yuri, records the weight of each lift. Unfortunately, last Monday, Yuri misplaced all but two of the recordings of Sergei’s lifts.
On that day, Sergei lifted 21 kg on the third lift and 46 kg on the eighth lift.
(a) For that day
(i) find how much weight was added after each lift;
(ii) find the weight of Sergei’s first lift. [4]
On that day, Sergei made 12 successive lifts.
(b) Find the total combined weight of these lifts. [2]
Working:
Answers:
(a) (i) . . . . . . . . . . . . . . . . . . . . . . . . . . . .
(ii) . . . . . . . . . . . . . . . . . . . . . . . . . . . .
(b) . . . . . . . . . . . . . . . . . . . . . . . . . . . . . . . .
28EP11
– 11 –
Turn over
M18/5/MATSD/SP1/ENG/TZ1/XX
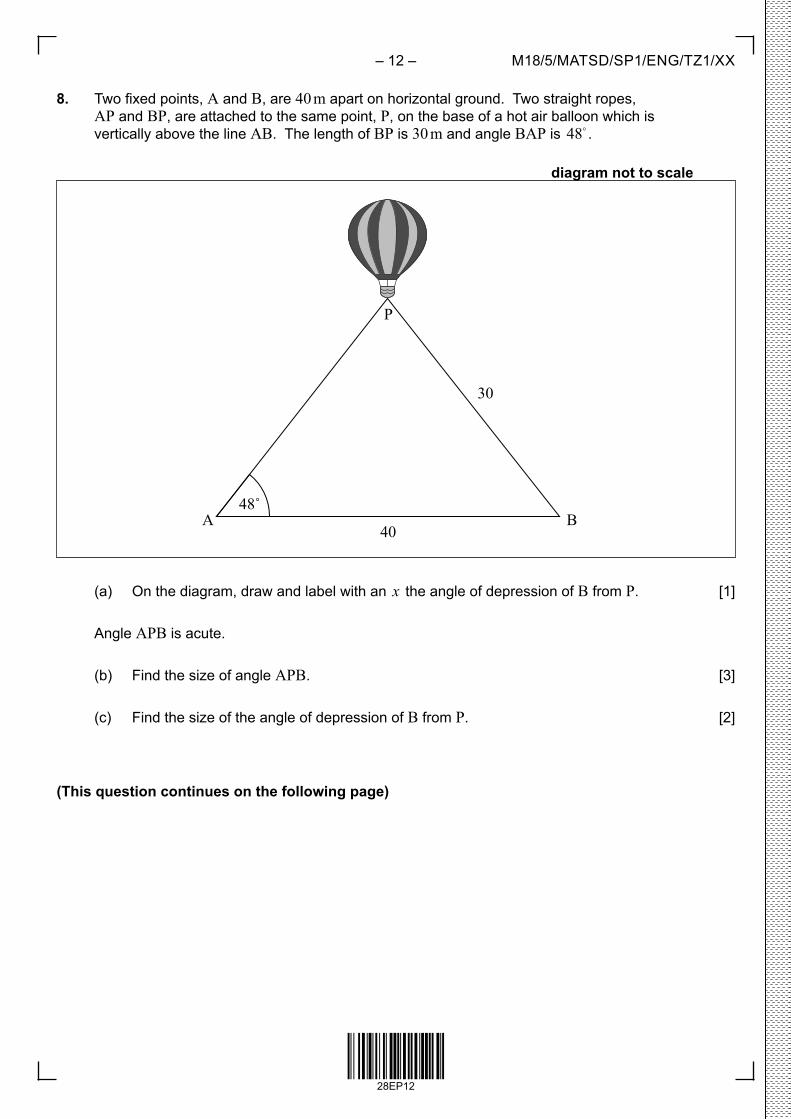
8. Two fixed points, A and B, are 40 m apart on horizontal ground. Two straight ropes, AP and BP, are attached to the same point, P, on the base of a hot air balloon which is vertically above the line AB. The length of BP is 30 m and angle BAP is 48 .
diagram not to scale
48˚
40
30
BA
P
(a) On the diagram, draw and label with an x the angle of depression of B from P. [1]
Angle APB is acute.
(b) Find the size of angle APB. [3]
(c) Find the size of the angle of depression of B from P. [2]
(This question continues on the following page)
28EP12
– 12 – M18/5/MATSD/SP1/ENG/TZ1/XX

(Question 8 continued)
Working:
Answers:
(b) . . . . . . . . . . . . . . . . . . . . . . . . . . . . . . . .
(c) . . . . . . . . . . . . . . . . . . . . . . . . . . . . . . . .
28EP13
– 13 –
Turn over
M18/5/MATSD/SP1/ENG/TZ1/XX

Please do not write on this page.
Answers written on this page will not be marked.
28EP14
– 14 – M18/5/MATSD/SP1/ENG/TZ1/XX
9. In an experiment, a number of fruit flies are placed in a container. The population of fruit flies, P , increases and can be modelled by the function
P (t) = 12 × 30.498t , t ≥ 0 ,
where t is the number of days since the fruit flies were placed in the container.
(a) Find the number of fruit flies
(i) which were placed in the container;
(ii) that are in the container after 6 days. [4]
The maximum capacity of the container is 8000 fruit flies.
(b) Find the number of days until the container reaches its maximum capacity. [2]
Working:
Answers:
(a) (i) . . . . . . . . . . . . . . . . . . . . . . . . . . . .
(ii) . . . . . . . . . . . . . . . . . . . . . . . . . . . .
(b) . . . . . . . . . . . . . . . . . . . . . . . . . . . . . . . .
28EP15
– 15 –
Turn over
M18/5/MATSD/SP1/ENG/TZ1/XX
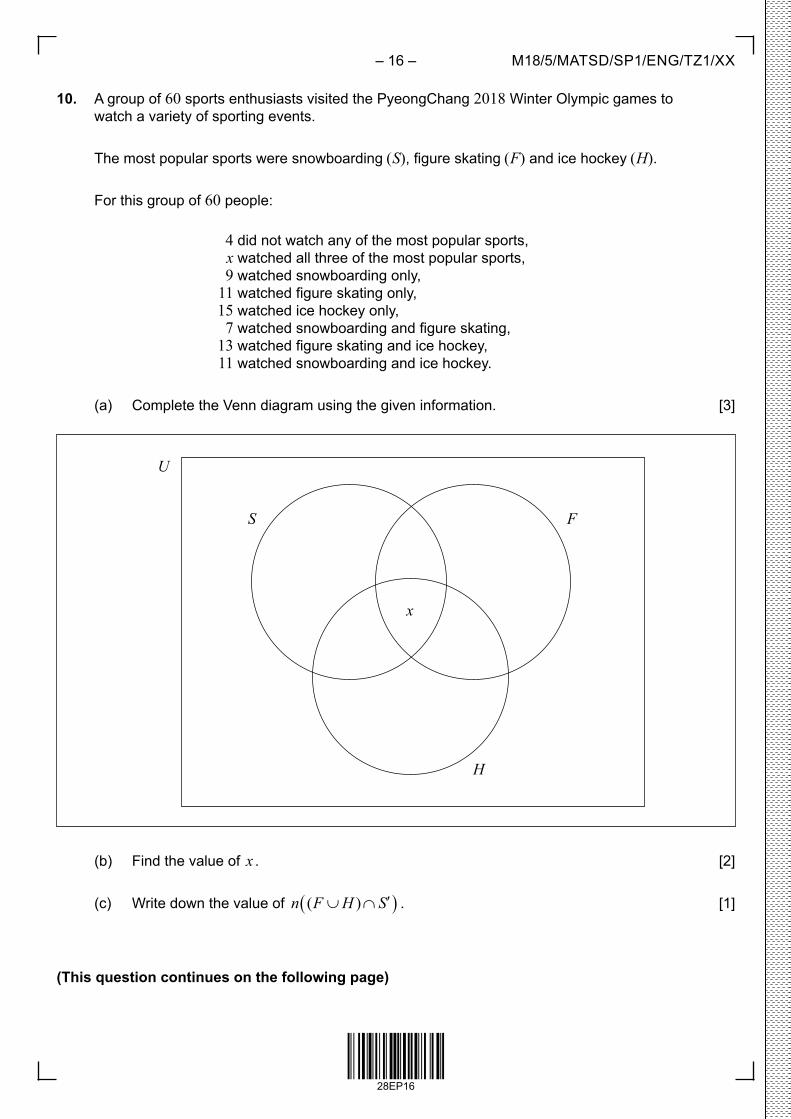
10. A group of 60 sports enthusiasts visited the PyeongChang 2018 Winter Olympic games to watch a variety of sporting events.
The most popular sports were snowboarding (S), figure skating (F) and ice hockey (H).
For this group of 60 people:
4 did not watch any of the most popular sports, x watched all three of the most popular sports, 9 watched snowboarding only, 11 watched figure skating only, 15 watched ice hockey only, 7 watched snowboarding and figure skating, 13 watched figure skating and ice hockey, 11 watched snowboarding and ice hockey.
(a) Complete the Venn diagram using the given information. [3]
U
FS
H
x
(b) Find the value of x . [2]
(c) Write down the value of ( )( )n F H S′∪ ∩ . [1]
(This question continues on the following page)
28EP16
– 16 – M18/5/MATSD/SP1/ENG/TZ1/XX
(Question 10 continued)
Working:
Answers:
(b) . . . . . . . . . . . . . . . . . . . . . . . . . . . . . . . .
(c) . . . . . . . . . . . . . . . . . . . . . . . . . . . . . . . .
28EP17
– 17 –
Turn over
M18/5/MATSD/SP1/ENG/TZ1/XX
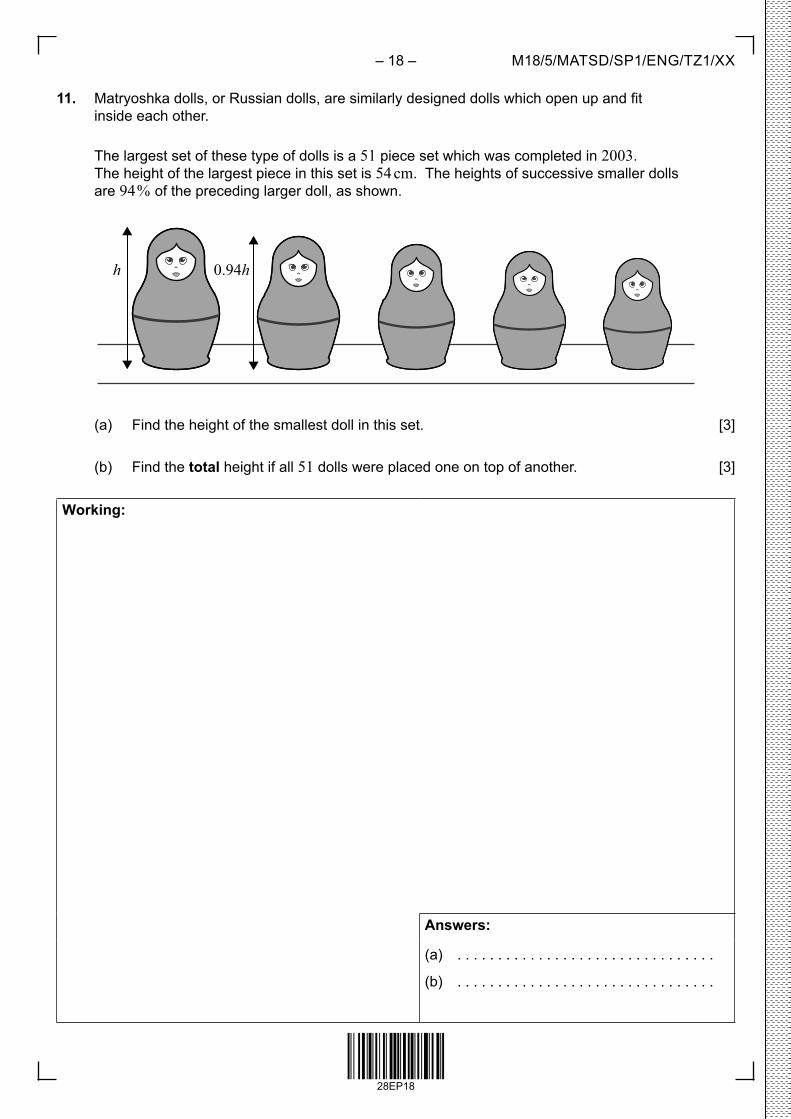
11. Matryoshka dolls, or Russian dolls, are similarly designed dolls which open up and fit inside each other.
The largest set of these type of dolls is a 51 piece set which was completed in 2003. The height of the largest piece in this set is 54 cm. The heights of successive smaller dolls are 94 % of the preceding larger doll, as shown.
h 0.94h
(a) Find the height of the smallest doll in this set. [3]
(b) Find the total height if all 51 dolls were placed one on top of another. [3]
Working:
Answers:
(a) . . . . . . . . . . . . . . . . . . . . . . . . . . . . . . . .
(b) . . . . . . . . . . . . . . . . . . . . . . . . . . . . . . . .
28EP18
– 18 – M18/5/MATSD/SP1/ENG/TZ1/XX
12. Consider the quadratic function f (x) = ax2 + bx + 22 . The equation of the line of symmetry of the graph y = f (x) is x = 1.75 .
(a) Using only this information, write down an equation in terms of a and b . [1]
The graph intersects the x-axis at the point (-2 , 0) .
(b) Using this information, write down a second equation in terms of a and b . [1]
(c) Hence find the value of a and of b . [2]
The graph intersects the x-axis at a second point, P.
(d) Find the x-coordinate of P. [2]
Working:
Answers:
(a) . . . . . . . . . . . . . . . . . . . . . . . . . . . . . . . .
(b) . . . . . . . . . . . . . . . . . . . . . . . . . . . . . . . .
(c) . . . . . . . . . . . . . . . . . . . . . . . . . . . . . . . .
(d) . . . . . . . . . . . . . . . . . . . . . . . . . . . . . . . .
28EP19
– 19 –
Turn over
M18/5/MATSD/SP1/ENG/TZ1/XX
Please do not write on this page.
Answers written on this page will not be marked.
28EP20
– 20 – M18/5/MATSD/SP1/ENG/TZ1/XX
13. Malthouse school opens at 08:00 every morning.
The daily arrival times of the 500 students at Malthouse school follow a normal distribution. The mean arrival time is 52 minutes after the school opens and the standard deviation is 5 minutes.
(a) Find the probability that a student, chosen at random
(i) arrives at least 60 minutes after the school opens;
(ii) arrives between 45 minutes and 55 minutes after the school opens. [4]
A second school, Mulberry Park, also opens at 08:00 every morning. The arrival times of the students at this school follows exactly the same distribution as Malthouse school.
(b) Given that, on one morning, 15 students arrive at least 60 minutes after the school opens, estimate the number of students at Mulberry Park school. [2]
Working:
Answers:
(a) (i) . . . . . . . . . . . . . . . . . . . . . . . . . . . .
(ii) . . . . . . . . . . . . . . . . . . . . . . . . . . . .
(b) . . . . . . . . . . . . . . . . . . . . . . . . . . . . . . . .
28EP21
– 21 –
Turn over
M18/5/MATSD/SP1/ENG/TZ1/XX
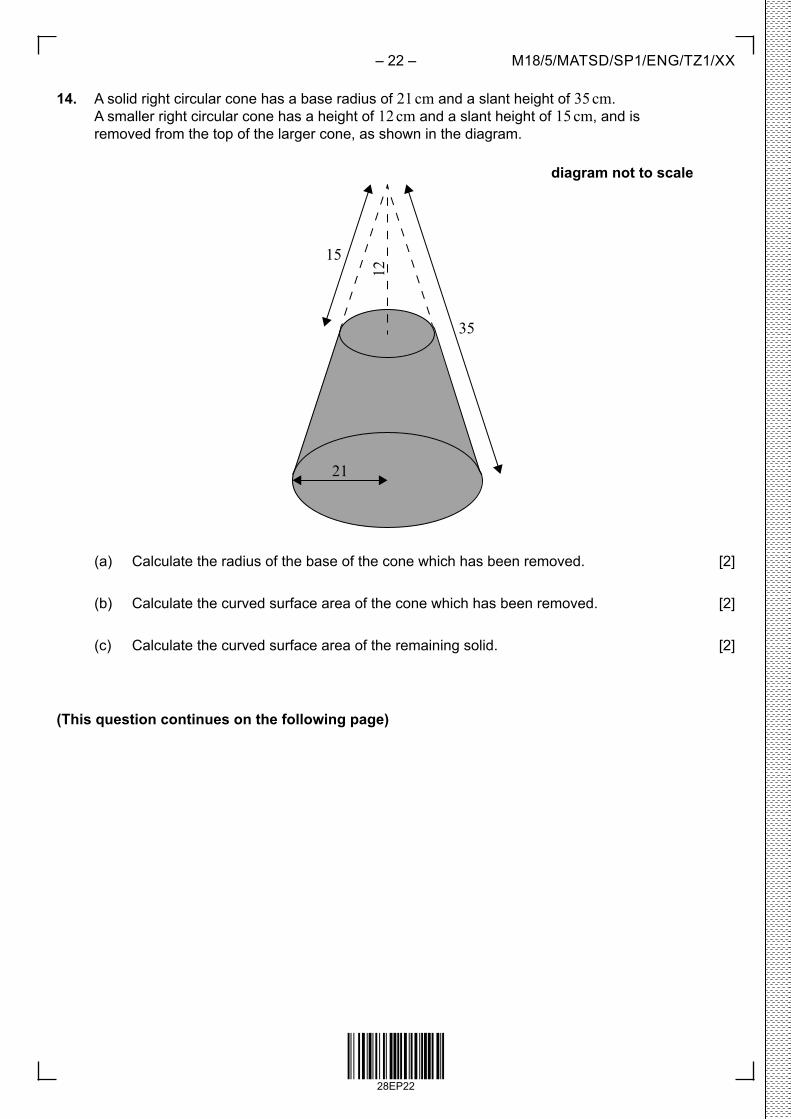
14. A solid right circular cone has a base radius of 21 cm and a slant height of 35 cm. A smaller right circular cone has a height of 12 cm and a slant height of 15 cm, and is
removed from the top of the larger cone, as shown in the diagram.
diagram not to scale
15
12
21
35
(a) Calculate the radius of the base of the cone which has been removed. [2]
(b) Calculate the curved surface area of the cone which has been removed. [2]
(c) Calculate the curved surface area of the remaining solid. [2]
(This question continues on the following page)
28EP22
– 22 – M18/5/MATSD/SP1/ENG/TZ1/XX
(Question 14 continued)
Working:
Answers:
(a) . . . . . . . . . . . . . . . . . . . . . . . . . . . . . . . .
(b) . . . . . . . . . . . . . . . . . . . . . . . . . . . . . . . .
(c) . . . . . . . . . . . . . . . . . . . . . . . . . . . . . . . .
28EP23
– 23 –
Turn over
M18/5/MATSD/SP1/ENG/TZ1/XX
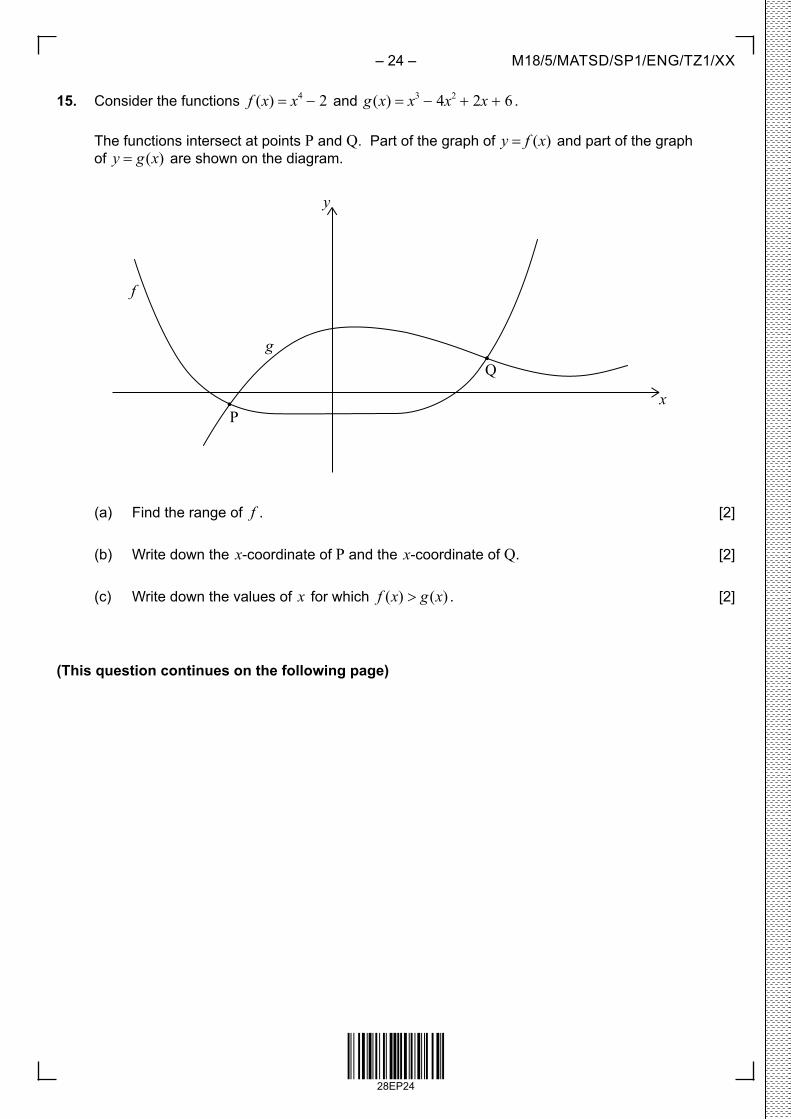
15. Consider the functions f (x) = x4 - 2 and g (x) = x3 - 4x2 + 2x + 6 .
The functions intersect at points P and Q. Part of the graph of y = f (x) and part of the graph of y = g (x) are shown on the diagram.
y
xP
Q
f
g
(a) Find the range of f . [2]
(b) Write down the x-coordinate of P and the x-coordinate of Q. [2]
(c) Write down the values of x for which f (x) > g (x) . [2]
(This question continues on the following page)
28EP24
– 24 – M18/5/MATSD/SP1/ENG/TZ1/XX
(Question 15 continued)
Working:
Answers:
(a) . . . . . . . . . . . . . . . . . . . . . . . . . . . . . . . .
(b) . . . . . . . . . . . . . . . . . . . . . . . . . . . . . . . .
(c) . . . . . . . . . . . . . . . . . . . . . . . . . . . . . . . .
. . . . . . . . . . . . . . . . . . . . . . . . . . . . . . . .
28EP25
– 25 – M18/5/MATSD/SP1/ENG/TZ1/XX

28EP26
Please do not write on this page.
Answers written on this page will not be marked.

28EP27
Please do not write on this page.
Answers written on this page will not be marked.

28EP28
Please do not write on this page.
Answers written on this page will not be marked.