Embed Size (px)
Citation preview
22S:30/105, Statistical Methods and ComputingSpring 2014, Instructor: Cowles
Midterm 3
Show your work on any problems that involve calculations. "JtfName: __""-2,J/~~(..,j/'::7'~-::" Course no. (30 or 105)
1'](iI(:~c4-
i I ,..-
1. We wish to estimate p, the population proportion of likely voters who believe thestate of the economy is the most urgent national concern. We want a 99% confidenceinterval with a W.a.rgirL9f error no greater than .02. How many likely voters must be--------,--,-------surveyed? (Assume that you have no idea of the value of p. Show your work.) ,/ ' ~ .- I" \. . c- C ' L . , ~- \
,.,. _~.J ::>\ ~ -;_.( ;..\. )l\ ._( [JC~)
<;
2. Starting in the 1970s, medical technology allowed babies with very low birth weight(VLBW, less than about 3.3 pounds) to survive without major handicaps. A long-term study has followed 242 VLBW babies to age 20 years, along with a control groupof 233 babies from the same population who had normal birth weight. At age 20, 179of the VLBW group and 193 of the control group had graduated from high school.
(a) This is an exam pie of (circle one):.•.".''" .....''"'.'~~--'----~--.<. i. an observational study""_·ii."';';~;;-do'~i-;';:r~ontroned'study'--
iii. a nonrandomized experimentiv. a matched-pairs experiment
(b) You wish to use these data to assess whether a smaller proportion of VLBWpeople than normal-birth-weight people graduate from high school by age 20.Write the hypotheses that you will test. Use conventional statistical symbols.Define the symbols that you use.
£'J~'D.I} -',.:r--1/
1'1\
o\
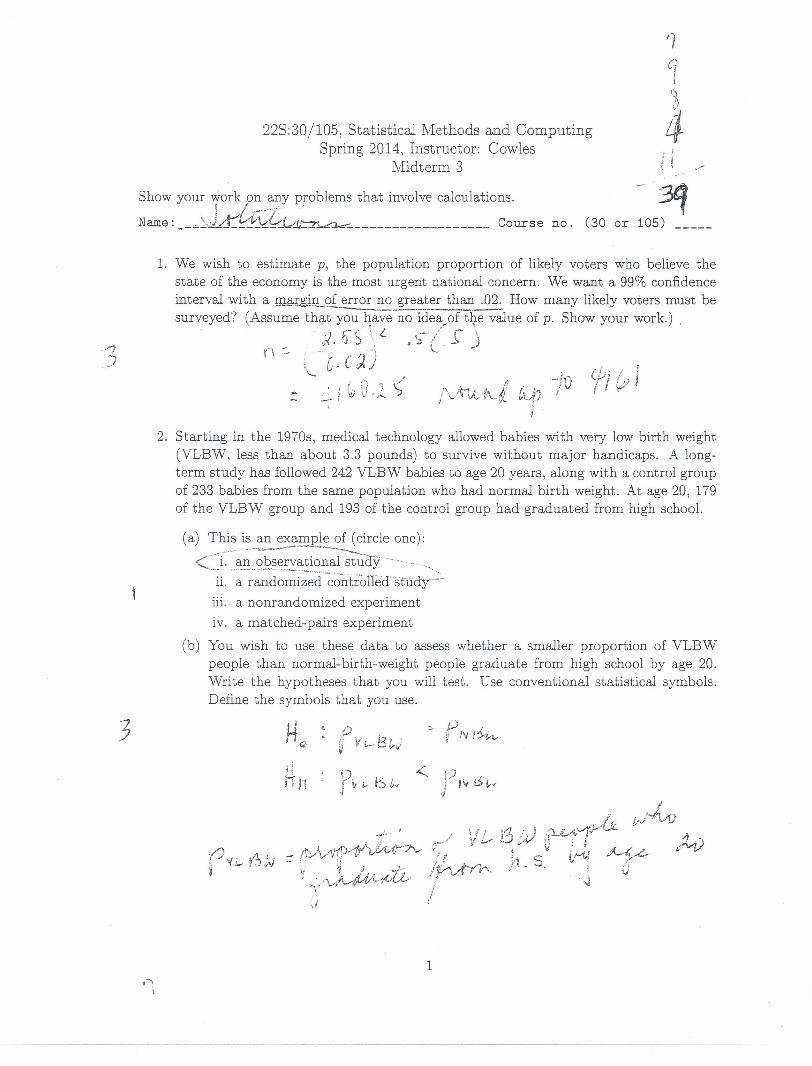
(c) Which of the following statistical tests could be used to test the hypotheses?Circle all that apply.
~~- ------rr:-- F test=:=-==--------- -- -iii. one sample t testiv. paired t testv. two-independent-sample t test
Cvi. zt::~~(d) In the same study, IQ scores were available for 113 men in the VLBW group and
for 106 men in the normal-birth-weight group. You wish to use these data to testwhether the average IQ is lower in the population of VLBW men than amongcontrol men from similar backgrounds. Write the hypotheses that you will test.Use conventional statistical symbols. Define the symbols that you use.
H 0; LL ~L p~h; - tk I~divf+ i /.
(\ , //,<-- v L-- t'; iN <=/'i ...;.."" i"t;/ / IV ~
(e) Which of the following statistical tests could be used to test the hypotheses aboutIQs? Circle all that apply.
1. Chi square testii. F testiii. one sample t testiv. paired t test
c:0o--independent-sample ~vi. z test ----
2
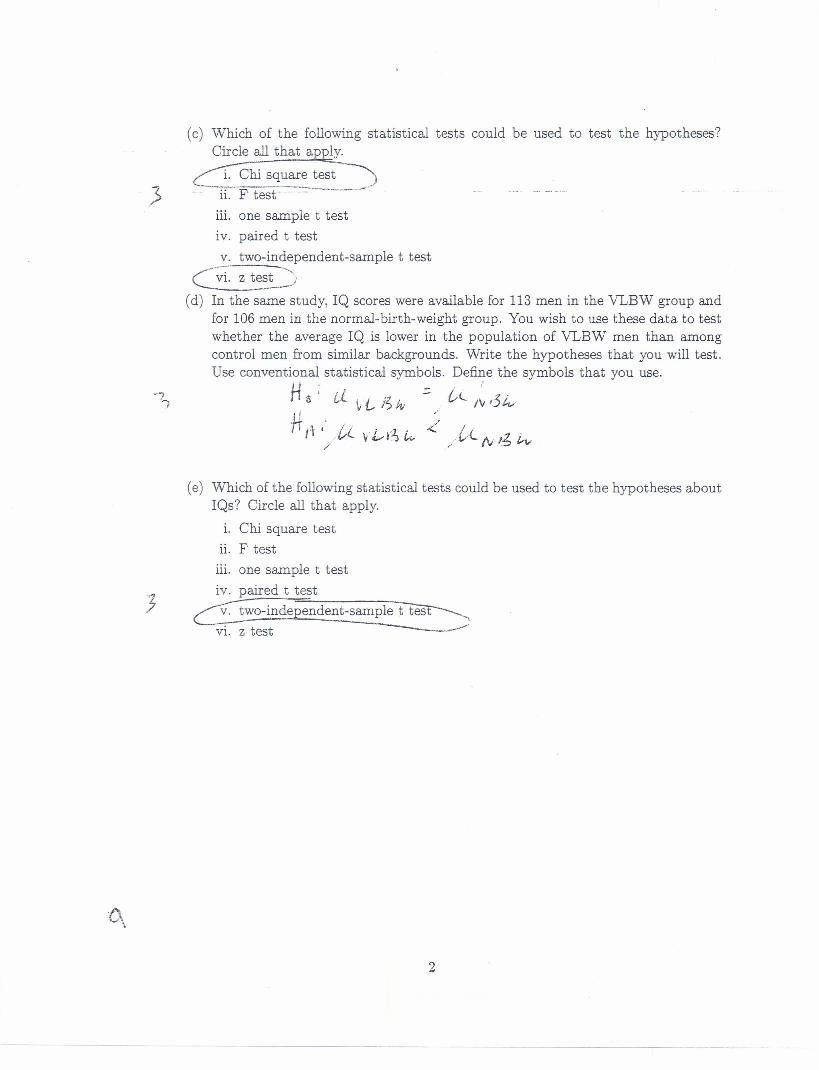
3. Drug-detection dogs have long been used to sniff out illegal drugs at border crossing,airports, and similar locations. Dogs are big and expensive to maintain. Rats aresmall and cheap. A study investigated whether rats could be trained to replace dogsin drug-detection work. In one study, rats were trained to rear up on their hind legswhen they smelled simulated cocaine. After training, each rat was let loose on asurface with many cups sunk in it, one of which contained simulated cocaine. Fourout of six trained rats succeeded in 80 out of 80 trials.
This problem concerns how we should estimate the long-term success rate p of anindividual rat that succeeds in everyone of 80 trials.
(a) Find the rat's sample proportion p and the 95% confidence interval for p.meric answer; show your work.)f z: __8"_Q-
9 .8 0.._-I (1- D)
z: , -. f.--.-J- V ..j /-1i
(Nu-
5. t ..:. C
(b) Find the plus-four estimate p and the plus-four 95% confidence in~erval for p.(Numeric answers; show your work.)&2
;; r; - g (T" -=, f'l~; e. -:;- •• I:£J(/- ,176) --=Y ~=-tv:
c I ..
f1? + /,16(O.0Ih7') ~O /IY 5~/')
./
0/67"
cc' c, -
(c) Comment briefly on w~ich result is more reasonable.
,j/\..ii- IJ·L"'L-J.. -j.,/"",\... t J- /i L /"La. ./ \.-L-ri,....,L.-.:-1' Lr-... ,{tLtj .., . /
~k:v~~ YlJ 'jjlJL ~~1-~ U ~ -L~vfgrLK( ~ U'Y' -j-~nr~ c.. L ~
4. Res\archers asked children in 4th, 5th, and 6th grade whether good grades, athleticability, or popularity was their most important goal. We wish to use the data theygathered to assess whether the 4th graders' choices are different from 5th graders'choices.
Reference: Chase, M.A and Dummer, G.M. (1992), "The Role of Sports as a SocialDeterminant for Children," Research Quarterly for Exercise and Sport, 63, 418-424.
The table below summarizes the data for the 4th and 5th graders in the study ..I
3
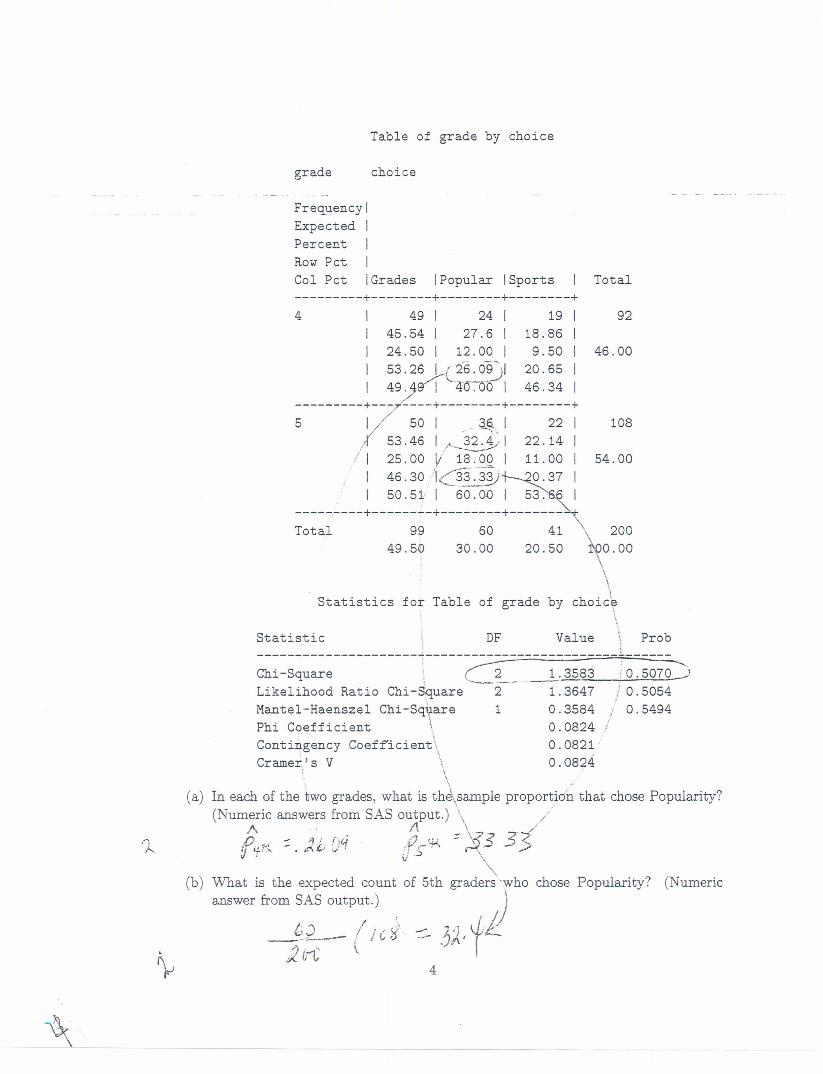
Table of grade by choice
grade choice
Frequency 1
Expected 1
Percent 1
Row Pct 1
Col Pct 1 Grades IPopular ISports Total---------+--------+--------+--------+4 1 49 1 24 1 19
1 45.54 1 27.6 1 18.861 24.50 1 12.00 1 9.501 53.26 1 (26.0~1 20.651 49 .4~ 4;0--.-00 1 46 . 34
---------+--~--+--------+--------+5 1// 50 _ 3~, 1 22 1
.r 53.46 I~·I 22.14 1/ 1 25.00 V 18. OQ 1 11. 00 1 54.00
. 1 46 . 30..' t,~:.:~~~.-3J;:---s. ~~ 1
. 1 50.51 1 60.00 ~ 53.,1---------+------~-+--------+-------~Total 99 60 41 \ 200
49.50 30.00 20.50 rDO.OO\\
Statistics for Table of grade by choic\\
92
46.00
108
Statistic DF\
Value \ Prob
(b)
Chi-Square ,G-Likelihood Ratio Chi-~uare 2Mantel-Haenszel Chi-Sqvare 1Phi Coefficient \. ,Contingency Coefficient\
. \CrameL's V \. \
'. \ J'
(a) In each of the two grades, what is thE\sample proportion that chose Popularity?(Numeric answers from SAS output.) \ /
A' /\ \ . /.n . - ;j: f,U . .0 '.i.< z: t{ < 3<-fir I.! ]., - "''''' if.) :.J ! ;r t" . , M .- /r: . U.,:) \
',,-What is the expected count of 5th graders 'who chose Popularity? (Numericanswer from SAS output.) )
/ C f J_~2_ .I l c 'i, ~ 3~' .e:1n" \. '
,7\. Ii V
---------------------~-------------------------~------1.35831. 36470.35840.08240.08210.0824
; --.....jO.5QlQ..-l
j 0.50540.5494
4
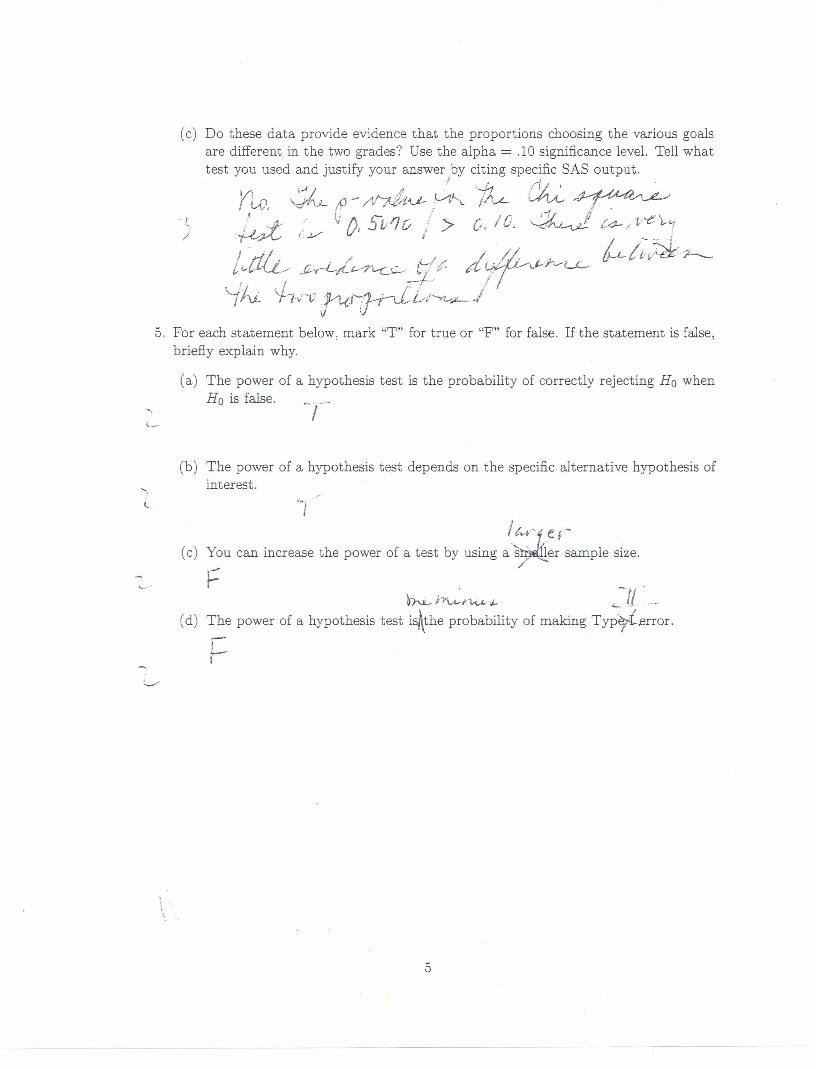
(c) Do these data provide evidence that the proportions choosing the various goalsare different in the two grades? Use the alpha = .10 significance level. Tell whattest you used and justify your answer by citing specific SAS output.
j -~. ~' .V} ,..-! I.. /l1--.t.1 .•,.1 1"."J..;' CA A ./L4A..A.A:I/'~I LV, \JP\.l- r9" / iI p.i/!-'\.fo" :,- v \. ....,L. V\../"- 1 - -- ,I . , . ;1/ I'..jh;;t ,':J./ V 0, 5£..1[/ ,/ » c. /0, '<ftv-v.!.. t4- /'Ir.-t:';.,.'1
I !-II. . I .r/. '-'- !;~v~"~~~<{.L/ ~'-~~ -;-ct'" d';j~L£
I rv... V-1""; 1) ..1~t'-.1.-ir-J.,Lr.''-r....-;.'-_ iJ .i :
. I-',/
5. For each statement below, mark "T" for true or "F" for false. If the statement is false,briefly explain why.
(a)
-,l._
(b)-,
c.
(c)
'- .
(d)
......,
'-../
The power of a hypothesis test is the probability of correctly rejecting Ho whenHo is false.
The power of a hypothesis test depends on the specific alternative hypothesis ofinterest.
!t."~·-1ef~You can increase the power of a test by using a'~J1er sample size..- /1-
bN.- rr:.•..r~.J.. 4..-(1 -The power of a hypothesis test is~the probability of making Typ¥-.error.-t-
5