Embed Size (px)
Citation preview
Mathematical optimization of the main water
distribution system city of Hanoi, Vietnam
R.G. Cembrowicz,* S. Ateg," K.M. Nguyen^
"Institut Wasserbau und Kulturtechnik, University of Karlsruhe,
76 128 Karlsruhe, Germany
Design Company Water Supply and Sanitation, Hanoi, Vietnam
Abstract
Many expanding cities in developing countries suffer from insufficienttechnical infrastructures. Water supply is considered with priority toimprove environmental conditions. The greater part of any cost of urbanwater supply is due to distribution. Network rehabilitation aims at flowand pressure improvements, leakage and quality control, systems design.With scarce finances, limited trained personnel, with climate, customsand traditions different from foreign standards systems analysis becomesa mandatory tool. Whereas various simulation models are available, fewmethods of network optimization exist capable to treat large systems.Hence, an optimization program will be presented suited to planning inpractice and to include desirable citeria. The program is based upon asequence of algorithmic steps encompassing a decomposition principlefrom Graph Theory, Linear Programming, Evolution Strategies. Theplanning application to the city of Hanoi refers to the year 2010. Takinginto account uncertain future data, emphasis was placed upon sensitivityanalyses sometimes regarded the true benefit of optimization. The resultsshow the corresponding impact of parameter changes upon the design.Different future scenarios can be investigated in support of the finalplanning decision.
1 Introduction
In water supply network modeling, so far two areas have attractedpriority attention. First, historically, network simulation was introducedto calculate flows and head losses of an existing system. Methods for thispurpose date back fifty years [1]. Meanwhile, substantial mathematicaland algorithmic sophistication has been added [2,3]. Software packagesare available handling large networks, counting boosters and valves,pumps and standpipes. Computer programs, supported by graphics anddata bank functions extend the simulation to include dynamic systemsbehaviour of control and consumption, of time-variant change and travelof constituent concentrations in the network. Simulation, analysing thehydraulic performance, has become a powerful tool serving several ends.
Transactions on Ecology and the Environment vol 12, © 1996 WIT Press, www.witpress.com, ISSN 1743-3541
164 Hydraulic Engineering Software
Recent revival of network simulation is attributed to the world-wide pro-liferation of urban water supply without securing adequate maintenance.Complex technical systems necessitate appropriate maintenance lest theyforfeit the intended benefit. Networks, working intermittently, deliver-ing more unaccounted water than supplied - of unsafe quality - are inquest for appropriate design criteria. Optimization, the second populararea of network modeling, is the tool to accommodate required criteria.Both the need to economize and the necessity to ensure sustainability byappropriate design criteria are facilitated using optimization models.
Hardly an area has been tackeled by a similar onslaught of algorithms aswater supply network optimization. First, trial & error estimates of dia-meters were simply supplemented by simulation to subsequently verify thehydraulic feasibility. Recognizing the nonlinearity of the problem gradi-ent methods were introduced [4]. Transportation algorithms also appearedsuitable, water supply networks accomplishing principally transportation.Dynamic Programming was able to follow the flow through the pipes intime-steps. However, a breakthrough came with the mathematical proofthat the cost optimal design of a branch networks is obtained by LinearProgramming [5]. This ingenious discovery produced, in addition, optimalstandard size diameters without resorting to approximations. Recently,the obsolete trial & error techniques of network design were successfullyrefined by concepts of biological evolution and genetics [6,7,8,9]. Thiswas also extended to calibration by a concept marrying simulation andoptimization [10].
Questions are sometimes raised regarding optimization in planning pro-cesses since the exactness of computations is seen in the light of soft dataassociated with parameter estimates for a design reaching into the future.Though soft data do not automatically call for trial & error designs if bet-ter methods are available, the advantage by optimization is cost savings.Savings can be guaranteed at 10% of a design furnished by a consultantusing simulation methods, they may as well reach 20 or 30%. These sa-vings weigh in a developing country since large cities are often concerned.Referring to the issue of soft data, knowledge upon the impact of a dif-ferent parameter estimate is desirable. The very capacity of optimizationmodels to perform sensitivity analyses regarding future consumption, in-terest or energy rates, etc. may be as helpful as acquiring a definite costminimum design figure, while trial & error methods discourage repeatedcomputations, investigating systematically scenarios. The savings extendto the job of deriving the design in the first place.
It is evident that network optimization should be preferably applied tothe main distribution grid rather than including secondary lines as wellbeing unamenable to reduction.
Transactions on Ecology and the Environment vol 12, © 1996 WIT Press, www.witpress.com, ISSN 1743-3541
Hydraulic Engineering Software 165
2 Mathematical Model
The standard engineering objective is to minimize cost subject to con-straints defining additional criteria. Let the capital cost including install-ment, appurtenance and maintenance of a network of lines j, consistingof dj diameters of lengths /y, be:
A/fiT) \ r*~1 • — \ /v •/ /r (~\ \J.VJ. lit,. / C • L -, — 7 UL ft >,{JL • 11)/ ^ j J / ^ J j j \ j3 J
With Cj denoting the unit cost per length (commonly 1 < /? < 1.5). Incase of pumping, the present value of pumping costs amounts to:
the cost factor cf summarizing present value, maintenance, dimensionfactor and unit pumping cost. At high pressure pumping nodes, i £ /p,the input flow <?; is assumed given, the optimal pressure pi left to bedetermined. The hydraulic systems function relating flow fj and headloss hj of a pressure conduit corresponds to:
*i =<"&-£, (3)
u>j containing dimension and friction, roughness, capacity factors withrespect to the pipe material.
The exponents in different formulations of eq. (3), e.g. 8 = 1.85 or2.0,6 = 4.87 or 5.0 according to 'Hazen-Williams' or 'Darcy-Weisbach',are indicating an equal nonlinear behaviour. Substituting the diameters ineq. (1), using eq. (3), the overall objective function including investmentand operation cost follows to:
Introducing the incidence matrix A whose activities [a ] are +1 and/or— 1 if the flow in line j enters and/or leaves node 2, and are 0 if line j isnot incident upon node 2, also defining the vector of demand and inputflow q = (<%), of the pressure potential p = (pj, of the potential pressurerequirement P = (?;), of head loss h = (hj) and flow / = (fj) thehydraulic constraints to be observed reduce to a linear set of equations:
Af = q (5)
A^p = h (6)
P>P (7)
Transactions on Ecology and the Environment vol 12, © 1996 WIT Press, www.witpress.com, ISSN 1743-3541
166 Hydraulic Engineering Software
The pressure requirement P at any node is a design criterion, likewisedemand and flow input q. Note, that eq. (5) and (6) correspond toKirchhoff's first and second law, stating mass and energy balance, eq. (6)serving in addition to define the pressure potential p in terms of h. Sincethe hydraulic formulation (3) has been incorporated into the model, theoptimization program (4) - (7) includes the 'hydraulic network balance %previously also referred to as Network Simulation.
This formulation of the water supply network optimization problem yieldsa nonlinear model whose objective function (4) is nonconvex and multi-modal with respect to the variables / and h (and/or p) [11] to bedetermined. However, the objective function is concave with respect tothe flows / and convex with respect to the head losses h. Hence, since theconstraints set (5) - (6) is linear, the program has a unique solution if theflows are known. It can then be solved for the unknown head losses. Onthe other hand, the concavity of the objective function with respect to theflows indicates economies-of-scale with respect to the flows. Hence, as anecessary condition for a minimum cost solution, the flows must be con-centrated as much as possible in as few mains as possible. This conditionis met by any 'tree' derived from the original reticulation according tograph theory. The flows in a 'tree' (i.e. branch network) are known forany given supply/demand at the nodes.
Any branch network represents a local cost minimum. The cost optimiza-tion of a branch network is achieved by Linear Programming [12,13,14].In this, using eq. (3), the lengths of unknown standard size diameters aresubstituted by the previously unknown head losses being a function of thelength of the diameter installed. The results of the LP are optimalstandard size diameters and corresponding pumping heads. It remains theproblem to evaluate the existing number of local minima represented bythe number of branch networks derived from a given reticulation. Onlysmall networks allow for a total enumeration of the number of existingtrees, given by T = \AA^\ of the original reticulation [15]. An intelligentsearch is required. This is provided by Genetic Algorithms and EvolutionStrategies.
3 The Algorithm
Over the last years Genetic Algorithms and Evolution Strategies have al-most become established in water supply network optimization. Whereasbinary coding is associated with Genetic Algorithms and influencing thechoice of the variables thus leading to a 'genotype' model, Evolution Stra-tegies tend to respond more to the physical properties of the problemcomplying with engineering perception, leaning towards 'phenotype' mo-dels [16]. Usually a mix proves efficient. The driving mechanisms commonto either technique include mutation, recombination, selection.
Transactions on Ecology and the Environment vol 12, © 1996 WIT Press, www.witpress.com, ISSN 1743-3541
Hydraulic Engineering Software 167
The approach chosen here also reflects that these techniques rather happento be an art than a rigorous school. Like a gear-shift two differentEvolution Strategies, each devised for its respective purpose, are appliedin series performing, first, a search into the dictance of the solution space,second, scanning the vicinity of a local solution thus driving into thedirection of the global according to the principles of evolution.
The first strategy derives from the fact that local cost minima of thenetwork optimization problem are associated with the branch networks,as explained above, concentrating the network flow in as few mains aspossible. Evidently, given the reduction to a skeleton network representedby a branch network, offspring designs generated may differ significantlyin terms of topology and cost. Generating trees is tantamount to screeningthe solutions space for distinctly different designs available in the setof branch networks. The 'chords' are the missing lines of the originalreticulation producing a tree. The corresponding operations of mutationand recombination are therefore applied to the chords. Random changesserve to select new chords in a loop - representing the process of mutation- chosen randomly from at most 50 % of the loops of an initial populationof trees, determined randomly; two random parent trees of the populationare recombined in a way that the offspring obtains his chords from eitherparent alternatively, determined randomly [9]. Thus, the first EvolutionStrategy of the algorithm works on the topology.
In any network whose flows are known the optimal diameters can bedetermined by Linear Programming. The branch network generated abovemust be supplemented by the chords to regain the original reticulation.Since the flows in the existing branch networks are balanced a correctionterm A/ is introduced for any loop in order to observe the flow balanceand to allow for flow adjustments at the same time. After any adjustmentanother LP run serves to determine the optimal diameters in the reticulatesystem. The variation of A/ is implemented by random incrementsof A/, applied to at most 20% of the loops, the standard deviationof the increments being adjusted according to the performance of thedesign in terms of cost [9]. Thus, the second Evolution Strategy of thealgorithm works on the hydraulics. The application of these two strategiesin sequence resembles a gear-shift.
4 Hanoi Existing Water Supply
Hanoi, capital of Vietnam, located on the Red River 100 km inland ofthe sea of China, occupies an area of 49km'*. The estimated populationof about 1.1 million (1995) enjoys a mean yearly temperature of 23.4°C.Within the city area are numerous lakes and ponds, canals and streams.The annual rainfall varying between 1200 and 2200 mm is also heldresponsible for a flow fluctuation of the Red River between 350 and22000mV«s (1956- 1985).
Transactions on Ecology and the Environment vol 12, © 1996 WIT Press, www.witpress.com, ISSN 1743-3541
168 Hydraulic Engineering Software
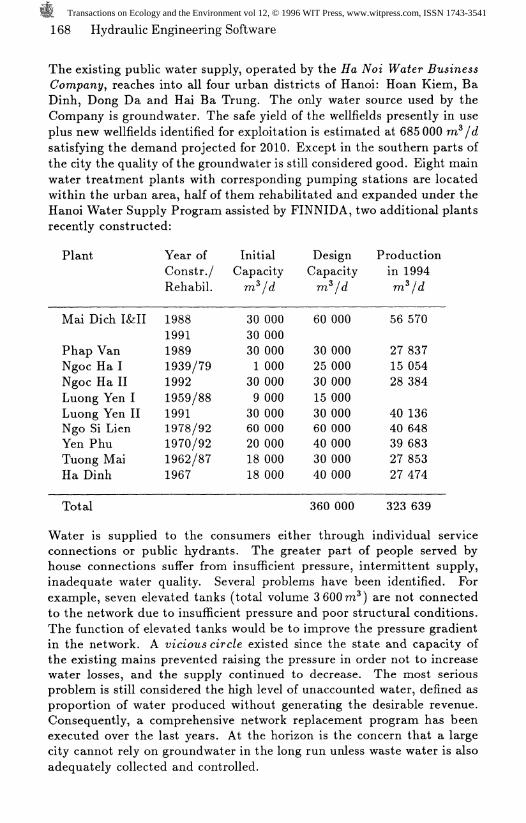
The existing public water supply, operated by the Ha Noi Water BusinessCompany, reaches into all four urban districts of Hanoi: Hoan Kiern, BaDinh, Dong Da and Hai Ba Trung. The only water source used by theCompany is groundwater. The safe yield of the wellfields presently in useplus new wellfields identified for exploitation is estimated at 685 000 m?/dsatisfying the demand projected for 2010. Except in the southern parts ofthe city the quality of the groundwater is still considered good. Eight mainwater treatment plants with corresponding pumping stations are locatedwithin the urban area, half of them rehabilitated and expanded under theHanoi Water Supply Program assisted by FINNIDA, two additional plantsrecently constructed:
Plant
Mai Dich I&II
Phap VanNgoc Ha INgoc Ha IILuong Yen ILuong Yen IINgo Si LienYen PhuTuong MaiHa Dinh
Year ofConstr./Rehabil.
1988199119891939/7919921959/8819911978/921970/921962/871967
InitCapam*
30303013093060201818
ialicity
Id
000000000000000000000000000000000
DeCapra
60
302530153060403040
signtacity
Vd
000
000000000000000000000000000
Prodinm
56
271528
4040392727
iuction1994
»/d
570
837054384
136648683853474
Total 360 000 323 639
Water is supplied to the consumers either through individual serviceconnections or public hydrants. The greater part of people served byhouse connections suffer from insufficient pressure, intermittent supply,inadequate water quality. Several problems have been identified. Forexample, seven elevated tanks (total volume 3600ra^) are not connectedto the network due to insufficient pressure and poor structural conditions.The function of elevated tanks would be to improve the pressure gradientin the network. A vicious circle existed since the state and capacity ofthe existing mains prevented raising the pressure in order not to increasewater losses, and the supply continued to decrease. The most seriousproblem is still considered the high level of unaccounted water, defined asproportion of water produced without generating the desirable revenue.Consequently, a comprehensive network replacement program has beenexecuted over the last years. At the horizon is the concern that a largecity cannot rely on groundwater in the long run unless waste water is alsoadequately collected and controlled.
Transactions on Ecology and the Environment vol 12, © 1996 WIT Press, www.witpress.com, ISSN 1743-3541
Hydraulic Engineering Software 169
5 Hanoi Planned Main Distribution
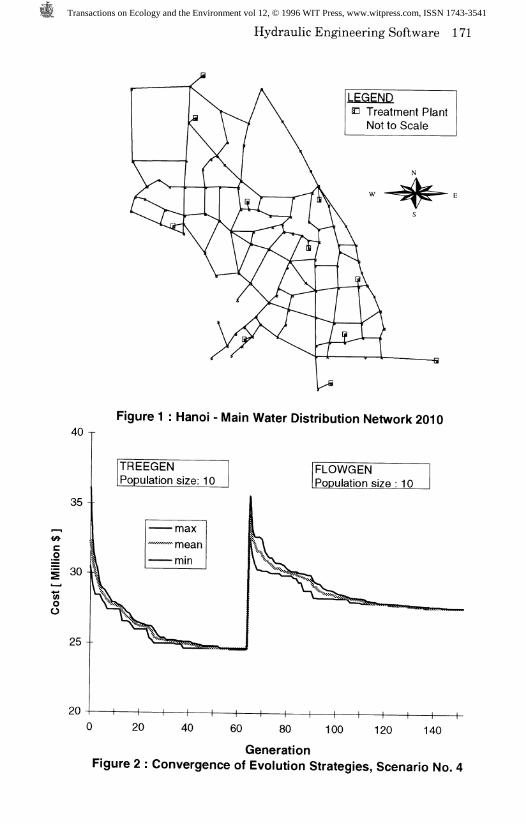
Optimization of the main water supply network defined by diameters> 300mm was performed for the year 2010, based upon a populationestimate of 1.6 million people and a design flow of 11.22 m* /s correspon-ding to a domestic consumption of 180 led, industrial use of 35 m* /ha/d,peak load factor of 1.68 (peak day factor 1.4, peak hour factor 1.2). Thesystem will be fed by 11 water treatment plants with subsequent highlift pumping, three of which still to be constructed, each with a capacityof 140000 m*/d. The graph of the network layout (Fig. 1) comprises170 lines, 124 nodes and 47 loops, a total network length of 155.27 km.The total number of trees T - 1.069 x 10" certainly precludes totalenumeration.
The following set of standard size diameters of ductile iron and steel,k — 0.5 mm, except PE for 300 mm, k — 0.3 mm, with correspondingcapital cost including installation and appurtenance per unit length, wasto be used in the design:
Diameter mm 300 400 500 600 800 1000 1200 1500Cost $/m 42 63 115 154 244 305 374 460
Maximum velocities in the pipes were restricted to 2.2 m/s, the energyrate was assumed to 0.05 $/KWh. A 'social rate of discount' i [17]was employed to transfer the time stream of pumping cost to a presentvalue, represented in the objective function, considering an economicoperating time horizon of 15 years (1995-2010), as the reference timein the optimization. The lifetime of the pipes was subject to sensitivityanalysis. Investigating a lifetime of 30 and 50 years, respectively, thecapital pipe cost were discounted to corresponding annuities, 15 years ofwhich to be considered in the objective function. Though the conceptof a salvage value was introduced this way the economic operating timehorizon can also be derived from a balance of revenue and cost ratherthan assuming an arbitrary value. Other scenarios included the variationof the interest rate assumed to i — 3% and 5%, and of the minimumsupply pressure at any node with P = 28.5 m and 35.0 m, respectively.The sensitivities encountered bear significance upon the data collectionand care devoted to data projections. Some of the conclusions from theresults of the sensitivity analyses were:- A shorter lifetime of the pipes increases the annuity resulting in higher
total cost without hardly raising pumping- Higher pressure requirements at the nodes is mainly answered by
increase of pumping rather than larger diameters for lower interestrates
- Lower interest rates increase the present value of pumping, theyconsequently raise investment and total cost.
Transactions on Ecology and the Environment vol 12, © 1996 WIT Press, www.witpress.com, ISSN 1743-3541
170 Hydraulic Engineering Software
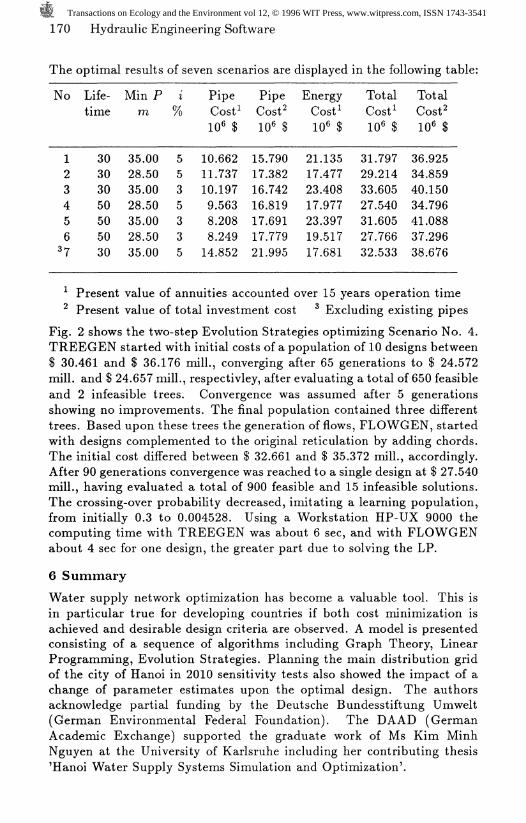
The optimal results of seven scenarios are displayed in the following table:
No
123456
Life-time
303030505050
Mi:r
352835283528
Q Pn
.00
.50
.00
.50
.00
.50
i
553533
F(1
101110988
?\
0* $
.662
.737
.197
.563
.208
.249
PipeCost^10* $
15.79017.38216.74216.81917.69117.779
EmC1
211723172319
ergy
0* $
.135
.477
.408
.977
.397
.517
TotalCost*10* $
31.79729.21433.60527.54031.60527.766
TotalCost%10* $
36.92534.85940.15034.79641.08837.296
37 30 35.00 5 14.852 21.995 17.681 32.533 38.676
* Present value of annuities accounted over 15 years operation time^ Present value of total investment cost ^ Excluding existing pipes
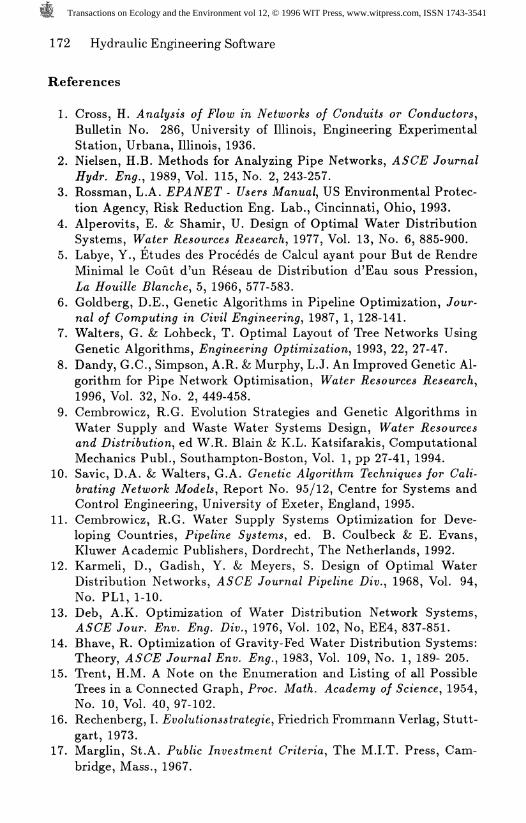
Fig. 2 shows the two-step Evolution Strategies optimizing Scenario No. 4.TREEGEN started with initial costs of a population of 10 designs between$ 30.461 and $ 36.176 mill., converging after 65 generations to $ 24.572mill, and $ 24.657 mill., respectivley, after evaluating a total of 650 feasibleand 2 infeasible trees. Convergence was assumed after 5 generationsshowing no improvements. The final population contained three differenttrees. Based upon these trees the generation of flows, FLOWGEN, startedwith designs complemented to the original reticulation by adding chords.The initial cost differed between $ 32.661 and $ 35.372 mill., accordingly.After 90 generations convergence was reached to a single design at $ 27.540mill., having evaluated a total of 900 feasible and 15 infeasible solutions.The crossing-over probability decreased, imitating a learning population,from initially 0.3 to 0.004528. Using a Workstation HP-UX 9000 thecomputing time with TREEGEN was about 6 sec, and with FLOWGENabout 4 sec for one design, the greater part due to solving the LP.
6 Summary
Water supply network optimization has become a valuable tool. This isin particular true for developing countries if both cost minimization isachieved and desirable design criteria are observed. A model is presentedconsisting of a sequence of algorithms including Graph Theory, LinearProgramming, Evolution Strategies. Planning the main distribution gridof the city of Hanoi in 2010 sensitivity tests also showed the impact of achange of parameter estimates upon the optimal design. The authorsacknowledge partial funding by the Deutsche Bundesstiftung Umwelt(German Environmental Federal Foundation). The DA AD (GermanAcademic Exchange) supported the graduate work of Ms Kim MinhNguyen at the University of Karlsruhe including her contributing thesis'Hanoi Water Supply Systems Simulation and Optimization'.
Transactions on Ecology and the Environment vol 12, © 1996 WIT Press, www.witpress.com, ISSN 1743-3541
Hydraulic Engineering Software 171
LEGENDTreatment PlantNot to Scale
40
35 -
i so
oo
25 -
20
Figure 1 : Hanoi - Main Water Distribution Network 2010
TREEGENPopulation size: 10
FLOWGENPopulation size : 10
-i ' 1 1 1 1 1 1 1 1 1 1 1 1 h0 20 40 60 80 100 120 140
GenerationFigure 2 : Convergence of Evolution Strategies, Scenario No. 4
Transactions on Ecology and the Environment vol 12, © 1996 WIT Press, www.witpress.com, ISSN 1743-3541
172 Hydraulic Engineering Software
References
1. Cross, H. Analysis of Flow in Networks of Conduits or Conductors,Bulletin No. 286, University of Illinois, Engineering ExperimentalStation, Urbana, Illinois, 1936.
2. Nielsen, H.B. Methods for Analyzing Pipe Networks, ASCE JournalHydr. Eng., 1989, Vol. 115, No. 2, 243-257.
3. Rossman, L.A. EPANET - Users Manual, US Environmental Protec-tion Agency, Risk Reduction Eng. Lab., Cincinnati, Ohio, 1993.
4. Alperovits, E. & Shamir, U. Design of Optimal Water DistributionSystems, Water Resources Research, 1977, Vol. 13, No. 6, 885-900.
5. Labye, Y., Etudes des Precedes de Calcul ayant pour But de RendreMinimal le Cout d'un Reseau de Distribution d'Eau sous Pression,La Houille Blanche, 5, 1966, 577-583.
6. Goldberg, D.E., Genetic Algorithms in Pipeline Optimization, Jour-nal of Computing in Civil Engineering, 1987, 1, 128-141.
7. Walters, G. & Lohbeck, T. Optimal Layout of Tree Networks UsingGenetic Algorithms, Engineering Optimization, 1993, 22, 27-47.
8. Dandy, G.C., Simpson, A.R. & Murphy, L.J. An Improved Genetic Al-gorithm for Pipe Network Optimisation, Water Resources Research,1996, Vol. 32, No. 2, 449-458.
9. Cembrowicz, R.G. Evolution Strategies and Genetic Algorithms inWater Supply and Waste Water Systems Design, Water Resourcesand Distribution, ed W.R. Blain & K.L. Katsifarakis, ComputationalMechanics Publ., Southampton-Boston, Vol. 1, pp 27-41, 1994.
10. Savic, D.A. & Walters, G.A. Genetic Algorithm Techniques for Cali-brating Network Models, Report No. 95/12, Centre for Systems andControl Engineering, University of Exeter, England, 1995.
11. Cembrowicz, R.G. Water Supply Systems Optimization for Deve-loping Countries, Pipeline Systems, ed. B. Coulbeck & E. Evans,Kluwer Academic Publishers, Dordrecht, The Netherlands, 1992.
12. Karmeli, D., Gadish, Y. & Meyers, S. Design of Optimal WaterDistribution Networks, ASCE Journal Pipeline Div., 1968, Vol. 94,No. PL1, 1-10.
13. Deb, A.K. Optimization of Water Distribution Network Systems,ASCE Jour. Env. Eng. Div., 1976, Vol. 102, No, EE4, 837-851.
14. Bhave, R. Optimization of Gravity-Fed Water Distribution Systems:Theory, ASCE Journal Env. Eng., 1983, Vol. 109, No. 1, 189- 205.
15. Trent, H.M. A Note on the Enumeration and Listing of all PossibleTrees in a Connected Graph, Proc. Math. Academy of Science, 1954,No. 10, Vol. 40, 97-102.
16. Rechenberg, I. Evolutions strategic, Friedrich Frommann Verlag, Stutt-gart, 1973.
17. Marglin, St.A. Public Investment Criteria, The M.I.T. Press, Cam-bridge, Mass., 1967.
Transactions on Ecology and the Environment vol 12, © 1996 WIT Press, www.witpress.com, ISSN 1743-3541