Embed Size (px)
Citation preview
ReferenceNATL INST. OF STAND & TECH
NBSPubli-
cations
A111QS 17Mmi
NBS TECHNICAL NOTE1150/ W \
a
U.S. DEPARTMENT OF COMMERCE/National Bureau of Standards
-UC1UU
1150
i^6Z
MathematicalModels for the
Corrosion Protective
Performance of
Organic Coatings
NATIONAL BUREAU OF STANDARDS
The National Bureau of Standards' was established by an act of Congress on March 3, 1901.
The Bureau's overall goal is to strengthen and advance the Nation's science and technology
and facilitate their effective application for public benefit. To this end, the Bureau conducts
research and provides: (1) a basis for the Nation's physical measurement system, (2) scientific
and technological services for industry and government, (3) a technical basis for equity in
trade, and (4) technical services to promote public safety. The Bureau's technical work is per-
formed by the National Measurement Laboratory, the National Engineering Laboratory, and
the Institute for Computer Sciences and Technology.
THE NATIONAL MEASUREMENT LABORATORY provides the national system of
physical and chemical and materials measurement; coordinates the system with measurement
systems of other nations and furnishes essential services leading to accurate and uniform
physical and chemical measurement throughout the Nation's scientific community, industry,
and commerce; conducts materials research leading to improved methods of measurement,
standards, and data on the properties of materials needed by industry, commerce, educational
institutions, and Government; provides advisory and research services to other Government
agencies; develops, produces, and distributes Standard Reference Materials; and provides
calibration services. The Laboratory consists of the following centers:
Absolute Physical Quantities 2 — Radiation Research — Chemical Physics —Analytical Chemistry — Materials Science
THE NATIONAL ENGINEERING LABORATORY provides technology and technical ser-
vices to the public and private sectors to address national needs and to solve national
problems; conducts research in engineering and applied science in support of these efforts;
builds and maintains competence in the necessary disciplines required to carry out this
research and technical service; develops engineering data and measurement capabilities;
provides engineering measurement traceability services; develops test methods and proposes
engineering standards and code changes; develops and proposes new engineering practices;
and develops and improves mechanisms to transfer results of its research to the ultimate user.
The Laboratory consists of the following centers:
Applied Mathematics — Electronics and Electrical Engineering 2 — Manufacturing
Engineering — Building Technology — Fire Research — Chemical Engineering2
THE INSTITUTE FOR COMPUTER SCIENCES AND TECHNOLOGY conducts
research and provides scientific and technical services to aid Federal agencies in the selection,
acquisition, application, and use of computer technology to improve effectiveness and
economy in Government operations in accordance with Public Law 89-306 (40 U.S.C. 759),
relevant Executive Orders, and other directives; carries out this mission by managing the
Federal Information Processing Standards Program, developing Federal ADP standards
guidelines, and managing Federal participation in ADP voluntary standardization activities;
provides scientific and technological advisory services and assistance to Federal agencies; and
provides the technical foundation for computer-related policies of the Federal Government.
The Institute consists of the following centers:
Programming Science and Technology — Computer Systems Engineering.
' Headquarters and Laboratories at Gaithersburg, M D, unless otherwise noted;
mailing address Washington, DC 20234.
'Some divisions within the center are located at Boulder, CO 80303.
Mathematical Models for the CorrosionProtective Performance of OrganicCoatings
James M. PommersheimDepartment of Chemical Engineering
Bucknell University
Lewisburg, PA 17837
and
Paul G. Campbell and Mary E. McKnightCenter for Building TechnologyNational Engineering Laboratory
National Bureau of Standards
Washington, DC 20234
Waucnai Surest* et Standard*
SEP 3 1982
7£~0
40* °F %
U.S. DEPARTMENT OF COMMERCE, Malcolm Baldrige, Secretary
NATIONAL BUREAU OF STANDARDS, Ernest Ambler, Director
Issued September 1982
•
!
i
National Bureau of Standards Technical Note 1150
Natl. Bur. Stand. (U.S.), Tech. Note 1150, 99 pages (Sept. 1982)
CODEN:NBTNAE
U.S. GOVERNMENT PRINTING OFFICE
WASHINGTON: 1982
For sale by the Superintendent of Documents, U.S. Government Printing Office, Washington, D.C. 20402
Price $5.50
(Add 25 percent for other than U.S. mailing)
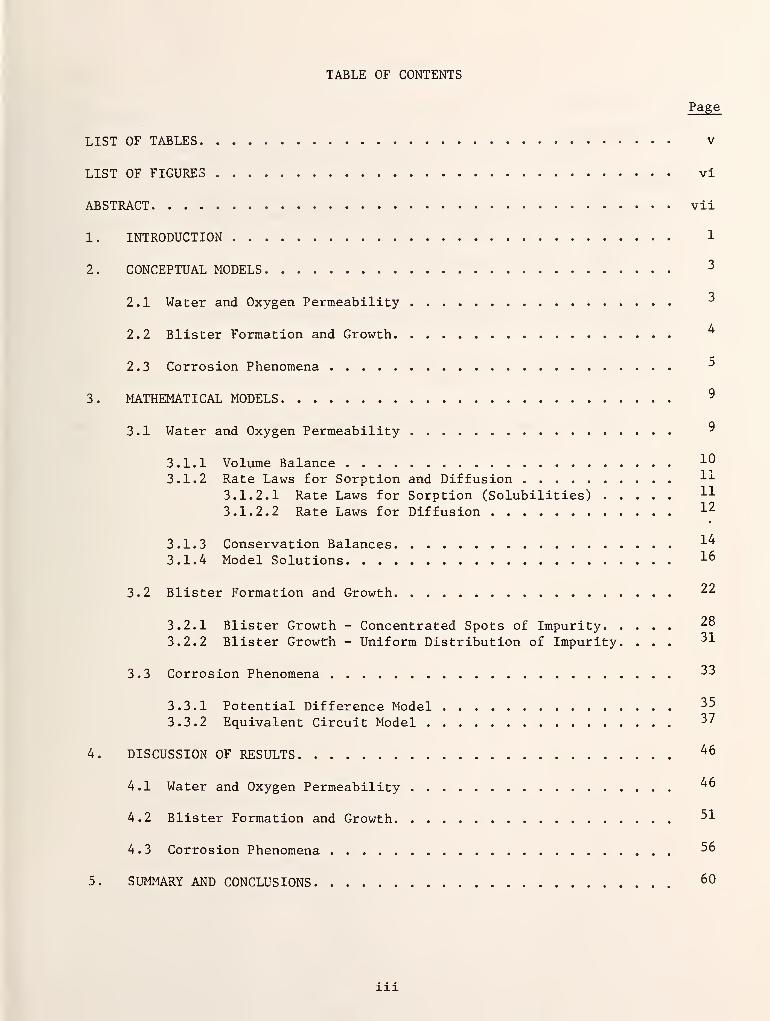
TABLE OF CONTENTS
Page
LIST OF TABLES v
LIST OF FIGURES vi
ABSTRACT vii
1. INTRODUCTION 1
2. CONCEPTUAL MODELS 3
2.1 Water and Oxygen Permeability *
2.2 Blister Formation and Growth ^
2.3 Corrosion Phenomena -*
3. MATHEMATICAL MODELS 9
3.1 Water and Oxygen Permeability
3.1.1 Volume Balance 10
3.1.2 Rate Laws for Sorption and Diffusion l x
3.1.2.1 Rate Laws for Sorption (Solubilities) H3.1.2.2 Rate Laws for Diffusion **
3.1.3 Conservation Balances ^3.1.4 Model Solutions 16
3.2 Blister Formation and Growth. 22
3.2.1 Blister Growth - Concentrated Spots of Impurity 28
3.2.2 Blister Growth - Uniform Distribution of Impurity. ... ^1
3.3 Corrosion Phenomena 33
3.3.1 Potential Difference Model 35
3.3.2 Equivalent Circuit Model 37
4. DISCUSSION OF RESULTS 46
4.1 Water and Oxygen Permeability ^°
4.2 Blister Formation and Growth 51
4.3 Corrosion Phenomena 56
5. SUMMARY AND CONCLUSIONS 60
in
Page
6. NOMENCLATURE 65
7. REFERENCES 69
APPENDICES
A. SOLUTION TO THE MATHEMATICAL MODEL FOR DIFFUSION OF OXYGENAND WATER THROUGH ORGANIC COATINGS 70
A. 1 Long Time Model Solutions 72A. 2 Short Time Model Solutions 77
B. SOLUTION TO THE MATHEMATICAL MODEL FOR CORROSION PHENOMENABENEATH AN ORGANIC COATING 81
B.l Potential Difference Model 81B.2 Equivalent Circuit Models 84
B.2.1 Constant Product Resistance 85B.2. 2 Langmuir Adsorption of Corrosion Products 86B.2. 3 Accumulation of Solid Products 89
xv
LIST OF TABLES
Table No. Page
1 Concentration of Water and Oxygen in Organic Coatings(Summary of Models) 19
2 Assumptions of the Mathematical Models for Blister Growth ... 26
v
LIST OF FIGURES
Figure No. Page
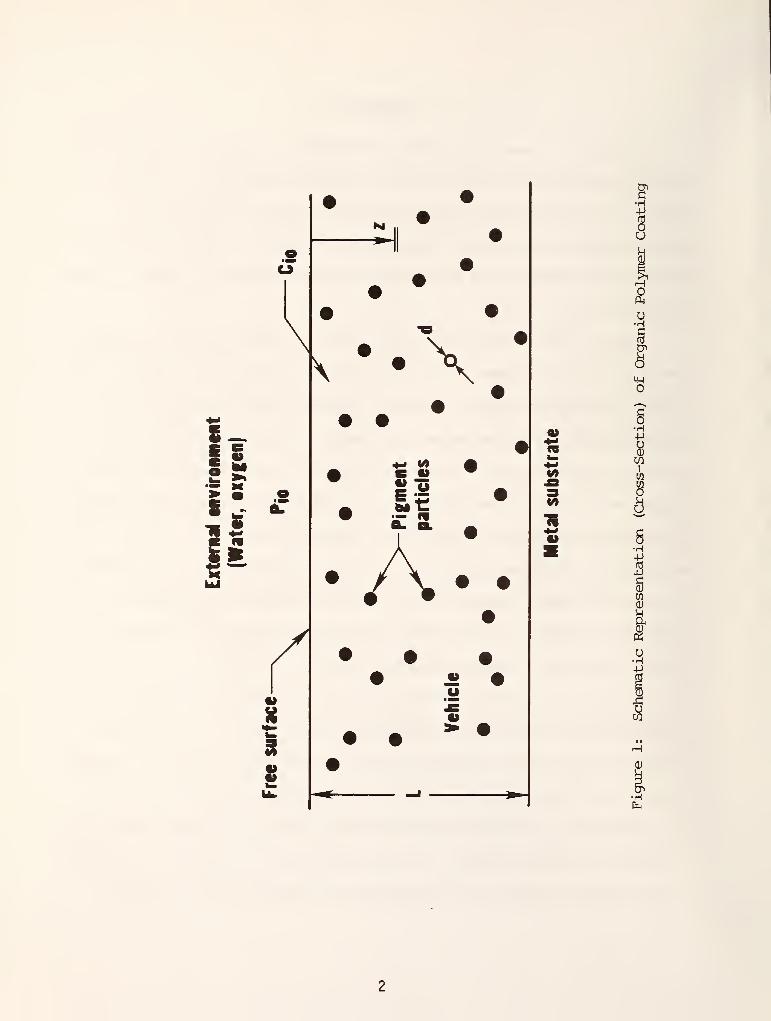
1 Schematic Representation (Cross-Section) of
Organic Polymer Coating 2
2 Schematic Representation of a Blister Within anOrganic Coating 24
2A Concentrated Spot of Impurity 24
2B Uniform Distribution of Impurity 24
3 Equivalent Electrical Circuit for Polarization 38
VI
ABSTRACT
Mathematical models were developed for conceptual models describing
the principal phenomena that occur in the corrosion performance of poly-
meric coatings. These include models for water and oxygen permeability
through organic coatings, models for the growth of blisters beneath
coatings, and preliminary models for the polarization occurring at the
electrode surfaces. Results predicted by the models are discussed in
terms of the improvement of the protective function of the membrane.
Keywords: absorption; adhesion; adsorption; conceptual models; corrosion;
mathematical models; organic coating; osmosis; osmotic pressure; oxygen;
permeability; pigment; protective performance; substrate; vehicle; water.
VI
1

1 . INTRODUCTION
In order to assess the corrosion protective performance of organic coat-
ings the phenomena that lead to corrosion must be understood. Corrosion
itself is the destruction of a metal surface by electrochemical action.
Aqueous corrosion occurs when three things are present: oxygen, water and an
electrolyte. There will be no corrosion unless all three are present at the
corrosion site.
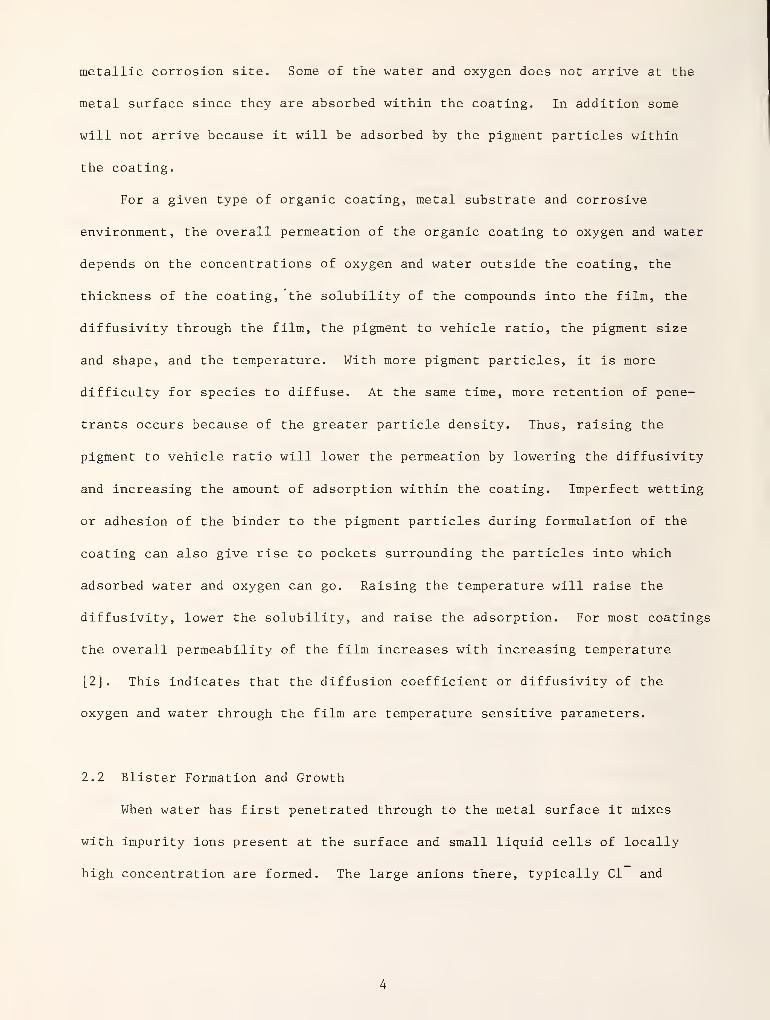
Figure 1 shows a cross-section of a typical organic coating. A coating
having a uniform thickness L (typically 0.1 mm) covers a metal substrate. The
organic coating consists of a vehicle (or binder) phase and a particle (or
pigment) phase. Water and oxygen can penetrate through the coating to the
surface of the substrate. The rate of passage of the penetrants (water and
oxygen) will depend on many factors: the availability at the coating surface,
their solubility in the coating, their diffusivity through the coating, their
affinity for the pigment particles their rate of consumption at the corrosion
site and the osmotic pressure of the electrolyte-membrane combination. In
addition to depending on the chemical and physical nature of the organic
coating used, all of these factors are temperature sensitive.
The electrolyte can be a foreign ion such as chloride or sulfate or it
can be the corrosion products themselves. Since corrosion does not begin
without an electrolyte, a foreign ion must be initially present as an impurity
on the metal surface, or as a leachable ion present in the coating, or as an
ion present in an external aqueous environment which can diffuse through the
coating to the metal surface. In most applications, the surface of the metal
is not perfectly clean and an accumulation of impurity ions may initiate
4
I
i
i-i s• **
H
\ \* 3
A
0>
i—
/
3
8
U
-^
o
o
•H+J
&icni
w
1§•H-P
iw
£U•H4J
uw
0)
Hfa
localized corrosion there. The presence of these ions leads to osmotic
pressure differences between the inside and outside of the coating. This
augments the diffusion of water through the coating and can lead to the forma-
tion of blisters at the metal surface.
In this paper, the key conceptual phenomena affecting the corrosion pro-
tective performance of organic coatings are discussed, and mathematical models
describing these phenomena are formulated and solved.
2. CONCEPTUAL MODELS
The model for corrosion protective performance of organic coatings was
conceived in terms of three different conceptual sub-models:
(i) submodel for water and oxygen permeability
(ii) submodel for blister formation and growth
(iii) submodel for corrosion phenomena
2.1 Water and Oxygen Permeability
Both water and an oxidizing chemical species must be present at the metal
surface in order for corrosion to occur. Compounds like halogens, sulfur
dioxide and oxygen can all serve as oxidizers but molecular oxygen is by far
the most prevalent. The organic coating (refer to Figure 1) serves as a
barrier to the diffusion of water and oxygen. If the coating were not present
they would have ready access to the metal surface. The presence of the coating
helps prevent the initiation of corrosion, and, in addition, slows down the
rate of corrosion once it has begun. Most coatings, are relatively permeable
to the penetration of water and oxygen, especially water [1] . To arrive at
the metal surface both water and oxygen must first dissolve (or absorb) into
the outside of the coating and then diffuse through the coating towards the
metallic corrosion site. Some of the water and oxygen does not arrive at the
metal surface since they are absorbed within the coating. In addition some
will not arrive because it will be adsorbed by the pigment particles within
the coating.
For a given type of organic coating, metal substrate and corrosive
environment, the overall permeation of the organic coating to oxygen and water
depends on the concentrations of oxygen and water outside the coating, the
thickness of the coating, the solubility of the compounds into the film, the
diffusivity through the film, the pigment to vehicle ratio, the pigment size
and shape, and the temperature. With more pigment particles, it is more
difficulty for species to diffuse. At the same time, more retention of pene-
trants occurs because of the greater particle density. Thus, raising the
pigment to vehicle ratio will lower the permeation by lowering the diffusivity
and increasing the amount of adsorption within the coating. Imperfect wetting
or adhesion of the binder to the pigment particles during formulation of the
coating can also give rise to pockets surrounding the particles into which
adsorbed water and oxygen can go. Raising the temperature will raise the
diffusivity, lower the solubility, and raise the adsorption. For most coatings
the overall permeability of the film increases with increasing temperature
[2] . This indicates that the diffusion coefficient or diffusivity of the
oxygen and water through the film are temperature sensitive parameters.
2.2 Blister Formation and Growth
When water has first penetrated through to the metal surface it mixes
with impurity ions present at the surface and small liquid cells of locally
high concentration are formed. The large anions there, typically CI and
SO. , cannot diffuse out through the coating, which now acts as a semiper-
meable membrane. Alkali pigments can supply additional species to the anion
pool within the blister and may change the nature of the corrosion process.
Osmotic pressure builds up and more water diffuses into the cells, gradually
enlarging them. In regions where the adhesion between the coating and the
metal is poor, or where the concentration of impurity is especially high, the
coating can disbond from the metal substrate and a blister can form. The
blister continues to enlarge but at a slower and slower rate as the impurity
ion is diluted and the osmotic pressure drops. If the enlarging blister
exposes additional amounts of surface impurity ions, the rate of blister
growth does not decrease as fast. A similar effect will occur when ionic
corrosion products (such as hydroxyl ions) are formed adjacent to the blister,
In general, blister growth is slow enough that it is not limited by the
availability of water. The blister formation and initial water incursion
problems are uncoupled since they do not occur on the same time scale. Of
course, water permeability (refer to previous section) is essential to the
initiation of the cells which lead to the formation of blisters.
After sufficient time, the blisters may enlarge to such a point that
adjacent blisters link together. This can lead to complete detachment of the
coating from the substrate causing failure of the organic coating.
2.3 Corrosion Phenomena
Corrosion reactions initiate when oxygen, water and ions are present
locally at the metal surface either in a detached film or within a blister.
For iron-based metals, the most common half-cell reactions are:
I
I _Anodic Reaction : Fe -* Fe + 2e (1)
(oxidation)
Cathodic Reaction : HO + tO + 2e~ -> 2 (0H)~ (2)(reduction)
The anodic and cathodic reactions occur at different sites on the metal
surface. The electrons released in the anodic reactions travel through the
metal to the location of the cathode. This completes the circuit. Electron
flow is retarded (or equivalently, circuit resistance is increased) by several
mechanisms. These include:
1) Build-up of oxide layers or layers of other solid corrosion productssuch as Fe(OH)
3or Fe
2) Formation of an electrical double layer adjacent to the metalsurface .
3) Formation of gases such as hydrogen at the cathode surface or oxygenat the anode surface.
4) Adsorption of hydrogen or oxygen ions which result in an overvoltagebecause of polarization of the anode or cathode.
The anodic and cathodic sites may shift over the surface with time as the
coating becomes detached. This can permit substantially uniform corrosion to
occur. The liquid films of corrosion products formed beneath detached coatings
may be basic [3]
.
With a blistered surface, the anodic reaction is more likely to occur in
the center of a blister where a pit may subsequently develop. The cathodic
reaction is more likely to occur at the periphery of the blister where the
oxygen needed for this reaction is more readily accessible to depolarize the
cathode. The locally high basicity generated by the formation of hydroxyl
ions can weaken the coating near the cathode surface. Accumulation of solid
corrosion products at the cathode surface also occurs. Both factors can cause
"cathodic delamination" with more rapid coating detachment than would other-
wise be observed.
For the half-cell reactions considered, the principal solid corrosion
product is ferric hydroxide, Fe(OH) . The original corrosion product is
ferrous hydroxide, Fe(OH)„, which forms when ferrous, Fe , and hydroxyl,
(OH) , ions diffuse towards one another through solution. Ferrous hydroxide
undergoes further oxidation to ferric hydroxide. In strongly oxidative
environments, films of ferric oxide (Fe ) also form. The corrosion products
can build-up uniformly as may occur under a detached film, or they may precip-
itate closer to the cathode than to the anode as can occur with a blistered
coating.
Corrosion is viewed as being basically an electrochemical phenomenon.
The rate of corrosion is considered to be a function of the electromotive
force and the resistance of the circuit. The greater the potential between
the anode and cathode the greater is the driving force for corrosion. The
driving force is initially proportional to the potential as determined by the
galvanic series for the metal in solution. As corrosion proceeds, the potential
difference between the anode and cathode decreases and the accumulating
corrosion products cut down on the electron flow. The potential of the cathode
slowly drifts towards that of the anode (cathodic polarization) , while the
potential of the anode drifts slowly towards that of the cathode (anodic
polarization). In general, cathodic polarization exerts more of a controlling
influence on the overall corrosion process than does anodic polarization. For
example, when hydrogen adsorbs at the cathode it can polarize the surface
reducing the electron flow and thus decreasing corrosion at the anode.
Corrosion can be accelerated again if oxygen is introduced into the system.
In this case, adsorbed hydrogen ions are removed from the cathode surface by
the reaction:
4 H+
+2
+ 4e +2 H2
(3)
Corrosion increases because the cathode potential drops, increasing the
driving force between the cathode and anode and raising the electron flow.
Oxygen in this case acts as a cathodic depolarizer.
The area of the cathode surface relative to that of the anode is also an
important parameter in corrosion models. Returning to the previous example,
the hydrogen ions reaching a large cathode will be spread out over a larger
area than with a small cathode and are easier to remove by reaction (3)
.
Thus, in oxidative environments, such as those present beneath a corrosion
protective coating, an enlarging cathode contributes to accelerated corrosion
rates.
The corrosion phenomena can also be viewed as being part of an electrical
circuit. The difference in potential between the anode and cathode create an
electron flow which passes through several series resistances. These include
the resistance of the electrolyte, the resistance of the corrosion products
and the resistance of the metal itself. For isothermal systems, the metal
resistance remains constant and should be low. Corrosion product resistance
increases with time as the products accumulate (either as an electrical double
layer, adsorbed gases, or solid products).
The electrical double layer that forms at the cathode consists of an
inner layer of oriented water dipoles next to the electrode surface and an
outer layer of solvated ions in solution (outer Helmholtz plane) . These
layers provide additional resistance by slowing down the electron flow. This
cathodic polarization decreases the circuit potential. Eventually the resis-
tance provided by the double layer approaches some limit or ultimate value and
the potential differences between the anode and the cathode also become constant
Solid films of corrosion products can cause similar effects.
The resistance provided by the conducting solution can also slowly change
as its composition changes. As ion concentrations increase, the higher ionic
mobilities which result lower the electrolyte resistance. However, it can
still be an appreciable part of the total circuit resistance, especially in
solutions which remain relatively dilute.
3. MATHEMATICAL MODELS
The overall mathematical model for the corrosion protective performance
of organic coatings was formulated based upon the previously developed con-
ceptual model describing the principal phenomena that occur. Mathematical
sub-models were developed for each of the conceptual models discussed in the
previous section. These included mathematical sub-models for water and oxygen
permeability, for blister formation and growth, and for the corrosion phenom-
enon itself.
3.1 Water and Oxygen Permeability
Since water and oxygen must be present at the metal surface in order for
corrosion to occur, it is important to know the rate at which they pass
through the coating. Mathematical models for this process are based on a
knowledge of the rate laws for absorption and adsorption and diffusion and the
mass conservation balances for water and oxygen. Input to the conservation
balances consists of the rate laws for absorption into the surface of the
coating, for diffusion through the coating and for adsorption on the surface
of the pigment particles. The rate laws and conservation equations must both
account for the effect of the pigment particles on the permeation process.
3.1.1 Volume Balance
The relations between pigment to vehicle ratio, pigment particle size,
and volume fraction vehicle (porosity) can be determined by making an overall
volume balance on the coating.
Consider the system depicted in figure 1. Pigment particles of uniform
size are evenly dispersed throughout the coating. The coating thickness is L.
Z is the coating depth measured normal to the free surface. n, the number
density of particles, or pigment particles per unit volume of coating, is cal-
culable from the relation:
6 1 " £ ST\n =n -j- (1)
where (1 - e) is the volume fraction of the pigment particles and d is their
diameter (equivalent sphere) . If the porosity e (volume fraction vehicle) is
unknown it can be found by making a volume balance on the coating:
£1 + (p/v) (Pv/Pp
)
(2)
where (p/v) is the pigment to vehicle weight ratio and p /p is the density
ratio.
10
3.1.2 Rate Laws for Sorption and Diffusion
3.1.2.1 Rate Laws for Sorption (Solubilities)
Absorption into the coating surface was assumed to follow Henry's law
which states that the solubility into the coating is proportional to the
concentration (or partial pressure) of penetrant in the external phase outside
the coating. This presumes that there is an equilibrium between phases at the
interface. For coatings exposed to vapors, the constant of proportionality is
the Henry's law constant H.. Thus:
Pio Hi
Clo
(3)
where
p . is the partial pressure of component i in the external phase
C. is the concentration of penetrant i just inside the coating
surface (Z = 0)
.
For coatings exposed to liquids, a similar equation applies. Aqueous
systems favor the penetration of water through the coating while vapor systems
favor the penetration of oxygen. At higher humidities in vapor systems, the
penetration of water increases because of the higher partial pressure of
water. Oxygen transfer to organic coatings in aqueous systems increases as
the amount of oxygen dissolved in the liquid increases. In any case, as a
result of exposure to the external environment, it is presumed that a constant
concentration of penetrant C. is present just inside the coating. It is
11
important to re-emphasize that if either oxygen or water are absent from the
external phase, only a negligible amount of corrosion occurs since C. =0.10
Within the coating, pigment particles also have an affinity for water and
oxygen. For a single pigment particle, the water and oxygen present in the
vicinity of its surface adsorb on the surface at a rate proportional to the
product of the particle's surface area (S ) and the concentration of penetrant
(C.) present in the vehicle near the pigment particle. Thus:
r. = k . S C. (4)is ax p 1
where
and
r. is the rate of adsorption of penetrant i per particleis
k . is the adsorption rate constant for penetrant i.ai
3.1.2.2 Rate Laws for Diffusion
The diffusion of oxygen and water through the coating was based on Fick's
Law. This states that the flux of chemical species i, (N.) is proportional to
the concentration gradient. The constant of proportionality in Fick's Law is
the diffusion coefficient or diffusivity (D.). Thus:
9CN. = - D. VC. = - D. ^r1 (5)l l l l dZ
In equation (5) the gradient VC . is expressed as 9C./SZ. This assumes that
diffusion only occurs in the Z direction. This is a reasonable assumption
considering that most coatings are thin and have large flat surfaces which are
12
exposed to uniform environments. Thus there is little flux across the film in
the directions parallel to the surfaces.
The diffusion coefficient D. will in general be much less than the
molecular or free stream diffusivity of molecules moving unimpeded through
solution. D. is thus regarded as an effective diffusivity rather than a true
diffusion coefficient. The diffusion of molecules is slowed because:
1) The effective area of diffusion is lowered due to the presence of
the pigment phase.
2) The diffusion path between and within the vehicle are tortuous so
that it takes longer for a given molecule to pass from one point to
another.
3) Any given diffusion path has constricted regions (bottlenecks) wherethere is a greater resistance to the diffusive flow of molecules.
The effects of these constraining factors are mathematically expressed in
the relationship [4]
:
D. = D* e 2 (6)1 1 T
where
D. is the molecular (or Knudsen) diffusivityl
G is the constriction factor
T is the tortuosity factor
The porosity e and constriction factor a are both less than unity while
the tortuosity factor T is greater than unity. All three factors act to lower
the actual diffusion coefficient D.. In general, equation (6) cannot be used
to predict the value of D. since the factors on the right hand side of this
equation are unknowns which can only be determined from experiments.
13
Bruggetnan [5] has shown theoretically, using an electrical analog model,
that g/t varies approximately as /e. According to equation (6), this predicts
3/2that the diffusion coefficient should vary as £ . However the useful range
of Bruggeman's approximation is only from 0.4 < £ < 1. At lower porosities,
3/2the dependence of D. on £ is even more pronounced than £ , although actual
dependence has not been determined theoretically. Greater dependence of the
effective diffusivity on the porosity can occur with clumping of pigment
particles caused by poor dispersion or nesting of smaller particles within
spaces between larger particles.
3.1.3 Conservation Balances
The overall conservation equations governing the rate at which water and
oxygen penetrate an organic coating and arrive at corrosion sites will depend
on the rate laws describing the processes which are occurring within the film.
The rate laws comprise a set of constitutive relations which serve as input to
the conservation equations.
An overall conservation balance for each penetrant takes the form:
Rate of Accumulation = Rate of Diffusive Input - Rate of
(7)
Diffusive Output - Rate of Disappearance by Sorption
These molar balances are written on the vehicle, so that the pigment is not
part of the system. However, the number density of pigment particles is an
important parameter since this influences the rate of removal of penetrant by
sorption.
14
Application of equation (7) leads to:
3C. 3N.
dt dZ IS
Equation (8) is the conservation equation for species i. All terms have units
of moles of i/time, volume of vehicle. The term on the left represents the
accumulation of penetrant within the vehicle (refer to equation (7)). The
first term on the right represents the net influx of penetrant in any local
region of the vehicle. The second term on the right gives an expression for
the rate at which the penetrant is removed from the vehicle by adsorption.
Substitution into equation (7) of the rate laws for diffusion (equation (5))
and adsorption (equation (4)) and equation (1) for n results in:
3C. 32C. 6k
oL
In equation (9) it is assumed that the effective diffusivity D. is constant.
This is a reasonable assumption for most coating systems, since, in general,
for any given coating system D., will only be a function of temperature.
Equation (9) is a linear second order non-homogeneous partial differ-
ential equation. Its solution gives C.(Z,t), the concentration of penetrant
as a function of film depth (Z) and time (t). In order to effect a solution,
it is necessary to specify three conditions; two boundary conditions (on Z)
and one initial condition (on t) . These are given by equations (10) , (11) and
(12), respectively:
15
C.(0,t) = C. (10)i ' 10
3C.
g^" (L,t) = (11)
C.(Z,0) = (12)
One boundary condition (equation (10)) is written for the outside coating
surface (next to the external environment) and one for the coating-metal
substrate interface. At the coating surface (Z = 0) , it is presumed that the
concentration C. is equal to the solubility C. of water (or oxygen) in the
vehicle of the organic coating. At the coating-substrate interface (Z = L)
,
the flux of water (and oxygen) is equal to zero. This is expressed mathe-
matically by equation (11) and corresponds physically to the fact that the
metal surface is an impermeable boundary to diffusion. Equation (12), the
initial condition, expresses mathematically the fact that the coating was
initially free of water or oxygen.
Equations (9) , (10) , (11) and (12) comprise the complete mathematical
model for permeation. There is one partial differential equation for oxygen
and one for water, both having the same form but different parameters. The
parameters of the model are D., (p/v), k , C. and d. D., k and C.i'
VK " ai io l ai io
differ for water and oxygen.
3.1.4 Model Solutions
It is important to be able to predict concentration profiles and fluxes
within the coating over the entire time range from the point when the pene-
16
trants first start to reach the metal substrate to the time when corrosion has
initiated and a steady-state concentration profile has developed.
Solutions to equation (9) for C.(Z,t) can be effected by several different
methods. These include:
a) separation of variables (boundary value methods)
b) Laplace Transform methods
c) computer methods
The analytical methods, (a) and (b) , are able to show the precise rela-
tions between the variables and parameters of the model. In this sense, they
are superior to computer methods. Both analytical methods produce solutions
expressed as an infinite series of terms, each of which is a function of both
time and position. The separation of variables method gives solutions which
converge most rapidly at long dimensionless times. This implies that fewer
terms in the series are needed for convergence at long times. Laplace
Transform methods yield solutions which converge quickest at shorter
dimensionless time.
The dimensionless time referred to here can be obtained by expressing
equation (9) in terms of dimensionless groups. Such an analysis shows that:
tD./L2
f=-r~ (13)
t1 represents the dimensionless time. Equation (13) lumps together the
quantities t, D., L and e into a single dimensionless group. t1 is large at
long absolute times t, for small coating thicknesses L, for large values of
the effective diffusion coefficient D., and for films having low porosities.
17
Penetrant concentrations have been found as a function of depth into the
coating and time for both large and small dimensionless times. For both cases
concentrations at the coating-metal interface were found. In addition steady
state mathematical solutions for penetrant concentrations and solutions in
which adsorption is not significant were derived.
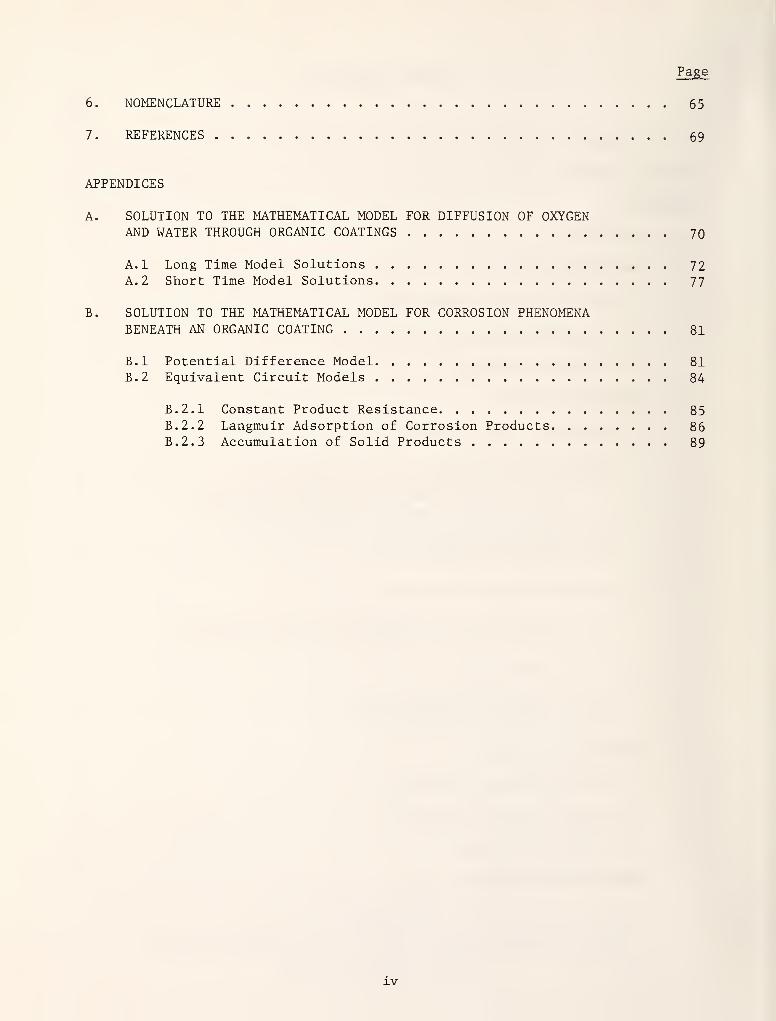
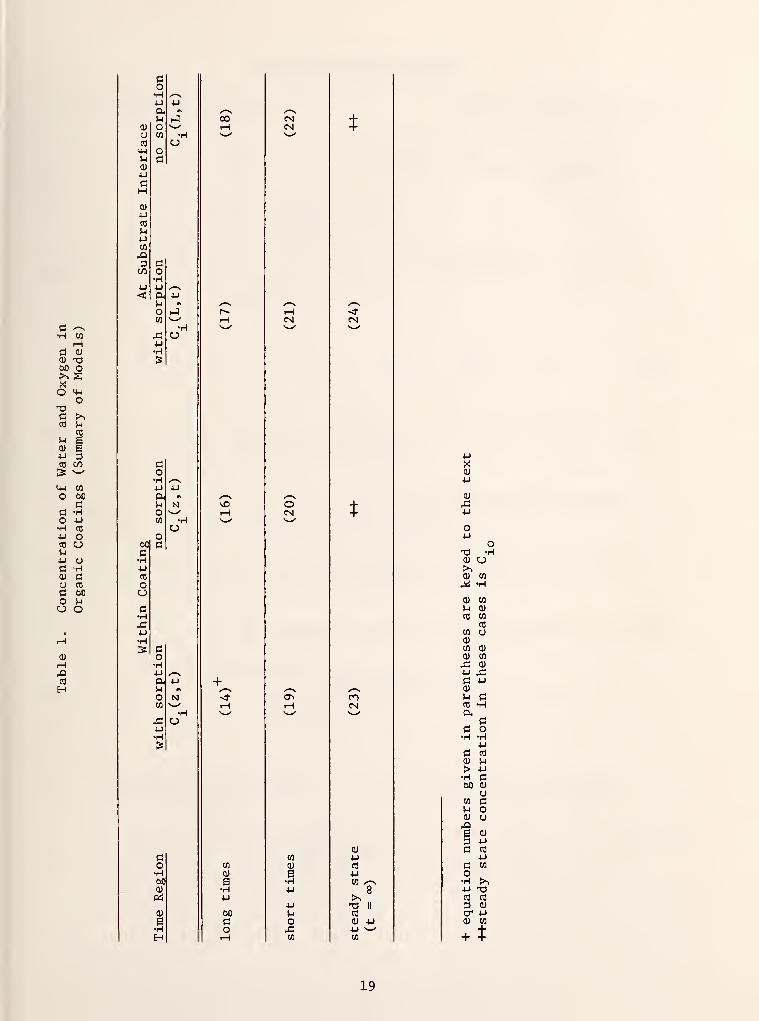
The solutions to these different cases are presented below. A summary by
equation number is provided in Table 1. Details of the derivations are pre-
sented in Appendix A. Further discussion of the solutions obtained is pro-
vided in Section 4 of this report. All of the solutions are given in terms of
the dimensionless concentration C = C./C. , expressed as a function of the1 xo r
dimensionless coating depth x = Z/L, the dimensionless time t' (equation 13)
and the dimensionless adsorption-diffusion constant a, as defined by (equation 15)
18
c CD
CU T3too O>>|5Xo <4-l
OTdC >,rj M
CO
m P0) g•u 3to 013 v^
14-1 CO
60C
C •HO 4-1
H CO
4J
cO U(-1
4J CJ
C •Hcu C
CO
c M)-<
O
•
rH
0)
iHrOcO
H
CO
}->
4-1
CO
3en
Co•H .
4-1
O,
oCO
oa
o
co•H4J
oCO
434-1
•H
U
(3
O•H4-1
exMOCO
ob$ Cer•H4J
CO
Ouc•H434-1
•H
* g•H4-1
a.moCO
a
o•HtoO|
8as
H
00
O
+
CO
cu
S•H4->
toO
CO
CNCN
CN
OCN
CTi
UO43CO
t
CN
COCN
CO+JCO /->
8t^T) II
CO
ai 4_i
4-> wCO
4-1
XCU
4-1
OJ
4=4-1
O4J
OT3 •H01 O>,CU CO
^ •H
cu CO
5-1 CU
co CO
CO
CO
a)
CO CU
OJ CO
4= CU
4J 4=ti 4J
a)
M aCO •HCu
aa•H •H
4->
c CO
CU S-i
> 4-1
•rl ctoO CU
aCO fl
Mai
43e cu
3 4-1
G CO4-1
CI CO
OH >,4-1 XICO cO
3 CU
cr 4-1
0) CO
19
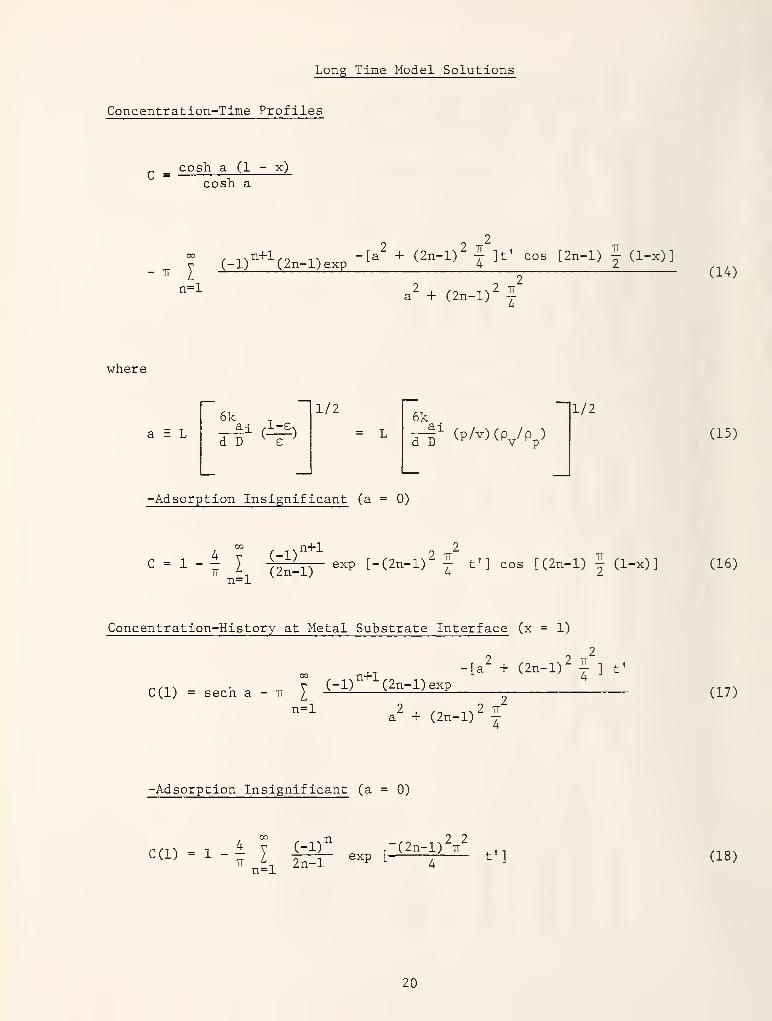
Long Time Model Solutions
Concentration-Time Profiles
C = cosh a (1 - x)
cosh a
- TT
n=l
2
(-l)n+1
(2n-l )exp- [a2 + (2n- 1} I
]t ' C0S ^^ 1 (1'X)]
2
a + (2n-l) T4
(14)
where
a = L
6k
d D ^ £y
1/2
= L
6k
-fj* (P/V)(pv/Pp)
1/2
(15)
-Adsorption Insignificant (a = 0)
4 rC = 1 -- I
n=l
r_,n+l 2
(2n_DexP [-(2n-l)
Z
Jt'] cos [(2n-l) f (1-x) ] (16)
Concentration-History at Metal Substrate Interface (x = 1)
C(l) = sech a - it I
n=l
n+1-[a
2+ (2n-l)
2 -] t'
(-1)1(2n-l)exp
^
2 2 ira + (2n-l) |
2(17)
-Adsorption Insignificant (a = 0)
00 n ? ?
rm - 1 ^ Y (-Dr-(2n-i)
z-z
C(D - 1 -^ I ^TT exp [- t']
n=l(18)
20
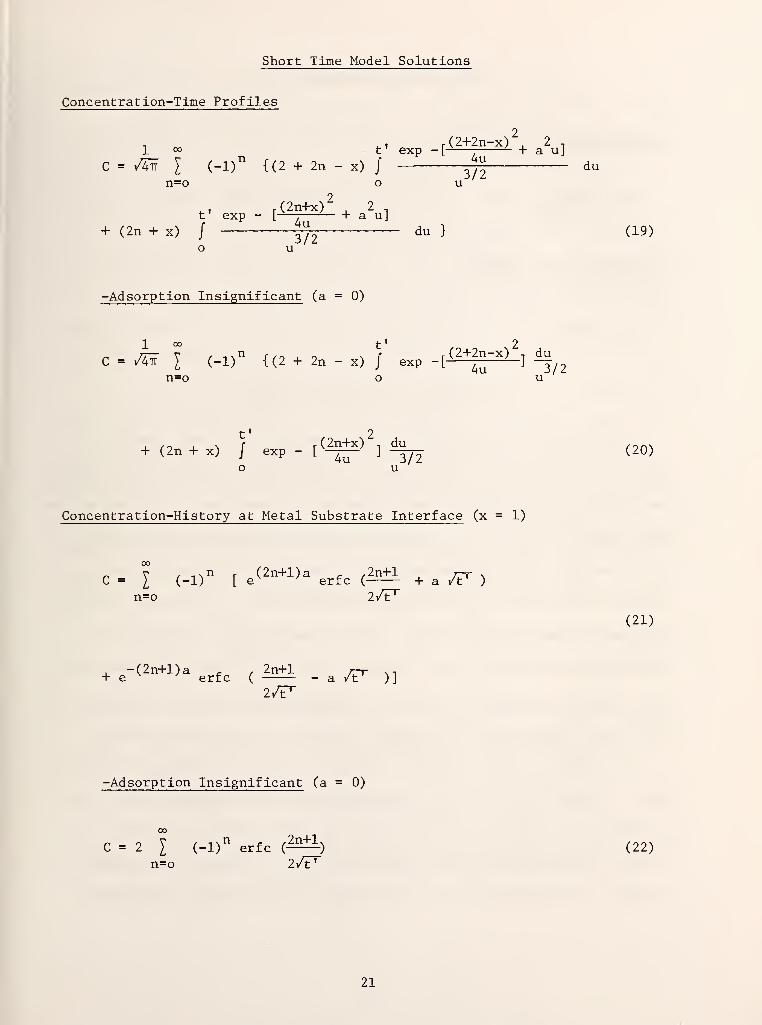
Short Time Model Solutions
Concentration-Time Profiles
. r (2+2n-x)2
,2 .
1 oo t1 exp -[-—
T
+ a u]
C = A? £ (-l)n
{(2 + 2n - x) / ^ du
n=o o u
2., r
(2n+x) 2 ,
t exp -L
—
t + a u]
+ (2n + x) / ^ du } (19)
o u
-Adsorption Insignificant (a = 0)
1 oo t' 2r,— v /-,\ii r,~ „ vf r (2+2n-x) , du
C = Arf I (-1) {(2 + 2n - x) / exp -[-—7^—
H
—/2
n=o o u
+ (2n + x) J exp - [^f^]% (20)
o u
Concentration-History at Metal Substrate Interface (x = 1)
C =I (-l)
n[ e
(2n+l)aerfc (
2n+l+ & ^ )
n=o 2/P"
(21)
, -(2n+l)a j. , 2n+l >r-r .,
+ e ' erfc ( - a /t' )]
2/T"
-Adsorption Insignificant (a = 0)
.211+1,C = 2 I (-l)
nerfc F5^) (22)
n=o 2/t1"
21
Steady State Solutions (t = «)
Concentration Profiles
_ cosh a(l - x) ,
cosh a
Concentration at Substrate
C = sech a (24)
3.2 Blister Formation and Growth
As discussed in Section 2.2, blister formation and growth occurs as a
result of the diffusion of water into the osmotic cell created at the coating-
metal interface by impurity ions. Blistering is considered to initiate at the
metal substrate interface at weak spots randomly distributed over the sub-
strate surface. These can be rough spots, spots with high impurity ion
concentrations or places with incipient adhesion loss. The weakest spots are
ones where blisters first initiate. Blister growth occurs when there is
sufficient water present in the vicinity of the metal substrate. Osmotically
driven diffusion of water through the coating controls the rate of growth. As
the blister becomes diluted with water the rate of blister growth slows.
To account for these phenomena several mathematical models are presented
here. In the first (developed in subsection 3.2.1), the impurity ions (such
as chloride or sulfate) are considered to be concentrated at specific spots on
the metal surface where blister initiation occurs. The rest of the surface is
presumed to be impurity free. In the second scenario modeled (developed in
22
subsection 3.2.2), the impurity ions are considered to be spread uniformly
over the whole surface. Blister initiation still takes place over weak spots
on the surface, but as the blister ages, new impurity ions are introduced at
the periphery. In both models it is presumed that the adhesion loss and the
stiffness of the organic coating do not control the rate of blister growth
[6, 7]. This means that the effect of the over pressure created by tension
in the disbonding film can be neglected. Thus, adhesion loss is considered to
be an effect rather than a cause. At later times the osmotic pressure may
fall to the point that the tension in the film cannot be overcome. At this
point blister growth will stop.
The mathematical models for growth of a blister on a metal substrate are
based upon a modified Fick's Law for the diffusion of water which takes the
flux of water (N) to be proportional to the product of the effective diffu-
sivity (D) through the coating, the concentration of water in the coating (C)
and the gradient of the logarithm of the water activity coefficient (d Ina/dZ)
across the coating between the external environment and the interior of the
blister [6, 7], This is expressed mathematically by the relation
N = - DC ^f (25)
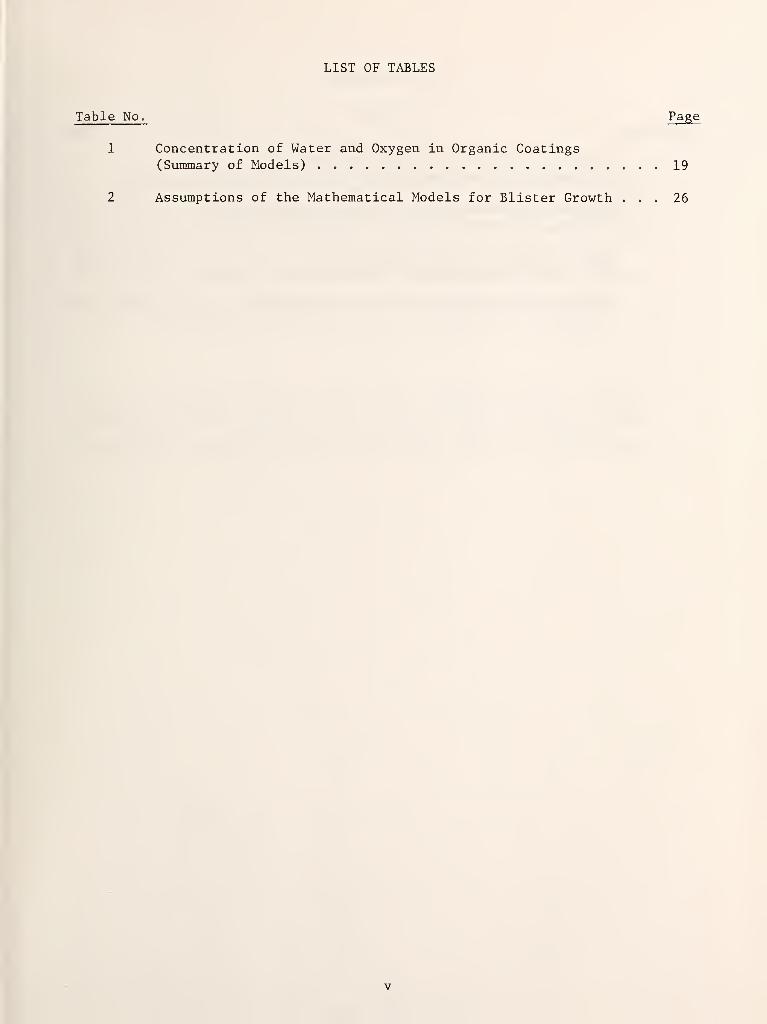
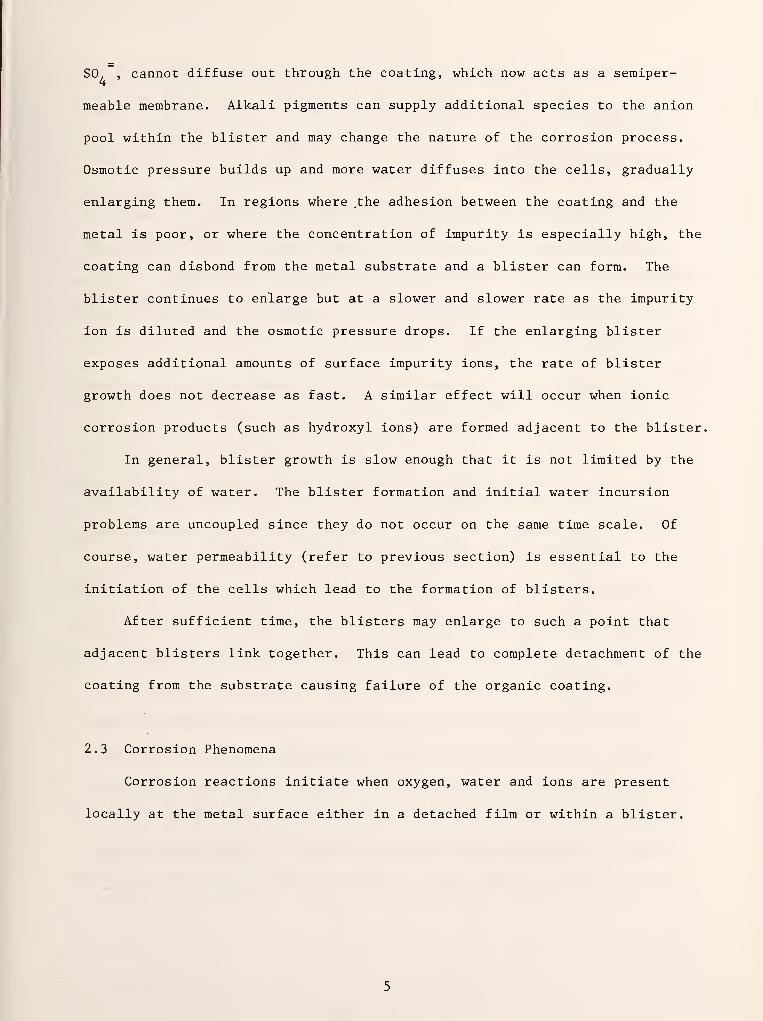
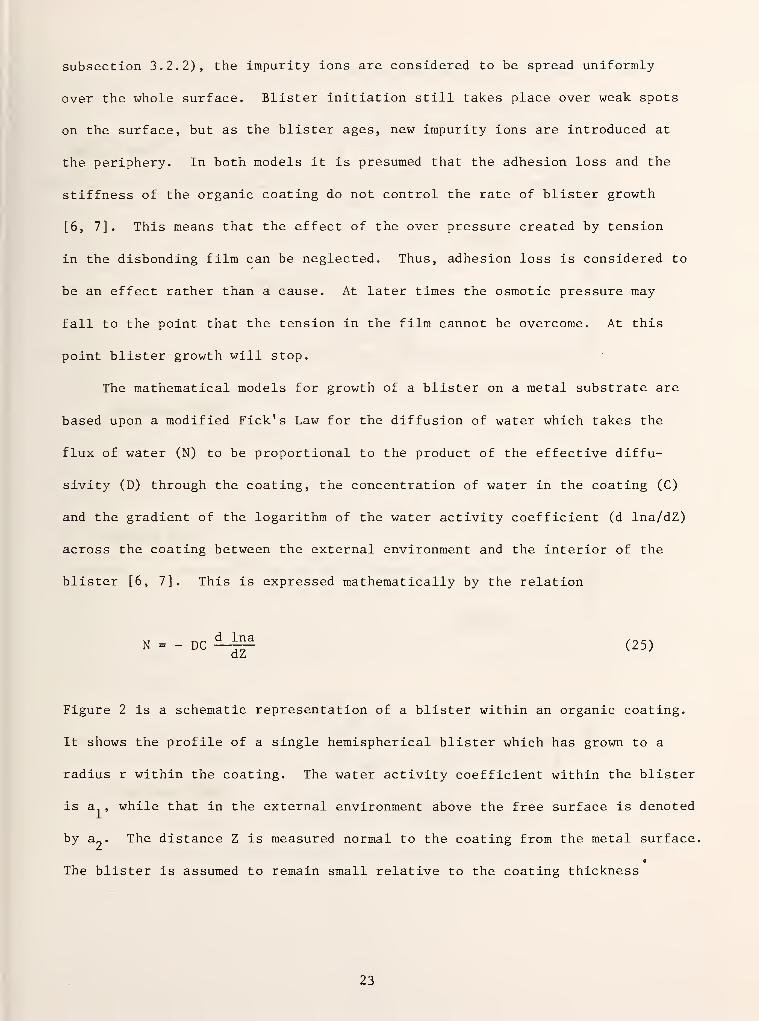
Figure 2 is a schematic representation of a blister within an organic coating.
It shows the profile of a single hemispherical blister which has grown to a
radius r within the coating. The water activity coefficient within the blister
is a , while that in the external environment above the free surface is denoted
by a„ . The distance Z is measured normal to the coating from the metal surface.
The blister is assumed to remain small relative to the coating thickness
23
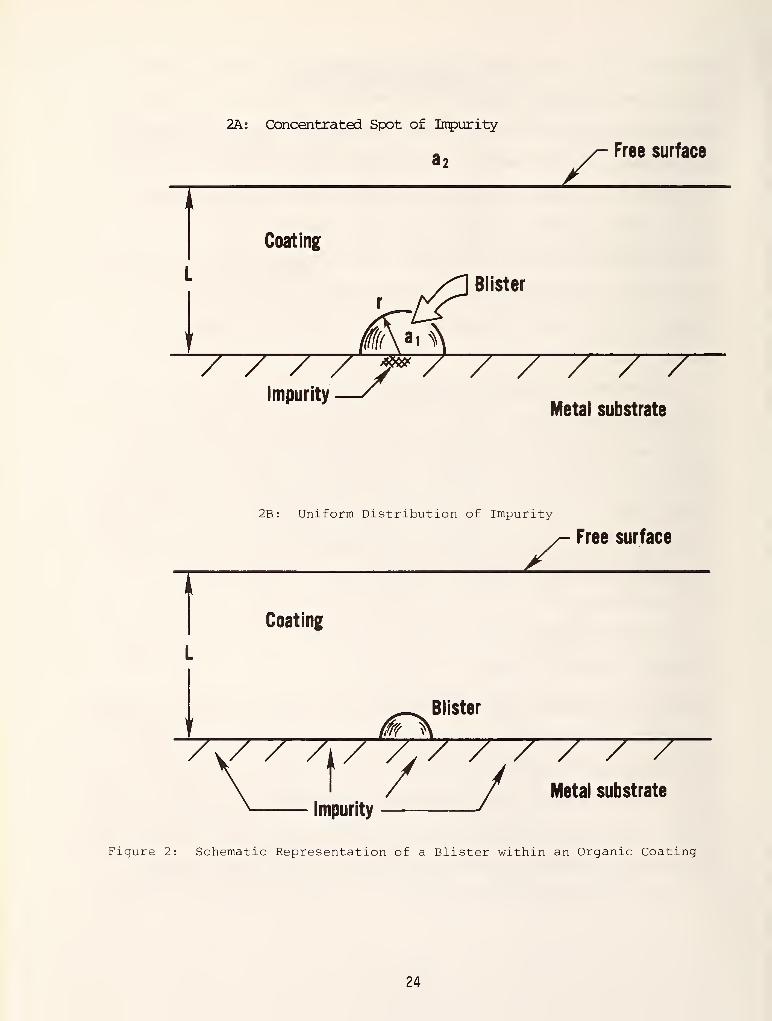
2A: Concentrated Spot of Impurity
a 2Free surface
Coating
Blister
/ / / / /Metal substrate
/ / / /Impurity
2B: Uniform Distribution of Impurity
Free surface
TCoating
Blister~ / /»/ VP 7 / / 7 /\
Impurity
Metal substrate
Figure 2: Schematic Representation of a Blister within an Organic Coating
24
(r << L) . This remains true for the initial and middle stages of blister
growth. In the later stages of growth, the blister may enlarge to the point
where its size approaches or exceeds the initial film thickness L. For this
stage, the models presented in this report will not apply exactly.
The assumptions made in the course of the development of these models are
summarized in Table 2. Because of assumption 4 in Table 2 the blistering
process is uncoupled with the process of molecular diffusion. Diffusion of
water during blistering is driven by the osmotic pressure and not by concen-
tration gradients (Fick's law) as described in the previous section. In
effect we are assuming, in this scenario that molecular diffusion is much
faster and occurs much sooner than the formation of blisters. By the time the
blisters begin to form there is plenty of water in their vicinty. In addition
the demand of the few small blisters which form for more water is minimal.
This implies that C, the total concentration of the concentration of water in
the coating in the vicinity of the blister, can be treated as a constant.
It can be shown [8, 9] that the gradient of the log of the activity coef-
ficient is proportional to the gradient of the molarity (m) of the impurity
ion, i.e., (dm/dZ) . m is expressed as moles solute/kg solvent. In this case,
in the light of the assumptions given in Table 2, equation (25) can be inte-
grated to give:
N =lTIooo Am (26)
25
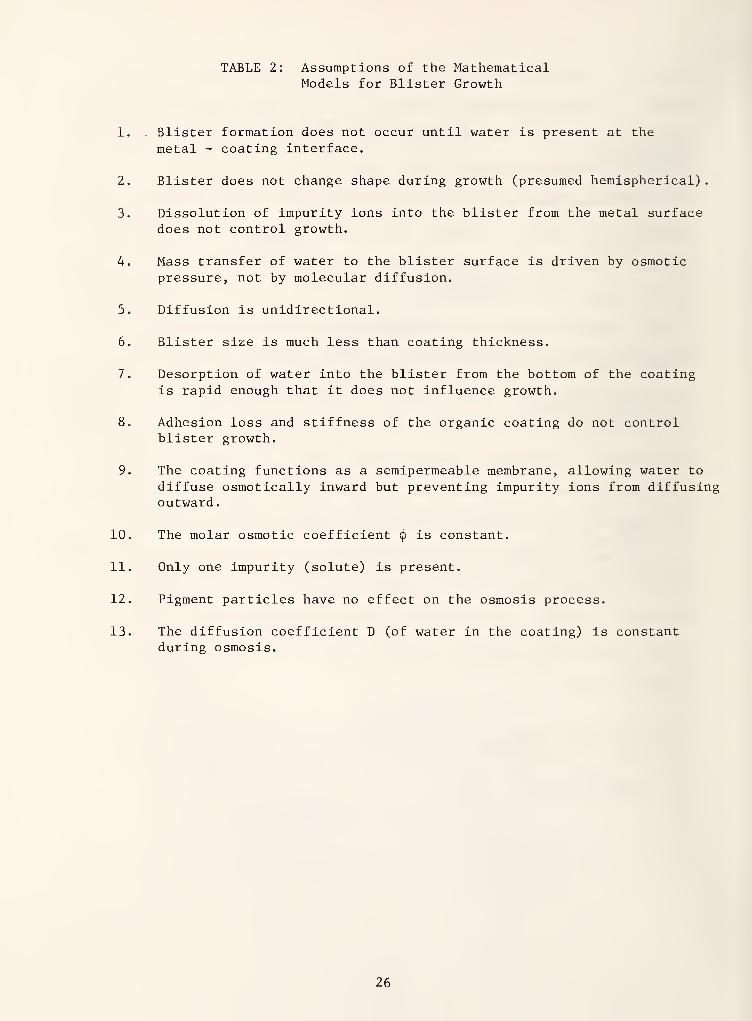
TABLE 2: Assumptions of the MathematicalModels for Blister Growth
1. . Blister formation does not occur until water is present at the
metal - coating interface.
2. Blister does not change shape during growth (presumed hemispherical).
3. Dissolution of impurity ions into the blister from the metal surfacedoes not control growth.
4. Mass transfer of water to the blister surface is driven by osmoticpressure, not by molecular diffusion.
5. Diffusion is unidirectional.
6. Blister size is much less than coating thickness.
7. Desorption of water into the blister from the bottom of the coatingis rapid enough that it does not influence growth.
8. Adhesion loss and stiffness of the organic coating do not controlblister growth.
9. The coating functions as a semipermeable membrane, allowing water to
diffuse osmotically inward but preventing impurity ions from diffusingoutward.
10. The molar osmotic coefficient <p is constant.
11. Only one impurity (solute) is present.
12. Pigment particles have no effect on the osmosis process.
13. The diffusion coefficient D (of water in the coating) is constantduring osmosis.
26
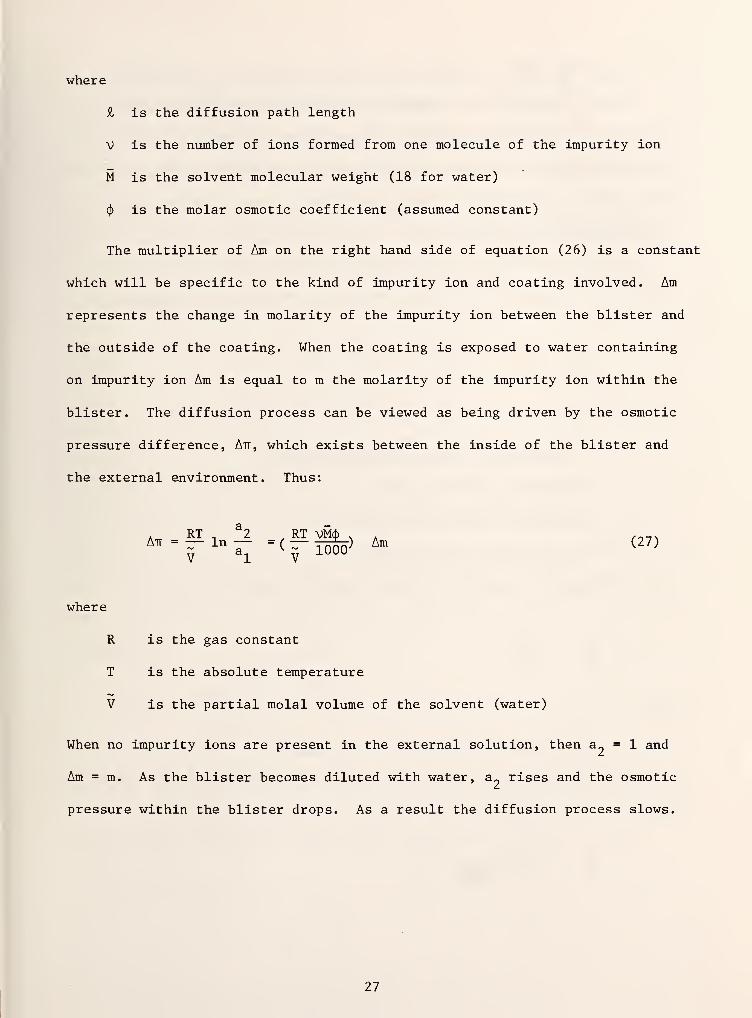
where
£ is the diffusion path length
V is the number of ions formed from one molecule of the impurity ion
M is the solvent molecular weight (18 for water)
<J>is the molar osmotic coefficient (assumed constant)
The multiplier of Am on the right hand side of equation (26) is a constant
which will be specific to the kind of impurity ion and coating involved. Am
represents the change in molarity of the impurity ion between the blister and
the outside of the coating. When the coating is exposed to water containing
on impurity ion Am is equal to m the molarity of the impurity ion within the
blister. The diffusion process can be viewed as being driven by the osmotic
pressure difference, Ait, which exists between the inside of the blister and
the external environment. Thus:
. RT .
a2 RT vMd> , . /0 -, NATT=
^ln
a7 "(-"lOOO* Am (27)
where
R is the gas constant
T is the absolute temperature
V is the partial molal volume of the solvent (water)
When no impurity ions are present in the external solution, then a„ = 1 and
Am = m. As the blister becomes diluted with water, a„ rises and the osmotic
pressure within the blister drops. As a result the diffusion process slows.
27
3.2.1. Blister Growth - Concentrated Spots of Impurity
When a concentration of impurity ions such as chloride or sulfate is
present at a metal surface together with a sufficient amount of water, then
blister initiation and growth occurs. Consider the metal to have a small spot
where a high concentration of impurity ions are located. This is shown
schematically in Figure 2A.
A water balance equates the increase in mass of the water within the
blister to the amount which fluxes through the mantle (curved) surface:
P § - ft - 5 S > (28)
where
p is the density of water within the blister
V is the volume of the blister
M is the mass of water within the blister
S is the surface area of the mantle
With the presumption that the blister retains its shape:
— = S — (29)dt
bdt
Uy;
where
r is a characteristic dimension of the blister
Substituting equation 29 and equation 26 into equation 28 and rearrang-
ing:
4^ = [M DC vM<j> - .
dtP I Tooo ] Am (30)
28
Equation 30 gives an expression for the rate dr/dt at which the blister
dimension r increases with time. The volumetric blister growth rate is
S dr./dt, while the mass blister growth rate is p S dr./dt.
The molarity m is a function of the amount of salt present at the blister
initiation site, M , and the amount of water which has diffused through the
blister surface. An electrolyte or salt balance made on the blister yields:
dM
"at= Ar
d(31)
where
A is the (flat) area of the blister on the metal surface
2r is the rate of dissolution based on surface (grams/mm , s)
In general, the dissolution rate r, is quite high when compared to the timed
scale for water diffusion. The impurity ion are concentrated right at the
bottom of the blister and they have ready access to the blister interior. The
dissolution is effectively complete before much water has had a chance to
penetrate the blister. In this case the molality within the blister can be
expressed directly as:
1000 Mm = r-5- (32)
M Ms
Substituting equation 32 into equation 30, with Am = m (no impurity ion in the
external phase), and integrating, expressions for the blister radius r, mantle
surface area S and blister volume V are obtained as a function of time:
1/4r = k
rt (33)
29
where
1/2S = k t
'(34)
s
3/4V = k t
J/H(35)
v
M DC 9 n,.
k = 2tt k2
(37)s r
k = 4 tt k3
(38)v 3 r
k , k and k are constants for the radius, surface area, and volume, definedr s v
respectively by equations (36), (37) and (38). In the development of these
models, the blister was assumed to retain the shape of a hemisphere throughout
its growth. The characteristic dimension r is the radius of the hemisphere.
The modal can be simply extended to other blister shapes which are surfaces of
revolution, such as the segment of a sphere or an ellipsoidal shape.
Equation (35) predicts that the blister mass (or volume) increases as the
0.75 power of time. If the time is doubled the blister volume increases by 68
per cent. The blister radius increases as the 0.25 power of time (equation 33)
The blister radius doubles after the time has increased by a factor of 16.
These results also predict that the rate of blister growth slows with time,
being greater at the beginning when the blister is small and contains a con-
centrated salt solution, and less later when the solution in the blister has
become diluted with water.
30
Combining equations 27, 32 and 35 an expression can be derived for the
osmotic pressure as a function of time:
1/4 -3/4Att = k Mc
/Ht
'
(39)p S
where
3/4 1/4
kP
=2^ " [-T~ ] ^ (40)
p M V 6 MDC
Equation 39 predicts that the osmotic pressure varies the 0.25 of the
amount of salt in the blister and reciprocally with the 0.75 power of the
time. At time zero the model predicts very large osmotic pressures within the
blister. At small times the model predicts very large osmotic pressures
within the blister. The molarity, however, cannot exceed the saturation
value, m*, of the impurity ion in water. This places an upper limit on the
osmotic pressure as predicted by equation 27 with Am = m*.
The dimension £ contained in the equations represents a characteristic
diffusion length. In cases where water must be drawn in from the external
environment, Z = L, the coating thickness. When water is already present as a
result of the diffusion process then £ = 6, where 6 represents a characteristic
film thickness (6 < L) for the diffusion process. With no diffusional resis-
tance, water in the vicinity of the blister would pass freely across the
mantle surface and blister growth would be quite rapid.
3.2.2 Blister Growth - Uniform Distribution of Impurity
The second type of blister growth model considers the impurity ion to be
uniformly spread across the surface. This is shown schematically in Figure 2B.
31
For the growth of a single blister, this differs from the previous model
development in one important aspect - as the blister grows, fresh impurity
enters through its base. In this case the amount of impurity ion, M , added.
to the blister is proportional to the flat or base area, A, of the blister
2(equal to Trr for a hemispherical blister) . The greater the area of the
peeled blister, the greater is M . Thus
M = k'A = k'TTr2
(41)
The proportionality constant k' in equation 41 is equal to the surface con-
2centration of impurity ions, g/mm .
As in the previous model, this model presumes that the rate of dissolu-
tion of impurity ions into the blister is quite rapid compared to the rate of
blister growth. Thus, as the blister peels from the surface, the fresh
impurity ions exposed on the surface can be considered to immediately transfer
into the solution. By substituting equation 41 and equation 32 into equation 30,
with Am = m, and integrating, expressions are obtained for the blister radius,
mantle surface area and blister volume as functions of time:
r - k' t1/2
(42)
where
S = k» t (43)s
V = k' t3/2
(44)
K- [fK'-^h V*] 1/2(45)
rM C Is
32
k» = 2tt k' (46)
. = 1 „ ,,,3k' = -=- TT k'^ (47)v 3 r
k 1
, k 1 and k', are the constants in equations (42), (43) and (44), defined,
respectively by equations (45) , (46) and (47)
.
An expression for the osmotic pressure within a blister growing over a
surface containing a uniform amount of impurity is obtained by combining
equations 27, 32, 41, 42, 45 and 47:
Att = k' t1/2
(48)P
where
| k f
v<J> I1/2
k» = 1000 [- —
]
(49)P MM DC
s
The specific values of the osmotic pressure depend on the value of the osmotic
rate constants, k' given by equation 49.
3.3 Corrosion Phenomena
Corrosion is possible and, after sufficient time probable, whenever
water, oxygen and an electrolyte are in proximity to a metal surface. Because
the metal is at a higher free energy level than the corrosion products, there
is a driving force for corrosion. The potential for corrosion can be evaluated
by considering the difference in potential between the half-cell reactions
which occur at the anodic and cathodic sites on the metal surface. For any
33
given coating-metal system, the tendency to corrode varies with the tempera-
ture, and concentrations of water, oxygen and electrolyte in the vicinity of
the metal. Higher values of any of these variables can act to accelerate the
corrosion process. When concentrations of one of the chemical species are
low, e.g. oxygen, corrosion rates depend on the rate at which it is trans-
ported to the cathodic site. Since oxygen permeation controls the observed
corrosion rate, it can then be considered to be the rate-limiting step. In a
similar fashion, water permeation would be rate-controlling if the concentra-
tion of water at the corrosion site were low. This could result from: a) low
relative humidity outside the coating, b) low affinity of the coating for
water (low C. ), c) high affinity of the pigment for water (high k ) , d) slow10 a
diffusion of water through a relatively thick coating.
The electrolyte itself would control observed rates whenever its concen-
tration in the water solution were low. This would result from low initial
concentrations of impurity ions on the metal surface (clean surface) and
dilution of the electrolyte by water within a blister because of osmotic flow.
Since the corrosion reactions themselves can generate electrolytes (e.g.,
hydroxyl ions), the process can be self-accelerating or autocatalytic, with
more and more ions being released into solution. This, in turn, may raise the
ionic strength within the blister leading to the incursion of more water. The
enlarging cathode area associated with the growing blister can accelerate the
corrosion even more, both because of the larger area and the differential
aeration which occurs where oxygen has easier access at the periphery of the
blister.
34
3.3.1 Potential Difference Model
The greater the potential difference between the anode and cathode, the
greater will be the driving force for corrosion. As the corrosion reactions
proceed, the driving force diminishes because of the build-up of reaction
products in the vicinity of the electrode surfaces. Thus the driving force
for corrosion is the potential difference between the anode and the cathode.
The initial value of the driving force is determined from the thermodynamic
potentials of the half cell reactions (refer to Section 2.3). The existence
of this potential causes electron flow and corrosion proceeds. As the poten-
tial of the cathode, E , drifts towards that of the anode, E , and vice versa,
polarization occurs. Polarization was modeled in terms of the potential
difference 6 between the anode and the cathode, where 6 = E - E . Thus the
cathode potential rises (and the anode potential falls) at a rate which is
proportional to this difference in potential.
Mathematically, this is expressed as
dEc
dT " kc
6 (50)
"dEA
= k A 6 (51)dt A
k and k are unknown polarization rate constants for the cathode and anode,
respectively. Their units are reciprocal time, s . They vary with tempera-
ture and anode and cathode surface area. Thus:
kA
= V SA
eXP [ _LA/RT ] (52)
kc
= kcoo
sc
exp c"L
c/RT ] (53)
35
where
S., S are the anode (A) and cathode (C) surface areas
L , L are the activation energies for the anode and cathode
R is the gas constant
and
k A , k^ are specific rate constants (based on area) for the anode
and cathode.
Equations 52 and 53 are based on the presumption that the rate constants
follow an Arrhenius - law type temperature dependence, and, in fact, k and
k are analogous to Arrhenius frequency factors. When the temperature and
surface areas of the anode and cathode are constant, and the electrode has a
uniform potential across it, both k and k are fixed and equations 50 and 51A Li
can be solved analytically to give :
k + k^A
F A r F k Ff£ = r_ 1I0C \_ _ foA -<k + k ) t (54)
E L k+lc J k+k U E ;h0C
RA+ k
CkA+ k
Cb0C
k + k^A
EA r
A C E0C . \ ,
E0A .. -(k. + k_) t
r.— =
[ ] + (- 1) e A C (55)h0C
KA+ k
CkA
RC \)C
6 - (E0A
- Eoc
) e"(kA+ V C
(56)
+The complete derivation of these equations is given in Appendix B.l,
36
E^ A and E^„ are the initial potentials of the anode and the cathode, respec-OA OC
tively. (EnA- Enr ) is equal to initial potential difference, which can be
found from the thermodynamic half cell potentials.
Equations 54 and 55 predict that the anode potential decreases and the
cathode potential rises at ever decreasing rates towards a common final
potential Ef
given by:
kAEOC
+ kC
E0A ,__.
Ef \^~ (57)
Equation 56 gives the driving force 5 for the polarization process. It
decreases exponentially with time. After a suitably long time polarization is
complete, 6 -* 0, and both anode and cathode have the potential given by
equation 57.
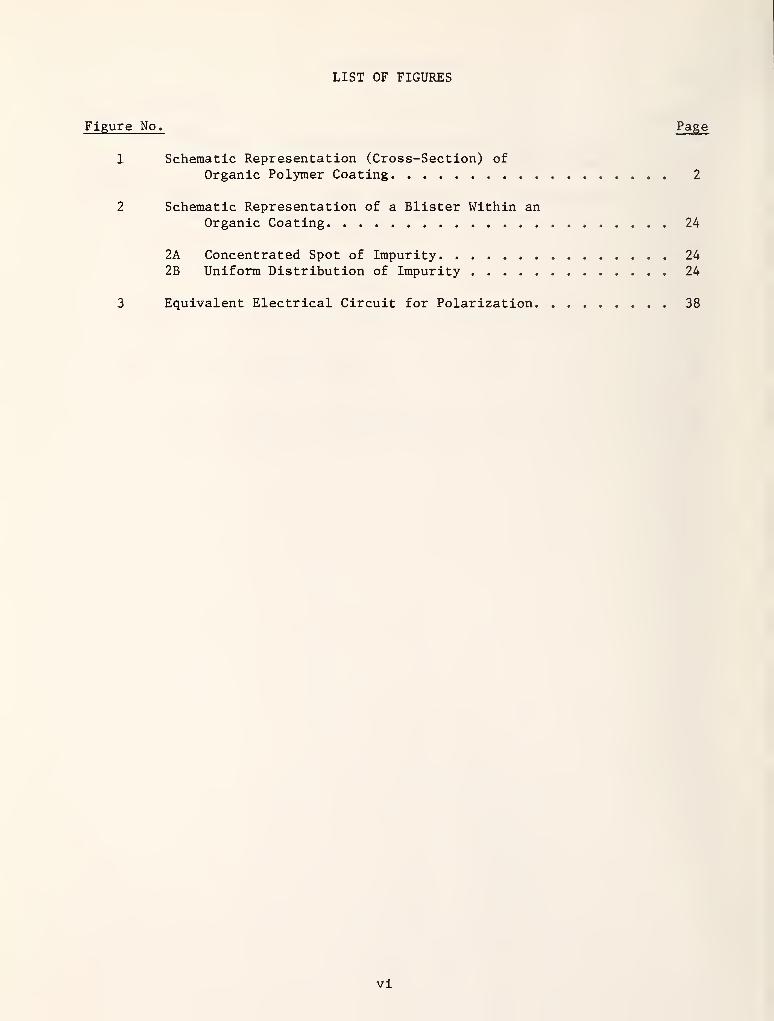
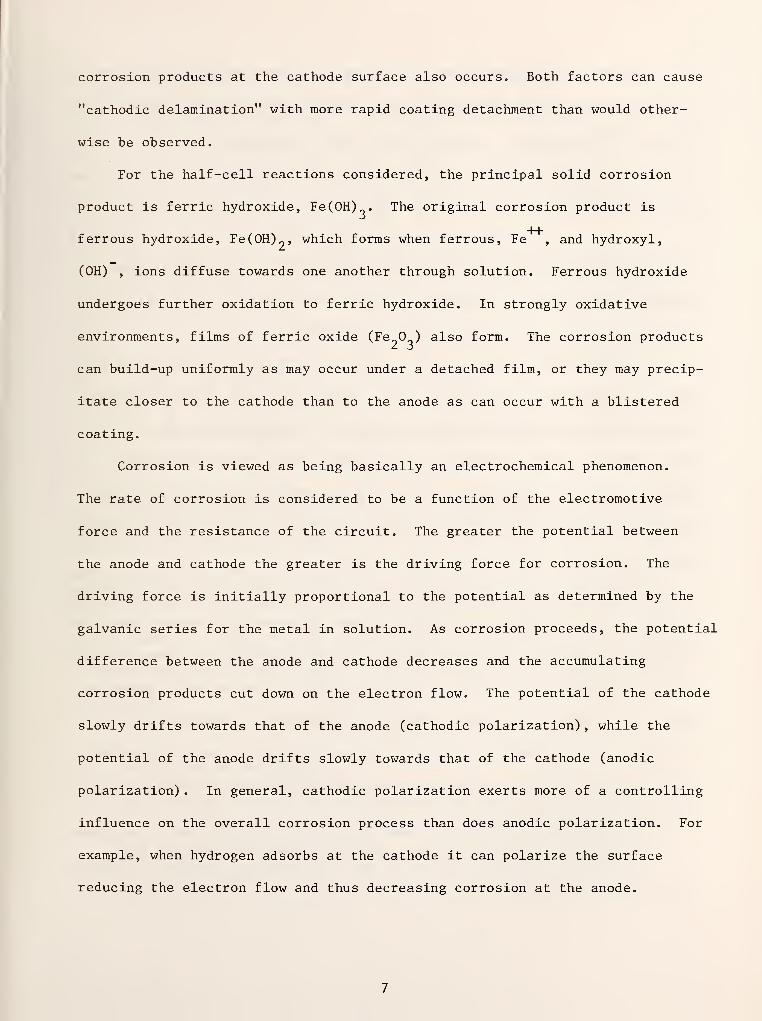
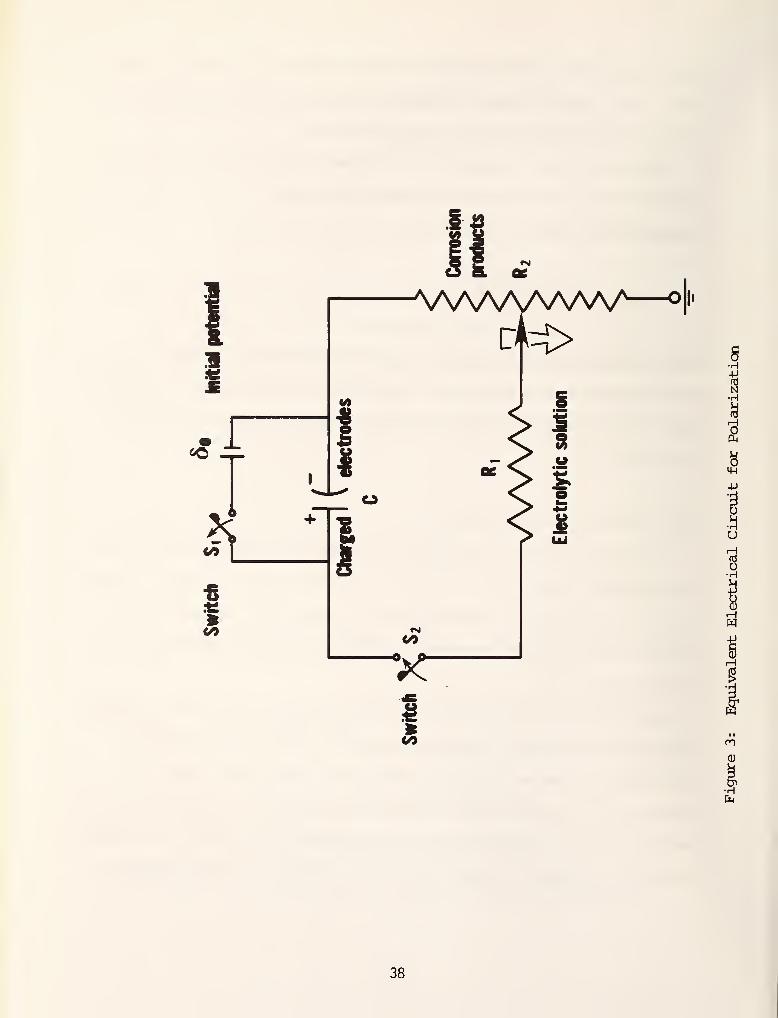
3.3.2 Equivalent Circuit Model
An alternative model can be developed in which the polarization process
can be modeled in terms of an equivalent electrical circuit. Figure 3 shows a
schematic of the circuit. The anode and the cathode are taken to be at the
opposite end of a charged capacitor C having an initial thermodynamic poten-cL
tlal 6 = E0A " E0C
As with the potential difference model developed in the previous section,
this model is based on a voltage difference 6 between half cell reactions.
This falls with time and eventually reaches some steady state value. The
existence of a potential causes electron flow through the solution and polar-
ization proceeds. The driving force is represented in the model by a charged
capacitor. Initially the capacitor is fully charged. As shown in figure 3,
37
CM
a
AA/WWVWdfco
<or
Tftco
co
I
CMCO
oh
HidN
a
J!
9
•H
pa
*CO
•Hfa
38
at time zero the switch S-. is opened, the switch S„ is closed, and the circuit
is completed. The capacitor then slowly discharges through the resistances.
The electrolyte serves as a charge carrier for the electron flow. But
the presence of the electrolytic solution contributes to the overall resis-
tance of the electrical circuit. The resistance R will remain the same as
long as the composition and conductivity of the solution remains the same. At
the beginning of the polarization process, before the products of corrosion
have accumulated, this is likely to be true. Also at later times when the
corrosion products have come to a pseudo-equilibrium with the electrolyte
solution, R would also tend to be constant. In between, R would decrease
from its old level towards a new level. The decrease in resistance is caused
by an increase in ionic conductivity as product ions, particularly OH and
Fe, are released into the solution. When the concentration of these ions
reach the solubility limit, solid reaction products precipitate from solution
and the conductivity becomes constant again.
The initial potential decreases because of the electron transfer or flow
of current. The initial current decreases both because of the decreasing
potential, and the increasing resistance R (refer to figure 3), attributable
to the corrosion products. The products can form an adsorbed film of ions or
gases on the cathode surface, or a solid layer of corrosion products such as
Fe(OH) or Fe 0, can deposit on the surface. In either case, the resistance
increases with time, although film formation would be more rapid than product
layer formation.
With film formation either of two mechanisms can operate:
a) a monolayer of ions or gases can adsorb on the electrode surface
(Langmuir adsorption mechanism)
.
b) an electrical double layer can form in the vicinity of the surface.
39
For mechanism (a) , ions (or gases) adsorb on active sites located on the metal
surface at a rate which is proportional to the product of the number of
unoccupied sites with the concentration of ions in the bulk solution. They
desorb at a rate proportional to the number of occupied sites. These assump-
tions are analogous to those of the classical Langmuir theory for the physical
adsorption of gases. The electrical resistance of the adsorbed ions (R9) will
be proportional to the fraction of the total surface which is occupied. Based
on the Langmuir theory, it can be shown that
R2
=(Vu U " 6
at](58)
where
(R ) is the ultimate or final resistanceI u
and
a is the rate constant for film formation by Langmuir adsorption
The development of equation 58 presumes that the concentration of adsorbing
ions in the conducting fluid medium does not change with time. This is
reasonable considering the relatively small number of ions which can generally
supply monolayer coverage to a surface. Equation 58 predicts that R~ increases
linearly with time at the beginning of the corrosion process when the surface
has only a small coverage of adsorbed ions. At later times, when the surface
The complete derivation of equation 58, including the determinations of thevalues of (R~) and a in terms of Langmuir theory, is presented in Appendix B.2.2,
40
is nearly covered, the resistance approaches a constant value. If the rate of
increase is high, corresponding to a large value of the constant a, then
monolayer coverage is rapid and R„ is constant during most of the corrosion
process.
An electrical double layer can also form next to the electrode surface as
a result of the electric field in the interface region between the metal
surface and the solution [10]. Water, which has a large dipole moment, can
form an ionic cloud near the metal surface. The water dipoles next to the
metal surface orient themselves depending on the charge on the metal. This
inner layer of water molecules is known as the "hydration sheath." The second
layer out from the surface contains saturated ions and is known as the "outer
Helmholtz plane." Together the hydration sheath and Helmholtz plane comprise
an electrical double layer. The formation of a double layer increases the
resistance to the transfer of electrical charge, and specifically, R_ . At
present, the precise way in which R„ varies with the charge and composition of
the electrical double layer has not been determined.
Solid corrosion products such as Fe_0„ or Fe(0H)_ can deposit on the surface,
These, too, will increase the resistance R and cut down on the charge transfer.
If the products accumulate uniformly over the surface of the metal, the resis-
tance increases in direct proportion to the thickness of the corrosion layer.
Thus:
t
R_ = 6 % = y / idt = y (Q - Q) = YC (5-6) (59)
41
where
£ is the thickness of the corrosion products
$,y are empirical constants of proportionality
i is the current
Q is the charge
Q is the initial charge
The thickness I can only be measured accurately if a tarnish layer
accumulates, but it can be implied from the theory developed here.
Equation 59 expresses the fact that the total amount of corrosion product
laid down, by Faraday's Law, are proportional to the total corrosion currentt
which has flowed until time t, i.e. / idt. This in turn will be equal to theo
change in charge, (Q - Q) or C (6 - 6) . Thus, the resistance at any time iso a o
proportional to the degree of polarization.
Referring again to Figure 3, it is possible to derive expressions for the
charge Q, the current i, and the voltage drop 6, provided the resistance of
the electrolytic solution, R.. , and the resistance of the corrosion products,
R„, are known as functions of system variables.
Applying Kirchoff's Second Law (the algebraic sum of the potential
differences around any closed loop is zero) to the electrical circuit shown in
figure 3:
i (R1+ R
2) + - / idt = (60)
a o
since
i - §
42
Equation 60 can be rewritten as
(Ri+ V f +
c • ° < 62 >
a
with the initial condition that
Q = C 6 (63)o a o v '
With assumptions made about R- and R , these circuit equations were
solved to give the charge, Q, current, i, and potential difference, 6, as
functions of time. In all of the developments, both C , the capacitance of3.
the charged electrodes, and R1
, the electrolyte resistance, were taken as
constants.
Three different sub-models were used for R„, the resistance of the cor-
rosion products. These included:
(a) a constant value of R_
(b) R„ based on film formation by Langmuir adsorption (equation 58)
(c) R based on the uniform accumulation of a layer of corrosion products(equation 59)
Solutions to each of these sub-models for Q, i and 6 are summarized here.
They are based on the circuit-model equations, 60, 61, 62 and 63. Derivations
are supplied in Appendix B.2.
When R~ is constant, sub-model (a) predicts that:
§ " I =1 = £XP [(R, + V C
] " »» ("t/T) (M >
o o o 12a
43
where
*o T^ <«>
and
T = (R. + RjC (66)12a
Equation 64 predicts that the relative charge, current and potential difference
all fall exponentially at the same rate, t = (R.. + R„)C represents a timeX L. 3.
constant for this process. In general, T will be an unknown model constant
since C is unknown. The initial current i is calculated using equation 65,a o b
from the initial potential, 6 , and total circuit resistance.o
When R- is based on film formation by Langmuir adsorption (sub-model (b))
the corresponding formulas for Q, 6, and i are:
1at
jcR e R ax
o o 1 1
atR e R ax
[(i + ^) -^ii
Ri
Ri
i rn Ro [1 + u ,- -at N n
j£ (1 - e )]
(68)
where
T = C (R. + R ) (69)u a 1 u
T is a system time constant based on the final resistance (R. + R ) whichu 1 u
corresponds to equilibrium monolayer coverage of the electrode surface.
Equation 67 predicts that the relative charge and potential difference
should both fall in the same manner. Equation 68 gives an analogous expres-
44
sion for the current. The initial current i is equal to 6 /R- in this case,o o 1
since R_ is initially zero. A comparison of equations 67 and 68 shows that:
D
| =f U + /> (70)
o o 1
Since R increases with time equation 66 predicts that the relative current,
i/i , falls faster than the potential difference ratio, -* . At large valueso
of the constant a:
R " t/T
ft-|-a + ^) (7Do o 1
while
f - a + jp) (72)
o 1
Physically large values of the constant a corresponds to the rapid
attainment of equilibrium of the adsorbing species with the metal surface.
When R„ is based on the accumulation of a layer of solid corrosion pro-
ducts, the corresponding formulas for Q, 6, and i are:
C YQo d-Q/Qo ) -t
1
\Ca[Ri + yQq
. y fij
O
(74)
45
Equation 73 is transcendental in Q/Q , and must be solved numerically for
specific values of model parameters. Once Q/Q is known, the current ratio
i/i can be found from equation 74.o
4. DISCUSSION OF RESULTS
4.1 Water and Oxygen Permeability
Equations 14 through 24 present expressions for the water and oxygen
concentrations within the coating and at the metal substrate as a function of
time. The equations for the concentration are expressed in terms of dimension-
less variables and parameters: dimensionless concentration, C = C./C. ,
l 102
dimensionless depth, x = z/L, dimensionless time, t' = tD./eL , and dimension-
less parameter, a, defined by equation 15. It is advantageous to express the
model in terms of dimensionless groups since in effect, all possible cases can
be condensed into a single mathematical form.
Even though the models have the same mathematical structure, they predict
that each species penetrates the film at different rates. This is because
specific model parameters will differ for each penetrant. These parameters
are C. , the concentration of penetrant dissolved at the top of the coating,10 r °
D., the effective diffusion coefficient of penetrant through the coating and
k. , the adsorption coefficient of the penetrant on the surface of the pigment
3.1
particles.
For a given coating (fixed L and e) , the actual values of C. , D. and
k . will determine the concentration of the penetrant at the metal substrateai
as a function of time. Each penetrant's concentration rises towards its final
or steady-state value. The rate of rise depends on the value of the model
parameters
.
46
The concentrations at the coating-substrate interface depend on t' and
the degree to which pigment particles are effective in removing water and/or
oxygen. Permeation to the surface becomes important at times t when the
dimensionless time (t') is of the order of unity (t1 ~ 1). It is important to
emphasize that it is t' which affects the rate at which steady-state is
attained rather than the absolute time t.
For t' < 1 the short time model solutions (equations 19, 20, 21 and 22)
should be used. For t' > 1 the long time model solutions (equations 14, 15,
16, 17 and 18) should be used. For dimensionless times t' ~ 1, either set of
solutions produce equivalent answers, with a similar number of terms needed
for convergence in the infinite series. At such times, the penetrant concen-
trations in the coating will have risen to within a significant fraction of
their final or steady-state values. Thus the protective performance of the
film will be enhanced if D. is small, L is large and £ is small. The most
sensitive of these parameters is the film thickness, L. If L is doubled it
takes four times as long for the penetrant to reach a given fraction of its
final concentration. This is one of the reasons why the use of multiple coats
of paint is preferred. From this single viewpoint, using five coats of paint
is over thirty times as effective as a single coat.
In addition to dimensionless time t', concentrations at the coating-
substrate interface also depend on the affinity of the penetrants for the
pigment particles. A quantitative measure of this effect is provided by the
dimensionless parameter a, as defined by equation 15.
6kai 1p 1/2 6k . p
1/2a - Lld-DT<¥» =L hTi7(p/v)^] < 15 >
1 ± pp
47
The higher the value of the parameter a, the greater is the retention of
the penetrant within the organic coating. Water and oxygen have different
values of a, mainly because of the different chemical attraction they have for
the pigment particles when dissolved in the vehicle. The parameter a is a
function of pigment loading, (p/v)(p /p ), pigment particle diameter, d,
diffusivity, D., affinity of the pigment particle for the penetrant, as meas-
ured by the adsorption coefficient k . , and coating thickness L. a can take
on any positive value, including zero. Realistically, a can be zero if no
pigment is used (as in varnishes) or if the pigment has no affinity for the
penetrant, i.e. k . = 0. For example, a = if oxygen absorbed in the coating3.1
does not adsorb on the surface of titanium dioxide (TiO ) pigment particles.
In order to keep the concentrations of the penetrants small at the metal
surface and, thus minimize the potential for corrosion, it is best to design a
coating system which has a high value of the parameter a. According to
equation 15 this will occur with a suitable combination of the following
factors:
1. lots of small sized pigment particles (p/v high, d low)
2. retarded diffusion through the coating (D low)
3. rapid adsorption onto pigment particles (k . high)3.1
4. thick coating (L large)
The parameter a is most sensitive to this last factor. a varies in direct
proportion to coating thickness, doubling the thickness doubles the value of
a. This is in contrast with the other parameters which vary directly or
inversely with the square root, which is a less sensitive function. All of
the factors listed act to retain the penetrant within the coating, not allow-
48
ing it to reach the metal surface. Two additional factors will also act to
keep penetrant concentrations low at the metal substrate:
5. low solubility of the penetrant into the vehicle (low C. )
6. short contact times (low t')
Thus, even in the worst possible case, where a = 0, it is still possible to
have low concentrations at the metal surface if the solubility of the pene-
trant into the vehicle is low, for the concentration at the surface may never
exceed this value. Also, the concentrations at the metal surface do not start
to reach an appreciable fraction of their final or steady-state values until
the dimensionless contact time t' is approximately unity. Thus, the surface
concentration relative to its final value remains low until time 0, where the
characteristic time Q is given by:
9 = £L2/D. (75)
l
For a typical film with L = 0.1 mm, D = 0.5 x 10 mm /s (an estimate) and
£ = 0.5, this leads to = 1000s. Typical service lives of most organic
coatings are many orders of magnitude greater than this. This implies that
steady state will be attained in a matter of hours (at least for this value of
the diffusivity) . Thus short contact times may not be an important contri-
-10 2buting factor. However, for lower values of the diffusivity (say D. ~ 10 mm /s,
which would be typical of solid-state dif fusivities) the contact time would
become an important factor [11, 12].
Examining the diffusion process in terms of the overall protective function
of the coating, both water and oxygen must be present in concentrations which
49
are sufficient to initiate and accelerate corrosion. The steady state concen-
trations of oxygen and water at the metal surface are given by equation 24 as
C. = C. sech a. (24)1 io 1 '
Whether or not corrosion will actually occur will depend on the temperature,
pH, nature of the metal and electrolyte and the electrochemical potentials of
the half-cell reactions. In some instances corrosion will not occur regard-
less of the oxygen concentration because it is thermodynamically unfavorable
or favors the formation of a passive oxide film. Pourbaix diagrams of potential
vs pH are convenient ways to summarize such information [13]. In some regions
it is possible to go from a condition where corrosion is not possible to one
where it is, by simply increasing the oxygen concentration. At the point
where this occurs the specific concentration is denoted as C . whether or
2,cnot corrosion will actually occur cannot be determined a priori but this
concentration represents a threshold above which corrosion is possible. In
addition as the oxygen concentration is raised the probability that corrosion
will occur becomes more likely. Since the concentrations at the substrate
rise with time at suitably long times the limit C may be exceeded for a
2,cgiven coating and environment. Thus the possibility for corrosion will exist
when C is less than the steady state value. The absence of corrosion is
2,c
indicated by:
C. sech a. < C. (76)io i ic
where
50
To insure that corrosion will not occur, equation 76 need only be valid for
oxygen or water. For such a system, corrosion is prevented if a can be
raised, or C lowered, to the point where the inequality is obeyed for oxygen.
For an existing coating system, a can be raised most conveniently by applying
extra layers of coating, while C can be lowered most conveniently by lowering
the concentration of penetrant in the external phase. In laboratory situations
the partial pressure of oxygen can be lowered, e.g., by dilution with nitrogen,
or in aqueous systems by bubbling nitrogen through the solution. Coatings
exposed to the atmosphere will have the partial pressure fixed at 0.21 atm.
In terms of the design of a coating system, the model predicts that better
protection will be afforded if:
1. a large fraction of pigment is used in the formulation
2. smaller particles are used
3. a denser, thicker coating is applied
4. the coating is made oxygen and water repellant
Using the model, the exact quantitative effort of each of these factors can be
assessed.
4.2 Blister Formation and Growth
In section 3.2 two mathematical models were developed for the growth of
water-filled blisters at the metal substrate under the coating. Both models
were based on diffusion and osmotic theory and had a single adjustable con-
stant, the osmotic rate constant. Equations were given for the radius, mantle
surface area, and volume of a hemispherical blister as a function of time.
In the first model (refer to section 3.2.1), blister growth was con-
sidered to occur over concentrated spots of impurity located at the point of
51
blister initiation. No new impurity ions come into the blister as it grew.
This model was mathematically expressed by equations 33 through 40, with the
osmotic pressure relationships given by equations 39 and 40. In the second
model (refer to section 3.2.2), blister growth was considered to occur over an
unclean surface which contained a uniform distribution of impurity. As the
blister grew, fresh impurity entered through its base. This model is mathe-
matically expressed by equations 42 through 49, with the osmotic pressure
relationships given by equations 48 and 49.
Both models have the same mathematical form - the radius, surface area
and blister volume all vary directly as the time raised to various fractional
powers. Also, for both models, the blister volume varies as the cube of the
blister radius, while the mantle and flat surface areas both vary with the
square of the radius. Comparing the model solutions for concentrated impurity
distribution (equations 33, 34 and 35), with those found for uniform salt
distribution (equations 42, 43 and 44), shows that the blister size increases
more rapidly with the uniform salt distribution. Blister size will double
when the time has increased by a factor of 1.6, compared to a factor of 2.5
for concentrated salt distribution. As time proceeds, the rate of blister
growth actually increases (as /t~~) . This is unlike the concentrated salt
distribution case where a decrease in volumetric growth rate with time is
predicted
.
Of course a true comparison of the absolute (rather than relative) sizes
of the blisters for the two models needs to be made based on the release of
equivalent amounts of salt into the blister. In many cases the salt spot on
the surface is present as a small patch. Surface diffusion gives a more or
less uniform salt concentration over the patch. It is likely that the center
52
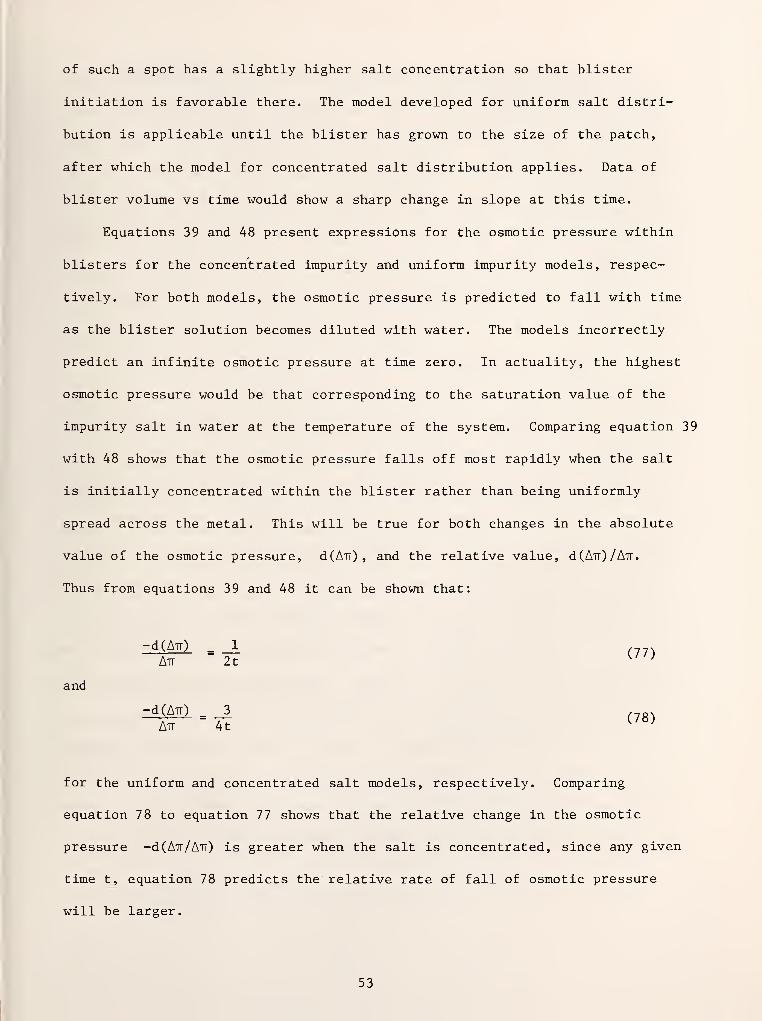
of such a spot has a slightly higher salt concentration so that blister
initiation is favorable there. The model developed for uniform salt distri-
bution is applicable until the blister has grown to the size of the patch,
after which the model for concentrated salt distribution applies. Data of
blister volume vs time would show a sharp change in slope at this time.
Equations 39 and 48 present expressions for the osmotic pressure within
blisters for the concentrated impurity and uniform impurity models, respec-
tively. For both models, the osmotic pressure is predicted to fall with time
as the blister solution becomes diluted with water. The models incorrectly
predict an infinite osmotic pressure at time zero. In actuality, the highest
osmotic pressure would be that corresponding to the saturation value of the
impurity salt in water at the temperature of the system. Comparing equation 39
with 48 shows that the osmotic pressure falls off most rapidly when the salt
is initially concentrated within the blister rather than being uniformly
spread across the metal. This will be true for both changes in the absolute
value of the osmotic pressure, d(AiT), and the relative value, d(A7r)/A7T.
Thus from equations 39 and 48 it can be shown that:
•d(A-rr) . _1_ (11 .
Air 2tK
'
and
Aim _ 3(7g)
Air 4t
for the uniform and concentrated salt models, respectively. Comparing
equation 78 to equation 77 shows that the relative change in the osmotic
pressure -d (Ait/Ait) is greater when the salt is concentrated, since any given
time t, equation 78 predicts the relative rate of fall of osmotic pressure
will be larger.
53
Of course when all the salt is concentrated within the blister, the
initial osmotic pressure is much greater than when the salt is uniformly
distributed. In this case the osmotic pressure has further to fall. For
uniform salt distribution, osmotic pressures do not fall as fast because the
concentration of fresh salt is being added at the periphery of the blister.
As with blister growth rates, it is best to compare osmotic pressures based on
the availability to the blister of the same total amount of salt.
At later times the osmotic pressure can fall to the point where the
disbonding tension in the film cannot be overcome and blister growth will
cease. Blister initiation does not occur when the surface is relatively
clean, when the adhesion of the coating to the substrate is good or where
water has not penetrated to the surface. The osmotic pressure developed is
insufficient to destroy the adhesion, and the blister does not form.
Blister initiation can also be prevented by reversing the concentration
gradient. Thus if a concentrated salt solution is kept in the external
solution outside the coating, water may be drawn from the coating. This is
the principle which makes it possible to store acids and concentrated salts in
painted vessels made of metals which would normally corrode. This helps
prevent the initiation of blisters and can collapse existing blisters, although
wrinkling of the coating may be observed. The models developed in this report
for blister growth can easily be modified to treat blister collapse.
It is important to understand the extent to which the blister initiation
and growth processes are coupled with the absorption and diffusion processes
discussed in the previous section. The interaction of these processes depends
on both time and distance scales. Thus, if blister initiation and growth is
54
slow compared to the time taken for water to diffuse to the metal-coating
interface, then blister formation is more likely and initial blister growth
more rapid because of the proximity of the water to the surface. The diffusion
path for water will then be much less than the thickness of the coating and
diffusion times considerably shortened. If, on the other hand, blister growth
is inherently faster than the diffusion rate of water, then water will need to
be drawn into the blister all the way from the surface of the coating. The
observed rate of blister growth will then be controlled by the absorption and
diffusion rates of water within the coating.
For a surface containing only a few small blisters, the amount of water
drawn to the coating-metal interface will not depend on the number of blisters.
This is because the total demand of these blisters for water is small compared
to the amount of water which can be absorbed by the vehicle or adsorbed by the
pigment. Thus, even though water diffusion has a pronounced effect on blister
growth, the reverse is not true. However, as the number of blisters per unit
area of coating (number density of blisters) increases, a point will be
reached where a significant fraction of the water which reaches the metal-
coating interface will be brought there as a result of osmotic effects.
For systems with multiple blisters, the number density of blisters is an
important parameter. The models developed here for single blisters must be
extended in order to treat blister clusters. Additional factors to consider
include:
1. the possibility of blister impingement and coelescence
with other blisters
2. diffusion of water along the surface in addition to normal
to the surface
3. different blisters initiating at different times and growing
at different rates
55
This last factor is possible if the surface has a distribution of weak spots
having different adhesive strengths or if there is a non-uniform concentration
of impurity ions on the metal.
4.3 Corrosion Phenomena
In section 4.2 two mathematical models were developed for the corrosion
phenomena which occur in organic coating systems. Both models treated the
polarization which occurs when an electrical potential is dissipated in an
electrochemical cell. These models are the potential difference model (PDM)
and the equivalent circuit model (ECM) . The (ECM) itself has three separate
submodels, one based on a constant value of the resistance of the corrosion
products, one based on Langmuir adsorption (or film formation) of the corro-
sion products on the cathode surface, and one based on a uniform accumulation
of layers of corrosion products. Both the (DCM) and (ECM) models consider
that an electrochemical cell having an anode and cathode is formed beneath the
coating. The models are not specific to any particular corroding system.
They presume surface uniformity and do not account for changes in size or
location of the anode or cathode surfaces.
In the potential difference model (PDM) (presented in section 3.3.1) the
driving force for polarization is the potential difference between the anode
and the cathode. The potential difference between cathode and anode was found
to decrease exponentially with time (equation 56) , while the cathode and anode
potentials themselves (equations 54 and 55) , exponentially approached a final
common potential (given by equation 57) . The models contain two unknown
polarization rate constants, which vary directly with electrode surface area
and follow an Arrhenius temperature dependency.
56
The equivalent circuit models (ECM) , as presented in section 3.3-2, are
based upon the dissipation of the initial potential across two series resis-
tances, one corresponding to the resistance of the electrolytic solution (R.. ) ,
and the second corresponding to the resistance of the corrosion products (R9)
.
Solutions are presented for the charge, current and potential difference of
the circuit. When R?
is constant the potential difference predicted across
the circuit, (equation 60), has the same mathematical form as that for the
(PDM) , equation 56. In fact a comparison of the two equations shows that:
T " <R1+ V C
a - VTk^ (79)
Thus the circuit time constant (R.. + R„)C is analogous to the reciprocal of
the sum of the polarization rate constants.
For the other (ECM) submodels for R~ , the potential difference also
decreases with time, but the mathematical analogy to the (PDM) is no longer
valid.
For all (ECM) models the circuit current and charge also decreased with
time. When R„ is a constant, the charge, current and potential difference all
decrease exponentially from their initial values in the same way (refer to
equation 60) . For the film formation and uniform product accumulation sub-
models, the potential and charge decrease together, but the current falls
faster because of the increase of R„ with time.
The models developed in this report can be used to fit polarization data
for two dissimilar metals immersed in a fluid media containing ionized acid,
base or salt. Because polarization is fairly rapid (scale of minutes) compared
to the time scale of other corrosion phenomena, such as pitting or precipitation
57
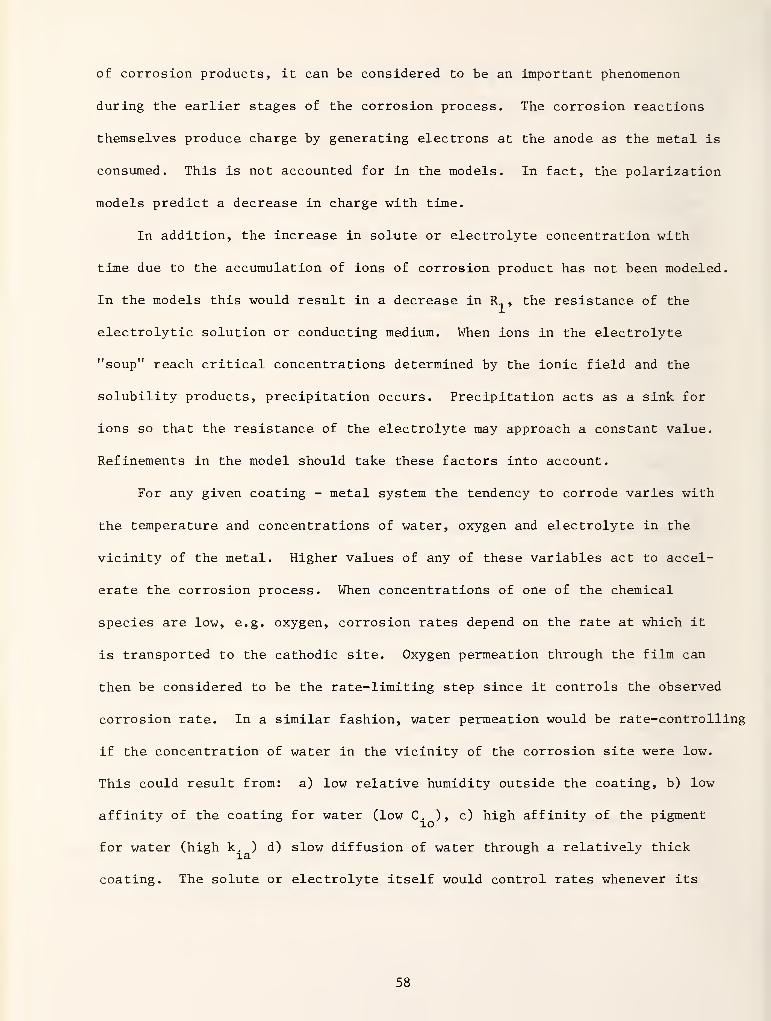
of corrosion products, it can be considered to be an important phenomenon
during the earlier stages of the corrosion process. The corrosion reactions
themselves produce charge by generating electrons at the anode as the metal is
consumed. This is not accounted for in the models. In fact, the polarization
models predict a decrease in charge with time.
In addition, the increase in solute or electrolyte concentration with
time due to the accumulation of ions of corrosion product has not been modeled.
In the models this would result in a decrease in R , the resistance of the
electrolytic solution or conducting medium. When ions in the electrolyte
"soup" reach critical concentrations determined by the ionic field and the
solubility products, precipitation occurs. Precipitation acts as a sink for
ions so that the resistance of the electrolyte may approach a constant value.
Refinements in the model should take these factors into account.
For any given coating - metal system the tendency to corrode varies with
the temperature and concentrations of water, oxygen and electrolyte in the
vicinity of the metal. Higher values of any of these variables act to accel-
erate the corrosion process. When concentrations of one of the chemical
species are low, e.g. oxygen, corrosion rates depend on the rate at which it
is transported to the cathodic site. Oxygen permeation through the film can
then be considered to be the rate-limiting step since it controls the observed
corrosion rate. In a similar fashion, water permeation would be rate-controlling
if the concentration of water in the vicinity of the corrosion site were low.
This could result from: a) low relative humidity outside the coating, b) low
affinity of the coating for water (low C. ), c) high affinity of the pigment
for water (high k. ) d) slow diffusion of water through a relatively thickxa
coating. The solute or electrolyte itself would control rates whenever its
58
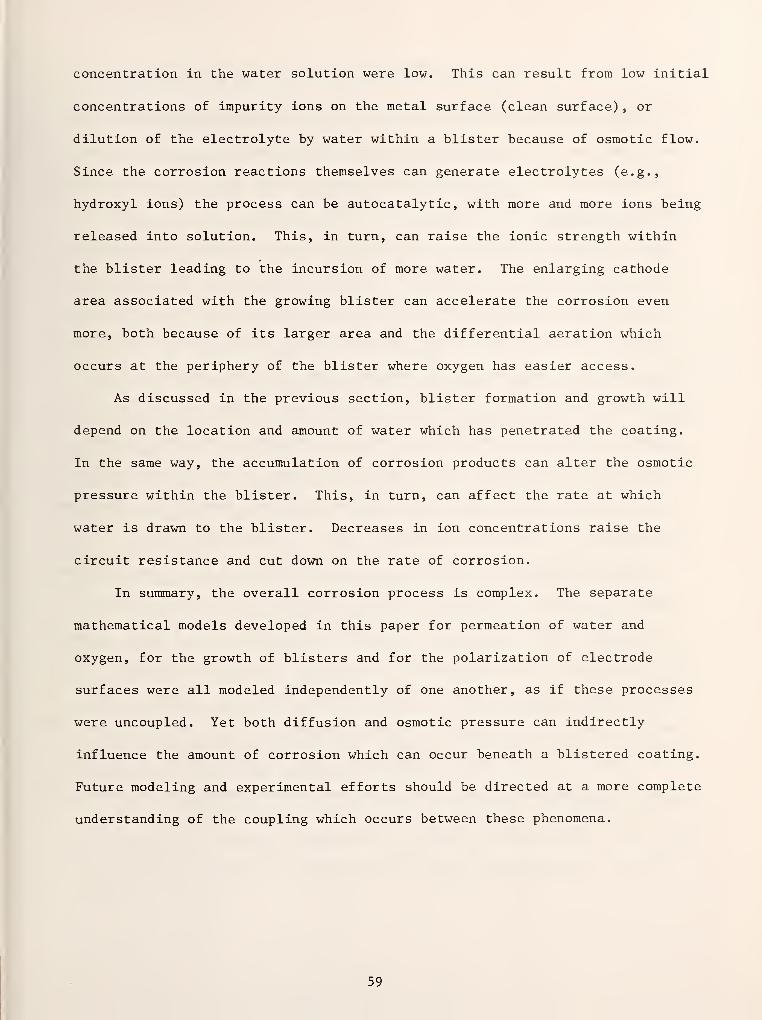
concentration in the water solution were low. This can result from low initial
concentrations of impurity ions on the metal surface (clean surface) , or
dilution of the electrolyte by water within a blister because of osmotic flow.
Since the corrosion reactions themselves can generate electrolytes (e.g.,
hydroxyl ions) the process can be autocatalytic, with more and more ions being
released into solution. This, in turn, can raise the ionic strength within
the blister leading to the incursion of more water. The enlarging cathode
area associated with the growing blister can accelerate the corrosion even
more, both because of its larger area and the differential aeration which
occurs at the periphery of the blister where oxygen has easier access.
As discussed in the previous section, blister formation and growth will
depend on the location and amount of water which has penetrated the coating.
In the same way, the accumulation of corrosion products can alter the osmotic
pressure within the blister. This, in turn, can affect the rate at which
water is drawn to the blister. Decreases in ion concentrations raise the
circuit resistance and cut down on the rate of corrosion.
In summary, the overall corrosion process is complex. The separate
mathematical models developed in this paper for permeation of water and
oxygen, for the growth of blisters and for the polarization of electrode
surfaces were all modeled independently of one another, as if these processes
were uncoupled. Yet both diffusion and osmotic pressure can indirectly
influence the amount of corrosion which can occur beneath a blistered coating.
Future modeling and experimental efforts should be directed at a more complete
understanding of the coupling which occurs between these phenomena.
59
5. SUMMARY AND CONCLUSIONS
Mathematical models were developed for conceptual models describing the
main phenomena which occur when corrosion occurs beneath an organic coating.
The potential for corrosion exists when oxygen, water and ionic impurities are
present together in the vicinity of the metal substrate. This situation is
likely to occur in blisters, which are water filled cavities located at the
metal-coating surface. Blisters grow because of osmosis of water from the
coating. Their rate of growth depends on their size and the concentration of
impurity ions within them and outside the coating, as well as the location and
distribution of water within the coating. The penetrants water and oxygen
both enter the coating by absorption and then pass through the coating by
diffusion. Not all of the penetrant may reach the metal surface because of
adsorption on the surface of the pigment particles. All of these processes
are a function of the nature of the coating system and temperature. The rates
of absorption, diffusion and adsorption differ for water and oxygen.
Within blisters, corrosion reactions can initiate if sufficient dissolved
oxygen is present. For iron-based metals oxidation at the anode produces
ferrous ions, while reduction at the cathode consumes water and oxygen to form
hydroxyl ions. Electrons generated at the anode flow through the metal to the
cathode where they are accepted by the cathodic reaction. Pitting of the
anode can occur, while corrosion products generally form in the vicinity of
the cathode. This can cause polarization of the cathode surface, as can the
formation of adsorbed films of gases and ions or the formation of electrical
double layers
.
60
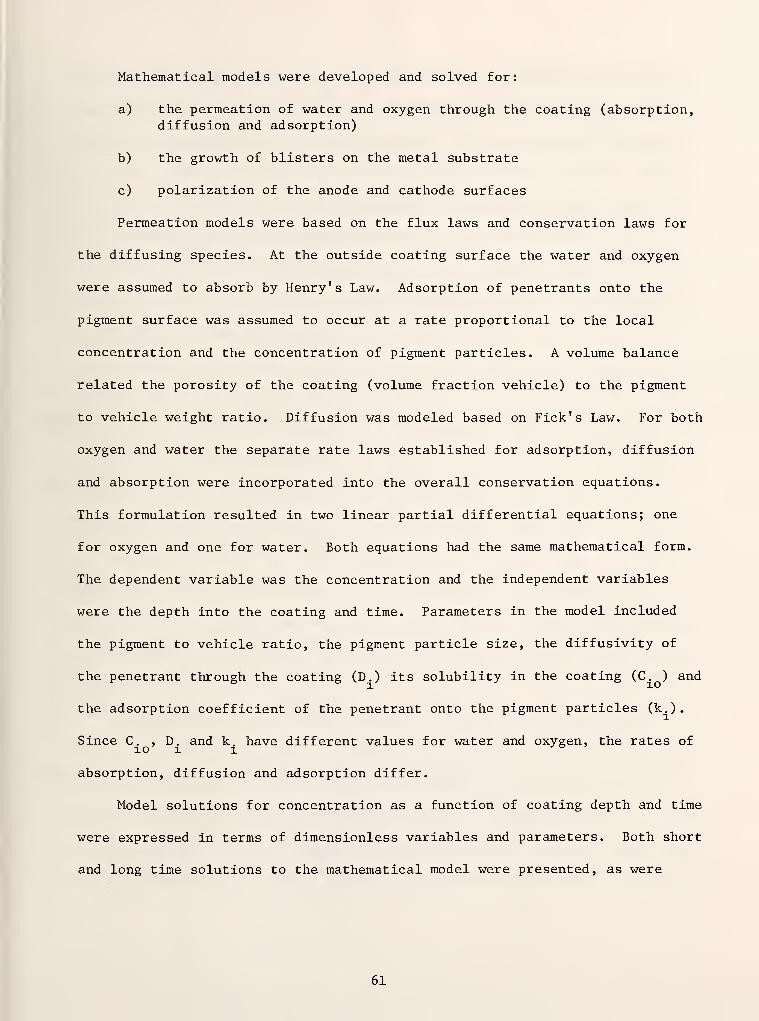
Mathematical models were developed and solved for:
a) the permeation of water and oxygen through the coating (absorption,diffusion and adsorption)
b) the growth of blisters on the metal substrate
c) polarization of the anode and cathode surfaces
Permeation models were based on the flux laws and conservation laws for
the diffusing species. At the outside coating surface the water and oxygen
were assumed to absorb by Henry's Law. Adsorption of penetrants onto the
pigment surface was assumed to occur at a rate proportional to the local
concentration and the concentration of pigment particles. A volume balance
related the porosity of the coating (volume fraction vehicle) to the pigment
to vehicle weight ratio. Diffusion was modeled based on Fick's Law. For both
oxygen and water the separate rate laws established for adsorption, diffusion
and absorption were incorporated into the overall conservation equations.
This formulation resulted in two linear partial differential equations; one
for oxygen and one for water. Both equations had the same mathematical form.
The dependent variable was the concentration and the independent variables
were the depth into the coating and time. Parameters in the model included
the pigment to vehicle ratio, the pigment particle size, the diffusivity of
the penetrant through the coating (D.) its solubility in the coating (C. ) and
the adsorption coefficient of the penetrant onto the pigment particles (k.).
Since C. , D. and k. have different values for water and oxygen, the rates of10 11
absorption, diffusion and adsorption differ.
Model solutions for concentration as a function of coating depth and time
were expressed in terms of dimensionless variables and parameters. Both short
and long time solutions to the mathematical model were presented, as were
61
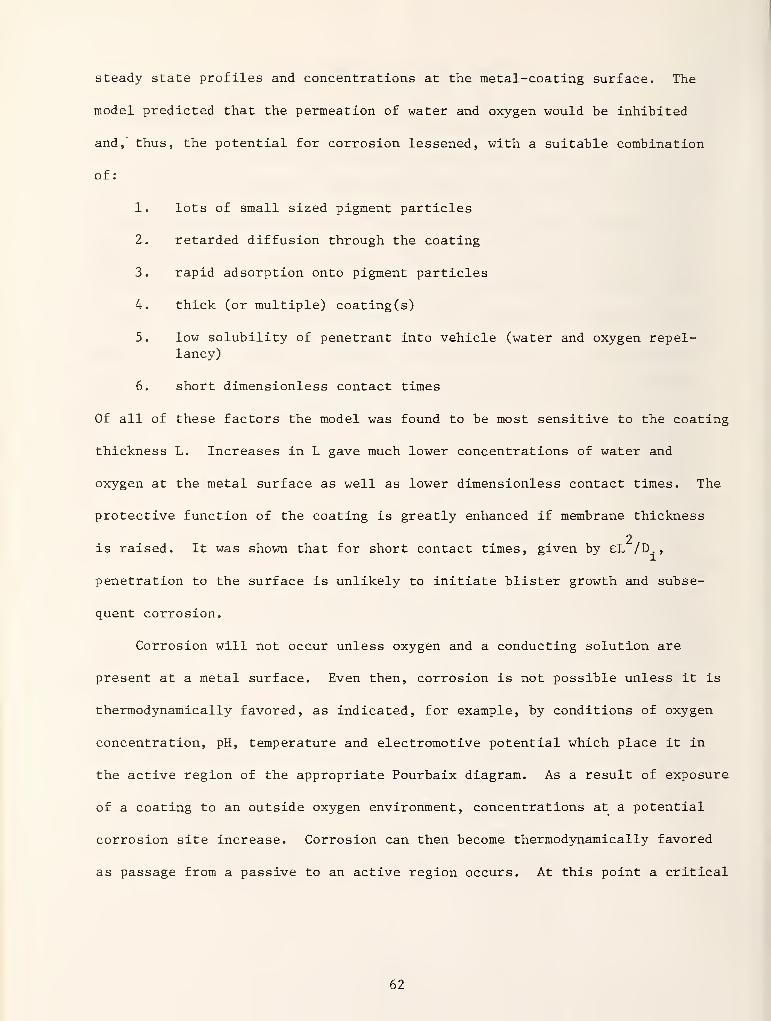
steady state profiles and concentrations at the metal-coating surface. The
model predicted that the permeation of water and oxygen would be inhibited
and, thus, the potential for corrosion lessened, with a suitable combination
of:
1. lots of small sized pigment particles
2. retarded diffusion through the coating
3. rapid adsorption onto pigment particles
4. thick (or multiple) coating(s)
5. low solubility of penetrant into vehicle (water and oxygen repel-lancy)
6. short dimensionless contact times
Of all of these factors the model was found to be most sensitive to the coating
thickness L. Increases in L gave much lower concentrations of water and
oxygen at the metal surface as well as lower dimensionless contact times. The
protective function of the coating is greatly enhanced if membrane thickness
2is raised. It was shown that for short contact times, given by eL /D.,
penetration to the surface is unlikely to initiate blister growth and subse-
quent corrosion.
Corrosion will not occur unless oxygen and a conducting solution are
present at a metal surface. Even then, corrosion is not possible unless it is
thermodynamically favored, as indicated, for example, by conditions of oxygen
concentration, pH, temperature and electromotive potential which place it in
the active region of the appropriate Pourbaix diagram. As a result of exposure
of a coating to an outside oxygen environment, concentrations at a potential
corrosion site increase. Corrosion can then become thermodynamically favored
as passage from a passive to an active region occurs. At this point a critical
62
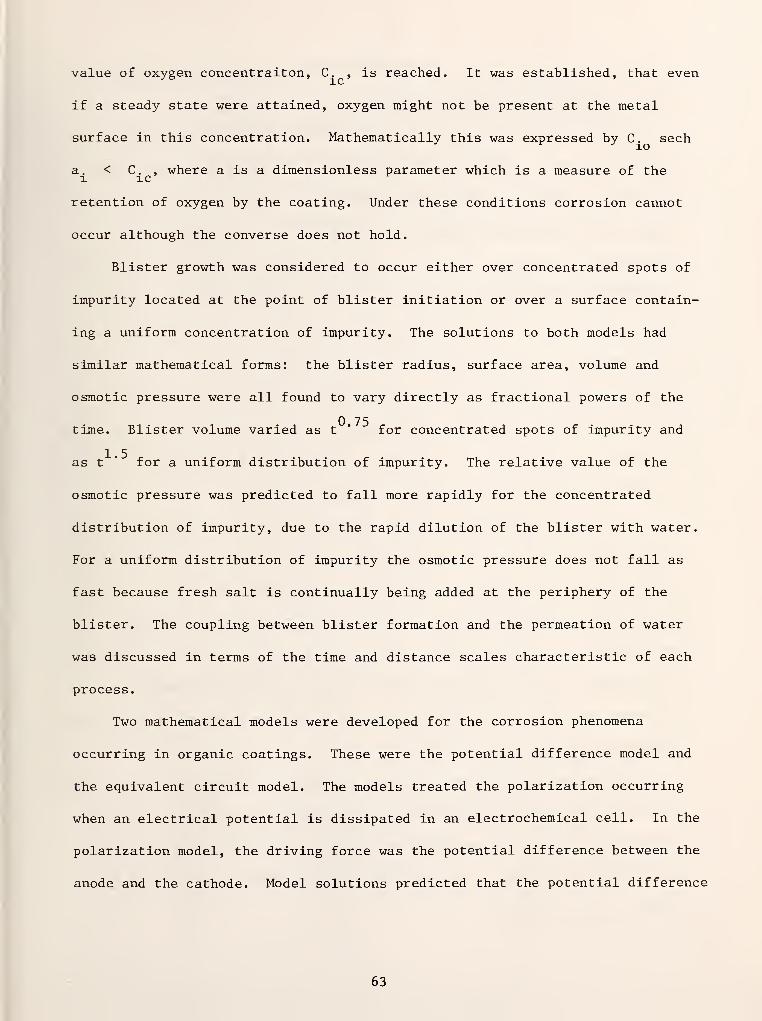
value of oxygen concentraiton, C . , is reached. It was established, that even
if a steady state were attained, oxygen might not be present at the metal
surface in this concentration. Mathematically this was expressed by C. sech
a. < C. , where a is a dimensionless parameter which is a measure of the1 1C
retention of oxygen by the coating. Under these conditions corrosion cannot
occur although the converse does not hold.
Blister growth was considered to occur either over concentrated spots of
impurity located at the point of blister initiation or over a surface contain-
ing a uniform concentration of impurity. The solutions to both models had
similar mathematical forms: the blister radius, surface area, volume and
osmotic pressure were all found to vary directly as fractional powers of the
time. Blister volume varied as t * for concentrated spots of impurity and
as t * for a uniform distribution of impurity. The relative value of the
osmotic pressure was predicted to fall more rapidly for the concentrated
distribution of impurity, due to the rapid dilution of the blister with water.
For a uniform distribution of impurity the osmotic pressure does not fall as
fast because fresh salt is continually being added at the periphery of the
blister. The coupling between blister formation and the permeation of water
was discussed in terms of the time and distance scales characteristic of each
process.
Two mathematical models were developed for the corrosion phenomena
occurring in organic coatings. These were the potential difference model and
the equivalent circuit model. The models treated the polarization occurring
when an electrical potential is dissipated in an electrochemical cell. In the
polarization model, the driving force was the potential difference between the
anode and the cathode. Model solutions predicted that the potential difference
63
decreases exponentially with time so that both anode and cathode potentials
slowly approach a common final potential.
In the second model, corrosion was modeled in terms of an equivalent
electrical circuit. Polarization rates were taken to be functions of the
electromotive force and the circuit resistance. The potential between the
anodic and cathodic sites within the corrosion cell was considered to be
dissipated across several series resistances. These included the resistance
of the electrolyte and the resistance of the corrosion products. Corrosion
product resistance was attributable to the formation of product layers next to
the cathode surface. The resistance of the electrolyte was taken as a con-
stant while the resistance of the corrosion products (R~) was modeled using
several different submodels. This included a constant value of R~ , one based
on Langmuir adsorption (or film formation) of corrosion products and one based
on uniform accumulation of layers of corrosion products.
All of the models predicted that the potential between electrodes, the
charge and the current decrease with time. The equivalent circuit submodel
for constant R„ was shown to analogous to the potential difference submodel.
For the film formation model the potential and charge decreased together but
the current fell faster because of the increase of R„ with time. Refinements
in the model were suggested which would take into account the nature of the
corrosion reactions, the charge they generate and the increase in electrolyte
concentration with time.
The coupling between the corrosion process, the blistering process, and
the permeation process was discussed. The coupling is complex and only the
separate processes were modeled in this paper. Future modeling and experi-
mental efforts will be directed at elucidating a fuller understanding of the
nature of the coupling.
64
6 . NOMENCLATURE
a adsorption - diffusion constant, equation (15); activitycoefficient, equation (25)
a water activity coefficient within blister
a_ water activity coefficient in external solution
A flat area of blister on metal surface
b defined by (2n + 2 - x)
C dimensionless concentration, C./C. ; concentration of water,equation (25)
C capacitance of charged electrodesa
C. concentration of component i within coating
C. concentration of component i inside coating surface10
C. critical value of C., equation (76)
d diameter of pigment particles
D diffusion coefficient or diffusivity
D. diffusion coefficient or diffusivity of component i
D. molecular (or Knudsen) diffusivity
E , E potential of anode and cathode, respectively
E^ 4 , E^„ initial potential of anode and cathode, respectivelyOA OC
E , E Laplace transform of E and E , respectively
Ef
final potential, equation (57)
H. Henry's Law constant for component i
i current
i initial value of currento
65
k adsorption rate constant for component iax
k , k anodic and cathode polarization rate constants, equations (51)and (50) , respectively
k , k specific rate constants for the anode and cathode, respectively
k, desorption rate constantd
k rate constant for osmotic pressure, equation (39)P
k , k , k rate constants for radius, area and volume, equations (36)
,
(37) and (38) , respectively
k' proportionality constant, equation (41)
k , k , k rate constants; equations (45), (46), (47) respectively
Z diffusion path length; thickness of corrosion products
L thickness of coating or film
L, L activation energia for anode and cathode, respectively
A C
m molarity of impurity ion
m* saturation value of m
M mass of water in the blister
M amount of salt present at blister initiation sites
M solvent molecular weight
M salt molecular weights
n number density of particles; summation index
N diffusive flux; number of occupied sites
N. diffusive flux of species il
N total number of sites
(p/v) volume ratio, pigment to vehicle
p. partial pressure of component i in external phasexo
Q charge
Q initial value of Q
66
r characteristic dimension of blister
r, rate of dissolution based on surfaced
r. rate of adsorption of penetrant i per particle
R gas constant
R1
resistance of electrolyte solution
R„ resistance of corrosion products
(R ) ultimate or final value of R_2 u 2
s Laplace transform variable
S surface area of blister mantle
S , S surface areas of anode and cathode, respectively
5 , S switches, figure 3
t time
t1 dimensionless time
T absolute temperature
u transformation relation, equation (A-5)
u Laplace transform of u
V volume of blister
%V solvent partial modal volume
x dimensionless distance, Z/L
Z depth into coating measured from free surface
GREEK LETTERS
a rate constant for film formation by Langmuir adsorption,equation (58)
3, Y constants of proportionality, equation (59)
V gradient
6 characteristic film thickness for diffusion; potential difference(EA - V
67
6 initial value of potential differenceo
e porosity of coating (volume fraction vehicle)
Att change in osmotic pressure
v number of ions formed from one molecule of impurity ion
(f>molar osmotic coeffient
p density of water within blister
p density of a pigment particleP
p density of the vehicle (binder)v
a constriction factor (equation 6)
T tortuosity factor (equation 6) ; time constant (equation 66)
T time constant based on final resistance; equation (69)
9 fraction of occupied sites, N/N
6 equilibrium surface coverage, equation (B-17)
68
7. REFERENCES
1. Perera, D. Y., and Van den Eynde, D. , "Alternation in Properties of
Organic Coatings for Buildings Due to the Leaching Process," Durabilityof Building Materials and Components, ASTM STP691 , 698-710 (1980).
2. Kumms, C. A., "Physical Chemical Models for Organic Protective Coatings,"Journal of Coatings Technology 52 (664), 40-53 (1980).
3. Ritter, J. J., and Kruger, J., "Studies on the Sub-Coating Environment of
Coated Iron Using Qualitative Ellipsometric and Electrochemical Techniques,"Surface Sci . J?6, (1980).
4. Peterson, E. , Chemical Reaction Analysis , Prentice-Hall, New York, 1965.
5. Bruggeman, D. A., Ann. Physik 24, 636 (1935).
6. van der Meer - Lerk, L. A., and Heertjes, P. M. , "Blistering of VarnishFilms on Substrates Induced by Salts," J. Oil Col. Chem. Assoc. 58, 79-84
(1975).
7. van der Meer - Lerk, L. A., and Heertjes, P. M. , "Mathematical Model of
Growth of Blisters in Varnish Films on Different Substrates," J. Oil Col.
Chem. Assoc. 62, 256-263 (1979).
8. Robinson, J. M. , and Stokes, R. H. , Electrolyte Solutions , 2nd edition,
Butterworth, London, 1970.
9. Harned, H. S., and Owen, B. , The Physical Chemistry of ElectrolyticSolutions , 3rd edition, ACS Monograph No. 137, Reinhold Press, New York,
1958.
10. Bockris, J. O'M. , and Reddy A. K. N. , Modern Electrochemistry , Volume 2,
Plenum Press, New York, 1973.
11. Crank, J., and Park G. S., Diffusion in Polymers , Academic Press, New York,
1968.
12. Artamonova, R. V., et.al. , "Internal Stresses and Water Diffusion in
Polymers," (trans.) Vysokomol. soyed. A12, No. 2 (1970), pp. 336-342.
13. Uhlig, H. H. , Corrosion and Corrosion Control , 2nd edition, John Wiley& Sons, Inc., New York, 1971.
14. Thirsk, H. R. , and Harrison, J. A., A Guide to the Study of ElectrodeKinetics , Academic Press, London, 1972.
15. Satterfield, C. N., Heterogeneous Catalysis in Practice , McGraw-Hill,New York, 35-37, 1980.
69
APPENDIX A
SOLUTION TO MATHEMATICAL MODEL FOR
DIFFUSION OF WATER AND OXYGEN
THROUGH ORGANIC COATINGS
In this Appendix the analytical solutions to the mathematical models
developed in Section 3.1 are derived. These are the models which describe the
concentration of water and oxygen within the coating. The solutions are
summarized by equation number in Table 1 of Section 3.2, and are presented as
equations (14) through (24) in the text which follows. The solutions are
classified by time region of validity: short time, long time, or steady-
state; by phenomena: with and without adsorption; and by location: within
the bulk of the coating and at the substrate-metal interface.
Equations (9) gives the partial differential equation which governs the
concentration profile of water and oxygen C. (Z,t) within the organic coating:
3C. 32C. 6k.
E ir - Di -r " -ir
1 (1 - £) ci
(9)
aL
Equations (10), (11), and (12) give the boundary and initial conditions:
C (0,t) - C. (10)
3C(L,t) = (11)
3Z
C (Z,0) = (12)
70
The solution to Equation (9), subject to the conditions (10), (11), and (12),
gives the concentration profiles C. (Z,t) within the coating.
Introducing the dimensionless variables x = z/L, C = C./C. and1 10
2t' = tD./eL (equation 13), equations (9), (10), (11) and (12) become equa-
tions (A-l) , (A-2) , (A-3) , and (A-4) , respectively:
8C
3t'9x
(A-l)
C (0,t') = 1 (A-2)
8C(l,f) = (A-3)
C (x,0) = (A-4)
The solution to Equation (A-l) subject to the conditions (A-2), (A-3) and
(A-4) gives the dimensionless concentration profile C (x,t') within the coating,
The parameter a is defined by Equation (15)
:
a = L
6ka± (1-e)
dD
1/2
= L
6kai
dD(P/V) (P
v/P
P}
1/2
(15)
a is a dimensionless adsorption-diffusion constant which is fixed for any
coating system and environment. The paint films are presumed to contain a
uniform distribution of spherical pigment particles of diameter d. The assump-
tion of particle sphericity is not critical to model development because the
concept of an equivalent shere (one having the same surface area as the non-
71
spherical particle) can be employed. The porosity £ is the volume fraction of
the coating occupied by the vehicle. Equation (2) is a volume balance made on
the coating:
£1 + (p/v) (Pv/P
)U)
Equation (2) is the basis for the equivalence of the second equality in
Equation (15)
.
A.l Long Time Model Solutions
The long time model solutions developed in this section are ones which
converge fastest at longer times. When the solution involves an infinite
number of terms fewer and fewer of these terms will be needed for convergence
as time increases.
By making the variable transformation from C (old dependent variable) to
u (new dependent variable) using the transformation relation:
2,
u = Cea fc
(A-5)
equations (A-l) , (A-2) , (A-3) and (A-4) become equations (A-6) , (A-7) , (A-8)
and (A-9) , respectively.
2
IF = TT (A" 6)3x
a2f
u (0,t') = eZ
(A-7)
72
fj(l,f ) = (A-8)
u (x,0) = (A-9)
The boundary value problem expressed by these equations can either be solved
by either Fourier Series or Laplace Transform methods. The Laplace Transform
method is more general in that it can handle both long and short time solutions.
Thus it is employed here.
Taking the Laplace Transform of Equation (A-6) with respect to the time
variable t', the transformed equations become:
,2-
^-| - su = (A-10)
dx
u" (0,s) = 1/s-a2
(A-ll)
^ (l,s) = (A-12)QX
Here u is the transformed value of u. It is a function of x and s, where s in
the complex variable or transformed value of t'.
By standard methods the solution to Equation (A-10) is:
u (x,s) = A sinh /s~ (1 - x) + B cosh /s~ (1 - x) (A-13)
Evaluating the integration constants A and B using conditions (A-ll) and (A-12)
73
- , . cosh Js~ (1 - x ) .
u (x,s) = ^ ~~ (A-14)
(s-a ) cosh /s
The inverse transform of Equation (A-14) can be found by evaluating it as
2the product of two functions, f(s) = 1/s-a and g(s) = cosh Js~(1 - x)/cosh Ss~
,
and using the convolution theorem for the product of two functions of s:
u (x,t') = LX
[f(s) • g(s)] - / F (t'-u) • G(u) du (A-15)
Here the operator L indicates the inverse transform of the convolution
product f(s) times g(s)
.
2,
In Equation (A-15), F (t'-u) = e3
. G(t') can be evaluated from
g(s) using the method of poles and residues or from the Heavisides inversion
theorem:
oo 2
G(t') = 7T I (-l)n_1
(2n-l) exp [-(2n~1)
7T
2t'] cos [
(^f^)tt (1-x)] (A-16)
n=l
Performing the convolution integral in Equation (A-15) upon these functions:
co (_i)n+1
( 2n-l) cos [
(!-*> (2n-l) ^ 2(
-(2n-l)2 /
fc,
u(x,t) = tt I— ± e
a- e (A-17)
n=l 2 (2n-l) tt
a H ;
Expressed in terms of the original dimensionless concentration C, equation (A-17)
takes the form:
74
2
-[a2+ (2n-l)
2£-] t'
00 n+1
c (x t.
}= cosh a (1-x) _ ^ y (-1) (2n-l) e cos [(1-x) (2n-l)7T/2]
' cosh a ''£ 2
a + (2n-l) 7— (A-18)4
Equation (A-18) is equation (14) of the main text of this paper.
This equation governs the concentration of water and oxygen within the
coating as a function of both time and position. Concentrations of the penetrants
water and oxygen, although they both are predicted to follow equation (A-8)
,
will differ because of their different values for the parameters C , D, and
k . This, in turn, through equation (15), will give different values of the
dimensionless parameter a. The additional parameters d, (p/v) , L and (p /p )
will vary with the nature of the coating system. Thus different coatings will
have different values of C and a and would be expected to perform differently
from one another in terms of their resistance to the penetration and permeation
of water and oxygen.
As mentioned previously, Equation (A-18) will take fewer terms to converge
at longer values of time and for this reason it is referred to as a "long-
time" solution.
At very long dimensionless times t', Equation (A-18) reduces to:
c (Xj oo) = cosh a (1-x)(cosh a
Equation (A-19) is Equation (23) of the main text of this paper. It governs
the steady-state concentration profiles within the coating. This relation can
also be derived more fundamentally by setting the accumulation term 8C/9t'
equal to zero in equation (A-9) and solving the resulting ordinary differential
equation.
75
The way in which the dimensionless concentration C varies with dimen-
sionless time t* at the metal substrate interface (x=l) is given by:
2
oo (-l)n+1
(2n-l) exp -[a2+ (2n-l)
2j- ] t 1
C (l,t») = sech a - I 2 (A-20)n=l 2 n 2 n
a + (2n-l) t—
Equation (A-20) is equation (17) of the main text. It governs the concentration-
history at the metal substrate interface (x=l)
.
The steady-state concentration at the metal-substrate interface is given
by:
C (1,«) = sech a (A-21)
which is also equation (24).
In addition to the sub-models given here for the concentrations at the
metal substrate interface (x=l) , other sub-models can be derived for the case
where adsorption is insignificant (a=0) . Note that small a (tending towards
zero) is favored by small L, k , (p/v) and (p /p ) and large d or D. Ifo. v p
k = then there is absolutely no affinity of the penetrant for the pigment3.
particles and a will be identically zero. For a = 0, equation (A-18) becomes:
00 2
C (x,t') = 1 -f I (-D
n+1exp [-(2n-l)
2|- t'] cos [(2n-l) \ (1-x)] (A-22)
n=l
Equation (A-22) is the same as equation (16)
.
Concentration histories at the metal substrate interface C (l,t') in the
presence of insignificant adsorption (a = 0) are given by:
76
°° n+1 2 2
c d.f ) - i - 1 1 ^g-r- exP [-(2n- 1
> n f] (a-23)7T ^
, 2n-ln=l
which agrees with equation (18) of the text.
A. 2 Short Time Model Solutions
The short time model solutions developed in this section are ones which
converge fastest at shorter dimensionless times t1
. When the solution involves
an infinite number of terms, fewer and fewer of these terms will be needed for
convergence as time decreases. The short and long time solutions should give
the same numerical result since they are equivalent mathematically. At inter-
mediate dimensionless times (t'~ 1) the series at short and long times should
be equally efficient in converging to a common numerical answer.
The solutions which converge fastest at the shortest dimensionless times
t' can also be obtained by Laplace Transform methods equation (A-14) can be
rewritten as:
-x •s -(2-x) /s
u (x,s) = — (A-24)
. 2 -2/s-
(s-a ) (1 + e )
-2/s"By dividing the numerator of Equation (A-24) by the term (1 + e )
:
u (x,s) =I (-I)" exp [-(2n + x) 7s~ ] (-1) exp [-(2n + 2 - x) /s ] ,. ,_.
n=0 2+
2U l ^>
s-a s-a
The two separate terms in equation (A-25) , both of which are under the
summation sign, can be evaluated using the convolution integral, equation (A-15)
77
2Letting f(s) = l/(s-a) and g(s) = exp [-b /s ], where b = (2n + x) in the
first summation and b = (2n + 2 - x) in the second summation, then it follows
a2
b -b2
that, F(t') = e and G(t') = exp [-—p ]. Invoking the convolution
2 At'
integral, equation (A-15) , equation (A-5) and equation (A-25) are inverted to
give:
r(2n + 2 - x)
22 .
i°° t exp - [- — + a u]
C (x,t') =—I (-l)
n(2n + 2 - x) / ^ du
Ai\ n=0 u'
., o r(2n + x)
22
t exp -[ T + a u]
+ (-l)n
(2n + x) / ^ du (A-26)
u'
In equation (A-26) both terms are under the summation sign. Equation (A-26)
is identical to equation (19) . It is the general short time solution.
Equation (A-26) is a general solution to the diffusion problem governing the
dimensionless concentrations C within the organic coating as a function of
dimensionless distance x and time t'. It is mathematically equivalent to
equation (A-18) , or equation (14) . Together equations (A-18) and (A-26)
comprise a useful matched set of equations, one good for determining concen-
tration profiles at long dimensionless times, (A-18) , and one good for deter-
mining concentration profiles at short dimensionless times, (A-26)
.
The way in which the dimensionless concentration C varies with dimen-
sionless time t' at the metal substrate interface (x=l) is given by:
r(2n + l)
22 .
,°° t' exp - [-
—
— + a u]C(l,t*)=—— I (-l)
n(2n + 1) / £». du (A-27)
y/lT n=0 u
78
Equation (A-27) can be shown to be identical to equation (21) . It governs the
concentration-history at the metal substrate interface (x=l) and is the short
time solution which complements equation (A-20) , the solution which converges
fastest at long times.
When adsorption of the diffusing species is insignificant, a = 0. Under
this condition the general short time solution, equation (A-26) reduces to:
00 t' 2n t «-i\ 1 V t i\ n /o , o \ f
(2n + 2 - x) duC (x,t') = —
: l (-1) (2n + 2 - x)J
exp -l - -> v— ~'j —r 4u 3 /2
/4tt n=0 u
t' 2-L / n 11 /O _1_ \ f ( 2l1 + X ) du /A TON+ (-1) (2n + x)
Jexp —
—
'— -^j^ (A-28)
u
In equation (A-28) both terms are under the summation sign. Equation (A-28)
is identical to equation (20) . It governs the dimensionless concentration
profiles in the coating in the absence of significant adsorption onto the
pigment particles. Since it converges fastest at short dimensionless times
it complements equation (A-22) , which converges quickest at long dimensionless
times
.
Concentration histories at the metal substrate interface C (l,t') in the
presence of insignificant adsorption (a = 0) are given by:
C (l,t') = 2 £ (-l)n
erfc (
2n + 1) (A-29)
n=0 2 7t~
The dimensionless concentration at the metal substrate interface C (l,t') is
expressed in terms of an infinite series of complementary error functions.
79
Equation (A-28) is identical to equation (22). It converges fastest at short
dimensionless times and thus complements equation (A-23) , the solution which
converges most rapidly at long dimensionless times.
80
APPENDIX B
SOLUTION TO THE MATHEMATICAL MODEL FOR
CORROSION PHENOMENA BENEATH AN ORGANIC COATING
In this Appendix the analytical solutions to the mathematical models
developed in Section 3.3 are derived. These are models which describe the
polarization which occurs when an electrical potential is dissipated in an
electrochemical cell. The models are the potential difference model (PDM) and
the equivalent circuit model (ECM). The equivalent circuit model has three
submodels depending on the nature of the resistance offered by the corrosion
products: constant resistance, Langmuir adsorption or film formation and
uniform accumulation of solid products.
B.l Potential Difference Model
In this model the driving force for corrosion is the difference in
potential 6 between the anode and cathode potentials, E and E , respectively.
Thus
sr - kc
(ea - V ' k
c& (B-"
V 0) " Eoc
and
^T " kA
(EA - V " k
A6 CB-2>
EA ( °> " E
0A
81
The initial conditions for equations (B-l) and (B-2) are E and E , respectively,
If the temperature within the electrochemical cell does not change then equations
(52) and (53) predict that the rate constant k and k will remain constant.
Under this condition equations (B-l) and (B-2) form a coupled set of linear
first order differential equations whose solution can be obtained by the
method of Laplace Transforms.
Taking the Laplace Transform of equations (B-l) and (B-2) and rearranging:
EC
(S + kC
) " E0C
+ kC
EA
<B"3)
and
EA
(S + kA> " E
0A+ k
AEC
(B-4>
Solving equations (B-3) and (B-4) simultaneously for the transformed potentials,
Ec(s) and E (s) :
s + k k E
Ec •
s (s + r rn ^oc + tVtt1 (b"5)AC A
and
=E0C
kA
E0C
(S + kA+ k
C+ E
OC/E
OC> .. „A s + k s (s + k ) (s + k + k )
l'
Taking the inverse transform of equations (B-5) and (B-6)
82
lc + k -^EC
A CE0C
,
kC
f-
E0A ^
- (kA+ V t
v~ =k + k— +
k + k ( 1 ~ Y~ ) e (B" 7)E0C
kA+ k
CkA
kC
E0C
and
k v _2AEA
A C E0C
kA , .
E0A .
" (kA+ V C
( 1 - == ) e " " (B-8)E0C
kA+ k
CkA+ k
CE0C
Equations (B-7) and (B-8) are identical to equations (54) and (55) , respectively,
Since by convention, anode potentials are greater than cathode, E will decrease
exponentially and E will increase exponentially towards a final common poten-
tial E given by:
Ef. ^ E
0C+_
kC
E0A
(B _ 9)
Equation (B-9) is identical to equation (57) . It is easily found from equations
(B-7) and (B-8) by letting t -> °°. E represents the steady state polarization
potential.
The driving force 6 = E - E is found by subtracting equation (B-7) from
equation (B-8) , when:
" (kA+
"^C*'
6 " (E0A " E
0C'6 (B-10)
Equation (B-10) is identical to equation (56) . The driving force 6 decreases
exponentially with time towards zero. Polarization is complete after a suitably
long time and the final potentials of the anode and cathode are equal to the
value predicted by equation (B-9).
83
B.2 Equivalent Circuit Models
The models derived in this section treat the polarization process in
terms of an equivalent electrical circuit [14] . Figure 3 is a schematic
representation of the circuit. The anode and cathode are considered as being
at opposite sides of a charged capacitor which has initial thermodynamic
potential 6 = E^, - E^ . In the presence of an electrolyte this potential iso OA OC
dissipated across two resistances in series, R and R„ . Resistance R corresponds
to the resistance of the electrolyte, which is assumed to be constant.
Resistance R corresponds to the resistance offered by the corrosion products.
In the first submodel (constant resistance) R is taken constant. In the
other two models (Langmuir adsorption and uniform product accumulation) the
resistance R increases with time.
Consider the circuit depicted in Figure 3. At time zero switch S„ is
closed, switch S is opened and the circuit is complete. Application of
Kirchoff's second law gives:
it
(B. + R?
) + - / i dt = (60)± Z L
q
or, since i = dQ/dt,
(Ri+ V f +
§ - ° (62)
The initial charge of the capacitor Q is given by:
Q = C 6 (63)o
84
Equations (60) , (62) and (63) summarize the mathematical bases for the equivalent
circuit models developed for polarization.
B.2.1 Constant Product Resistance
When the products of corrosion have a constant product resistance R ,
equation (62) can be directly integrated to give:
^ " exp [
(h l\2
) c 1" ex
?[Zf 1 ^ B-11 >
The product (R.. + R„) C is the polarization time constant T. Equation (B-ll)
predicts that the charge on the capacitor Q will decay exponentially with time
towards zero with time constant T.
Since by definition i = dQ/dt, dif ferentation of equation (B-ll) yields:
j- = exp (-^ ) (B-12)
o
where the initial current flow i is given by:
6
'o=
(Rx+°R
2)
(65)
Applying Ohm's law:
i 6o o
(B-13)
so that
85
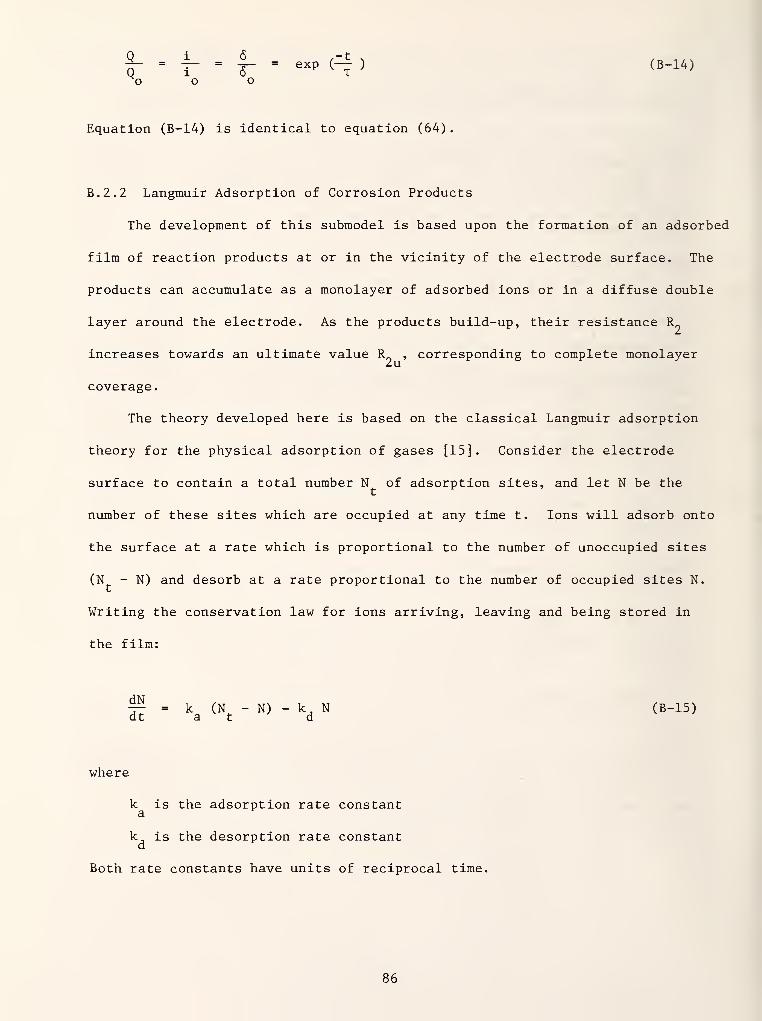
2_ . i_ . |_ . exp <=£, (B.14)
O O O
Equation (B-14) is identical to equation (64).
B.2.2 Langmuir Adsorption of Corrosion Products
The development of this submodel is based upon the formation of an adsorbed
film of reaction products at or in the vicinity of the electrode surface. The
products can accumulate as a monolayer of adsorbed ions or in a diffuse double
layer around the electrode. As the products build-up, their resistance R
increases towards an ultimate value R„ , corresponding to complete monolayer2u
coverage.
The theory developed here is based on the classical Langmuir adsorption
theory for the physical adsorption of gases [15] . Consider the electrode
surface to contain a total number N of adsorption sites, and let N be thet
K
number of these sites which are occupied at any time t. Ions will adsorb onto
the surface at a rate which is proportional to the number of unoccupied sites
(N - N) and desorb at a rate proportional to the number of occupied sites N.
Writing the conservation law for ions arriving, leaving and being stored in
the film:
^7 = k (N - N) - k, N (B-15)at a t d
where
k is the adsorption rate constanta
k is the desorption rate constantd
Both rate constants have units of reciprocal time.
86
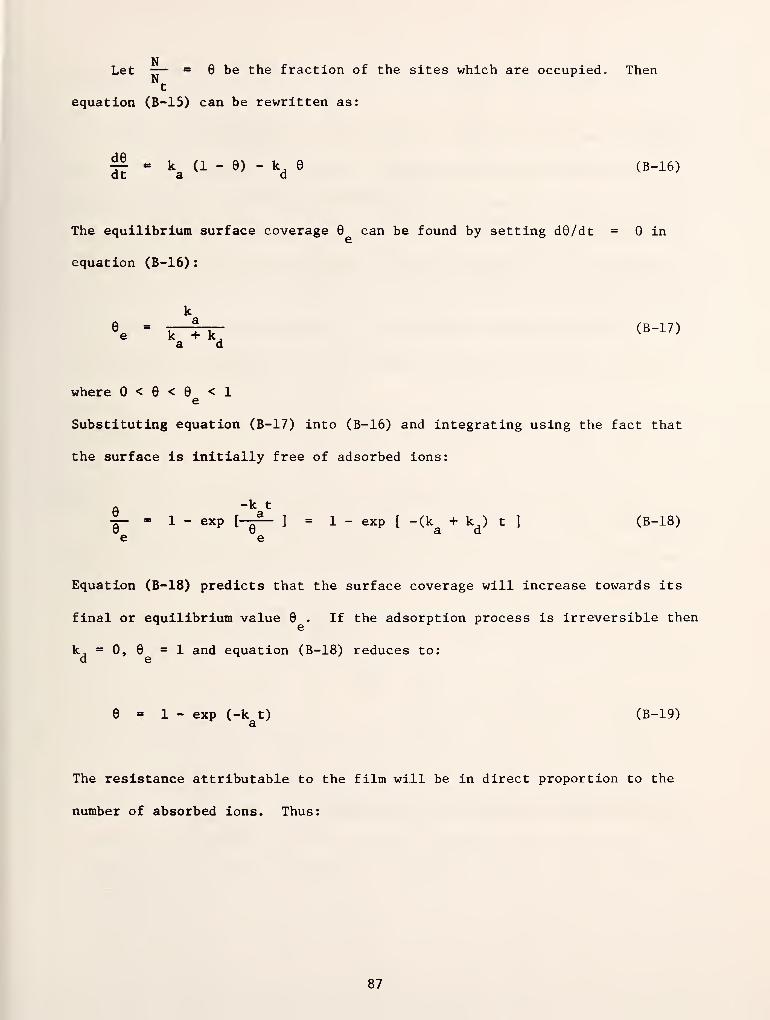
NLet — " 9 be the fraction of the sites which are occupied. Then
Nt
equation (B-15) can be rewritten as:
|f- k a - » - k e (B-i6)
The equilibrium surface coverage 6 can be found by setting d6/dt = in
equation (B-16)
:
6e " k-hr < B-17 >
a d
where < 6 < 6 < 1e
Substituting equation (B-17) into (B-16) and integrating using the fact that
the surface is initially free of adsorbed ions:
6"k
fl
t
y- = 1 - exp[-f- ] = 1 - exp [ -(k + k ) t ] (B-18)
e e
Equation (B-18) predicts that the surface coverage will increase towards its
final or equilibrium value 6 . If the adsorption process is irreversible then
k, = 0, 6 =1 and equation (B-18) reduces to:d e
9 1 - exp (-k t) (B-19)
The resistance attributable to the film will be in direct proportion to the
number of absorbed ions. Thus:
87
|- = 1 - exp (-at) (B-20)Ru
Equation (B-20) is identical to equation (58) of the text.
We can now identify precisely the meanings of the constants R and a in
equation (58) by analogy to the Langmuir adsorption theory. Thus, the ultimate
resistance R corresponds to the equilibrium coverage 9 where the constant a.u ° e
corresponds to the adsorption constant divided by the equilibrium coverage,
i.e., k /9 .
a e
Substituting equation (B-20) for R into Equation (62) a variables
separable differential equation results, which on integration becomes:
1
„ x R _ R ax2- - f - [a+ ^)e--^] » (B-21,
o o 1 1
T is the modified time constant C (R_, + R ). Equation (B-21) is identicalu 1 u
to equation (67). The first equality in equation (B-21) results from the
ratio of Q = C6 and Q = C6 . The capacitance of the electrochemical cell,o o
C, is presumed constant.
Differentiating equation (B-21) and using the fact that i = dQ/dt:
R R ax
[ (1 + -S) e
at- -H
]
R R%- = — (B-22)Xo R .
i + -±a- e_at)
Rl
Equation (B-22) is identical to equation (68)
88
Dividing equation (B-21) by equation (B-22) and using (B-20)
|- = ~ (1 + ^ ) (B-23)o 1 Rno o 1
Equation (B-23) is identical to equation (70).
Large values of the constant a correspond physically to rapid adsorption
and/or desorption of adsorbed ions at the electrode surface (i.e. large k + k,),a d
or to low equilibrium coverage (small 9 ) at high adsorption rates (large k )
.
Under these conditions equations (B-21) and (B-22) become equations (B-24) and
(B-25) , respectively.
n z R u
^o o 1
-uf-)
R u
Xo
Rl
Equations (B-24) and (B-25) are identical to equations (71) and (72) . Equation
(B-25) follows directly from Equation (B-24) and i = dQ/dt. Equation (B-24)
can be found by the application of L'Hospital's rule to equation (B-21) as
a -> °°.
B.2.3 Accumulation of Solid Corrosion Products
If solid products of corrosion deposit or precipitate near or on the
electrode surface then the resistance R caused by the accumulation of these
products will increase with time. In some instances adsorbed films more than
several monolayers thick can behave in a similar manner to solid corrosion
products.
89
The resistance of the corrosion layer, if it remains homogeneous, will
be proportional to this thickness. The volume of corrosion products laid down
will be proportional to this thickness and by Faraday's law to the total
amount of current which has flowed through the electrical circuit to any time
t. Thus:
t t dQR = y / i dt = -y / — dt = y (Q - Q ) (B-26)
where
Y is a rate constant for the accumulation of solid reaction products.
If equation (B-26) is substituted into equation (62) , and the resulting
variable separable differential equation is integrated, then it follows that:
Q 6CY (Q - Q) - t
Equation (B-27) is identical to equation (73) . It is a transcendental equation
in the variable Q and thus must be solved by trial and error procedures in
order to determine Q(t) and 6(t) . The corresponding formula for the current
ratio i/i is given by:o
r-= q q— (B-28)
o C [R±+ YQQ
" Y 3- ]
o
Equation (B-28) is equation (74)
90
Once Q(t) is known, R~(t) can be found from equations (B-26) and (B-27).
R„(t) will in turn determine the relative thickness of the corrosion products
attached to the electrode.
91
NBS-114A (REV. 2-8C)
U.S. DEPT. OF COMM.
BIBLIOGRAPHIC DATASHEET (See instructions)
1. PUBLICATION ORREPORT NO.
NBS TN 1150
2. Performing Organ. Report No 3. Publication Date
Sept. 1982
4. TITLE AND SUBTITLE
Mathematical Models for the Corrosion Protective Performance of Organic Coatings
5. AUTHOR(S)James M. Pommersheim, Paul G. Campbell, and Mary E. McKnight
6. PERFORMING ORGANIZATION (If joint or other than NBS. see instructions)
NATIONAL BUREAU OF STANDARDSDEPARTMENT OF COMMERCEWASHINGTON, D.C 20234
7. Contract/Grant No.
8. Type of Report & Period Covered
Final
9. SPONSORING ORGANIZATION NAME AND COMPLETE ADDRESS (Street. City. State. ZIP)
Same as 6.
10. SUPPLEMENTARY NOTES
~2 Document describes a computer program; SF-185, FlPS Software Summary, is attached.
11. ABSTRACT (A 200-word or less (actual summary of most significant information. If document includes a significantbibliography or literature survey, mention it here)
Mathematical models were developed for conceptual models describing
the principal phenomena that occur in the corrosion performance of poly-
meric coatings. These include models for water and oxygen permeability
through organic coatings, models for the growth of blisters beneath
coatings, and preliminary models for the polarization occurring at the
electrode surfaces. Results predicted by the models are discussed in
terms of the improvement of the protective function of the membrane.
12. KEY WORDS (Six to twelve entries; alphabetical order; capitalize only proper names; and separate key words by semicolons)
absorption; adhesion; adsorption; conceptual models; corrosion; mathematical
models; organic coating; osmosis; osmotic pressure; oxygen; permeability; pigment;protective performance; substrate; vehicle; water.
13. AVAILABILITY
Q<[] Unlimited
| |
For Official Distribution. Do Not Release to NTIS
|~X~~]Order From Superintendent of Documents, U.S. Government Printing Office, Washington, D.C.20402.
^] Order From National Technical Information Service (NTIS), Springfield, VA. 22161
14. NO. OFPRINTED PAGES
99
15. Price
$5.50
USCOMM-DC 6043-P80
1>U.S. GOVERNMENT PRINTING OFFICE. 1982-360-997/2229


NBS TECHNICAL PUBLICATIONS
PERIODICALS
JOURNAL OF RESEARCH—The Journal of Research of the
National Bureau of Standards reports NBS research and develop-
ment in those disciplines of the physical and engineering sciences in
which the Bureau is active. These include physics, chemistry,
engineering, mathematics, and computer sciences. Papers cover a
broad range of subjects, with major emphasis on measurement
methodology and the basic technology underlying standardization.
Also included from time to lime are survey articles on topics
closely related to the Bureau's technical and scientific programs.
As a special service to subscribers each issue contains complete
citations to all recent Bureau publications in both NBS and non-
NBS media. Issued six times a year. Annual subscription, domestic
$18; foreign $22.50. Single copy, $4.25 domestic; $5.35 foreign.
NONPERIODICALS
Monographs— Major contributions to the technical literature onvarious subjects related to the Bureau's scientific and technical ac-
tivities.
Handbooks—Recommended codes of engineering and industrial
practice (including safety codes) developed in cooperation with in-
terested industries, professional organizations, and regulatory
bodies.
Special Publications— Include proceedings of conferences spon-sored by NBS, NBS annual reports, and other special publications
appropriate to this grouping such as wall charts, pocket cards, andbibliographies.
Applied Mathematics Series— Mathematical tables, manuals, andstudies of special interest to physicists, engineers, chemists,
biologists, mathematicians, computer programmers, and others
engaged in scientific and technical work.
National Standard Reference Data Series— Provides quantitative
data on the physical and chemical properties of materials, com-piled from the world's literature and critically evaluated.
Developed under a worldwide program coordinated by NBS underthe authority of the National Standard Data Act (Public Law90-396).
NOTE; The principal publication outlet for the foregoing data is
the Journal of Physical and Chemical Reference Data (JPCRD)published quarterly for NBS by the American Chemical Society(ACS) and the American Institute of Physics (AIP). Subscriptions,reprints, and supplements available from ACS, 1 155 Sixteenth St.,
NW, Washington, DC 20056.
Building Science Series— Disseminates technical information
developed at the Bureau on building materials, components,
systems, and whole structures. The series presents research results,
test methods, and performance criteria related to the structural andenvironmental functions and the durability and safety charac-
teristics of building elements and systems.
Technical Notes—Studies or reports which are complete in them-
selves but restrictive in their treatment of a subject. Analogous to
monographs but not so comprehensive in scope or definitive in
treatment of the subject area. Often serve as a vehicle for final
reports of work performed at NBS under the sponsorship of other
government agencies.
Voluntary Product Standards— Developed under procedures
published by the Department of Commerce in Part 10, Title 15, of
the Code of Federal Regulations. The standards establish
nationally recognized requirements for products, and provide all
concerned interests with a basis for common understanding of the
characteristics of the products. NBS administers this program as a
supplement to the activities of the private sector standardizing
organizations.
Consumer Information Series— Practical information, based on
NBS research and experience, covering areas of interest to the con-
sumer. Easily understandable language and illustrations provide
useful background knowledge for shopping in today's tech-
nological marketplace.
Order the above NBS publications from: Superintendent of Docu-
ments. Government Printing Office. Washington. DC 20402.
Order the following NBS publications—FIPS and NBSlR's—fromthe National Technical Information Services, Springfield. VA 22161
.
Federal Information Processing Standards Publications (FIPS
PUB)— Publications in this series collectively constitute the
Federal Information Processing Standards Register. The Register
serves as the official source of information in the Federal Govern-
ment regarding standards issued by NBS pursuant to the Federal
Property and Administrative Services Act of 1949 as amended,
Public Law 89-306 (79 Stat. 1127), and as implemented by Ex-
ecutive Order 11717(38 FR 12315, dated May 11, 1973) and Part 6
of Title 15 CFR (Code of Federal Regulations).
NBS Interagency Reports (NBSIR)—A special series of interim or
final reports on work performed' by NBS for outside sponsors
(both government and non-government). In general, initial dis-
tribution is handled by the sponsor; public distribution is by the
National Technical Information Services, Springfield, VA 22161,
in paper copy or microfiche form.

U.S. Department of CommerceNational Bureau of Standards
Washington, D.C. 20234Official Business
Penalty for Private Use $300
postage And fees paid
u s department of commerceCOM-215
THIRD CLASSBULK RATE


![Lewisburg Chronicle.. (Lewisburg, Pa.) 1852-08-13 [p ]. of snch men as Marlboro, Eugene, Qlji' if N'p ... mitting to any sensible man whether ... land, the West Indies.Cuba, Brazil,](https://img.pdfslide.us/doc/110x75/5b0350347f8b9aba168bb442/lewisburg-chronicle-lewisburg-pa-1852-08-13-p-of-snch-men-as-marlboro.jpg)


![Greenbrier independent (Lewisburg, Va. [W. Va.]). 1897-07](https://img.pdfslide.us/doc/110x75/618e769d4391cc27a3714706/greenbrier-independent-lewisburg-va-w-va-1897-07-.jpg)