Embed Size (px)
Citation preview
1
MATHEMATICAL MODELLING OF POLLUTANT CONCENTRATION
DISTRIBUTION IN RIVER
NORSYAZWANI BINTI ISMAIL
UNIVERSITI TEKNOLOGI MALAYSIA
4
MATHEMATICAL MODELLING OF POLLUTANT CONCENTRATION
DISTRIBUTION IN RIVER
NORSYAZWANI BINTI ISMAIL
A dissertation submitted in partial fulfillment
of the requirement for the award of the degree of
Master of Science(Engineering Mathematics)
Faculty of Science
UNIVERSITI TEKNOLOGI MALAYSIA
JUNE 2014
6
This is my present to my beloved husband, parents, family and for those who are
always believes and appreciates in the richness of learning.
7
ACKNOWLEDGEMENT
Alhamdulillah, all praise to Allah, the must Beneficent and must Merciful for
giving me the blessing to complete this project. This thesis would not have been
possible without the guidance and support of many individuals. Therefore, I would
like to thank to all who helped through my study both direct and indirectly.
I would like to express my greatest appreciation to my supervisor Prof Madya
Dr Shamsuddin bin Ahmad for your ongoing patience, constant motivation and
guidance during my research. I also like to thank all examiners for their guidance,
comments and invaluable advice throughout two semesters to complete this thesis.
My deepest gratitude goes to my husband, family and friends for their
unwavering support, encouragement, and unconditional love. Not forgotten my
employer, Johor Matriculation Collage and staff members for their understanding
and support. Last but not least, I am indebted to my course mates and my colleague
who continuously supporting me throughout all the process with their guidance and
advices. Your love and help really made me through this project successfully.
Thank you for all tolerance and motivating me whenever I needed.
8
ABSTRACT
In recent years, the interest in preserving the quality of water for distribution
processes in order to maximize the fulfillment of various sectors has considerably
increased. Be it domestic sources, industrial or agricultural effluents, the massive
increase of industrial productions accompanied by high growth of large urban
populations has led to severe water pollution problems. Therefore, to identify water
pollution, water quality models becomes an important tool to recognize the behaviors
of pollutants in water environment. In this dissertation, the most important objective
is to understand and formulate a mathematical model involving the study of pollutant
transport in water environment via an advection-diffusion equation in river. The
analytical solution of the model is found using Laplace transform method. Once the
equation is solved, the solution is plotted using Maple for an easier analysis of the
result. Graph of concentration of the pollutant against distance will be interpret and
discuss. The result suggests that the concentration of pollutant is decrease against
distance.
9
ABSTRAK
Dalam tahun-tahun kebelakangan ini, kepentingan mengekalkan kualiti air
bagi proses pengagihan untuk memaksimumkan memenuhi pelbagai sektor telah
meningkat dengan banyaknya. Sama ada sumber dalam domestik, pengaruh industri
atau pertanian, peningkatan secara besar-besaran pengeluaran industri yang disertai
dengan pertumbuhan penduduk bandar besar telah membawa kepada masalah
pencemaran air yang teruk. Oleh itu, untuk mengenalpasti masalah pencemaran air,
model kualiti air menjadi alat penting untuk mengenalpasti ciri-ciri bahan pencemar
dalam sumber persekitaran air. Dalam disertasi ini, objektif paling penting adalah
untuk memahami dan merangka model ringkas matematik yang melibatkan kajian
dalam aliran bahan pencemar dalam persekitaran melalui persamaan olahan-resapan
dalam sungai. Penyelesaian analisis model didapati dengan menggunakan kaedah
Laplace. Setelah persamaan tersebut diselesaikan, penyelesaiannya akan di plot
dengan menggunakan perisian Maple untuk menganalisis keputusan yang diperoleh.
Graf kepekatan bahan pencemar terhadap jarak akan ditafsir dan dibincangkan.
Hasilnya menunjukkan bahawa kepekatan bahan pencemar berkurangan terhadap
jarak.
10
TABLE OF CONTENTS
CHAPTER TITLE PAGE
AUTHOR’S DECLARATION ii
DEDICATION iii
ACKNWOLEDGEMENT iv
ABSTRACT v
ABSTRAK vi
TABLE OF CONTENT vii
LIST OF TABLES x
LIST OF FIGURES xi
LIST OF SYMBOLS xiii
LIST OF APPENDICES xiv
1 INTRODUCTION
1.1 Introduction 1
1.2 Pollution 1
1.2.1 Land Pollution 2
1.2.2 Air Pollution 4
1.2.3 Water Pollution 5
1.3 Water Quality Standard 7
1.4 Effect of Water Pollution 10
1.5 Statement of problem 11
1.6 Objectives of the research 12
1.7 Scope of the research 12
11
1.8 Significance of the research 13
1.9 Report Structure 13
2 LITERATURE REVIEW
2.1 Introduction 15
2.2 Literature of Water Pollution 15
2.3 Previous Studies on Mathematical Modeling of
River Pollution 17
2.4 The Definition of Advection-Diffusion 20
2.5 Advection-Diffusion Equation 21
3 RESEARCH METHODOLOGY
3.1 Development of the Model 23
3.2 Laplace Transform 23
3.3 Properties of Laplace Transform 27
3.4 Inverse Laplace Transform 27
3.5 Properties of Inverse Laplace Transform 28
3.6 Error Function 29
3.7 Solving Partial Differential Equation using
Laplace Transform 30
4 ADVECTION-DIFFUSION MODEL
4.1 Introduction 34
4.2 One Dimensional Advection-Diffusion Model of
River Pollution Without Additional Source 34
12
4.3 One Dimensional Advection-Diffusion Model of
River Pollution With Additional Source 43
5 DATA ANALYSIS
5.1 Introduction 52
5.2 Result and Discussion 52
5.2.1 One Dimensional Advection-Diffusion Model
of River Pollution Without Additional Source 53
5.2.2 One Dimensional Advection-Diffusion Model
of River Pollution Without Additional Source 57
6 CONCLUSION AND RECOMMENDATION
6.1 Introduction 61
6.2 Conclusion 61
6.3 Recommendation 62
REFERENCES 63
APPENDICES A-G 66
13
LIST OF TABLES
TABLE NO. TITLE PAGE
1.1 The Interim National Water Quality Standard
for Malaysia 8
3.1 Laplace transform table 26
14
LIST OF FIGURES
FIGURE NO. TITLE PAGE
1.1 Land Pollution 3
1.2 Air pollution 5
1.3 Water Pollution 6
3.1 The original function tf is transformed into
new function .sF 24
3.2 Steps solving differential equation using
Laplace Transform 24
5.1 Concentration against distance of equation (4.2.15)
with 111 0 v,, and 50.t at distance .x 100 53
5.2 Concentration against distance graph of equation (4.2.15) at
01010100501 0 .,.v,.,.,. and 01.t . 54
5.3 Concentration against distance graph of equation (4.2.15) at
010050111 0 .,.,.v,, and 01.t . 56
5.4 Concentration against distance graph of equation (4.3.15) with
010111 0 .,v,, and 01.t at distance .x 100 57
15
5.5 Concentration against distance graph of equation (4.3.15) at
,,.,.v,.,.,. 101010100501 0 and 01.t . 58
5.6 Concentration against distance graph of equation (4.3.15) for
,.,.,,.,..,.v,. 0101010050101 0 and 01.t . 59
5.7 Comparison of concentration against distance graph using
equation (4.2.15) and (4.3.15) at ,.v,. 0101 0
,.,. 01001 and 01.t . 60
16
LIST OF SYMBOLS
L - Laplace operator
1L - Laplace inverse operator
t - time(days)
x - distance(meter)
c - concentration pollutant
- coefficient of diffusion
0v - velocity of the river
- substance discharge rate
- coefficient source of pollutant
17
LIST OF APPENDICES
APPENDIX TITLE
A Maple Coding For Concentration against distance of equation
(4.2.15) with 111 0 v,, and 50.t at distance .x 100
B Maple Coding For Concentration against distance graph of equation
(4.2.15) at 01010100501 0 .,.v,.,.,. and 01.t .
C Maple Coding For Concentration against distance graph of equation
(4.2.15) at 010050111 0 .,.,.v,, and 01.t .
D Maple Coding For Concentration against graph of equation (4.3.15)
with
010111 0 .,v,, and 01.t at distance .x 100
E Maple Coding For Concentration against distance graph of equation
(4.3.15) at ,,.,.v,.,.,. 101010100501 0 and 01.t .
F Maple Coding For Concentration against distance graph of equation
(4.3.15) for ,.,.,,.,..,.v,. 0101010050101 0 and 01.t .
G Maple Coding For Comparison of concentration against distance
graph using equation (4.2.15) and (4.3.15) at
,.,.,.v,. 010010101 0 and 01.t .
18
CHAPTER 1
INTRODUCTION
1.1 Introduction
This chapter will briefly discuss on the dissertation flow from study of
background, problem statement and objective of the study. Hence, follow by scope
of the study, significance of the study and report structure. Each subtopic related to
each other in order to make the readers understand the process of this dissertation
conducted.
1.2 Pollution
Based on Environment Quality Act 1974, pollutants means any natural or
artificial substances, whether in a solid, semi-solid or liquid form, or in the form of
gas or vapour, or in mixture of at least two of these substances, or any objectionable
odour or noise or heat emitted, discharge or deposited or is likely to be emitted,
discharged or deposited from any source which can directly or indirectly cause
pollution and includes any environmentally hazardous substances.
19
Pollutant contributes pollution. Environment Quality Act 1974 also stated
that pollution is any direct or indirect alteration of the physical, thermal, chemical, or
biological properties of any part of the environment by discharging, emitting or
depositing environmentally hazardous substances, pollutants or wastes so as to affect
any beneficial use adversely, to cause a condition which is hazardous or potentially
hazardous to public health, safety, or welfare, or to animals, birds, wildlife, fish or
aquatic life, or to plants or to cause a contravention of any condition, limitation or
restriction to which a license under this Act.
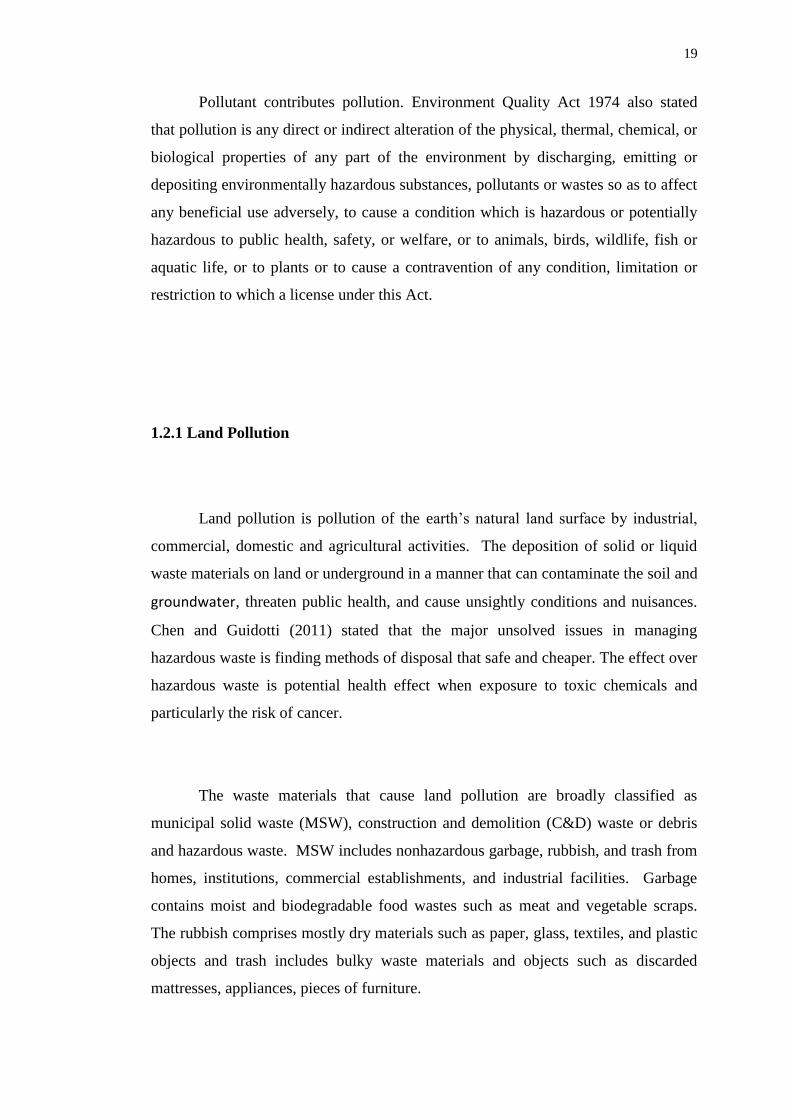
1.2.1 Land Pollution
Land pollution is pollution of the earth’s natural land surface by industrial,
commercial, domestic and agricultural activities. The deposition of solid or liquid
waste materials on land or underground in a manner that can contaminate the soil and
groundwater, threaten public health, and cause unsightly conditions and nuisances.
Chen and Guidotti (2011) stated that the major unsolved issues in managing
hazardous waste is finding methods of disposal that safe and cheaper. The effect over
hazardous waste is potential health effect when exposure to toxic chemicals and
particularly the risk of cancer.
The waste materials that cause land pollution are broadly classified as
municipal solid waste (MSW), construction and demolition (C&D) waste or debris
and hazardous waste. MSW includes nonhazardous garbage, rubbish, and trash from
homes, institutions, commercial establishments, and industrial facilities. Garbage
contains moist and biodegradable food wastes such as meat and vegetable scraps.
The rubbish comprises mostly dry materials such as paper, glass, textiles, and plastic
objects and trash includes bulky waste materials and objects such as discarded
mattresses, appliances, pieces of furniture.
20
C&D waste includes wood and metal objects, wallboard, concrete rubble,
asphalt, and other inert materials produced when structures are built, renovated or
demolished. Hazardous wastes include harmful and dangerous substances generated
primarily as liquids but also as solids, sludge or gases by various chemical
manufacturing companies, petroleum refineries, paper mills, smelters, machine
shops, dry cleaners, automobile repair shops, and many other industries or
commercial facilities. In addition to improper disposal of MSW, C&D waste, and
hazardous waste, contaminated effluent from subsurface sewage disposal can also be
a cause of land pollution.
Figure 1.1 Land Pollution
21
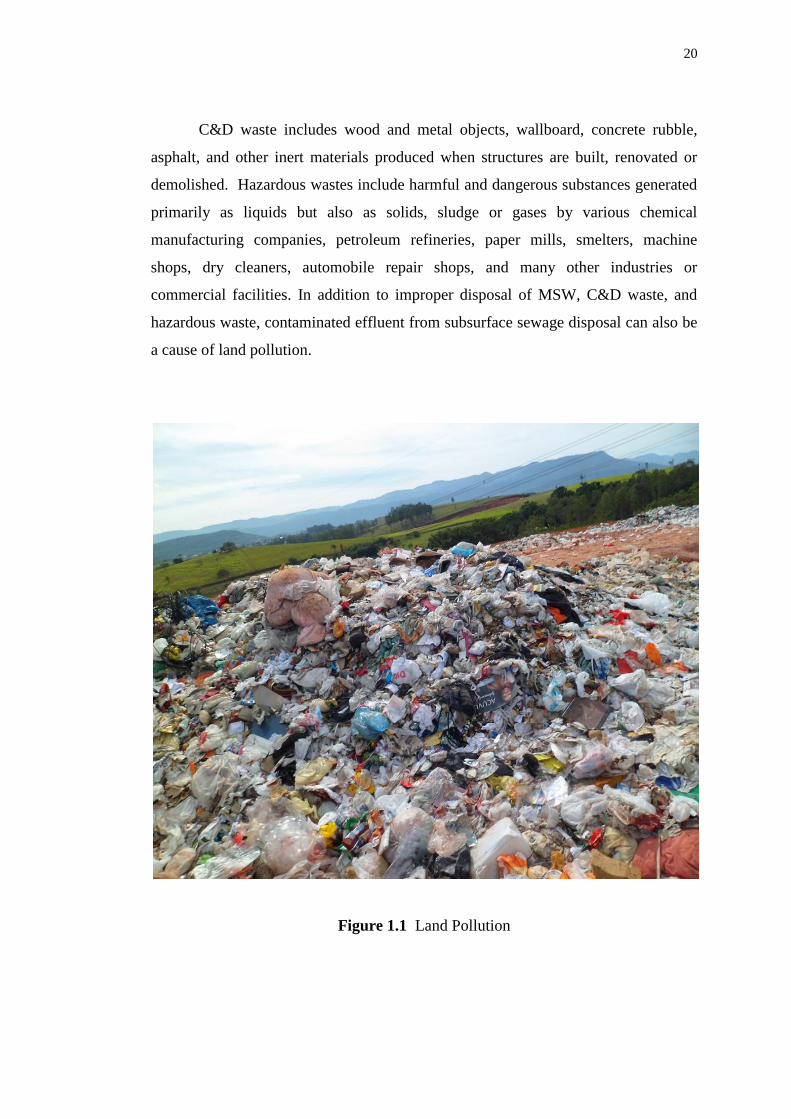
1.2.2 Air Pollution
World Health Organization (WHO) stated that air pollution is contamination
of the indoor or outdoor environment by any chemical, physical or biological agent
that modifies the natural characteristic of the atmosphere. Its consists of gaseous,
liquid, or solid substances that, when present in sufficient concentration, for a
sufficient time, and under certain conditions, tend to interfere with human comfort,
health or welfare, and cause environmental damage.
The smoke from the burning of coal, peat and other fuel contribute of air
pollution. Around large power plants and industrial, the wind can carries the smoke
over long distance and air can be contaminated with a radius of 1 to 5 kilometres.
Other source of air pollution is from industrial enterprise significant to dust
generation. The amount of dust, its characteristic and influence on the human body
vary and depend on the location and source of dust and on its composition.
(Ekaterina, 2011).
Air pollution causes acid rain, ozone depletion, photochemical smog, and
other such phenomena. Some of the main contributors to air pollution are
automobile emissions, tobacco smoke, combustion of coal, acid rain, noise pollution
from cars and construction, power plants, manufacturing buildings, large ships,
aerosol sprays, wildfires and nuclear weapons.
22
Figure 1.2 Air pollution
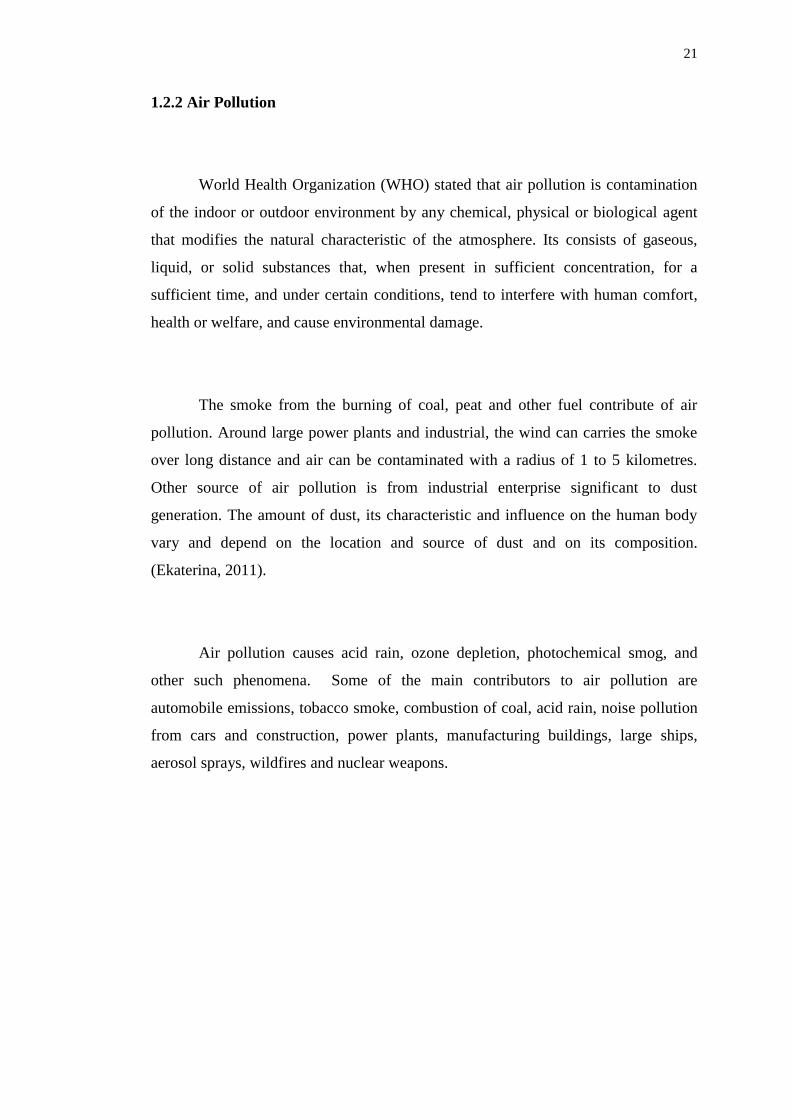
1.2.3 Water Pollution
Water pollution is the introduction of chemical, biological and physical
matter into large bodies of water that degrade the quality of life that lives in it and
consumes it. Water pollution happens when toxic substances enter water bodies such
as lakes, rivers, oceans and so on, getting dissolved in them, lying suspended in the
water or depositing on the bed as defined by as the U.S Public Health Service. This
degrades the quality of water.
23
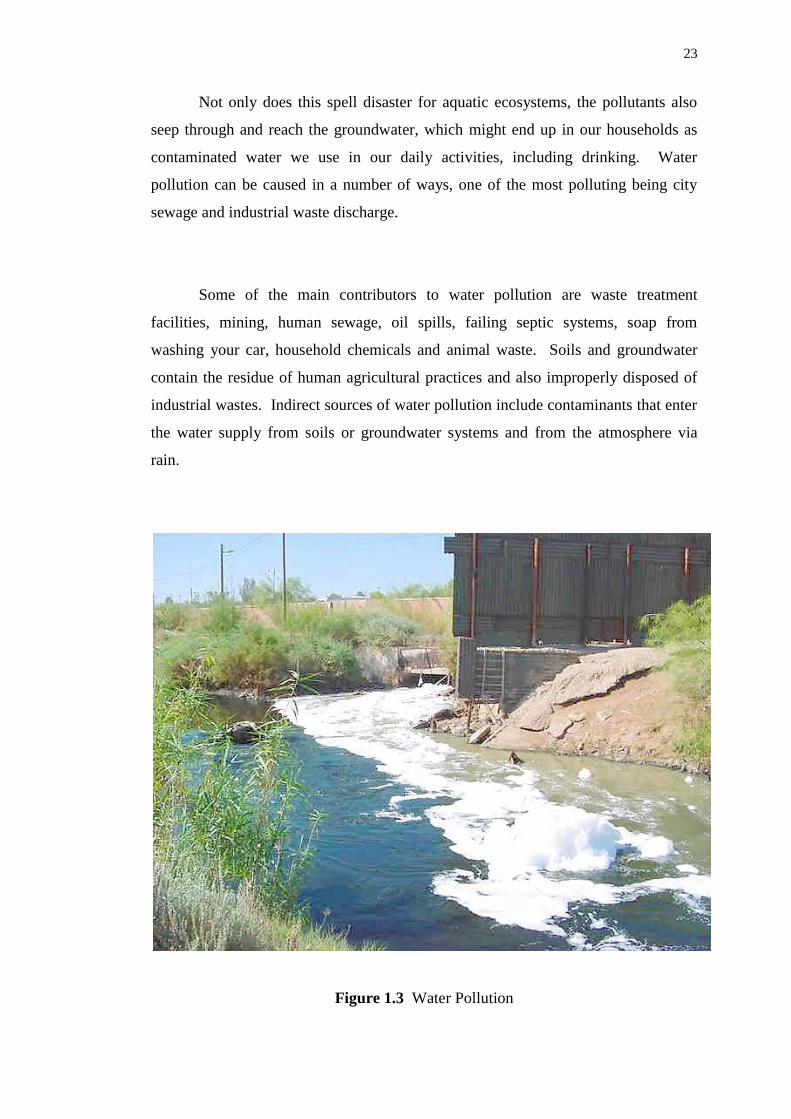
Not only does this spell disaster for aquatic ecosystems, the pollutants also
seep through and reach the groundwater, which might end up in our households as
contaminated water we use in our daily activities, including drinking. Water
pollution can be caused in a number of ways, one of the most polluting being city
sewage and industrial waste discharge.
Some of the main contributors to water pollution are waste treatment
facilities, mining, human sewage, oil spills, failing septic systems, soap from
washing your car, household chemicals and animal waste. Soils and groundwater
contain the residue of human agricultural practices and also improperly disposed of
industrial wastes. Indirect sources of water pollution include contaminants that enter
the water supply from soils or groundwater systems and from the atmosphere via
rain.
Figure 1.3 Water Pollution
24
1.3 Water Quality Standard
Water Quality Standards are the foundation of the water quality based control
program mandated by the Clean Water Act. The standards are also the technical
basis for reducing runoff from rural and urban areas. A standard can consist of either
numeric or narrative limits for a specific physical or chemical parameter. Ultimately,
a water quality standard is developed to help protect and maintain water quality
necessary to meet and maintain designated or assigned uses, such as swimming,
recreation, public water supply, and aquatic life.
The water quality status of rivers in Malaysia has been a cause for concern
for various local authorities, government agencies as well as the public at large.
Rives in Malaysia are generally considered polluted with coherent examples such as
Sungai Klang in Selangor, Sungai Juru in Penang and Sungai Sengget in Johor. In
Malaysia, the existing methodology for river water quality classification and
monitoring is quite extensive. In fact, the country’s current water quality monitoring
network is at par, if not better, than many developed countries. At the moment,
Malaysia has over 100 manual and automatic river quality monitoring stations in 146
basin maintained by the Department of Environment(DOE) alone (Malaysia
Environmental Quality Report,2006).
Environmental acts and regulations were established in 1970's.
"Environmental Quality Act 1974" is an act related to the prevention, abatement,
control of pollution and enhancement of the environment. Under this act, the
Minister after consultation with the Environmental Quality Council elaborates
regulations for prescribing ambient water quality standards which are applied to
surface waters and marine waters. "The Environmental Quality (Sewage and
Industrial Effluents) Regulations 1979" was also established under the act to
prescribe discharge standards.
25
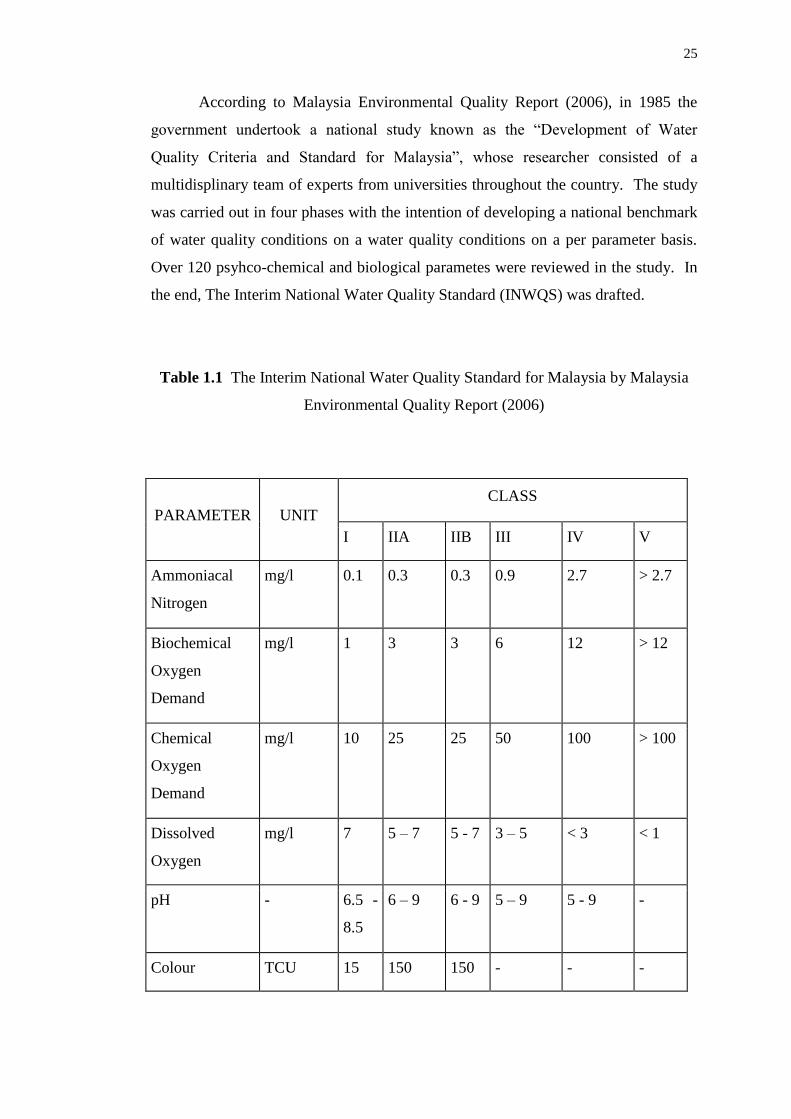
According to Malaysia Environmental Quality Report (2006), in 1985 the
government undertook a national study known as the “Development of Water
Quality Criteria and Standard for Malaysia”, whose researcher consisted of a
multidisplinary team of experts from universities throughout the country. The study
was carried out in four phases with the intention of developing a national benchmark
of water quality conditions on a water quality conditions on a per parameter basis.
Over 120 psyhco-chemical and biological parametes were reviewed in the study. In
the end, The Interim National Water Quality Standard (INWQS) was drafted.
Table 1.1 The Interim National Water Quality Standard for Malaysia by Malaysia
Environmental Quality Report (2006)
PARAMETER UNIT
CLASS
I IIA IIB III IV V
Ammoniacal
Nitrogen
mg/l 0.1 0.3 0.3 0.9 2.7 > 2.7
Biochemical
Oxygen
Demand
mg/l 1 3 3 6 12 > 12
Chemical
Oxygen
Demand
mg/l 10 25 25 50 100 > 100
Dissolved
Oxygen
mg/l 7 5 – 7 5 - 7 3 – 5 < 3 < 1
pH - 6.5 -
8.5
6 – 9 6 - 9 5 – 9 5 - 9 -
Colour TCU 15 150 150 - - -
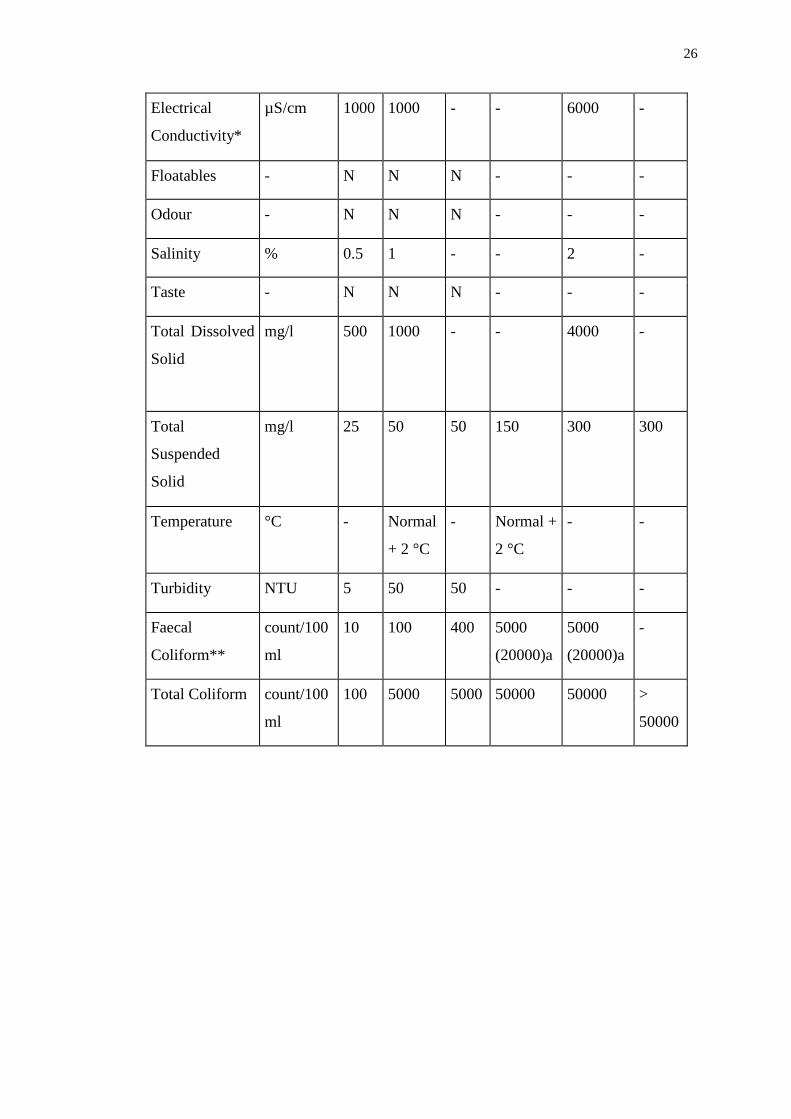
26
Electrical
Conductivity*
µS/cm 1000 1000 - - 6000 -
Floatables - N N N - - -
Odour - N N N - - -
Salinity % 0.5 1 - - 2 -
Taste - N N N - - -
Total Dissolved
Solid
mg/l 500 1000 - - 4000 -
Total
Suspended
Solid
mg/l 25 50 50 150 300 300
Temperature °C - Normal
+ 2 °C
- Normal +
2 °C
- -
Turbidity NTU 5 50 50 - - -
Faecal
Coliform**
count/100
ml
10 100 400 5000
(20000)a
5000
(20000)a
-
Total Coliform count/100
ml
100 5000 5000 50000 50000 >
50000
27
1.4 Effect of Water Pollution
The effects of water pollution can be catastrophic, depending on the kind of
chemicals, concentrations of the pollutants and where there are polluted. These
effects varied and depend on what chemicals are dumped and in which locations.
Many water bodies near urban areas such as cities and towns are highly polluted.
This is the result of both garbage dumped by individuals and dangerous chemicals
legally or illegally dumped by manufacturing industries, health centres, schools and
market places.
The main problem caused by water pollution is that it kills life that depends
on these water bodies. Dead fish, crabs, birds and sea gulls, dolphins, and many
other animals often wind up on beaches, killed by pollutants in their habitat.
Pollution disrupts the natural food chain as well. Pollutants such as lead and
cadmium are eaten by tiny animals. Later, these animals are consumed by fish and
shellfish, and the food chain continues to be disrupted at all higher levels.
Eventually, peoples can get diseases such as hepatitis by eating seafood that has been
poisoned.
Ecosystems can be severely changed or destroyed by water pollution. Many
areas are now being affected by careless human pollution, and this pollution is
coming back to hurt humans in many ways. We all drink water that comes from a
lake or local river. In countries that have poor screening and purification practices,
people often get water-borne disease outbreaks such as cholera and tuberculosis.
Every year, there are an estimated three to five millions cholera cases and 100 000 to
120 000 deaths due to cholera.
In developed countries, even where there are better purification methods,
people still suffer from the health effects of water pollution. Take toxins emitted by
algae growth for instance and this can cause stomach aches and rashes. Excess
28
nitrogen in drinking water also pose serious risks to infants. There is some real
financial implications that will result from water pollution. It can cost a lot more to
purify drinking water that takes its source from nutrient polluted water bodies.
Fishing stock is affected negatively when there is a depletion of oxygen. Consumers
are also weary of fish from these sources and tend to stay away from them, costing
fisheries to lose revenue.
1.5 Statement of Problem
To help better understand our world, we often describe a better particular
phenomenon mathematically. Such mathematical model is idealization of the real
world phenomenon and never a completely accurate representation. In modelling
world, we are interested in predicting the value of a variable at some time in the
future.
In this research, in order to study the river flow with the effect of diffusion
and advection in medium, we need to study a suitable mathematical model that
represents the physical phenomenon. In this purpose, we are determining one-
dimensional mathematical model of river pollution with the effect of without and
with additional of pollutant. The model will then be solved via analytical. Once we
have obtained the solution to the model, the graph of the solution will be computed
using Maple. Then, we will be able to identify the concentration level of pollutant at
any point of the river.
29
1.6 Objectives of the Research
The objectives of this research are:
1. to formulate advection-diffusion model without and with source.
2. to get the solutions of advection-diffusion model without and with source.
3. to compare the solution of advection-diffusion model between without and with
source.
1.5 Scope of the Research
This study emphasize on the formulation of the mathematical model to
determine the concentration of pollutant based on advection-diffusion equation. This
study focus on two problem which advection-diffusion equation without and with
source. Source is a chemical substance that pour into the river. The mathematical
model of river pollution is in term of partial differential equation. The analytical
solution of the model is found using a transformation and Laplace transform. Once
the result have been obtained, we will interpret the result based on the graphical
output.
30
1.6 Significance of the Research
From this research, we can predict the concentration of pollutant in the river
at any distance. The solution can helps the authority in making quick and accurate
decision related to cleaning the river and making policy about level pollution of river
in certain area
1.7 Report Structure
The report structure for this dissertation are listed as below:
i. Chapter 1
Introduction. Briefly introduction about pollution and Water Quality Standard. The
statement of problem, objective, scope and significance of the research are explained
in this chapter.
ii. Chapter 2
Literature Review. All previous studies or research that has been done and related
with the current project is assembled in this chapter, including the theories, models,
methods and figures that may support this project.
iii. Chapter 3
Methodology. The dissertation’s methodology is describe as method or approached
that used to solve the problem given.
31
iv. Chapter 4
Mathematical Modelling. The techniques that used to analyze and to get solutions
for the method proposed in the previous chapter will be shown and use to obtain
result in the next chapter using appropriate mathematical package.
v. Chapter 5
Results and Data Analysis. The solutions from previous chapter will be used to
analyze the problem proposed. All results and graph will be shown and attached in
this chapter.
vi. Chapter 6
Conclusion and Recommendation. This dissertation will be concluded with a
summary after the whole studied is completed.
80
REFERENCES
Bear, J. & Verrujit, A. (1987). Modelling Groundwater Flow and Pollution. Holland.
D. Reidel Publishing Co.
Benedini, M. (2011). Water Quality Models for Rivers and Streams. State of the Art
and Future Perspectives. European Water 34: 27-40
Bowden, K. F. (1983). Physical Oceanography of Coastal Water. Chicester: Ellis
Horwoord Ltd.
Chapman, D. (1996). Water Quality Assessments. A Guide to Use of Biota,
Sediments and Water in Environmental Monitoring, (2nd
ed.), London, F&
FN Spon.
Chen, W., and Guidotti, T. L., (2011). Environmental Health Hazards.Stellman, J. M.
Encyclopedia of Occupational Health and Safety. Geneva. International
Labor Organization. 53.
Cunningham, P. and Saigo, B. W. (1999). Environmental Science: A Global Conern,
5th
ed., New York, McGraw Hill.
Dennis Zill and Warren Wright. (2013). Differential Equation with Boundary-
ValueProblems 8th
Edition. Cengage Learning. Boston, USA.
Evdokimove Ekaterina (2011). Air pollution and air cleaning equipment in building.
University of Applied Science. Tesis Sarjana Muda.
G. B. Davis. (1983). A Laplace transform technique for the analytical solution of a
diffusion-convection equation over a finite domain.
Gorelick, S. M., Remson, I. & Cottle, R. W. (1979). “Management model of a
Groundwater system with a Transient Pollutant source.” Water resources
Research. 15(5); 1243-1249.
Gupta, A. D.& Yapa, P. N. D. D. (1982). “Saltwater Enroachment in an Aquifer: A
case study.” Water resources Research. 18(3); 546-556.
81
Hammer, M. J. and McKichan, K. A. (1981). Hydrology and Quality of Water
Resources. London. John Wilkey & Sons Incorporated.
Hayakawa, A., Shimizu, M., Woli, P., Kuromochi, K., and Hatano, R. (2006).
Evaluationg Stream Water Quality Through Land-use Analysis in Two
Grassland Catchments: Impact of Wetland on Stram Nitrogen Concentration.
Journal of Environmental Quality, 35, 617-627.
Hayat, S. M., Javed and Razzaq, S. (2007). Growth Performance of Metal Stressed
Major CarpsViz. Catla Catla, Labeo Rohita and Cirrhina Mrigala Reared
Under Semi-intensive Culture System. Pakistan Vet. 8-12
Jamaluddin. T, Zainal. A. A, (2012). Mathematical Method, Lecture Notes.
Universiti Teknologi Malaysia.
Joy Klinkenberg, H. C., De Lange and Luca Brandt. (2011). Modal and Non-modal
Stability of Particle-laden Channel Flow. Physics of Fluids.
Kachiasvili, K. J., and Melikdzhanian, D. I. (2009). Software Realization Problems
of Mathematical Models of Pollutants Tansport in Rivers. International
Journal Advances in Engineering Software, 40, 1063-1073.
Kachiashvili K.J., Gordeziani D.G. and Melikdzhanian D.I. (2001) Mathematical
models of disseminate of pollutants with allowance for of many sources of
effect. Proceeding of the Urban Drainage Modeling Symposium, May, 20-24,
Orlando, Florida, 692-702.
Kumar, A. Jaiswal, D. K. and Kumar, N. (2008). Analytical solutions of one-
dimensional advection-diffusion equation with variable coefficients in a finite
domain. Journal Earth Syst. Science. 118 (2008) 539-549.
Kumar, A. Jaiswal, D. K. and Kumar, N. (2009). Analytical Solutions to One-
Dimensional Advection-Diffusion Equation with Variable Coefficients in
Semi-Infinite Media. Journal of Hydrology 380(2010) 330-337.
Liao, S. (2012). Homotopy Analysis Method in Nonlinear Differential Equation.
London.Springer Heidelberg Dordrecht London New York.
Malaysia (1974). Environmental Quality Act 1974. Act 127.
Ministry of Natural Resources and Environment (2010). Environmental Guideline.
Department of Environment, Malaysia.
Mohammad Farukh N. Mohsen and Mohammed H. Baluch. (1983). An analytical
solution of the diffusion-convection equation over a finite domain.
82
Peters, N. E. and Meybeck, M. (2000). Water Quality Degradation Effects on
Freshwater Availability:Impact of Human Activities. Water International.
25:2. 185-193.
Pierce, J. J., Weiner, R. F., and Vesilind, P. A. (1998). Environmental Pollution and
Control. 4th
ed. Boston, Buttorworth-Heinemann.
Scott, A. S. Gerhand, H. J. (2004). Derivative of Advection Diffusion Equation.
Advection Diffusion Equation 29-31
Suhaila Sulong (2014). Mathematical Model for River Pollution. Universiti
Teknologi Malaysia. Tesis Sarjana.
Vega, M., Prado, R., Barrado, E., and Deban, L., (1998). “Assessment of Seasonal
and Polluting Effect on the Quality of River Water by Exploratory Data
Analysis”, Water Research, 32:2, 3581-3592.
Wang, H. F. & Anderson, M. P. (1982). Introduction to Groundwater Modeling:
Finite Difference and Finite Elements Methods. San Francisco. W. H.
Freeman & Co.
Wee, D. C. K. (2013). Mathematical Modelling in River Pollution Control.
Universiti Teknologi Malaysia. Tesis Sarjana.
WHO (2006) Guidelines for Drinking Water Quality: First Addendum To 3rd
Edition.Vol. 1 Recommendations, Geneva, World Health Organization.
Zhu, W., Graney, J., and Salvage, K. (2008). “Land-use on Water Pollution: Elevated
Pollutant Input and Reduced Pollutant Retentaion”, Journal of Contemporary
Water Research & Education, 139, 15-21.


![Numerical Analysis of Pollutant Concentration …phadungsak.me.engr.tu.ac.th/downloads/2019-3...120 mg.L-1, and sulfide concentration should be less than 1 mg.L-1 [4]. There have been](https://img.pdfslide.us/doc/110x75/5f50b57519302247b1072c1f/numerical-analysis-of-pollutant-concentration-120-mgl-1-and-sulfide-concentration.jpg)