Embed Size (px)
Citation preview
MATH125
Chapter 3 topics
ANALYZING DATA ANALYZING DATA NUMERICALLYNUMERICALLY
Notation
denotes the sum of a set of values.
x is the variable usually used to represent the individual data values.
n represents the number of values in a sample.
N represents the number of values in a population.
Section 3.1 Measures of Central Tendency
1. mean
2. median
3. mode
3-3
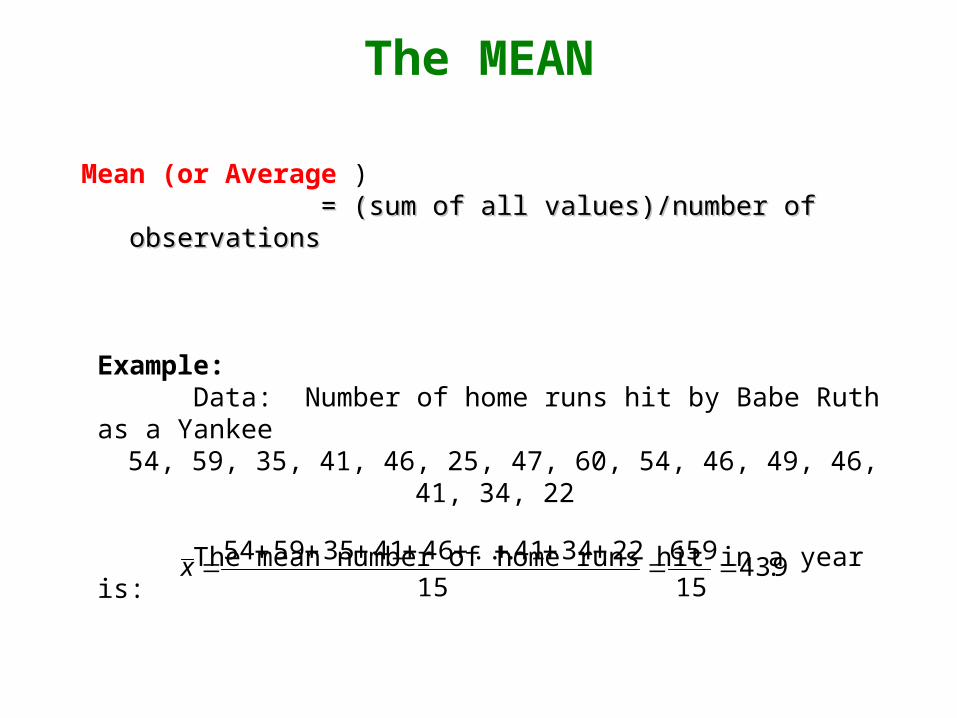
Mean (or Average ) = (sum of all values)/number of observations= (sum of all values)/number of observations
Example: Data: Number of home runs hit by Babe Ruth as a Yankee 54, 59, 35, 41, 46, 25, 47, 60, 54, 46, 49, 46, 41, 34, 22
The mean number of home runs hit in a year is:
9.4315
659
15
223441...4641355954
x
The MEAN
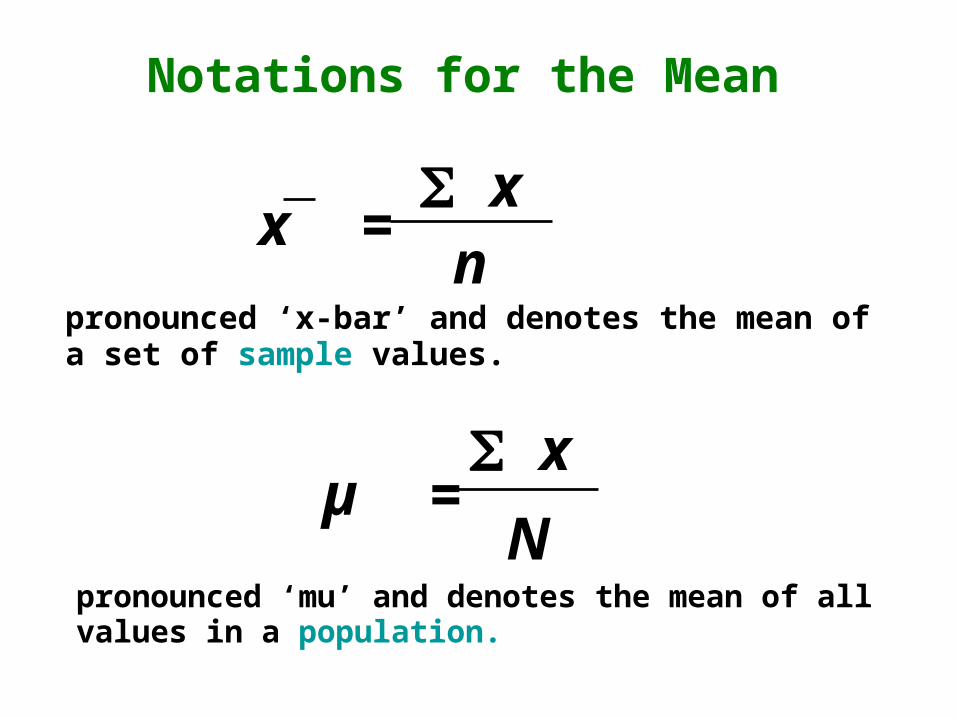
Notations for the Mean
pronounced ‘mu’ and denotes the mean of all values in a population.
x =n
x
pronounced ‘x-bar’ and denotes the mean of a set of sample values.
Nµ =
x
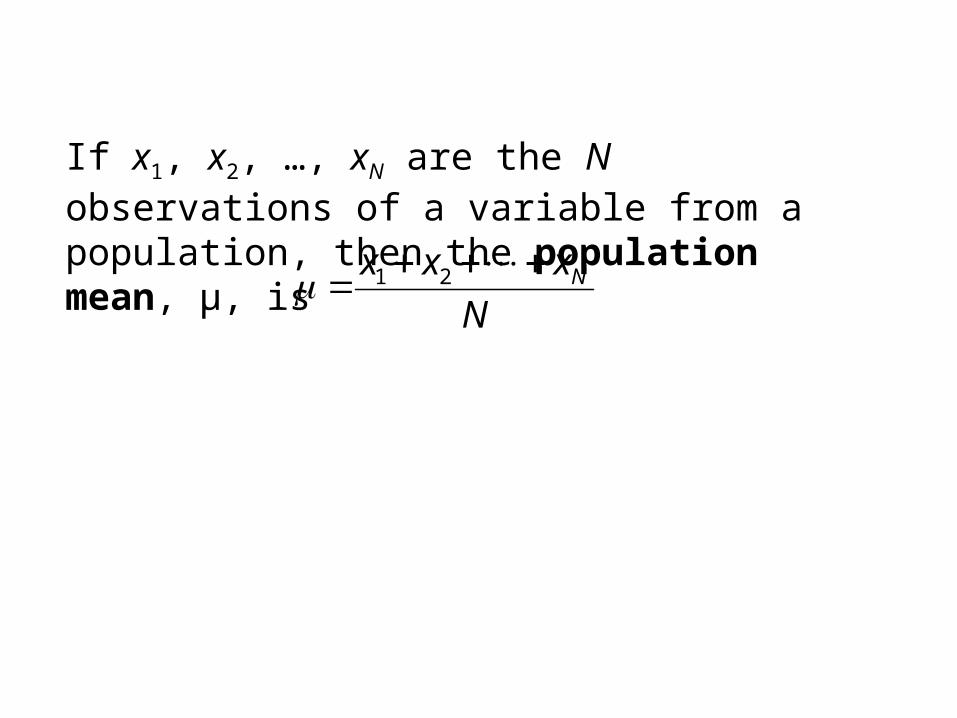
If x1, x2, …, xN are the N observations of a variable from a population, then the population mean, µ, is
1 2 Nx x x
N
3-6
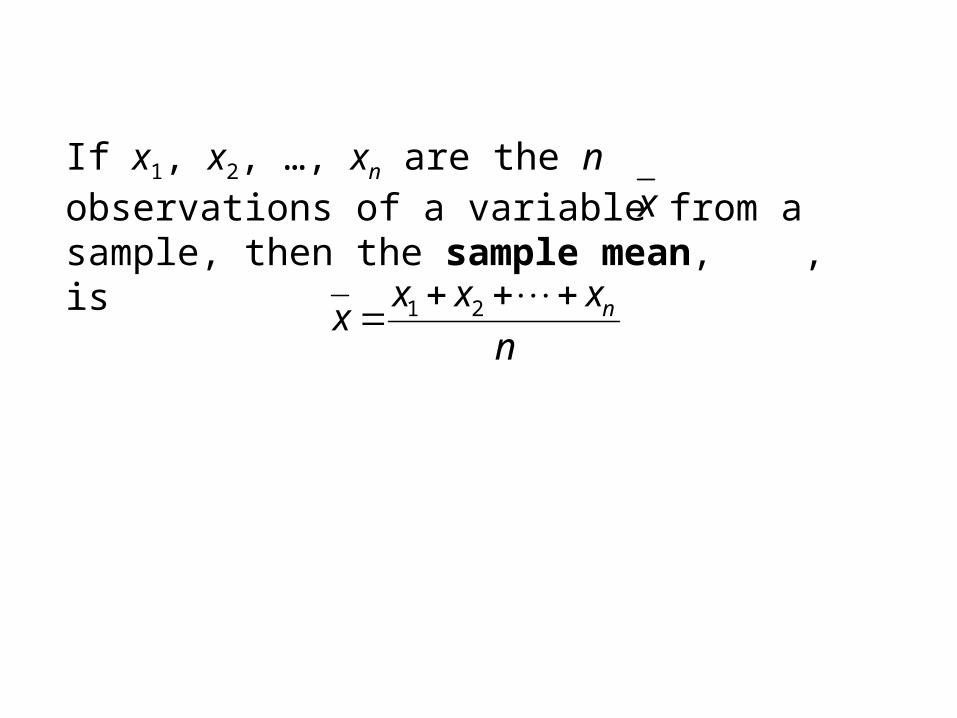
If x1, x2, …, xn are the n observations of a variable from a sample, then the sample mean, , is
1 2 nx x xx
n
x
3-7
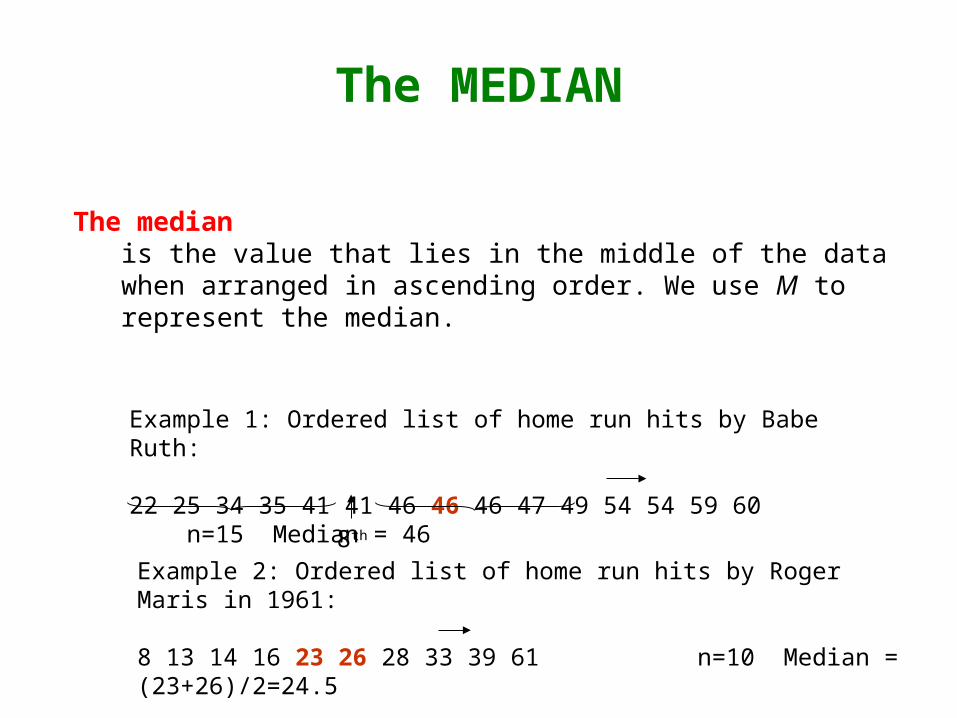
The medianis the value that lies in the middle of the data when arranged in ascending order. We use M to represent the median.
Example 1: Ordered list of home run hits by Babe Ruth:
22 25 34 35 41 41 46 46 46 47 49 54 54 59 60 n=15 Median = 46
8th
Example 2: Ordered list of home run hits by Roger Maris in 1961:
8 13 14 16 23 26 28 33 39 61 n=10 Median = (23+26)/2=24.5
The MEDIAN
3-9
• What does it mean for a statistic to be resistant ?
3-10
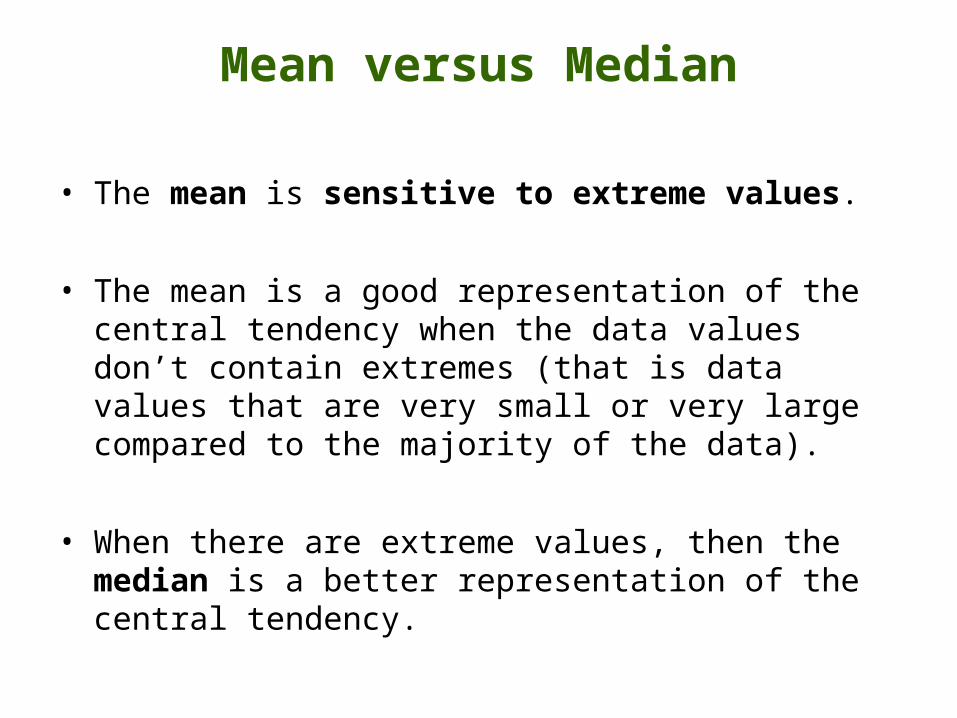
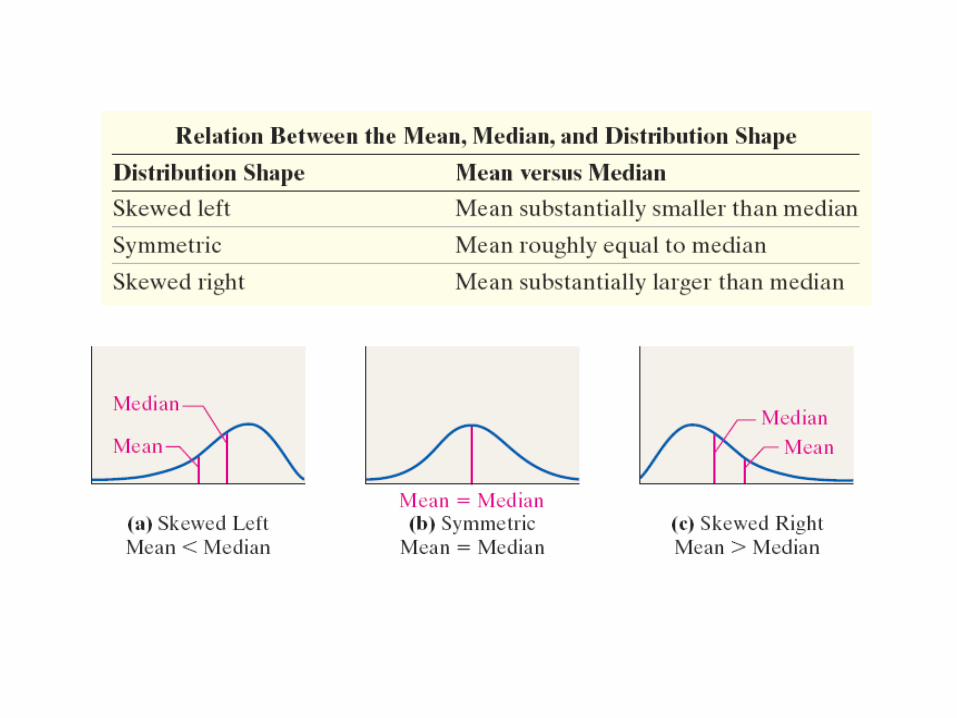
Mean versus Median
• The mean is sensitive to extreme values.
• The mean is a good representation of the central tendency when the data values don’t contain extremes (that is data values that are very small or very large compared to the majority of the data).
• When there are extreme values, then the median is a better representation of the central tendency.
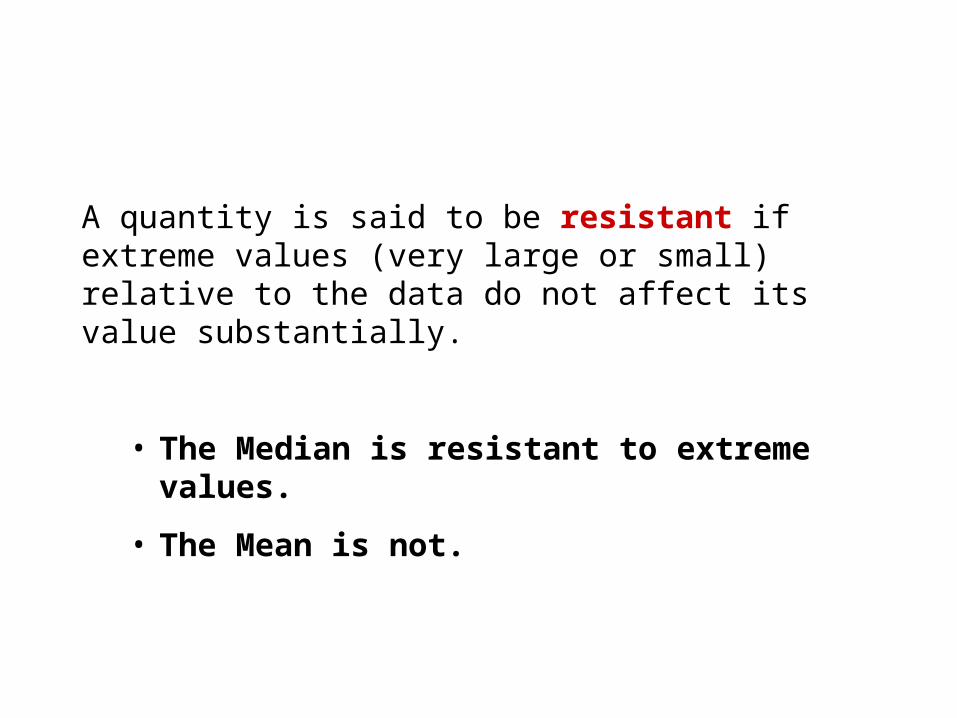
A quantity is said to be resistant if extreme values (very large or small) relative to the data do not affect its value substantially.
• The Median is resistant to extreme values.
• The Mean is not.
3-12
3-13
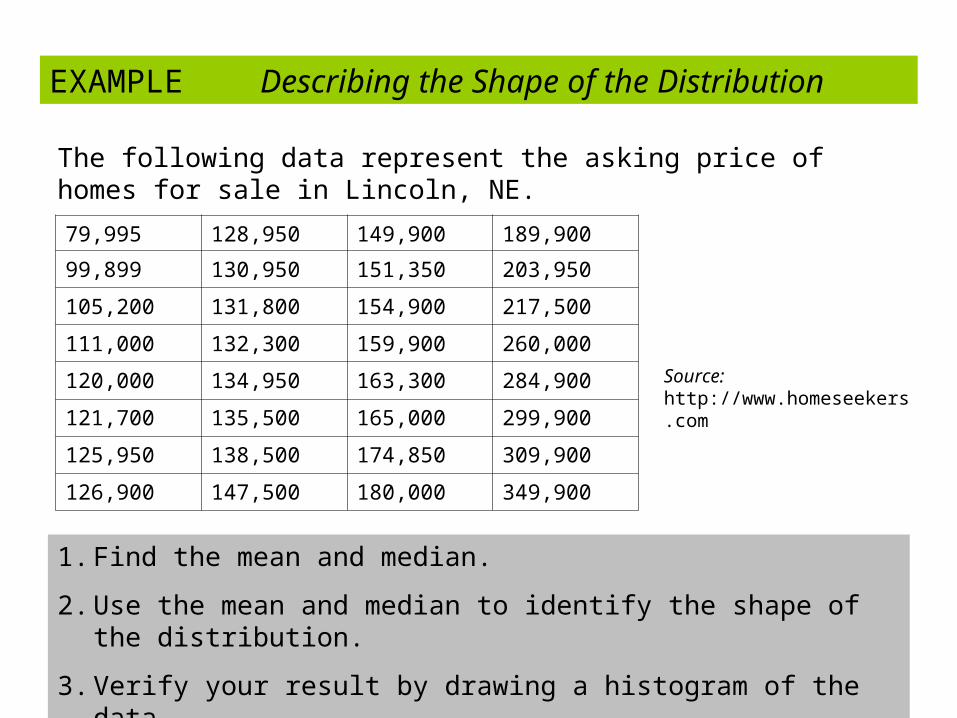
EXAMPLE Describing the Shape of the Distribution
The following data represent the asking price of homes for sale in Lincoln, NE.
Source: http://www.homeseekers.com
79,995 128,950 149,900 189,900
99,899 130,950 151,350 203,950
105,200 131,800 154,900 217,500
111,000 132,300 159,900 260,000
120,000 134,950 163,300 284,900
121,700 135,500 165,000 299,900
125,950 138,500 174,850 309,900
126,900 147,500 180,000 349,900
3-14
1. Find the mean and median.
2. Use the mean and median to identify the shape of the distribution.
3. Verify your result by drawing a histogram of the data.
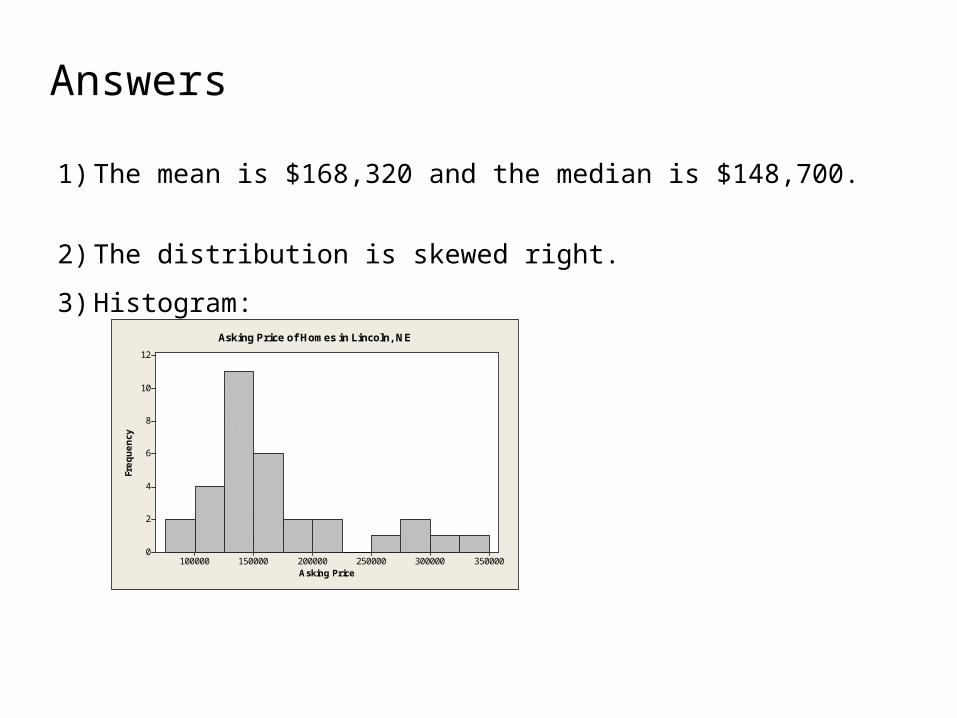
Answers
1) The mean is $168,320 and the median is $148,700.
2) The distribution is skewed right.
3) Histogram:
3-15
350000300000250000200000150000100000
12
10
8
6
4
2
0
Asking Price
Frequency
Asking Price of Homes in Lincoln, NE
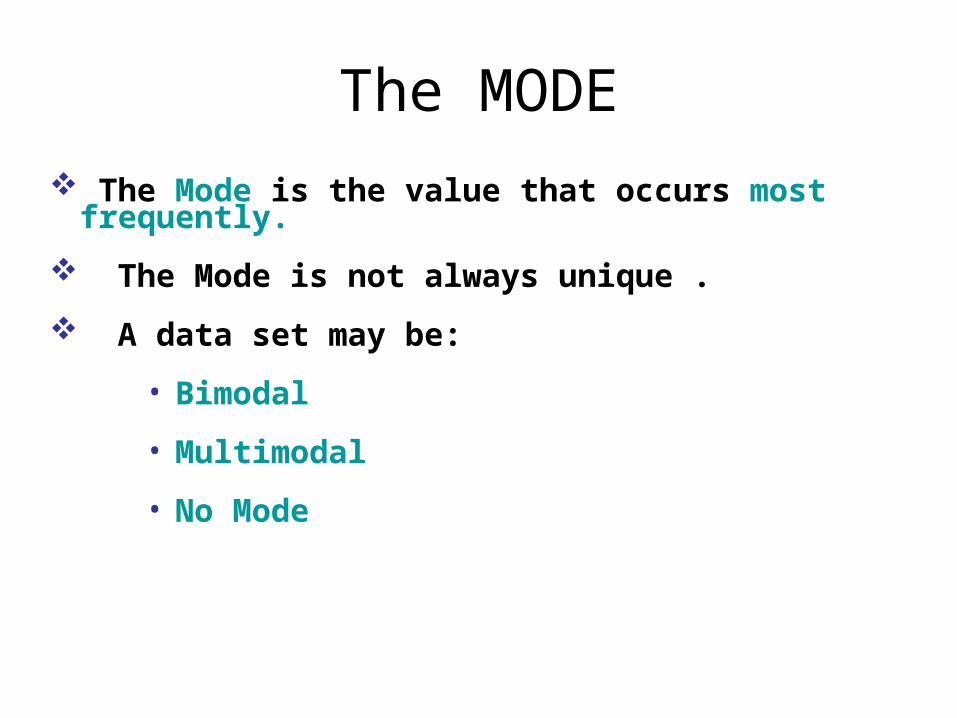
The MODE
The Mode is the value that occurs most frequently.
The Mode is not always unique .
A data set may be:
• Bimodal
• Multimodal
• No Mode
EXAMPLE Finding the Mode of a Data Set
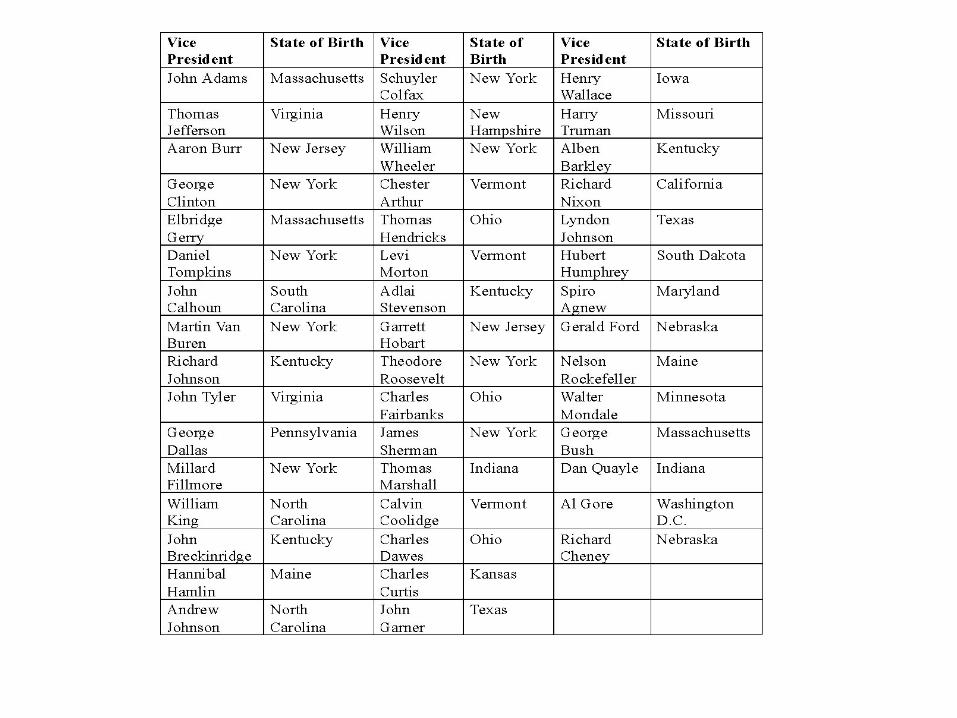
The data on the next slide represent the Vice Presidents of the United States and their State of birth. Find the mode for the variable State.
3-17
3-18

3-19
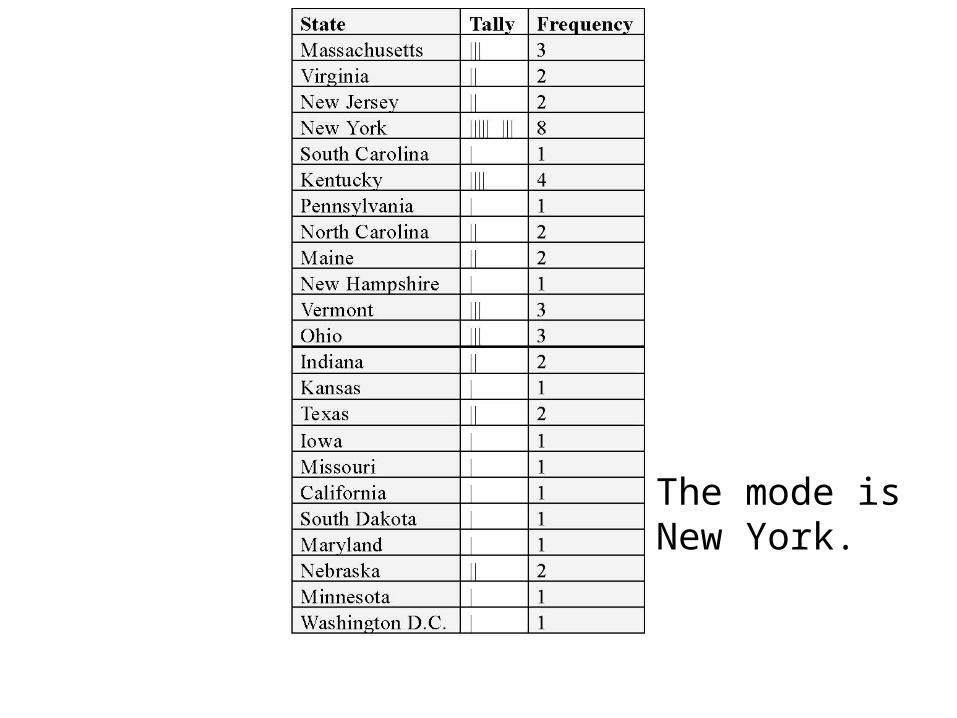
The mode is New York.
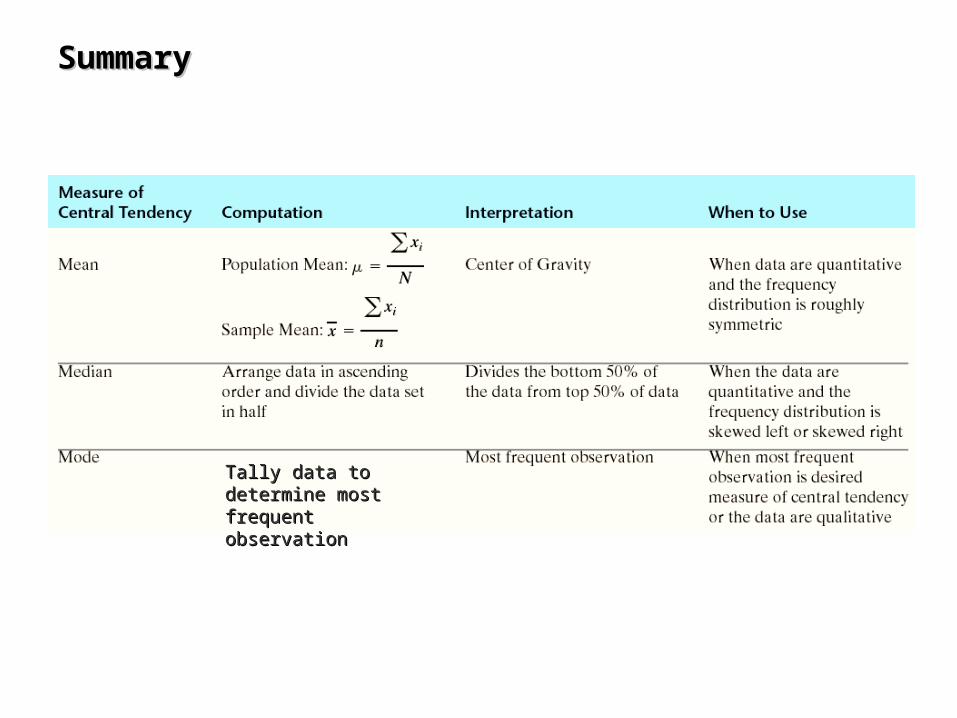
Tally data to determine Tally data to determine most frequent observationmost frequent observation
3-21
SummarySummary
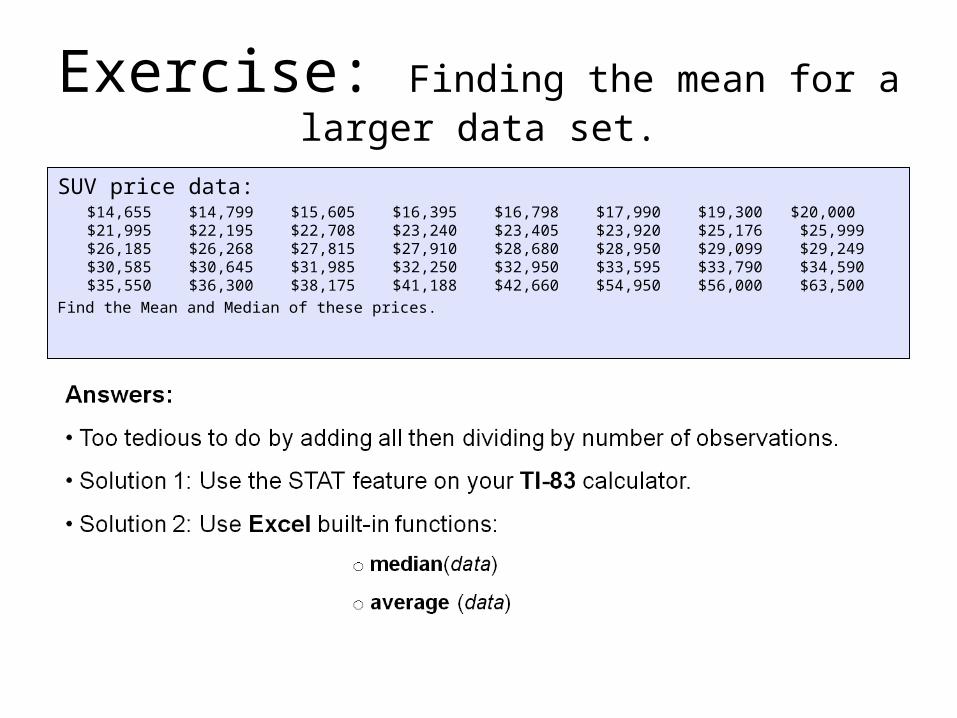
Exercise: Finding the mean for a larger data set.
SUV price data:$14,655 $14,799 $15,605 $16,395 $16,798 $17,990 $19,300 $20,000 $21,995 $22,195 $22,708 $23,240 $23,405 $23,920 $25,176 $25,999$26,185 $26,268 $27,815 $27,910 $28,680 $28,950 $29,099 $29,249$30,585 $30,645 $31,985 $32,250 $32,950 $33,595 $33,790 $34,590$35,550 $36,300 $38,175 $41,188 $42,660 $54,950 $56,000 $63,500
Find the Mean and Median of these prices.
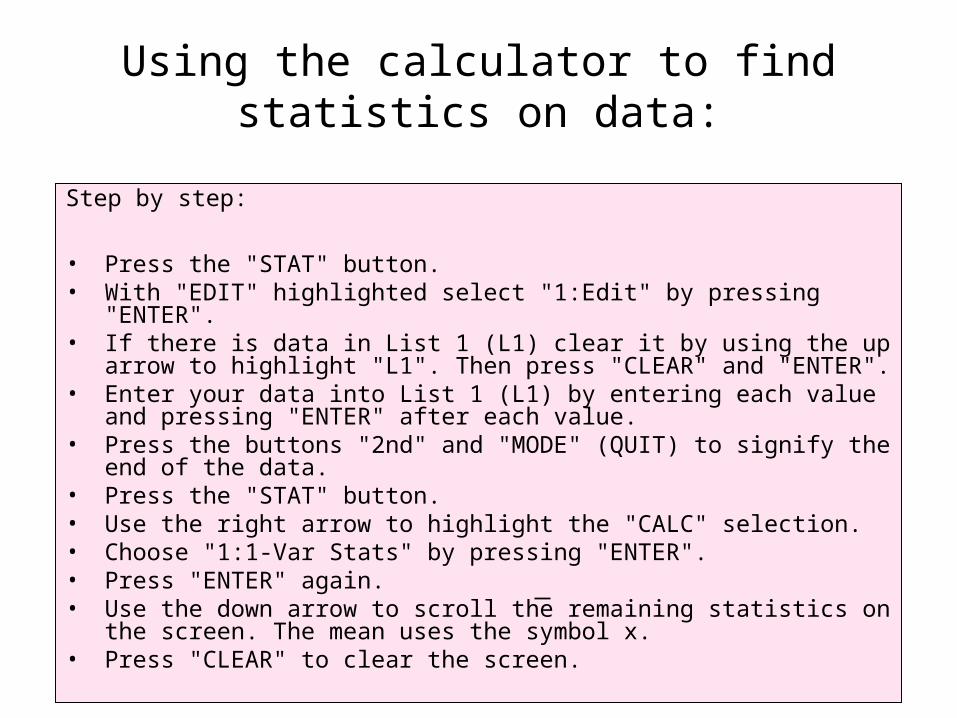
Using the calculator to find statistics on data:
Step by step:
• Press the "STAT" button.• With "EDIT" highlighted select "1:Edit" by pressing "ENTER". • If there is data in List 1 (L1) clear it by using the up arrow to highlight "L1".
Then press "CLEAR" and "ENTER".• Enter your data into List 1 (L1) by entering each value and pressing
"ENTER" after each value.• Press the buttons "2nd" and "MODE" (QUIT) to signify the end of the data.• Press the "STAT" button.• Use the right arrow to highlight the "CALC" selection.• Choose "1:1-Var Stats" by pressing "ENTER".• Press "ENTER" again. • Use the down arrow to scroll the remaining statistics on the screen. The
mean uses the symbol x.• Press "CLEAR" to clear the screen.
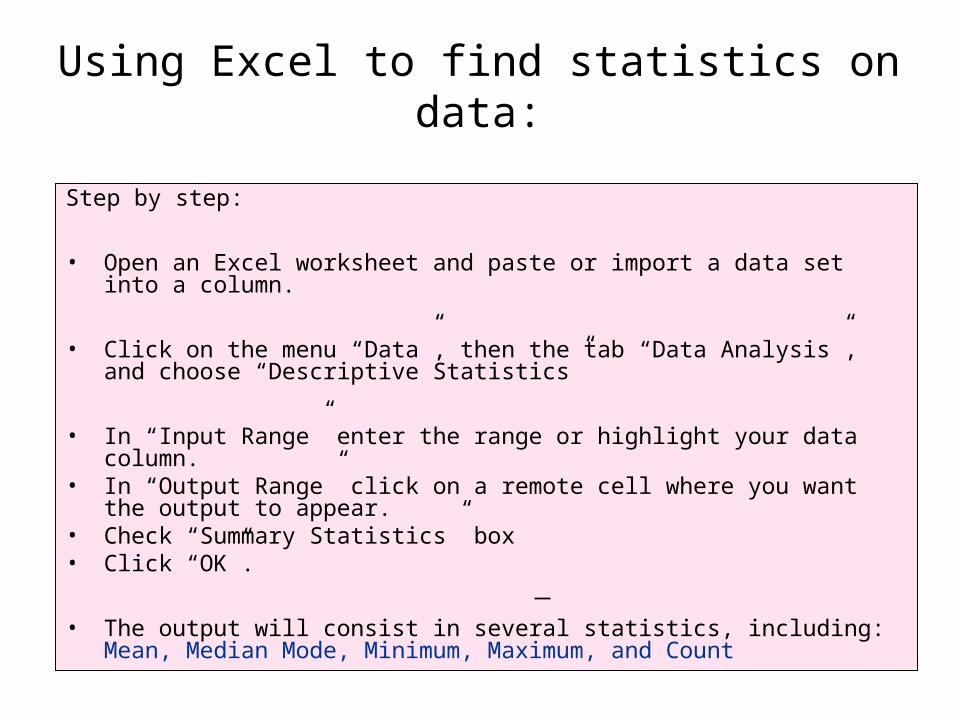
Using Excel to find statistics on data:
Step by step:
• Open an Excel worksheet and paste or import a data set into a column.
• Click on the menu “Data”, then the tab “Data Analysis”, and choose “Descriptive Statistics”
• In “Input Range” enter the range or highlight your data column.• In “Output Range” click on a remote cell where you want the output to
appear.• Check “Summary Statistics” box• Click “OK”.
• The output will consist in several statistics, including: Mean, Median Mode, Minimum, Maximum, and Count
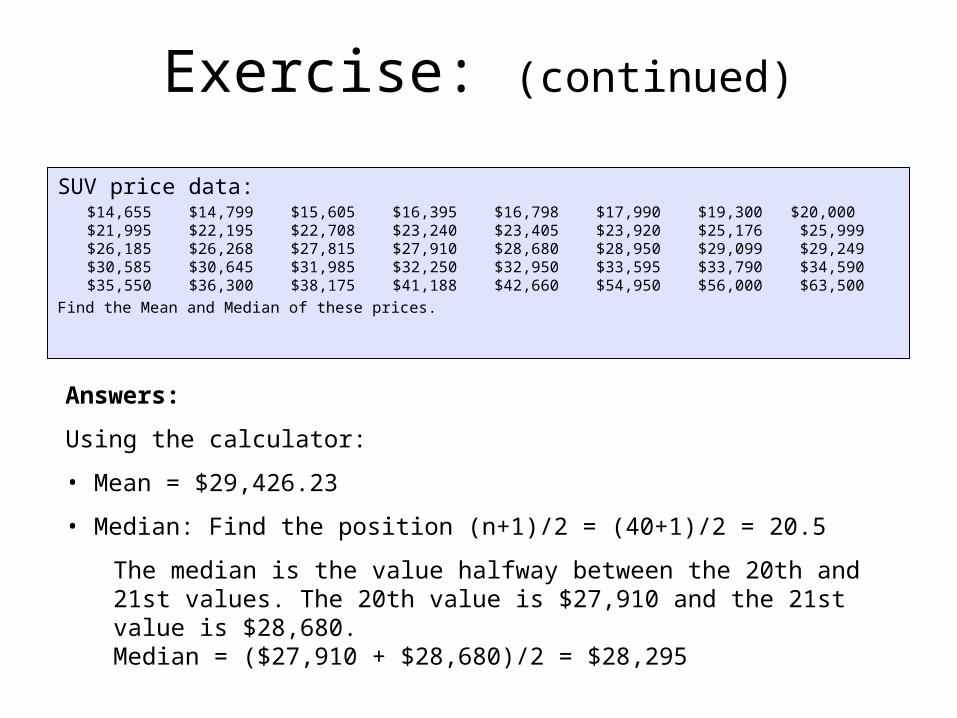
Exercise: (continued)
SUV price data:$14,655 $14,799 $15,605 $16,395 $16,798 $17,990 $19,300 $20,000 $21,995 $22,195 $22,708 $23,240 $23,405 $23,920 $25,176 $25,999$26,185 $26,268 $27,815 $27,910 $28,680 $28,950 $29,099 $29,249$30,585 $30,645 $31,985 $32,250 $32,950 $33,595 $33,790 $34,590$35,550 $36,300 $38,175 $41,188 $42,660 $54,950 $56,000 $63,500
Find the Mean and Median of these prices.
Answers:
Using the calculator:
• Mean = $29,426.23
• Median: Find the position (n+1)/2 = (40+1)/2 = 20.5
The median is the value halfway between the 20th and 21st values. The 20th value is $27,910 and the 21st value is $28,680.Median = ($27,910 + $28,680)/2 = $28,295