Embed Size (px)
Citation preview

1

Although the domain covers both sta5s5cs and probability, the focus of this session will be the sta5s5cs progression from 6th grade through Course 1 in High School. The Sta5s5cs and Probability domain first appears in the 6th grade. In K-‐5, students collected data in the Measurement and Data domain and graphed with bar graphs. These are the main topics in 6th grade.
2

The comparison of two distribu5ons builds on the understandings from 6th grade. This is the students’ first introduc5on to probability.
3

8th grade focuses on scaMer plots and linear models. The two-‐way tables uses rela5ve frequencies for categorical data.
4

In the first year of high school mathema5cs, students con5nue to build on the founda5on laid in middle school with dot plots, box plots and histograms by interpre5ng shape, center, spread and outliers and incorpora5ng technology. Mean Absolute Devia5on is further developed to standard devia5on. ScaMer plots are further developed with least squares regression line and correla5on coefficients. Two-‐way tables are further explored with joint, marginal and condi5onal rela5ve frequencies to iden5fy correla5ons.
5

Dot plots are new to the middle school standards. These graphs are rela5vely easy to make; however, Friel and Bright have iden5fied several difficul5es students have with dot plots. What are some difficul5es students would have with this graph?
-‐ Don’t count the individual dots when finding the mean – only use the numbers that have dots
-‐ See the dots as the number (ie, instead of seeing two sixes, students would add 2.
-‐ Only use the numbers with dots when finding the median instead of recognizing there are four values of 4, etc.
Finding the median: Difficul5es may be following the order of the dots; can’t always start at the top. We need a strategy to help students iden5fy the median. Dot plot does help students put the numbers in order.
Represent the value of each dot in one grid of the graph paper and then fold in half. For an odd number of data, the fold will occur in the middle of one of the blocks; for an even number of data, the fold will be between two data points. Students will need to iden5fy the number in the middle of these two values.
Ques5on: How many two’s are in this data set?
Answer: 0
6

Median can tell you that ½ the data is greater than or equal to the median and that ½ the data is less than or equal to the median.
Issues can occur when there are many of the median values.
Knowing the value of the median cannot tell you the numbers in the data set or how many numbers are in the data set.
Is it possible that the median itself is not in the data set? (yes, with an even number of data, the median is between the two values (ie, if the two middle values are 3 and 5, the median would be 4, which is not in the data set)
7

Report out and ask the purpose of this type of ques5on (Gets deeply into understanding the data and the median)
a. Need to remove one data point from each side – does it maMer which values?
b. Remove two numbers below the median
c. Remove two numbers above the median
8

Reference to the original dot plot for ease in determining the two values to be removed.
9

a. Add one value above and one value below the median
b. Add above the median
c. Add below the median
What would happen if you added two more of the median value?
10

Reference proper5es of the mean handout.
Knowing how to find the mean is not the same as understanding the concept.
11

Materials:
Snap cubes
Red card with birthplaces
Follow the direc5ons on the slide. As par5cipants work, circulate and ask about the strategies they used. Work toward scaffolding the presenta5ons to end with a group who determine the total number and then divide by the number of ci5es. If no one uses that strategy, pose the same ques5on or similar scenario with pieces of candy.
12

Materials:
Handout: What If…
Have par5cipants work in their groups to work though these problems. Make note of the “Explain how you got your answer” at the end of most of the ques5ons.
Circulate as par5cipants work to observe discussion and strategies.
Aler about 15 minutes, go thought ques5ons.
Discuss that the easiest way to get these student behaviors (mathema5cal prac5ces) to occur is through the tasks we give students.
Note on differen5a5on: The mean of the given data set is 2.5. Working with the decimal may be problema5c for some students. The mathema5cal objec5ve of this task is to understand the mean – if the decimal is gemng in the way of that work, change the values of the data set to get a whole number mean.
13

Materials:
Snap cubes (op5onal)
Aler teachers have had the opportunity to work on these, ask them to share their strategies.
14

15

New Scenario: Number of keys on a key ring
16

Materials:
Number line
Snap cubes
Sheet with number line to record their work.
What was the purpose of this task? Different distribu5ons can have the same mean
17

What were your strategies?
Was it possible to create a data set without using a value of 4 (the mean)?
How did placing a 4 in the data set affect the distribu5on?
Were there any other understandings of the mean made clear as you created your data set?
How was Prac5ce 1 evidenced with this task.
18

Knowing the mean and the number of data points can give you total value of all the data values.
Knowing this informa5on cannot tell you the exact data points
19

Materials:
Envelope with the dot plot distribu5ons
The least varia5on from the mean is Distribu5on 1
The most varia5on from the mean is Distribu5on 8
How would you order, from least to most, the other distribu5ons? Make a list of the order in which you think these distribu5ons should be. Be prepared to explain your reasoning.
The ordering here is based on intui5on. As par5cipants complete the ac5vity, walk around and see the order of the distribu5ons.
We need to quan5fy these differences (variability) by looking at the differences in the data points from the mean.
20

There are two ways to iden5fy the variability in a data set for middle school students. The first is the interquar5le range that is found with box plots. The other is the Mean Absolute Devia5on based on the varia5on of the data from the mean.
Let’s find the M.A.D. with Distribu5on 8.
Step 1: Iden5fy the mean
Step 2: Iden5fy the devia5on between each data value and the mean. If the values are below the mean, the devia5on is nega5ve; if the values are above the
mean, the values are posi5ve
Step 3: Because the mean is a balancing point, the devia5ons will be the same for the posi5ve and nega5ve values, which will add to zero. Therefore, we
take the absolute value of each number, finding the total distance each data value is from the mean
Step 4: Find the average distance each point is from the mean by adding the distances and dividing by the number of data values.
21

Demonstrate finding the MAD using the post-‐it notes with the following data set:
3, 4, 4, 4, 5, 5, 5, 6, 6, 7, 7, 7, 9, 9, 9
Mean is 6
Total distance is 24/15 = 1.6 for the M.A.D.
Give par5cipants a chance tor revise the order of distribu5ons
22

These are the MADs of the different dot plot distribu5ons. Using the MAD helps to order the distribu5ons from least variability to most variability.
23
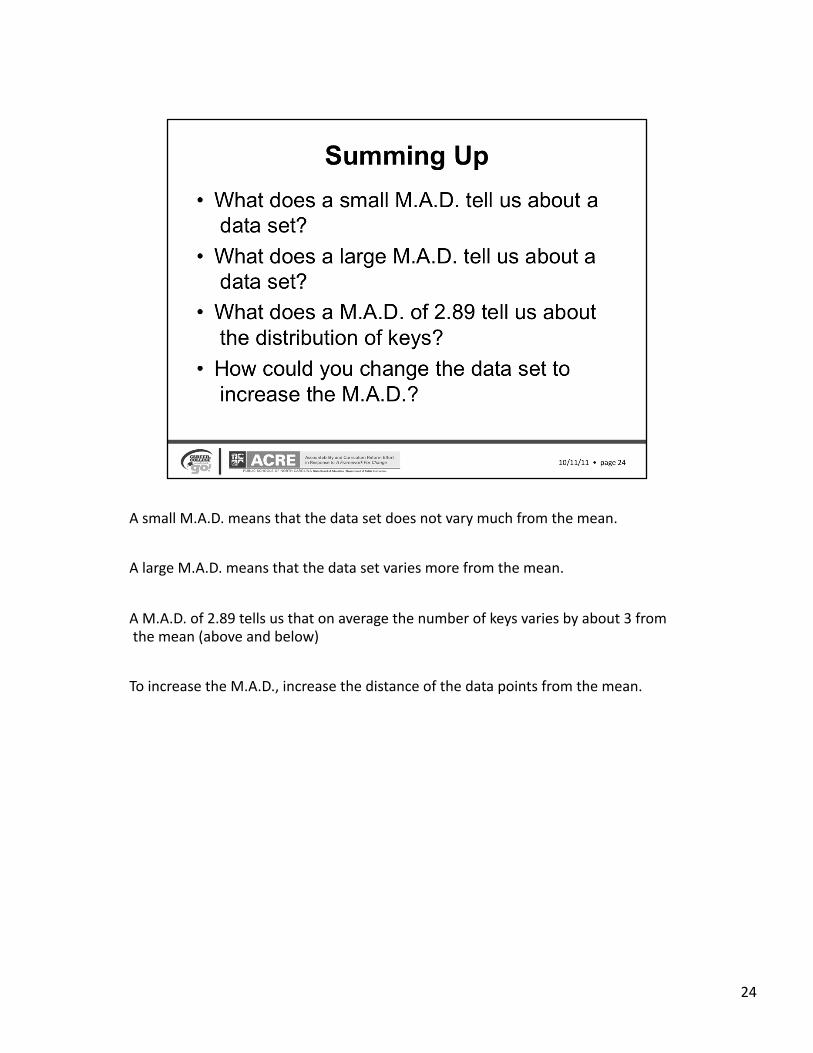
A small M.A.D. means that the data set does not vary much from the mean.
A large M.A.D. means that the data set varies more from the mean.
A M.A.D. of 2.89 tells us that on average the number of keys varies by about 3 from the mean (above and below)
To increase the M.A.D., increase the distance of the data points from the mean.
24

Olen, only a data set is given without any graphs. Using a table is another way to determine the M.A.D.
Would we expect this data set to have a large or small M.A.D. Why?
3, 7, 5, 13, 20, 23, 39, 23, 40, 23, 14, 12, 56, 23, 29
25
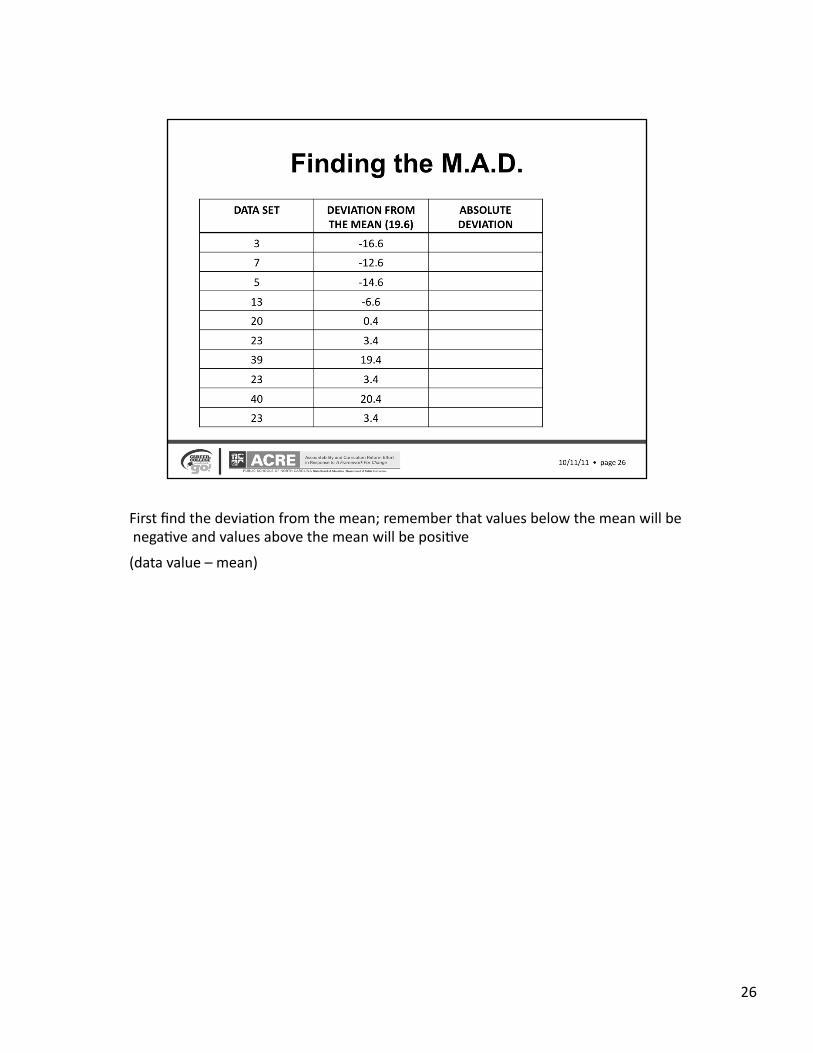
First find the devia5on from the mean; remember that values below the mean will be nega5ve and values above the mean will be posi5ve
(data value – mean)
26

Take the absolute value of the devia5ons, to determine the total distance of the data values from the mean.
Divide the total distance by the number of values (10 to get the M.A.D.
27

When we want something to balance we look for the center. The mean as a balancing point means that the data points are the same distance from the mean on each side.
28

These are the 6th grade standards that address the content we have looked at today.
29

These are the 6th grade standards that address the content we have looked at today.
30

The work con5nues in 7th grade as students use the understandings from 6th grade to compare two popula5ons. The wording of standard 7.SP.3 is somewhat confusing. Let’s take a look at what this is saying. The example given in CCSSM discusses the heights of basketball and soccer players. The average height of the soccer players is 10 cm. less that the average height of the basketball players. This standard is asking for this to be expressed as a mul5ple of a measure of variability.
This could be done with IQR and median; however, the following example is using mean and M.A.D.
31

In 7th grade students compare two data sets.
In this example, we have collected data to answer the ques5on: “Are basketball players taller, on average, than soccer players?”
This common Core standard is looking at the amount of varia5on in the sample data.
The mean for basketball players is 185; for soccer player is 175 – a difference of 10; however, the M.A.D. for each data set is 0,
If there is a small degree of varia5on in the data within each sample, then there will be more separa5on between the two data distribu5ons and the size of the difference between the sample means becomes more meaningful.
32

If there is a lot of varia5on in the data within each sample then there will be a lot of overlap between the two distribu5ons and the size of difference is less meaningful.
This is the example referred to in the standard. The difference between the means is 10 cm and the MAD is 5.3. So the difference in the means is about twice the MAD.
33

This 7th grade standard is basically asking for these three understandings.
34

Thank you.