Embed Size (px)
Citation preview
Linear Versus Exponential Storybook
Math I
Unit StoryTHE REASONING BEHIND THE FLOW
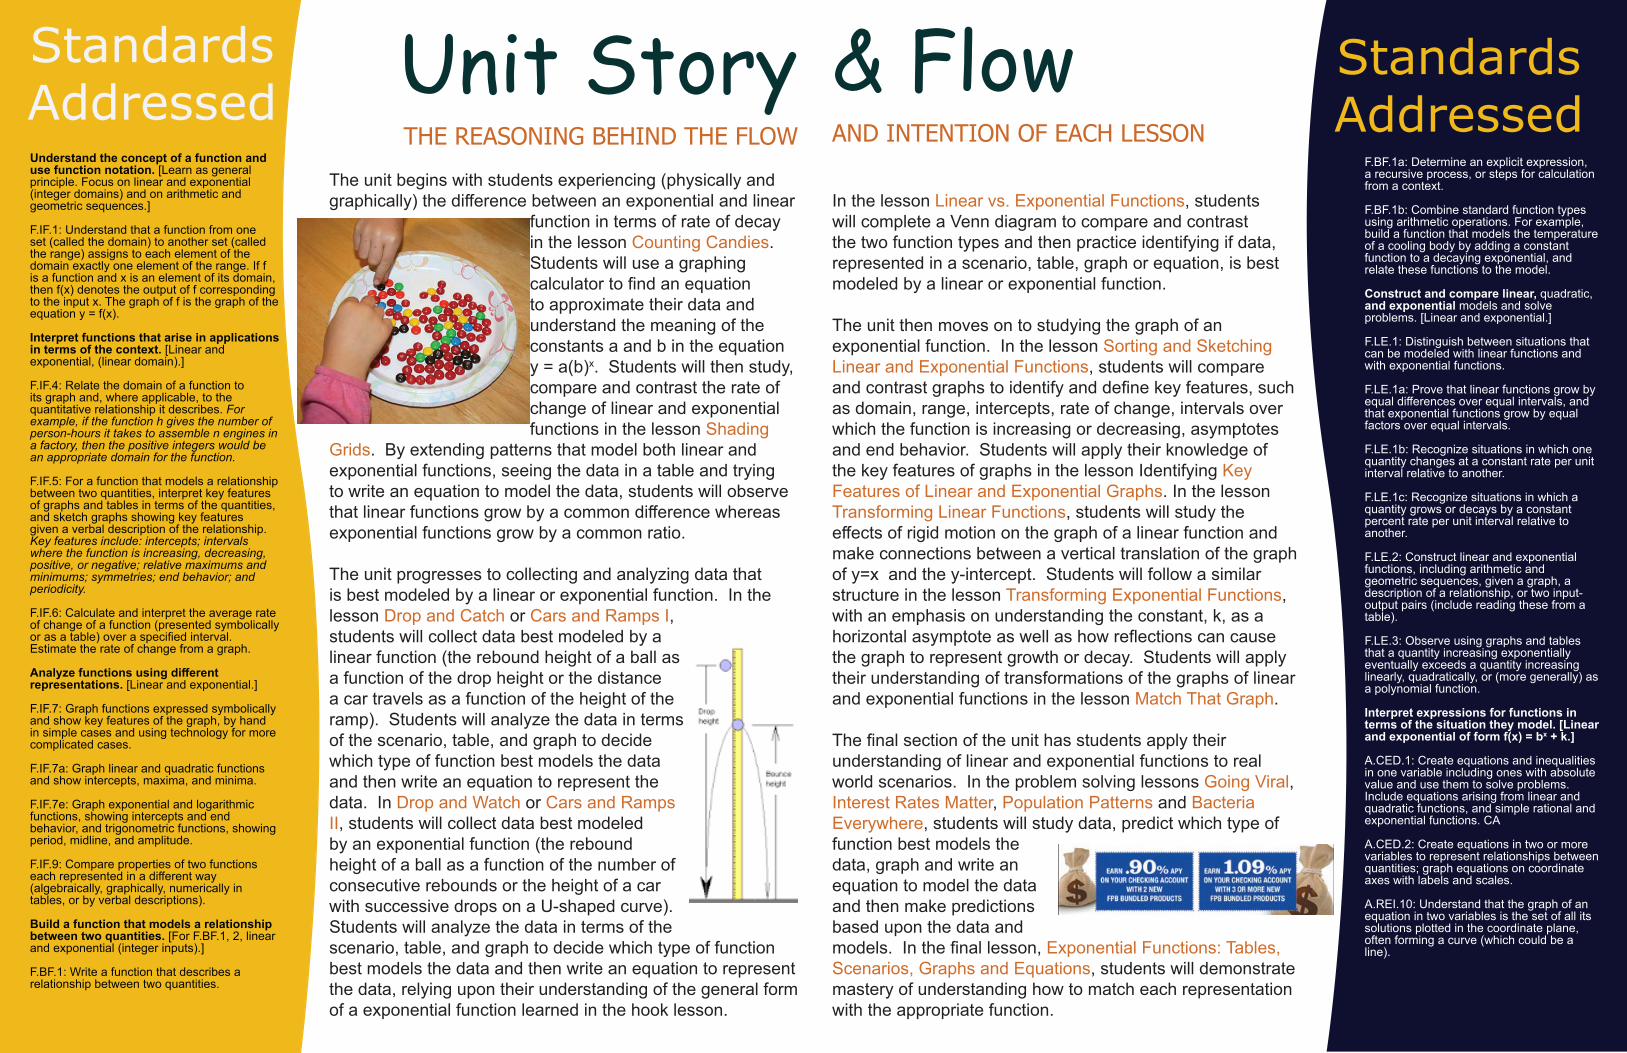
The unit begins with students experiencing (physically and graphically) the difference between an exponential and linear
function in terms of rate of decay in the lesson Counting Candies. Students will use a graphing calculator to find an equation to approximate their data and understand the meaning of the constants a and b in the equation y = a(b)x. Students will then study, compare and contrast the rate of change of linear and exponential functions in the lesson Shading
Grids. By extending patterns that model both linear and exponential functions, seeing the data in a table and trying to write an equation to model the data, students will observe that linear functions grow by a common difference whereas exponential functions grow by a common ratio.
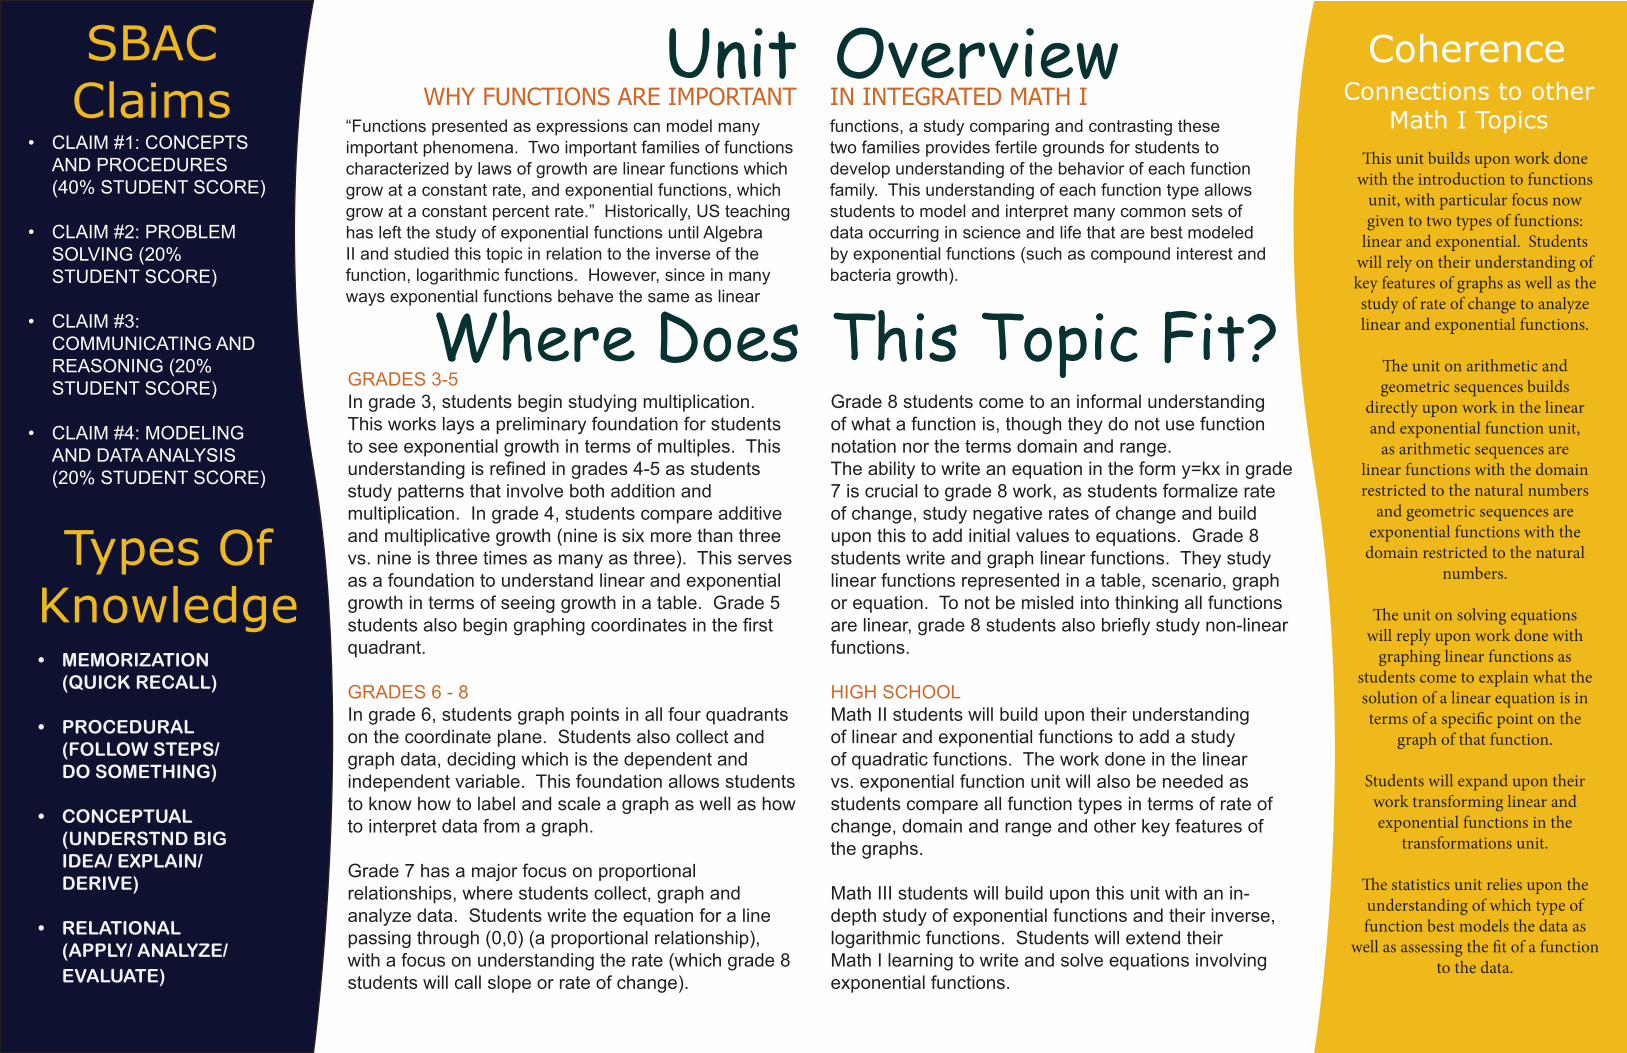
The unit progresses to collecting and analyzing data that is best modeled by a linear or exponential function. In the lesson Drop and Catch or Cars and Ramps I, students will collect data best modeled by a linear function (the rebound height of a ball as a function of the drop height or the distance a car travels as a function of the height of the ramp). Students will analyze the data in terms of the scenario, table, and graph to decide which type of function best models the data and then write an equation to represent the data. In Drop and Watch or Cars and Ramps II, students will collect data best modeled by an exponential function (the rebound height of a ball as a function of the number of consecutive rebounds or the height of a car with successive drops on a U-shaped curve). Students will analyze the data in terms of the scenario, table, and graph to decide which type of function best models the data and then write an equation to represent the data, relying upon their understanding of the general form of a exponential function learned in the hook lesson.
& FlowAND INTENTION OF EACH LESSON
In the lesson Linear vs. Exponential Functions, students will complete a Venn diagram to compare and contrast the two function types and then practice identifying if data, represented in a scenario, table, graph or equation, is best modeled by a linear or exponential function.
The unit then moves on to studying the graph of an exponential function. In the lesson Sorting and Sketching Linear and Exponential Functions, students will compare and contrast graphs to identify and define key features, such as domain, range, intercepts, rate of change, intervals over which the function is increasing or decreasing, asymptotes and end behavior. Students will apply their knowledge of the key features of graphs in the lesson Identifying Key Features of Linear and Exponential Graphs. In the lesson Transforming Linear Functions, students will study the effects of rigid motion on the graph of a linear function and make connections between a vertical translation of the graph of y=x and the y-intercept. Students will follow a similar structure in the lesson Transforming Exponential Functions, with an emphasis on understanding the constant, k, as a horizontal asymptote as well as how reflections can cause the graph to represent growth or decay. Students will apply their understanding of transformations of the graphs of linear and exponential functions in the lesson Match That Graph.
The final section of the unit has students apply their understanding of linear and exponential functions to real world scenarios. In the problem solving lessons Going Viral, Interest Rates Matter, Population Patterns and Bacteria Everywhere, students will study data, predict which type of function best models the data, graph and write an equation to model the data and then make predictions based upon the data and models. In the final lesson, Exponential Functions: Tables, Scenarios, Graphs and Equations, students will demonstrate mastery of understanding how to match each representation with the appropriate function.
Standards Addressed
F.BF.1a: Determine an explicit expression, a recursive process, or steps for calculation from a context.
F.BF.1b: Combine standard function types using arithmetic operations. For example, build a function that models the temperature of a cooling body by adding a constant function to a decaying exponential, and relate these functions to the model.
Construct and compare linear, quadratic, and exponential models and solve problems. [Linear and exponential.]
F.LE.1: Distinguish between situations that can be modeled with linear functions and with exponential functions.
F.LE.1a: Prove that linear functions grow by equal differences over equal intervals, and that exponential functions grow by equal factors over equal intervals.
F.LE.1b: Recognize situations in which one quantity changes at a constant rate per unit interval relative to another.
F.LE.1c: Recognize situations in which a quantity grows or decays by a constant percent rate per unit interval relative to another.
F.LE.2: Construct linear and exponential functions, including arithmetic and geometric sequences, given a graph, a description of a relationship, or two input-output pairs (include reading these from a table).
F.LE.3: Observe using graphs and tables that a quantity increasing exponentially eventually exceeds a quantity increasing linearly, quadratically, or (more generally) as a polynomial function.
Interpret expressions for functions in terms of the situation they model. [Linear and exponential of form f(x) = bx + k.]
A.CED.1: Create equations and inequalities in one variable including ones with absolute value and use them to solve problems. Include equations arising from linear and quadratic functions, and simple rational and exponential functions. CA
A.CED.2: Create equations in two or more variables to represent relationships between quantities; graph equations on coordinate axes with labels and scales.
A.REI.10: Understand that the graph of an equation in two variables is the set of all its solutions plotted in the coordinate plane, often forming a curve (which could be a line).
Standards AddressedUnderstand the concept of a function and use function notation. [Learn as general principle. Focus on linear and exponential (integer domains) and on arithmetic and geometric sequences.]
F.IF.1: Understand that a function from one set (called the domain) to another set (called the range) assigns to each element of the domain exactly one element of the range. If f is a function and x is an element of its domain, then f(x) denotes the output of f corresponding to the input x. The graph of f is the graph of the equation y = f(x).
Interpret functions that arise in applications in terms of the context. [Linear and exponential, (linear domain).]
F.IF.4: Relate the domain of a function to its graph and, where applicable, to the quantitative relationship it describes. For example, if the function h gives the number of person-hours it takes to assemble n engines in a factory, then the positive integers would be an appropriate domain for the function.
F.IF.5: For a function that models a relationship between two quantities, interpret key features of graphs and tables in terms of the quantities, and sketch graphs showing key features given a verbal description of the relationship. Key features include: intercepts; intervals where the function is increasing, decreasing, positive, or negative; relative maximums and minimums; symmetries; end behavior; and periodicity.
F.IF.6: Calculate and interpret the average rate of change of a function (presented symbolically or as a table) over a specified interval. Estimate the rate of change from a graph.
Analyze functions using different representations. [Linear and exponential.] F.IF.7: Graph functions expressed symbolically and show key features of the graph, by hand in simple cases and using technology for more complicated cases.
F.IF.7a: Graph linear and quadratic functions and show intercepts, maxima, and minima.
F.IF.7e: Graph exponential and logarithmic functions, showing intercepts and end behavior, and trigonometric functions, showing period, midline, and amplitude.
F.IF.9: Compare properties of two functions each represented in a different way (algebraically, graphically, numerically in tables, or by verbal descriptions).
Build a function that models a relationship between two quantities. [For F.BF.1, 2, linear and exponential (integer inputs).]
F.BF.1: Write a function that describes a relationship between two quantities.
UnitWHY FUNCTIONS ARE IMPORTANT
“Functions presented as expressions can model many important phenomena. Two important families of functions characterized by laws of growth are linear functions which grow at a constant rate, and exponential functions, which grow at a constant percent rate.” Historically, US teaching has left the study of exponential functions until Algebra II and studied this topic in relation to the inverse of the function, logarithmic functions. However, since in many ways exponential functions behave the same as linear
Where Does GRADES 3-5In grade 3, students begin studying multiplication. This works lays a preliminary foundation for students to see exponential growth in terms of multiples. This understanding is refined in grades 4-5 as students study patterns that involve both addition and multiplication. In grade 4, students compare additive and multiplicative growth (nine is six more than three vs. nine is three times as many as three). This serves as a foundation to understand linear and exponential growth in terms of seeing growth in a table. Grade 5 students also begin graphing coordinates in the first quadrant.
GRADES 6 - 8In grade 6, students graph points in all four quadrants on the coordinate plane. Students also collect and graph data, deciding which is the dependent and independent variable. This foundation allows students to know how to label and scale a graph as well as how to interpret data from a graph.
Grade 7 has a major focus on proportional relationships, where students collect, graph and analyze data. Students write the equation for a line passing through (0,0) (a proportional relationship), with a focus on understanding the rate (which grade 8 students will call slope or rate of change).
OverviewIN INTEGRATED MATH Ifunctions, a study comparing and contrasting these two families provides fertile grounds for students to develop understanding of the behavior of each function family. This understanding of each function type allows students to model and interpret many common sets of data occurring in science and life that are best modeled by exponential functions (such as compound interest and bacteria growth).
This Topic Fit?Grade 8 students come to an informal understanding of what a function is, though they do not use function notation nor the terms domain and range. The ability to write an equation in the form y=kx in grade 7 is crucial to grade 8 work, as students formalize rate of change, study negative rates of change and build upon this to add initial values to equations. Grade 8 students write and graph linear functions. They study linear functions represented in a table, scenario, graph or equation. To not be misled into thinking all functions are linear, grade 8 students also briefly study non-linear functions.
HIGH SCHOOLMath II students will build upon their understanding of linear and exponential functions to add a study of quadratic functions. The work done in the linear vs. exponential function unit will also be needed as students compare all function types in terms of rate of change, domain and range and other key features of the graphs.
Math III students will build upon this unit with an in-depth study of exponential functions and their inverse, logarithmic functions. Students will extend their Math I learning to write and solve equations involving exponential functions.
Types OfKnowledge• MEMORIZATION
(QUICK RECALL)
• PROCEDURAL (FOLLOW STEPS/ DO SOMETHING)
• CONCEPTUAL (UNDERSTND BIG IDEA/ EXPLAIN/ DERIVE)
• RELATIONAL (APPLY/ ANALYZE/EVALUATE)
SBACClaims
• CLAIM #1: CONCEPTS AND PROCEDURES (40% STUDENT SCORE)
• CLAIM #2: PROBLEM SOLVING (20% STUDENT SCORE)
• CLAIM #3: COMMUNICATING AND REASONING (20% STUDENT SCORE)
• CLAIM #4: MODELING AND DATA ANALYSIS (20% STUDENT SCORE)
CoherenceConnections to other
Math I TopicsThis unit builds upon work done
with the introduction to functions unit, with particular focus now given to two types of functions:
linear and exponential. Students will rely on their understanding of key features of graphs as well as the study of rate of change to analyze linear and exponential functions.
The unit on arithmetic and geometric sequences builds
directly upon work in the linear and exponential function unit,
as arithmetic sequences are linear functions with the domain restricted to the natural numbers
and geometric sequences are exponential functions with the
domain restricted to the natural numbers.
The unit on solving equations will reply upon work done with
graphing linear functions as students come to explain what the solution of a linear equation is in terms of a specific point on the
graph of that function.
Students will expand upon their work transforming linear and exponential functions in the
transformations unit.
The statistics unit relies upon the understanding of which type of function best models the data as
well as assessing the fit of a function to the data.
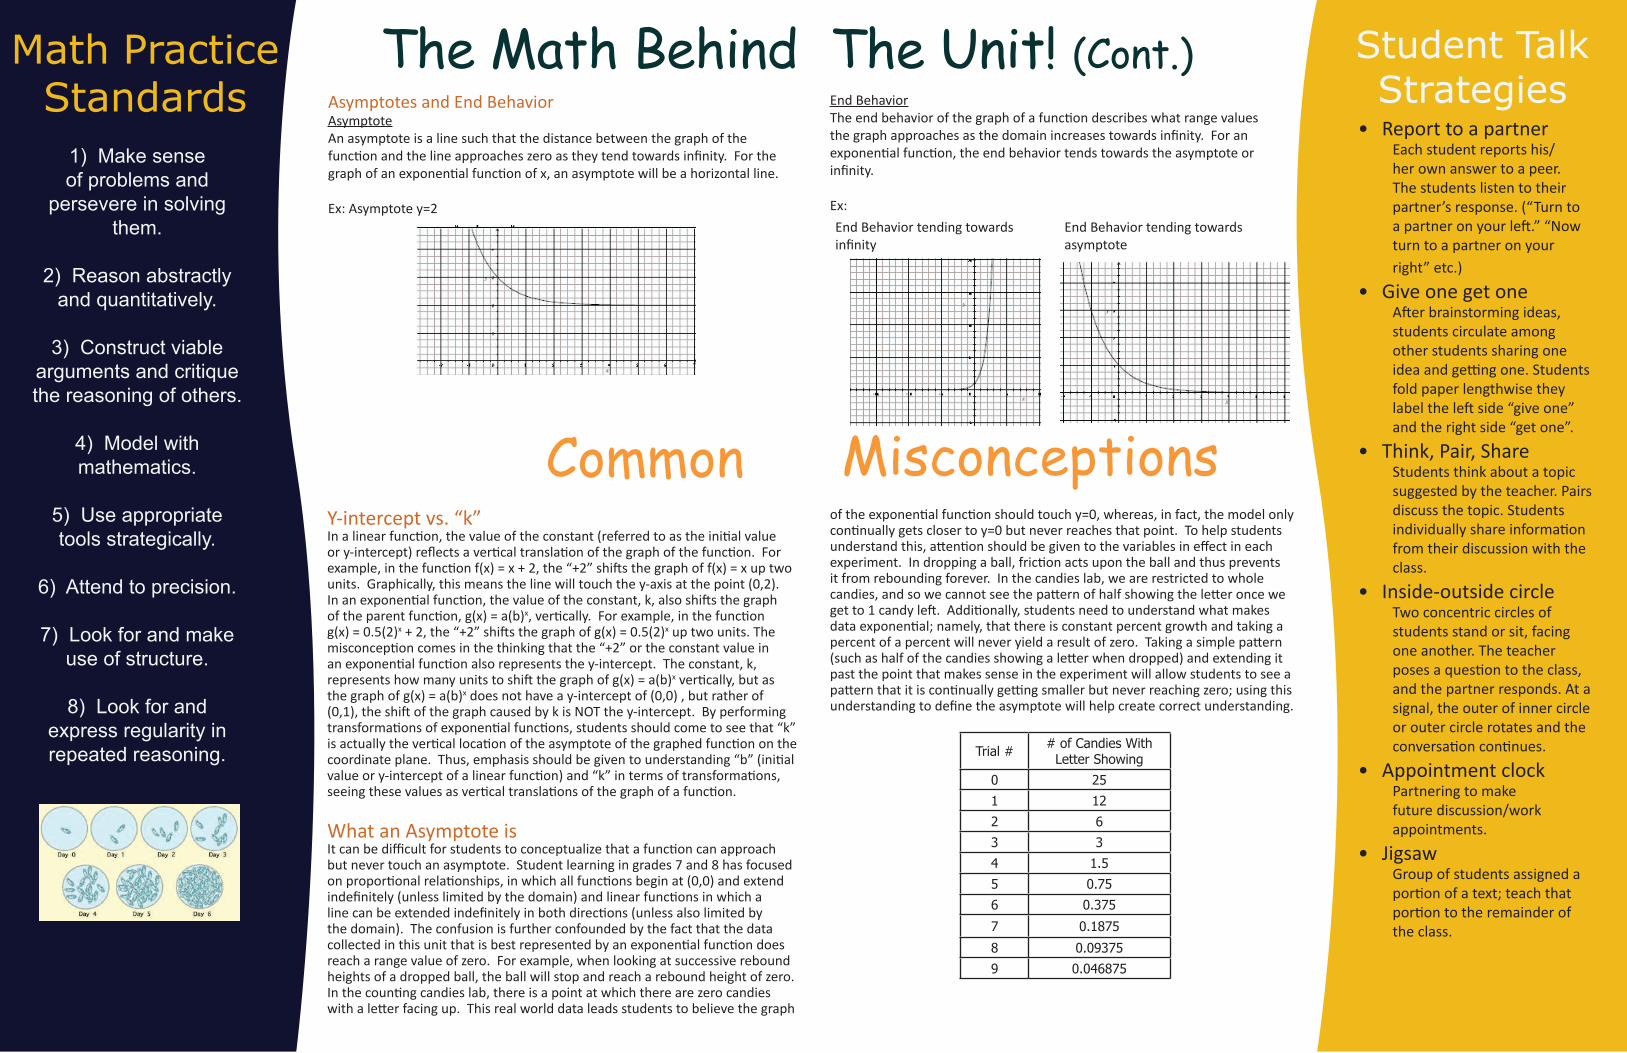
The Math Behind Linear and Exponential Growth (rate of change) seen in tables, equations, graphs and scenariosLinear data grows by equal differences over equal intervals whereas exponential data grows by equal factors over equal intervals. We say that linear functions are represented by common differences whereas exponential functions are represented by a common ratio. As the rate of change of an exponential function is increasing, the growth of an exponential function will eventually exceed that of a linear function.Tables:
Graphs:
Equations:f(x) = 3x f(x) = 3x
Scenario:$3 is deposited into an account every
week. How much money is in the bank each week?
$3 is deposited the first week and the amount deposited is tripled every
week. How much money is in the bank each week?
Transformations of the Graphs of Linear and Exponential FunctionsVertical TranslationsFor both linear and exponential functions, a vertical translation of the graph of the function moves it up or down. For linear functions, we represent this translation with the constant b in the general equation f(x) = mx + b. This vertical translation determines the point at which the graph of the function will cross the y-intercept.
For exponential functions, we represent this translation with the constant k in the general equation f(x) = a(b)x + k. This vertical translation determines the y-value of the asymptote.
Vertical Translation of the graph of a linear function
Vertical Translation of the graph of an exponential function
The Unit!ReflectionsWhen the graph of a linear or exponential function is reflected across the x-axis, the range values become the opposite. When the graph of a linear or exponential function is reflected across the y-axis, the domain values become the opposite.
Reflection of a linear function across x-axis
Reflection of a linear function across the y-axis
Reflection of an exponential function across the x-axis
Reflection of an exponential function across the y-axis
Essential Question # 1Do the data represent a linear or exponential
function?
Essential Question # 2How does transforming the graph of a linear or
exponential function effect the equations of those
functions?
Essential Question # 3What do the growth of linear and exponential
functions have in common and how are they
different?
Essential Question # 4Which function has a faster rate of change?
Essential Question # 5How do the pattern,
table, graph and equation relate?
AcademicLanguage
• Minimum• Maximum• Interval- increasing/
decreasing• Rate of change• Intercept• Function• Linear Function• Exponential Function• Domain• Range• Asymptote• Translation• Reflection• End Behavior
Real-World Application
• Bacteria or cell growth/decay• Population growth/patterns• Compound interest• Viral Marketing
The Math Behind The Unit! (Cont.)Asymptotes and End BehaviorAsymptoteAn asymptote is a line such that the distance between the graph of the function and the line approaches zero as they tend towards infinity. For the graph of an exponential function of x, an asymptote will be a horizontal line.
Ex: Asymptote y=2
End BehaviorThe end behavior of the graph of a function describes what range values the graph approaches as the domain increases towards infinity. For an exponential function, the end behavior tends towards the asymptote or infinity.
Ex:End Behavior tending towards infinity
End Behavior tending towards asymptote
Student Talk Strategies
Common MisconceptionsY-intercept vs. “k”In a linear function, the value of the constant (referred to as the initial value or y-intercept) reflects a vertical translation of the graph of the function. For example, in the function f(x) = x + 2, the “+2” shifts the graph of f(x) = x up two units. Graphically, this means the line will touch the y-axis at the point (0,2).In an exponential function, the value of the constant, k, also shifts the graph of the parent function, g(x) = a(b)x, vertically. For example, in the function g(x) = 0.5(2)x + 2, the “+2” shifts the graph of g(x) = 0.5(2)x up two units. The misconception comes in the thinking that the “+2” or the constant value in an exponential function also represents the y-intercept. The constant, k, represents how many units to shift the graph of g(x) = a(b)x vertically, but as the graph of g(x) = a(b)x does not have a y-intercept of (0,0) , but rather of (0,1), the shift of the graph caused by k is NOT the y-intercept. By performing transformations of exponential functions, students should come to see that “k” is actually the vertical location of the asymptote of the graphed function on the coordinate plane. Thus, emphasis should be given to understanding “b” (initial value or y-intercept of a linear function) and “k” in terms of transformations, seeing these values as vertical translations of the graph of a function.
What an Asymptote isIt can be difficult for students to conceptualize that a function can approach but never touch an asymptote. Student learning in grades 7 and 8 has focused on proportional relationships, in which all functions begin at (0,0) and extend indefinitely (unless limited by the domain) and linear functions in which a line can be extended indefinitely in both directions (unless also limited by the domain). The confusion is further confounded by the fact that the data collected in this unit that is best represented by an exponential function does reach a range value of zero. For example, when looking at successive rebound heights of a dropped ball, the ball will stop and reach a rebound height of zero. In the counting candies lab, there is a point at which there are zero candies with a letter facing up. This real world data leads students to believe the graph
of the exponential function should touch y=0, whereas, in fact, the model only continually gets closer to y=0 but never reaches that point. To help students understand this, attention should be given to the variables in effect in each experiment. In dropping a ball, friction acts upon the ball and thus prevents it from rebounding forever. In the candies lab, we are restricted to whole candies, and so we cannot see the pattern of half showing the letter once we get to 1 candy left. Additionally, students need to understand what makes data exponential; namely, that there is constant percent growth and taking a percent of a percent will never yield a result of zero. Taking a simple pattern (such as half of the candies showing a letter when dropped) and extending it past the point that makes sense in the experiment will allow students to see a pattern that it is continually getting smaller but never reaching zero; using this understanding to define the asymptote will help create correct understanding.
Trial # # of Candies With Letter Showing
0 251 122 63 34 1.55 0.756 0.3757 0.18758 0.093759 0.046875
1) Make sense of problems and
persevere in solving them.
2) Reason abstractly and quantitatively.
3) Construct viable arguments and critique the reasoning of others.
4) Model with mathematics.
5) Use appropriate tools strategically.
6) Attend to precision.
7) Look for and make use of structure.
8) Look for and express regularity in repeated reasoning.
Math Practice Standards
• Report to a partnerEach student reports his/her own answer to a peer. The students listen to their partner’s response. (“Turn to a partner on your left.” “Now turn to a partner on your right” etc.)
• Give one get oneAfter brainstorming ideas, students circulate among other students sharing one idea and getting one. Students fold paper lengthwise they label the left side “give one” and the right side “get one”.
• Think, Pair, ShareStudents think about a topic suggested by the teacher. Pairs discuss the topic. Students individually share information from their discussion with the class.
• Inside-outside circleTwo concentric circles of students stand or sit, facing one another. The teacher poses a question to the class, and the partner responds. At a signal, the outer of inner circle or outer circle rotates and the conversation continues.
• Appointment clockPartnering to make future discussion/work appointments.
• JigsawGroup of students assigned a portion of a text; teach that portion to the remainder of the class.
Formative Assessment
Tips ForLesson Planning
#1 Always work through the activity/lesson before doing the lesson with the class.
#2 Know how far into the activity you want to be at the end of the period and understand your main objective for the day. What is it that you want the students to walk away with as they leave class?
#3 Decide where and how you want to “chunk the activity”. How much of the activity will groups/students do before sharing out with the class? How will you have them report out?
#4 Set time limits for the “chunks” and use a timer. This helps keep you and the students focused, on task, and moving forward through the lesson.
#5 Decide which pieces of the activities are the most vital to discuss or have students present to the class. Not everything in every activity needs to be shared out as a class.
#6 Use tools strategically and intentionally. Plan ahead for when you are going to the document camera, white boards, have students make posters, etc.
#7 Know what materials you need for the lesson and have them ready to go before class. Setup a station for commonly used materials like colored pencils, rulers, etc.
#8 Anticipate where students might struggle, have difficulties, or misconceptions within the lesson. Pre-plan good questions that will help them to continue to move forward
#9 Intentionally and continuously use formative assessment. Find out what your student understand before during and after an activity. Use that information to help guide your lessons and lesson planning.
Big Idea #1: Do the data represent a linear or exponential function?• Use lesson Linear vs. Exponential Function to have
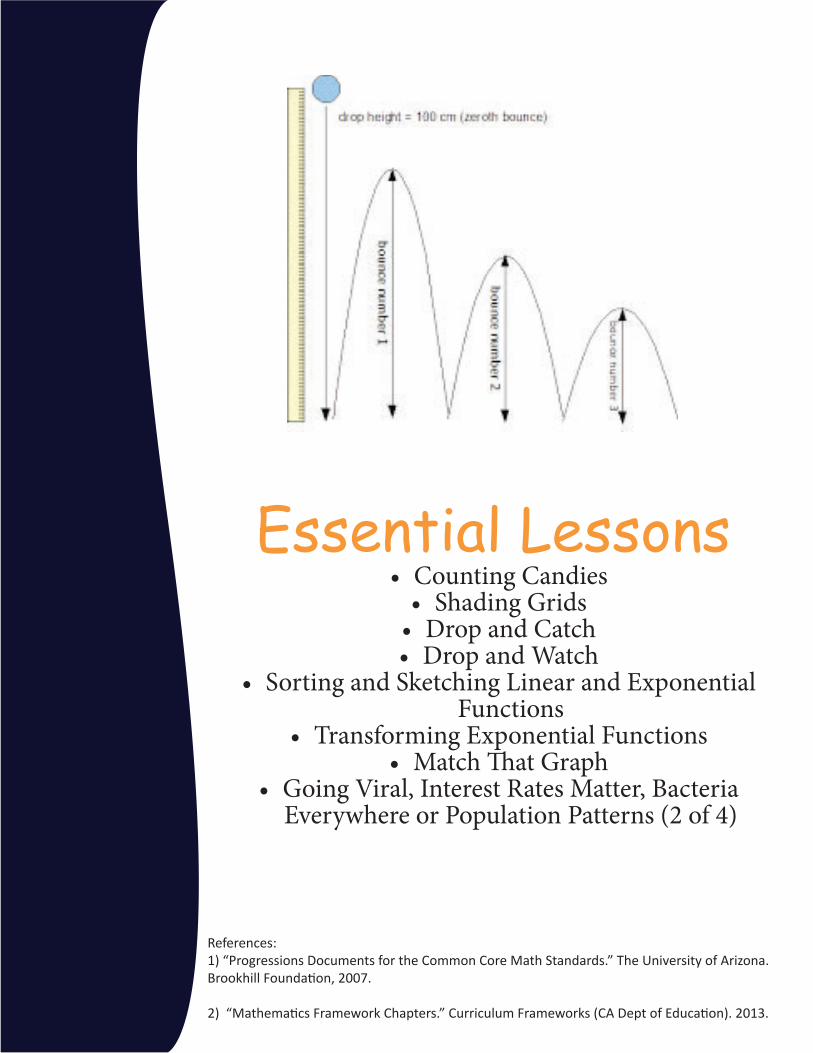
students decide if data is best modeled by a linear or exponential function. As alternate points of assessment, have students explain why any set of data is best modeled by a linear or exponential function (Drop and Catch, Drop and Watch, Cars and Ramps, Bacteria Everywhere, Population Patterns)
Big Idea #2: How does transforming the graph of a linear or exponential function effect change the function?• Use lesson Transforming Exponential Functions to have
students summarize the effect of a transformation on the graph of an exponential function. Use lesson Transforming Linear Functions to have students summarize the effect of a transformation on the graph of a linear function. Use lesson Match That Graph as formative assessment of both ideas.
Big Idea #3: What do the growth of linear and exponential functions have in common and how are they different?• Initially, use lesson Shading Grids to have students
compare and contrast the two function types. Then use lesson Linear vs. Exponential Function to have students compare and contrast in a Venn diagram.
Big Idea #4: Which function has a faster rate of change?• Use lesson Counting Candies to have students answer
the questions asking them to compare the rate of change linear and exponential function.
Big Idea #5: How do the pattern, table, graph and equation relate?• Use lesson Exponential Functions: Tables, Scenarios,
Graphs and Equations, to have students demonstrate understanding of all four representations of the same function.
General Strategies
For Formative Assessments
Use the following strategies throughout
the unit
Thumbs up/down/sideways
Ask students to rate their understanding. A thumbs up
means they understand the topic, thumbs down means they don’t
and in the middle means they get part of it but still need additional
support.
Mini White BoardsCan be used in a variety of
ways. Suggestion: Give students problems to solve on white
boards and have them raise their boards to show you their answer.
Writing a Summary Statement
Ask students to write a summary of the day’s/week’s lesson.
Fist to FiveSimilar to thumbs up/down,
students rate their understanding on a scale of zero (fist) to 5, with
5 being fully understand.
Ticket Out The Door (Exit Ticket)
In the last couple minutes of class, give students a problem or two to complete on a slip of paper. Collect the paper as
students are leaving the class.
Sentence Frames & Starters
Here are some options to provide to students
throughout the activities.
• I agree with _______ because _______.
• I disagree with _______ because _______.
• I did not understand _______________.
• I prefer _______method/strategy because
_______.
• I think that _______.
• What do you mean by _______?
• I think _______ means _____________.
Essential Lessons• Counting Candies
• Shading Grids• Drop and Catch• Drop and Watch
• Sorting and Sketching Linear and Exponential Functions
• Transforming Exponential Functions• Match That Graph
• Going Viral, Interest Rates Matter, Bacteria Everywhere or Population Patterns (2 of 4)
References:1) “Progressions Documents for the Common Core Math Standards.” The University of Arizona. Brookhill Foundation, 2007.
2) “Mathematics Framework Chapters.” Curriculum Frameworks (CA Dept of Education). 2013.