Embed Size (px)
Citation preview
Math 140Lecture 17
University of Massachusetts Boston
Spring 2017
FreeCalc Math 140 Lecture 17 Spring 2017
Outline
1 Derivatives and the Shapes of CurvesWhat Does f ′ Say About f?What Does f ′′ Say About f?
2 Curve sketchingCurve sketching summary
FreeCalc Math 140 Lecture 17 Spring 2017
License to use and redistribute
These lecture slides and their LATEX source code are licensed to youunder the Creative Commons license CC BY 3.0. You are free
to Share - to copy, distribute and transmit the work,to Remix - to adapt, change, etc., the work,to make commercial use of the work,
as long as you reasonably acknowledge the original project.Latest version of the .tex sources of the slides: https://sourceforge.net/p/freecalculus/code/HEAD/tree/
Should the link be outdated/moved, search for “freecalc project”.Creative Commons license CC BY 3.0:https://creativecommons.org/licenses/by/3.0/us/and the links therein.
FreeCalc Math 140 Lecture 17 Spring 2017
Derivatives and the Shapes of Curves What Does f ′ Say About f?
What Does f ′ Say About f?
x
y
c
f ′(x) > 0 f ′(x) < 0
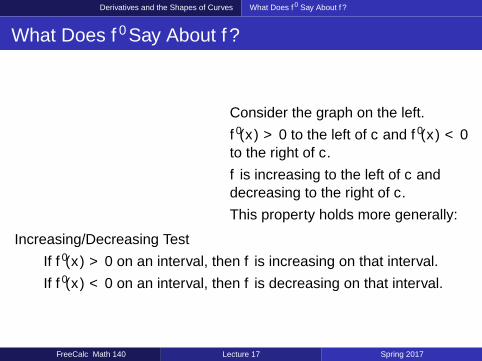
Consider the graph on the left.f ′(x) > 0 to the left of c and f ′(x) < 0to the right of c.f is increasing to the left of c anddecreasing to the right of c.This property holds more generally:
Increasing/Decreasing Test1 If f ′(x) > 0 on an interval, then f is increasing on that interval.2 If f ′(x) < 0 on an interval, then f is decreasing on that interval.
FreeCalc Math 140 Lecture 17 Spring 2017
Derivatives and the Shapes of Curves What Does f ′ Say About f?
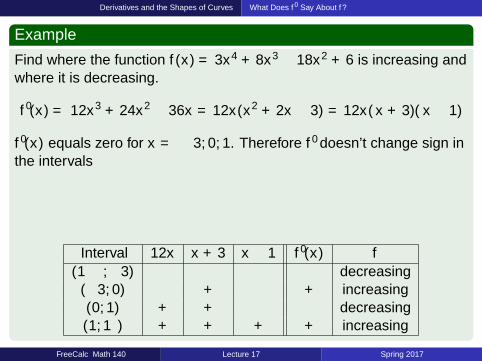
Example
Find where the function f (x) = 3x4 + 8x3 − 18x2 + 6 is increasing andwhere it is decreasing.
f ′(x) =
?
12x3 + 24x2 − 36x = 12x(x2 + 2x − 3) = 12x(
?
x + 3)(
?
x − 1)
f ′(x) equals zero for x = − 3,0,1. Therefore f ′ doesn’t change sign inthe intervals
(−∞,−3) (−3, 0) (0, 1) (1,∞)
− 3 0 1
ց ր ց ր
Interval 12x x + 3 x − 1 f ′(x) f(−∞,−3)
?
−
?
−
?
−
?
− decreasing(−3,0)
?
−
?
+
?
−
?
+ increasing(0,1)
?
+
?
+
?
−
?
− decreasing(1,∞)
?
+
?
+
?
+
?
+ increasing
FreeCalc Math 140 Lecture 17 Spring 2017
Derivatives and the Shapes of Curves What Does f ′ Say About f?
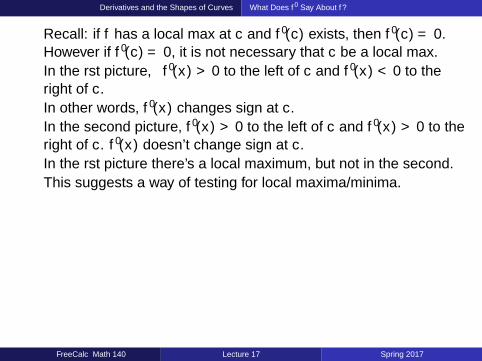
Recall: if f has a local max at c and f ′(c) exists, then f ′(c) = 0.However if f ′(c) = 0, it is not necessary that c be a local max.In the first picture, f ′(x) > 0 to the left of c and f ′(x) < 0 to theright of c.In other words, f ′(x) changes sign at c.In the second picture, f ′(x) > 0 to the left of c and f ′(x) > 0 to theright of c. f ′(x) doesn’t change sign at c.In the first picture there’s a local maximum, but not in the second.This suggests a way of testing for local maxima/minima.
x
y
c
f ′(x) > 0 f ′(x) < 0
x
y
c
f ′(x) > 0 f ′(x) > 0
FreeCalc Math 140 Lecture 17 Spring 2017
Derivatives and the Shapes of Curves What Does f ′ Say About f?
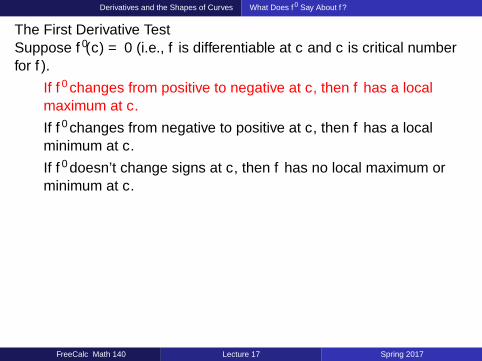
The First Derivative TestSuppose f ′(c) = 0 (i.e., f is differentiable at c and c is critical numberfor f ).
1 If f ′ changes from positive to negative at c, then f has a localmaximum at c.
2 If f ′ changes from negative to positive at c, then f has a localminimum at c.
3 If f ′ doesn’t change signs at c, then f has no local maximum orminimum at c.
x
y
c
f ′(x) > 0 f ′(x) < 0
x
y
c
f ′(x) < 0 f ′(x) < 0
FreeCalc Math 140 Lecture 17 Spring 2017

Derivatives and the Shapes of Curves What Does f ′ Say About f?
The First Derivative TestSuppose f ′(c) = 0 (i.e., f is differentiable at c and c is critical numberfor f ).
1 If f ′ changes from positive to negative at c, then f has a localmaximum at c.
2 If f ′ changes from negative to positive at c, then f has a localminimum at c.
3 If f ′ doesn’t change signs at c, then f has no local maximum orminimum at c.
x
y
c
f ′(x) < 0 f ′(x) > 0
x
y
c
f ′(x) < 0 f ′(x) < 0
FreeCalc Math 140 Lecture 17 Spring 2017
Derivatives and the Shapes of Curves What Does f ′ Say About f?
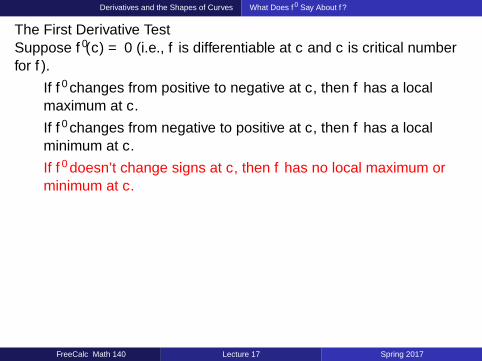
The First Derivative TestSuppose f ′(c) = 0 (i.e., f is differentiable at c and c is critical numberfor f ).
1 If f ′ changes from positive to negative at c, then f has a localmaximum at c.
2 If f ′ changes from negative to positive at c, then f has a localminimum at c.
3 If f ′ doesn’t change signs at c, then f has no local maximum orminimum at c.
x
y
c
f ′(x) > 0 f ′(x) > 0
x
y
c
f ′(x) < 0 f ′(x) < 0
FreeCalc Math 140 Lecture 17 Spring 2017
Derivatives and the Shapes of Curves What Does f ′′ Say About f?
What Does f ′′ Say About f?
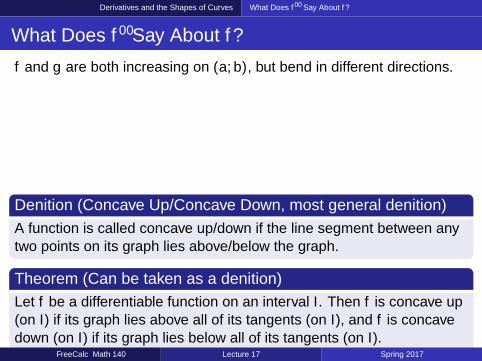
f and g are both increasing on (a,b), but “bend” in different directions.
y = f (x)
a bConcave up
y = g(x)
a bConcave down
Definition (Concave Up/Concave Down, most general definition)A function is called concave up/down if the line segment between anytwo points on its graph lies above/below the graph.
Theorem (Can be taken as a definition)Let f be a differentiable function on an interval I. Then f is concave up(on I) if its graph lies above all of its tangents (on I), and f is concavedown (on I) if its graph lies below all of its tangents (on I).
FreeCalc Math 140 Lecture 17 Spring 2017
Derivatives and the Shapes of Curves What Does f ′′ Say About f?
y = f (x)
y = g(x)
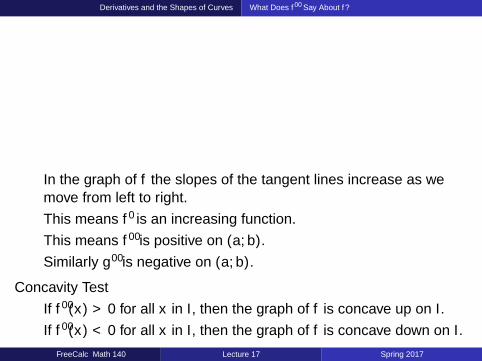
In the graph of f the slopes of the tangent lines increase as wemove from left to right.This means f ′ is an increasing function.This means f ′′ is positive on (a,b).Similarly g′′ is negative on (a,b).
Concavity Test1 If f ′′(x) > 0 for all x in I, then the graph of f is concave up on I.2 If f ′′(x) < 0 for all x in I, then the graph of f is concave down on I.
FreeCalc Math 140 Lecture 17 Spring 2017
Derivatives and the Shapes of Curves What Does f ′′ Say About f?
Definition (Inflection Point)A point P = (x , f (x)) on a curve y = f (x) is called an inflection point if
f ′′(x) existsthe graph of f changes from concave up to concave down or fromconcave down to concave up at P.
In other words P = (x , f (x)) is an inflection point if f ′′ exists andchanges signs at x .
FreeCalc Math 140 Lecture 17 Spring 2017
Derivatives and the Shapes of Curves What Does f ′′ Say About f?
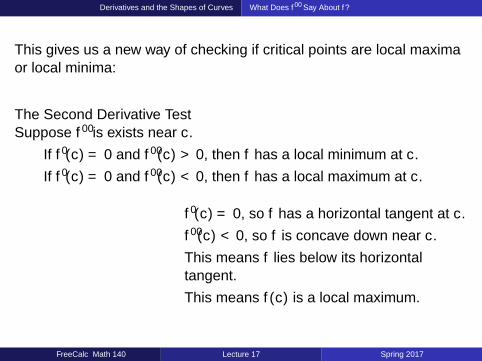
This gives us a new way of checking if critical points are local maximaor local minima:
The Second Derivative TestSuppose f ′′ is exists near c.
1 If f ′(c) = 0 and f ′′(c) > 0, then f has a local minimum at c.2 If f ′(c) = 0 and f ′′(c) < 0, then f has a local maximum at c.
x
y
c
f ′(c) = 0, so f has a horizontal tangent at c.f ′′(c) < 0, so f is concave down near c.This means f lies below its horizontaltangent.This means f (c) is a local maximum.
FreeCalc Math 140 Lecture 17 Spring 2017
Curve sketching
Example
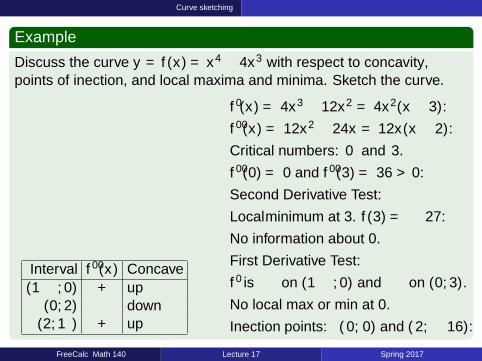
Discuss the curve y = f (x) = x4 − 4x3 with respect to concavity,points of inflection, and local maxima and minima. Sketch the curve.
x
y
−10
−20
−30
1 2 3
y = x4 − 4x3
(3, − 27)
(0, 0)
(2,−16)
Interval f ′′(x) Concave(−∞,0)
?
+ up(0,2)
?
− down(2,∞)
?
+ up
f ′(x) =
?
4x3 − 12x2 =
?
4x2(x − 3).f ′′(x) =
?
12x2 − 24x =
?
12x(x − 2).Critical numbers:
?
0 and
?
3.f ′′(0) =
?
0 and f ′′(3) =
?
36 > 0.Second Derivative Test:Local
?
minimum at 3. f (3) =
?
− 27.No information about 0.First Derivative Test:f ′ is
?
− on (−∞,0) and
?
− on (0,3).No local max or min at 0.Inflection points: (
?
0,
?
0) and (
?
2,
?
−16).
FreeCalc Math 140 Lecture 17 Spring 2017
Curve sketching
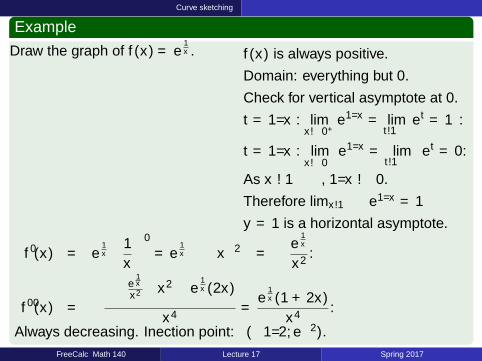
ExampleDraw the graph of f (x) = e
1x .
x
y
1−1
y = e1x
y = 1
f (x) is always positive.Domain: everything but 0.Check for vertical asymptote at 0.t = 1/x : lim
x→0+e1/x = lim
t→∞et =∞.
t = 1/x : limx→0−
e1/x = limt→−∞
et = 0.
As x → ±∞, 1/x → 0.Therefore limx→±∞ e1/x = 1y = 1 is a horizontal asymptote.
f ′(x) = e1x
(1x
)′= e
1x
(
?
− x−2)
= − e1x
x2 .
f ′′(x) = −
(−e
1x
x2
)x2 − e
1x (2x)
x4 =e
1x (1 + 2x)
x4 .
Always decreasing. Inflection point: (−1/2,e−2).FreeCalc Math 140 Lecture 17 Spring 2017
Curve sketching Curve sketching summary
Guidelines for Sketching a Curve
The following items are to be considered when drawing a curve. Notevery item is relevant to every function.
1 Determine the domain of the function.2 Depending on availability, use computer software to plot.3 Compute x , y intercepts.4 Determine symmetries, periodicity.5 Compute asymptotes - vertical, horizontal, optional - slanted.6 Compute intervals of increase or decrease.7 Compute local and global maxima and minima.8 Compute concavity and points of inflection.
FreeCalc Math 140 Lecture 17 Spring 2017
Curve sketching Curve sketching summary
1 DomainFind the domain of the function.Remember the two restrictions: no dividing by 0, and no taking theeven root of a negative number.
2 You can use computer software to plot your function.Most computer software will ask you to specify the domain of thefunction explicitly.Some software may be able to determine the (implied) domain ofyour function.Software may not be always available (example: Calculus I exams).
FreeCalc Math 140 Lecture 17 Spring 2017
Curve sketching Curve sketching summary
3 Intercepts
Find the intercepts of the function.f (0) is the y -intercept.To find the x-intercepts, set y = 0 and solve for x .You can sometimes skip this step if the equation is too difficult tosolve.
FreeCalc Math 140 Lecture 17 Spring 2017
Curve sketching Curve sketching summary
4 Symmetry, Periodicity
If f (−x) = f (x) for all x , then f is even.If f (−x) = −f (x) for all x , then f is odd.If there is some number p such that f (a + p) = f (a) for all a, then fis called periodic. The smallest such p is called its period.
x
y
−1 1
(−1.5, f (1.5)) (1.5, f (1.5))
(−1, f (1)) (1, f (1))
FreeCalc Math 140 Lecture 17 Spring 2017
Curve sketching Curve sketching summary
4 Symmetry, Periodicity
If f (−x) = f (x) for all x , then f is even.If f (−x) = −f (x) for all x , then f is odd.If there is some number p such that f (a + p) = f (a) for all a, then fis called periodic. The smallest such p is called its period.
x
y
1−1
(1, f (1))
(−1,−f (1))
y = f (x)
FreeCalc Math 140 Lecture 17 Spring 2017
Curve sketching Curve sketching summary
4 Symmetry, Periodicity
If f (−x) = f (x) for all x , then f is even.If f (−x) = −f (x) for all x , then f is odd.If there is some number p such that f (a + p) = f (a) for all a, then fis called periodic. The smallest such p is called its period.
x
y
a + p a + 2paa − p
FreeCalc Math 140 Lecture 17 Spring 2017
Curve sketching Curve sketching summary
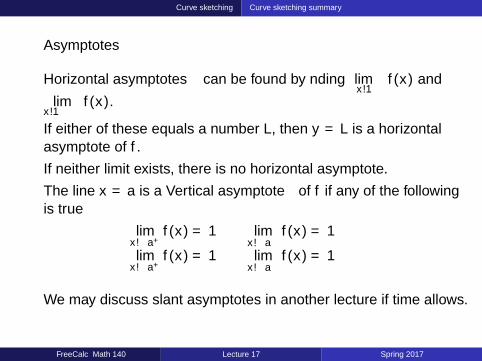
5 Asymptotes
Horizontal asymptotes can be found by finding limx→∞
f (x) andlim
x→−∞f (x).
If either of these equals a number L, then y = L is a horizontalasymptote of f .If neither limit exists, there is no horizontal asymptote.The line x = a is a Vertical asymptote of f if any of the followingis true
limx→a+
f (x) =∞ limx→a−
f (x) =∞lim
x→a+f (x) = −∞ lim
x→a−f (x) = −∞
We may discuss slant asymptotes in another lecture if time allows.
FreeCalc Math 140 Lecture 17 Spring 2017

Curve sketching Curve sketching summary
6 Intervals of increase or decrease
To find intervals of increase or decrease, use theincreasing/decreasing test.Compute f ′.Find where f ′ is positive or negative.Where f ′ is positive, f is increasing.Where f ′ is negative, f is decreasing.
FreeCalc Math 140 Lecture 17 Spring 2017
Curve sketching Curve sketching summary
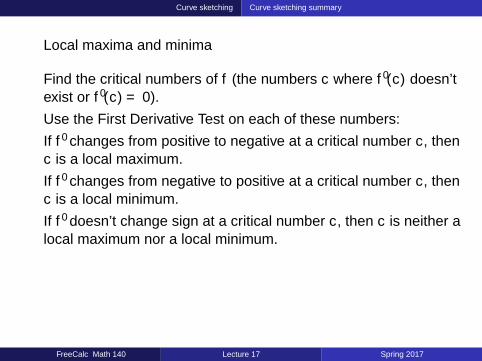
7 Local maxima and minima
Find the critical numbers of f (the numbers c where f ′(c) doesn’texist or f ′(c) = 0).Use the First Derivative Test on each of these numbers:If f ′ changes from positive to negative at a critical number c, thenc is a local maximum.If f ′ changes from negative to positive at a critical number c, thenc is a local minimum.If f ′ doesn’t change sign at a critical number c, then c is neither alocal maximum nor a local minimum.
FreeCalc Math 140 Lecture 17 Spring 2017
Curve sketching Curve sketching summary
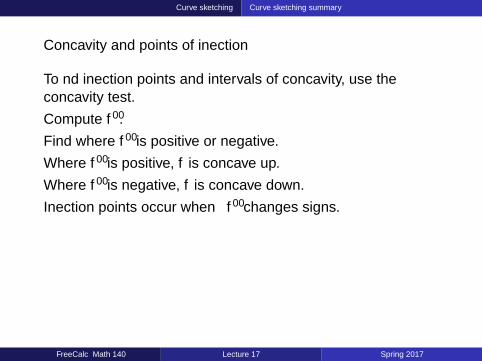
8 Concavity and points of inflection
To find inflection points and intervals of concavity, use theconcavity test.Compute f ′′.Find where f ′′ is positive or negative.Where f ′′ is positive, f is concave up.Where f ′′ is negative, f is concave down.Inflection points occur when f ′′ changes signs.
FreeCalc Math 140 Lecture 17 Spring 2017
Curve sketching Curve sketching summary
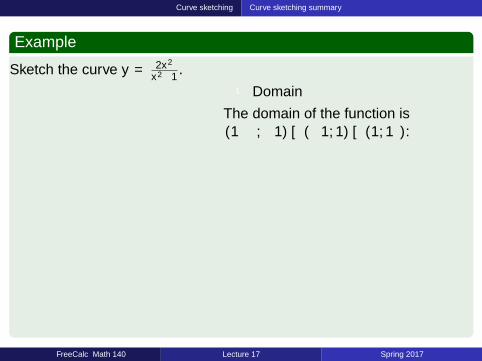
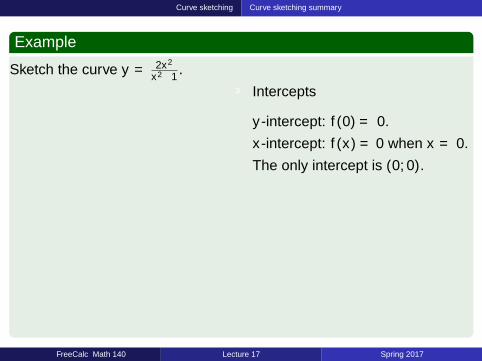
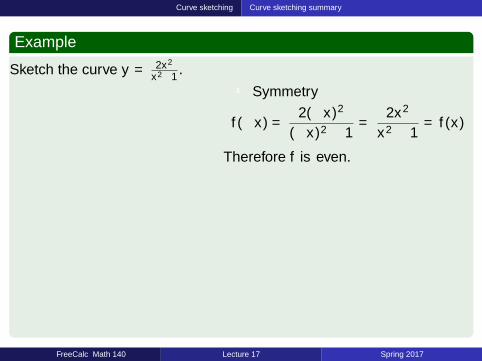
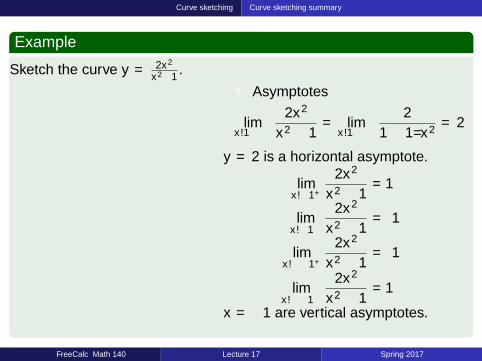
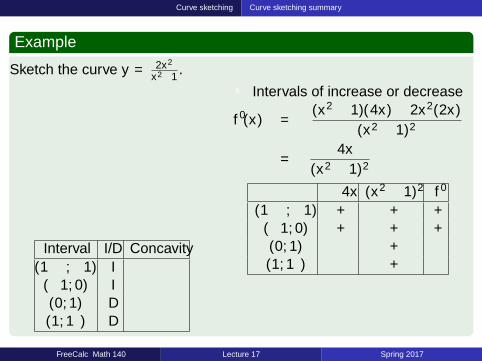
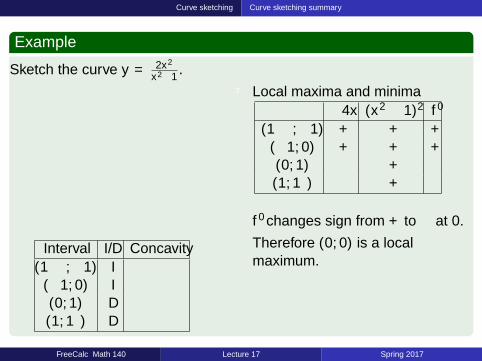
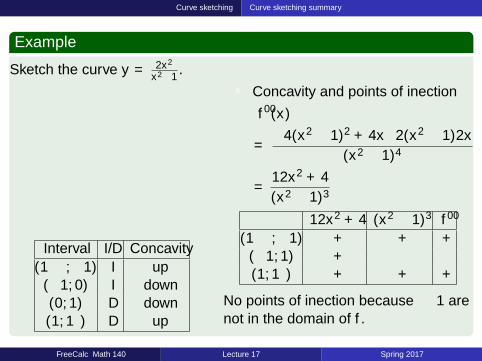
Example
Sketch the curve y = 2x2
x2−1 .
x
y
1−1
2
Interval I/D Concavity(−∞,−1) I(−1,0) D(0,1) D(1,∞) I
1 DomainThe domain of the function is
?
(−∞,−1) ∪ (−1,1) ∪ (1,∞).
FreeCalc Math 140 Lecture 17 Spring 2017
Curve sketching Curve sketching summary
Example
Sketch the curve y = 2x2
x2−1 .
x
y
1−1
2
Interval I/D Concavity(−∞,−1) I(−1,0) D(0,1) D(1,∞) I
3 Intercepts
y -intercept: f (0) =
?
0.x-intercept: f (x) = 0 when x =
?
0.The only intercept is (0,0).
FreeCalc Math 140 Lecture 17 Spring 2017
Curve sketching Curve sketching summary
Example
Sketch the curve y = 2x2
x2−1 .
x
y
1−1
2
Interval I/D Concavity(−∞,−1) I(−1,0) D(0,1) D(1,∞) I
4 Symmetry
f (−x) =2(−x)2
(−x)2 − 1=
?
2x2
x2 − 1= f (x)
Therefore f is
?
even.
FreeCalc Math 140 Lecture 17 Spring 2017
Curve sketching Curve sketching summary
Example
Sketch the curve y = 2x2
x2−1 .
x
y
1−1
2y = 2
x = −1 x = 1
Interval I/D Concavity(−∞,−1) I(−1,0) D(0,1) D(1,∞) I
5 Asymptotes
limx→±∞
2x2
x2 − 1= lim
x→±∞
21− 1/x2 = 2
y = 2 is a horizontal asymptote.
limx→1+
2x2
x2 − 1=
?
∞
limx→1−
2x2
x2 − 1=
?
−∞
limx→−1+
2x2
x2 − 1=
?
−∞
limx→−1−
2x2
x2 − 1=
?
∞x = ±1 are vertical asymptotes.
FreeCalc Math 140 Lecture 17 Spring 2017
Curve sketching Curve sketching summary
Example
Sketch the curve y = 2x2
x2−1 .
x
y
y = 2
x = −1 x = 1
Interval I/D Concavity(−∞,−1) I(−1,0) I(0,1) D(1,∞) D
6 Intervals of increase or decrease
f ′(x) =
?
(x2 − 1)(4x)− 2x2(2x)(x2 − 1)2
=−4x
(x2 − 1)2
− 4x (x2 − 1)2 f ′
(−∞,−1)
?
+
?
+ +(−1,0)
?
+
?
+ +(0,1)
?
−
?
+ −(1,∞)
?
−
?
+ −
FreeCalc Math 140 Lecture 17 Spring 2017
Curve sketching Curve sketching summary
Example
Sketch the curve y = 2x2
x2−1 .
x
y
y = 2
x = −1 x = 1
Interval I/D Concavity(−∞,−1) I(−1,0) I(0,1) D(1,∞) D
7 Local maxima and minima−4x (x2 − 1)2 f ′
(−∞,−1) + + +(−1,0) + + +(0,1) − + −(1,∞) − + −
f ′ changes sign from + to − at 0.Therefore (0,0) is a localmaximum.
FreeCalc Math 140 Lecture 17 Spring 2017
Curve sketching Curve sketching summary
Example
Sketch the curve y = 2x2
x2−1 .
x
y
y = 2
x = −1 x = 1
Interval I/D Concavity(−∞,−1) I up(−1,0) I down(0,1) D down(1,∞) D up
8 Concavity and points of inflectionf ′′(x)
=
?
−4(x2 − 1)2 + 4x · 2(x2 − 1)2x(x2 − 1)4
=12x2 + 4(x2 − 1)3
12x2 + 4 (x2 − 1)3 f ′′
(−∞,−1)
?
+
?
+ +(−1,1)
?
+
?
− −(1,∞)
?
+
?
+ +
No points of inflection because ±1 arenot in the domain of f .
FreeCalc Math 140 Lecture 17 Spring 2017