Embed Size (px)
Citation preview
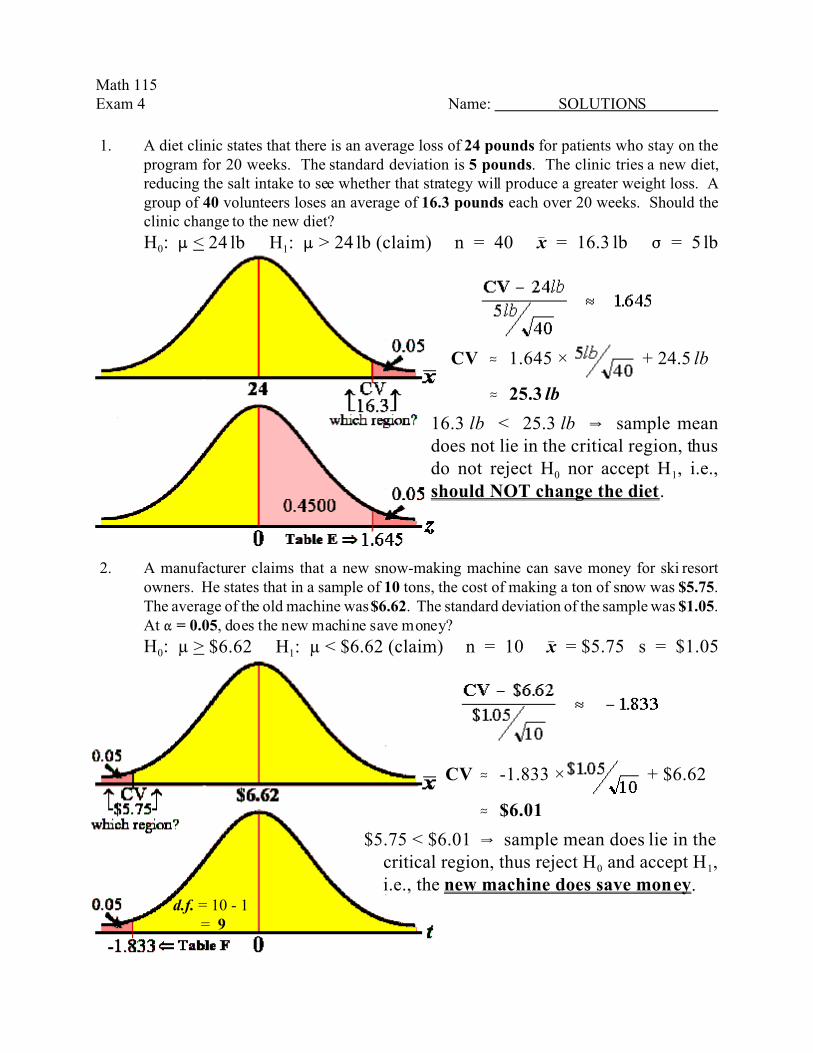
Math 115Exam 4 Name: SOLUTIONS
1. A diet clinic states that there is an average loss of 24 pounds for patients who stay on the
program for 20 weeks. The standard deviation is 5 pounds. The clinic tries a new diet,reducing the salt intake to see whether that strategy will produce a greater weight loss. Agroup of 40 volunteers loses an average of 16.3 pounds each over 20 weeks. Should theclinic change to the new diet?
H0: : < 24 lb H1: : > 24 lb (claim) n = 40 x) = 16.3 lb F = 5 lb
CV . 1.645 × + 24.5 lb
. 25.3 lb
16.3 lb < 25.3 lb Y sample meandoes not lie in the critical region, thusdo not reject H0 nor accept H1, i.e.,should NOT change the diet.
2. A manufacturer claims that a new snow-making machine can save money for ski resortowners. He states that in a sample of 10 tons, the cost of making a ton of snow was $5.75.The average of the old machine was $6.62. The standard deviation of the sample was $1.05.At " = 0.05, does the new machine save money?
H0: µ > $6.62 H1: µ < $6.62 (claim) n = 10 x) = $5.75 s = $1.05
CV . -1.833 × + $6.62
. $6.01
$5.75 < $6.01 Y sample mean does lie in the critical region, thus reject H0 and accept H1,
i.e., the new machine does save money. d.f. = 10 - 1
= 9
Math 115 / Statistics (Exam 4) Page 2
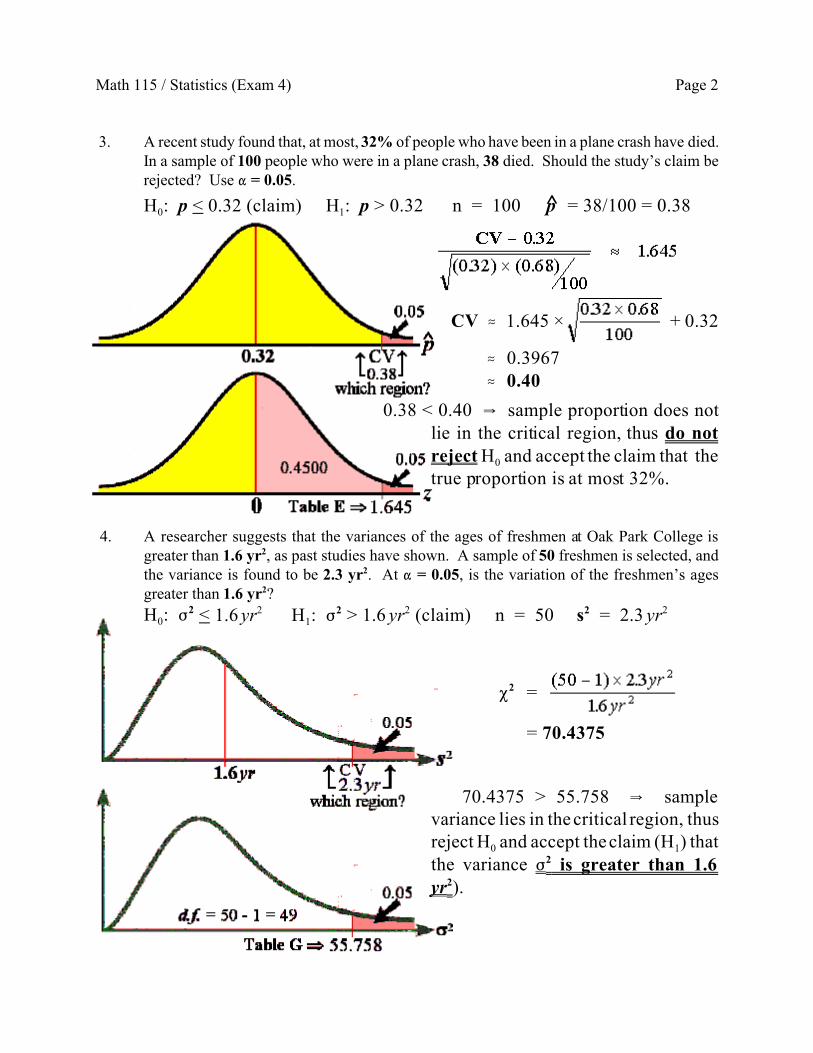
3. A recent study found that, at most, 32% of people who have been in a plane crash have died.In a sample of 100 people who were in a plane crash, 38 died. Should the study’s claim berejected? Use " = 0.05.
H0: p < 0.32 (claim) H1: p > 0.32 n = 100 p̂ = 38/100 = 0.38
CV . 1.645 × + 0.32
. 0.3967 . 0.40
0.38 < 0.40 Y sample proportion does notlie in the critical region, thus do notreject H0 and accept the claim that thetrue proportion is at most 32%.
4. A researcher suggests that the variances of the ages of freshmen at Oak Park College isgreater than 1.6 yr2, as past studies have shown. A sample of 50 freshmen is selected, andthe variance is found to be 2.3 yr2. At " = 0.05, is the variation of the freshmen’s agesgreater than 1.6 yr2?
H0: F2 < 1.6 yr2 H1: F
2 > 1.6 yr2 (claim) n = 50 s2 = 2.3 yr2
P2 =
= 70.4375
70.4375 > 55.758 Y samplevariance lies in the critical region, thusreject H0 and accept the claim (H1) thatthe variance F2 is greater than 1.6yr2).
Math 115 / Statistics (Exam 4) Page 3
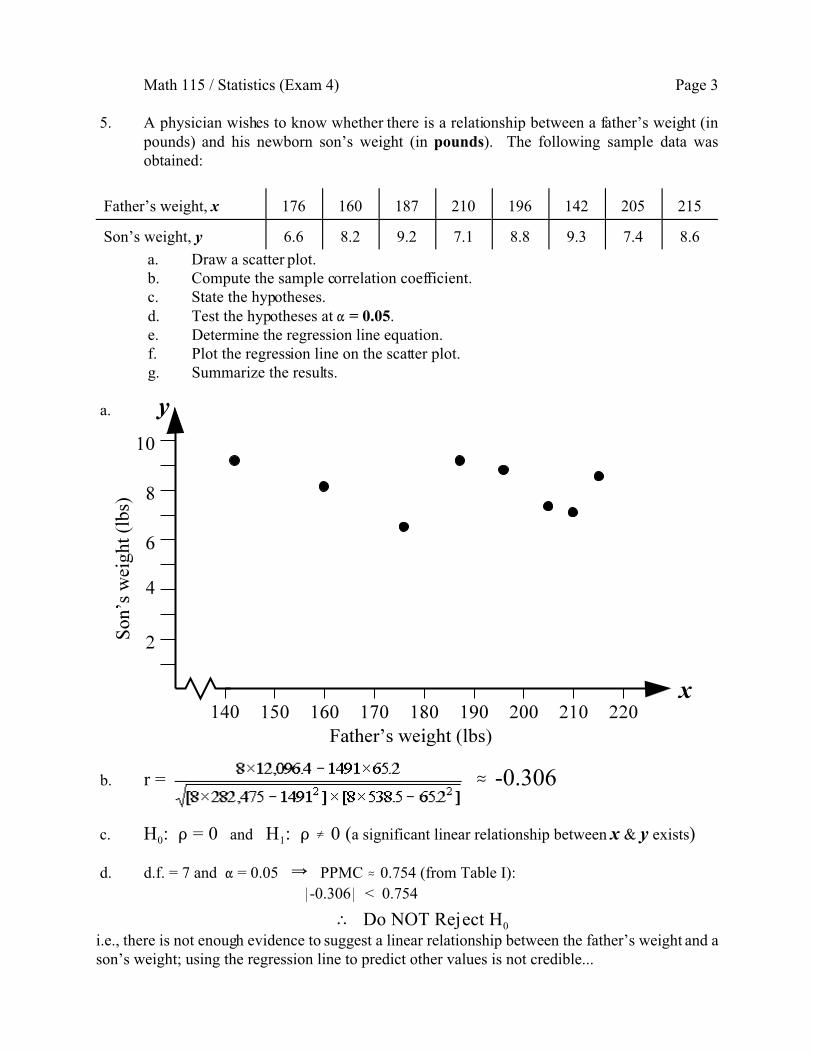
5. A physician wishes to know whether there is a relationship between a father’s weight (inpounds) and his newborn son’s weight (in pounds). The following sample data wasobtained:
Father’s weight, x 176 160 187 210 196 142 205 215
Son’s weight, y 6.6 8.2 9.2 7.1 8.8 9.3 7.4 8.6
a. Draw a scatter plot. b. Compute the sample correlation coefficient. c. State the hypotheses. d. Test the hypotheses at " = 0.05. e. Determine the regression line equation. f. Plot the regression line on the scatter plot. g. Summarize the results.
a.
b. r = . -0.306
c. H0: D = 0 and H1: D � 0 (a significant linear relationship between x & y exists)
d. d.f. = 7 and " = 0.05 Y PPMC . 0.754 (from Table I):
*-0.306* < 0.754
� Do NOT Reject H0
i.e., there is not enough evidence to suggest a linear relationship between the father’s weight and ason’s weight; using the regression line to predict other values is not credible...


![Math 115 — Practice for Exam 2mconger/dhsp/115packet2.pdfMath 115 / Exam 2 (March 22, 2017) do not write your name on this exam page 6 5. [12 points] Let f(x) = x(x−4)4/5e−x](https://img.pdfslide.us/doc/110x75/5f8ba52307b70f090b54bca0/math-115-a-practice-for-exam-2-mcongerdhsp115packet2pdf-math-115-exam-2-march.jpg)