Embed Size (px)
Citation preview
MATH 111: Semester Review
TOPICS Chapter 1: Data Collection
Vocabulary: Population, Sample, Variable, Data Experiment, Parameter, Statistic, Inferential Statistics, Descriptive Statistics
Qualitative and Quantitative Variables: Nominal, Ordinal, Discrete, and Continuous
Sampling Types and Sampling Methods: Observational Study vs. Designed Experiment; Simple Random Sample, Systematic Sample, Cluster Sample, Stratified Sample, and Convenience Sample
Chapter 2: Descriptive Statistics
Qualitative Graphs and Charts: Frequency Distributions, Pie Graphs, Bar Graphs, Side by Side Bar Graphs
Quantitative Graphs: Grouped and Ungrouped Frequency Distributions, Stem and Leaf Plots, Histograms (both discrete and continuous), Ogives, and Frequency Polygons
Frequency Distributions: Grouped and Ungrouped; Frequency, Cumulative Frequency, Relative Frequency, and Cumulative Relative Frequency
Chapter 3: Numerically Summarizing Data
Measures of Central Tendency: Mean, Median, Mode, and Midrange
Measures of Dispersion: Range, Variance, and Standard Deviation
Measures of Position: Quartiles, Percentiles, Midquartile, Interquartile Range, 5 Number Summary, Box-and-Whisker Plots, Standard Score or z – score
Empirical Rule and Chebyshev’s Theorem
Chapter 4: Describing the Relationship between Two Variables
Two Quantitative Variables: Scatter Plots (Dependent and Independent Variables)
Linear Correlation: Positive Correlation, Negative Correlation, Correlation Coefficient (r), SS(xy), SS(x), SS(y); Causation and Lurking Variables
Regression Analysis: Least Squares Line (Line of Best Fit), Predicting Values, Interpreting Slope and Y-intercept.
Chapter 5: Probability
Probability: Empirical Probability, Theoretical Probability, Law of Large Numbers, Experiment, Outcome, Sample Space, and Event
Rules of Probability: Properties and Complements
Probabilities of Compound Events: Mutually Exclusive Events, Addition Rule, Independence, Multiplication Rule, and Conditional Probability
Counting Techniques: Multiplication Rule, Permutations, and Combinations
Chapter 6: Discrete Probability Distributions
Random Variables: Discrete Random Variables and Continuous Random Variables
Probability Distributions: Probability Distribution, Mean, Variance, and Standard Deviation of a Probability Distribution
Binomial Probability Distributions: Binomial Probability Experiments, Mean, and Standard Deviation
Poisson Probability Distributions: Poisson Probability Experiments, Mean, and Standard Deviation
Chapter 7: Normal Probability Distributions
Normal Probability Distributions: Normal Curve, Properties, Finding Areas, Finding Values
Standard Normal Distribution: Properties, Finding Areas, Finding z – scores, Finding Percentiles
Chapter 8: Sampling Distributions
Distribution of the Sample Mean: Conditions for Normal, Mean, Standard Deviation, and Finding Probabilities
Distribution of the Sample Proportion: Conditions for Normal, Mean, Standard Deviation, and Finding Probabilities
PROBLEMS Chapter 1: Data Collection
True/False
1. A balance is used to measure weights to three decimal places. The data that results from this process would be classified as qualitative data.
2. A variable is a characteristic of interest about each individual element of a population or
sample.
3. A quantitative variable that can assume a countable number of values is referred to as a discrete variable.
4. A qualitative variable that categorizes, describes, or names an element of a population is
referred to as a nominal variable.
5. A population is typically a very large collection of individuals or objects about which we desire information.
6. A parameter is the measure of some characteristic of a sample.
7. The thickness of a sheet of sheet metal used in a manufacturing process is an example
of a quantitative variable.
8. The basic objective of statistics is that of obtaining a sample, inspecting the sample, and then making inferences about the unknown characteristics of the population from which the sample was drawn.
Multiple Choice
9. Which of the following best describes the data: zip codes for students attending college in the state of Oklahoma?
a. Nominal data b. Ordinal data c. Discrete data d. Continuous data
10. Consider the following data: the 18-hole score for all rounds of golf played at Oak Hills
Country Club last year. Which of the following best describes these data?
a. Nominal data b. Ordinal data c. Discrete data d. Continuous data
11. A company has developed a new battery, but the average lifetime is unknown. In order to estimate this average, a sample of 100 batteries is tested and the average lifetime of this sample if found to be 250 hours. The 250 hours is the value of a:
a. parameter b. statistic c. sampling frame d. population
12. Choose the item that best completes the following statement: No matter what the
variable is, if the tool of measurement is precise enough, there will be:
a. uncertainty b. variability c. probability d. measurability
13. Suppose you are interested in determining the likelihood of winning a state lottery by
purchasing one ticket. Which of the following best describes this problem?
a. This is a problem in probability b. This is a problem in statistics c. Neither a or b d. Both a and b
Short Answer/Computations
14. What is the difference between descriptive statistics and inferential statistics?
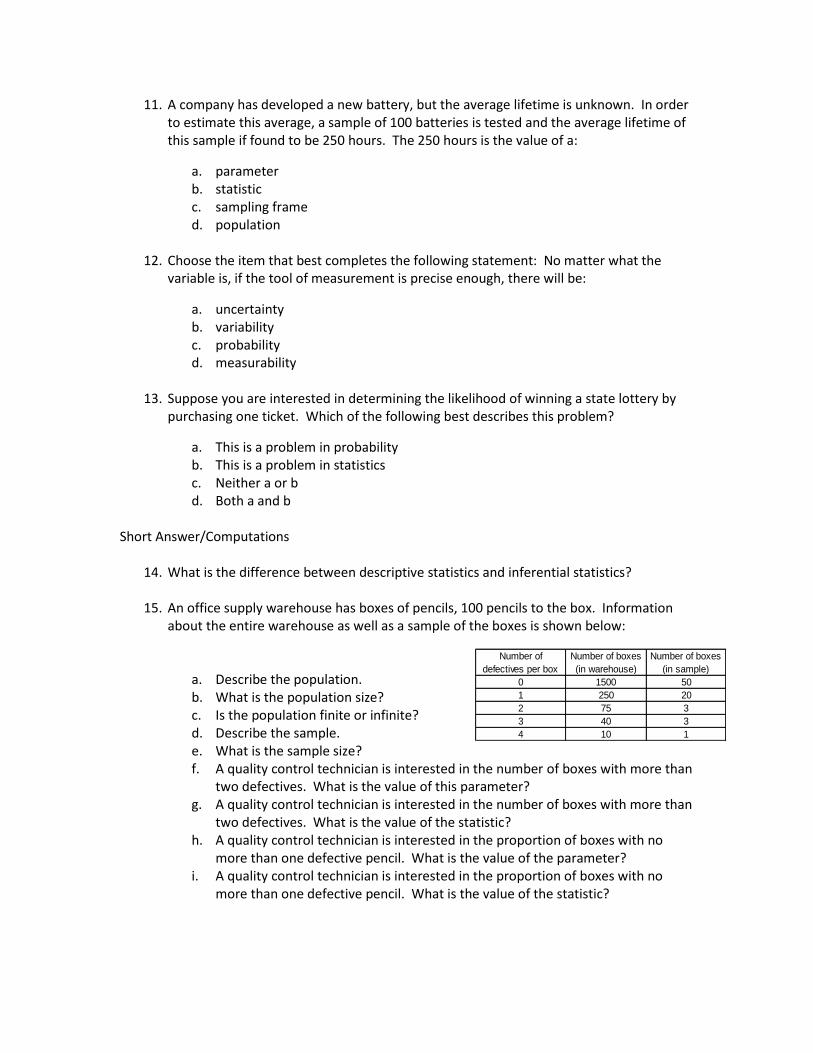
15. An office supply warehouse has boxes of pencils, 100 pencils to the box. Information about the entire warehouse as well as a sample of the boxes is shown below:
a. Describe the population. b. What is the population size? c. Is the population finite or infinite? d. Describe the sample. e. What is the sample size? f. A quality control technician is interested in the number of boxes with more than
two defectives. What is the value of this parameter? g. A quality control technician is interested in the number of boxes with more than
two defectives. What is the value of the statistic? h. A quality control technician is interested in the proportion of boxes with no
more than one defective pencil. What is the value of the parameter? i. A quality control technician is interested in the proportion of boxes with no
more than one defective pencil. What is the value of the statistic?
Number of
defectives per box
Number of boxes
(in warehouse)
Number of boxes
(in sample)
0 1500 50
1 250 20
2 75 3
3 40 3
4 10 1
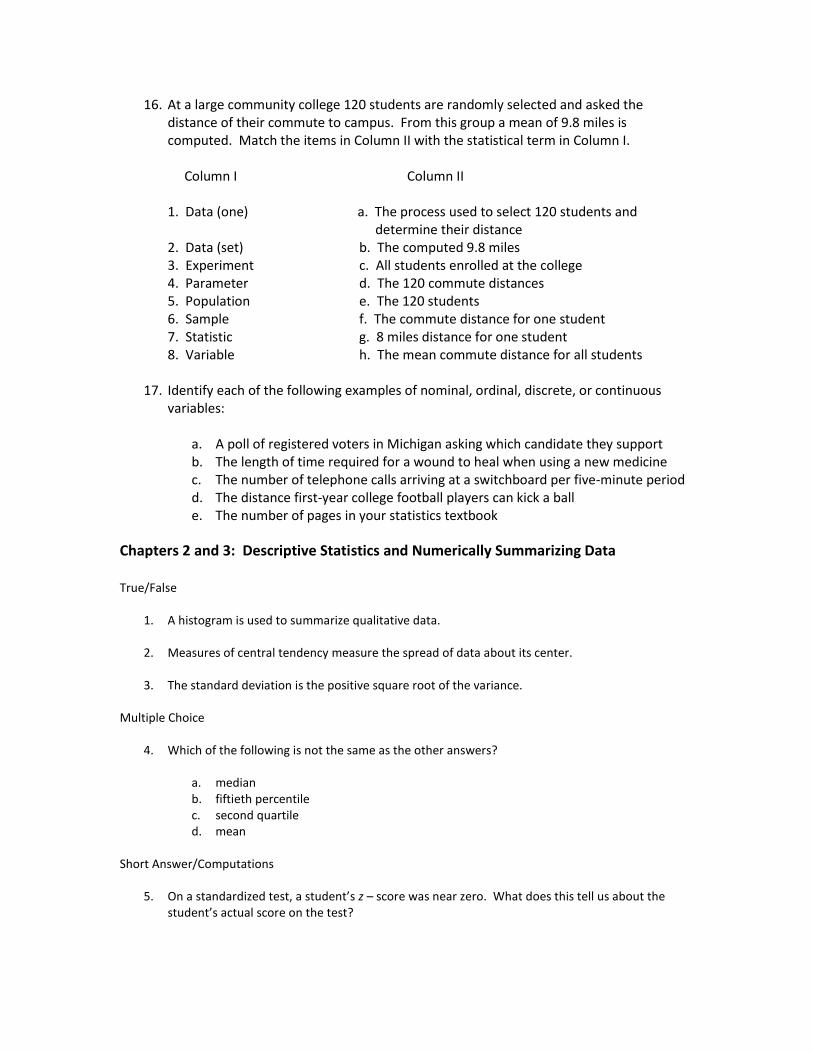
16. At a large community college 120 students are randomly selected and asked the distance of their commute to campus. From this group a mean of 9.8 miles is computed. Match the items in Column II with the statistical term in Column I.
Column I Column II
1. Data (one) a. The process used to select 120 students and
determine their distance 2. Data (set) b. The computed 9.8 miles 3. Experiment c. All students enrolled at the college 4. Parameter d. The 120 commute distances 5. Population e. The 120 students 6. Sample f. The commute distance for one student 7. Statistic g. 8 miles distance for one student 8. Variable h. The mean commute distance for all students
17. Identify each of the following examples of nominal, ordinal, discrete, or continuous variables:
a. A poll of registered voters in Michigan asking which candidate they support b. The length of time required for a wound to heal when using a new medicine c. The number of telephone calls arriving at a switchboard per five-minute period d. The distance first-year college football players can kick a ball e. The number of pages in your statistics textbook
Chapters 2 and 3: Descriptive Statistics and Numerically Summarizing Data True/False
1. A histogram is used to summarize qualitative data.
2. Measures of central tendency measure the spread of data about its center.
3. The standard deviation is the positive square root of the variance. Multiple Choice
4. Which of the following is not the same as the other answers?
a. median b. fiftieth percentile c. second quartile d. mean
Short Answer/Computations
5. On a standardized test, a student’s z – score was near zero. What does this tell us about the student’s actual score on the test?
6. An aptitude test is known to have a mean score of 37.5 with a standard deviation equal to 3.5. A company requires a standard score (z –score) of 1.5 for employment as one of its requirements. What must your test score be in order to be considered for employment?
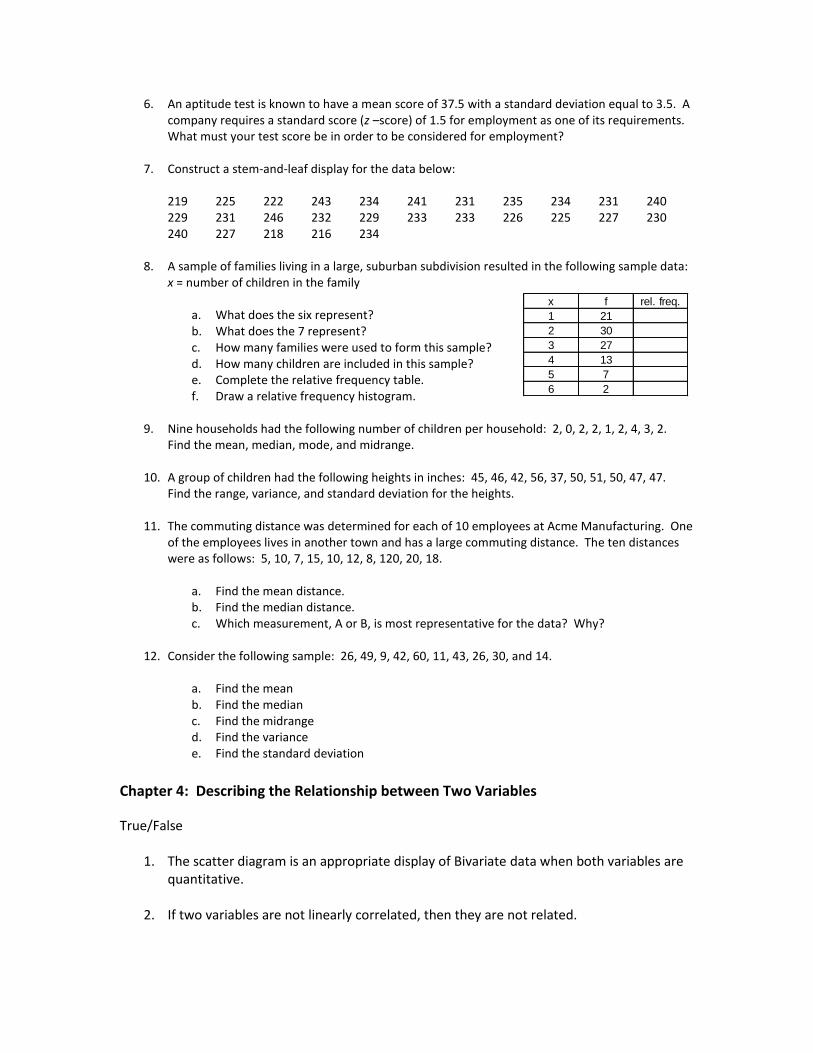
7. Construct a stem-and-leaf display for the data below:
219 225 222 243 234 241 231 235 234 231 240 229 231 246 232 229 233 233 226 225 227 230 240 227 218 216 234
8. A sample of families living in a large, suburban subdivision resulted in the following sample data:
x = number of children in the family
a. What does the six represent? b. What does the 7 represent? c. How many families were used to form this sample? d. How many children are included in this sample? e. Complete the relative frequency table. f. Draw a relative frequency histogram.
9. Nine households had the following number of children per household: 2, 0, 2, 2, 1, 2, 4, 3, 2.
Find the mean, median, mode, and midrange.
10. A group of children had the following heights in inches: 45, 46, 42, 56, 37, 50, 51, 50, 47, 47. Find the range, variance, and standard deviation for the heights.
11. The commuting distance was determined for each of 10 employees at Acme Manufacturing. One
of the employees lives in another town and has a large commuting distance. The ten distances were as follows: 5, 10, 7, 15, 10, 12, 8, 120, 20, 18.
a. Find the mean distance. b. Find the median distance. c. Which measurement, A or B, is most representative for the data? Why?
12. Consider the following sample: 26, 49, 9, 42, 60, 11, 43, 26, 30, and 14.
a. Find the mean b. Find the median c. Find the midrange d. Find the variance e. Find the standard deviation
Chapter 4: Describing the Relationship between Two Variables
True/False
1. The scatter diagram is an appropriate display of Bivariate data when both variables are quantitative.
2. If two variables are not linearly correlated, then they are not related.
x f rel. freq.
1 21
2 30
3 27
4 13
5 7
6 2

3. The closer the absolute value of r is to one, the better will be the predictions made using the equation of the line of best fit, provided the prediction is made for x values between the smallest value of x and the largest value of x in the observed data.
4. The primary purpose of linear correlation analysis is to measure the strength of a linear
relationship between two variables.
5. The slope of the regression line represents the amount of change expected to take place in y when x increases by one unit.
6. Correlation coefficients range between 0 and 1.
Short Answer/Computations
7. In an experiment, a fixed amount of fertilizer was applied to each of 10 plots, and the corresponding yield in pounds of corn was measured. Identify the independent and dependent variables in this experiment.
8. For a particular set of Bivariate data, the equation of the line of best fit is
xy 28.64.82ˆ , find the x value that corresponds to 8.11y .
9. Students were given a reading competency test (scores range from 0 to 48) and also a
math competency test (scores range from 50 to 100).
a. Find SS(xy), SS(y), SS(x) b. Find r. c. Find the equation for the line of best fit.
Chapter 5: Probability True/False
1. If A and B are two independent events of a sample space S, the
AP( and )()() ABPAPB .
2. If A and B are two independent events of a sample space S, then A and B may be
mutually exclusive.
3. The probabilities of complementary events always sum to 1.
4. A compound event formed by use of the word and requires the use of the addition rule.
Reading (x ) 40 36 42 29 44 35 38 42 45 40
Math (y ) 78 80 90 60 95 70 77 83 90 80
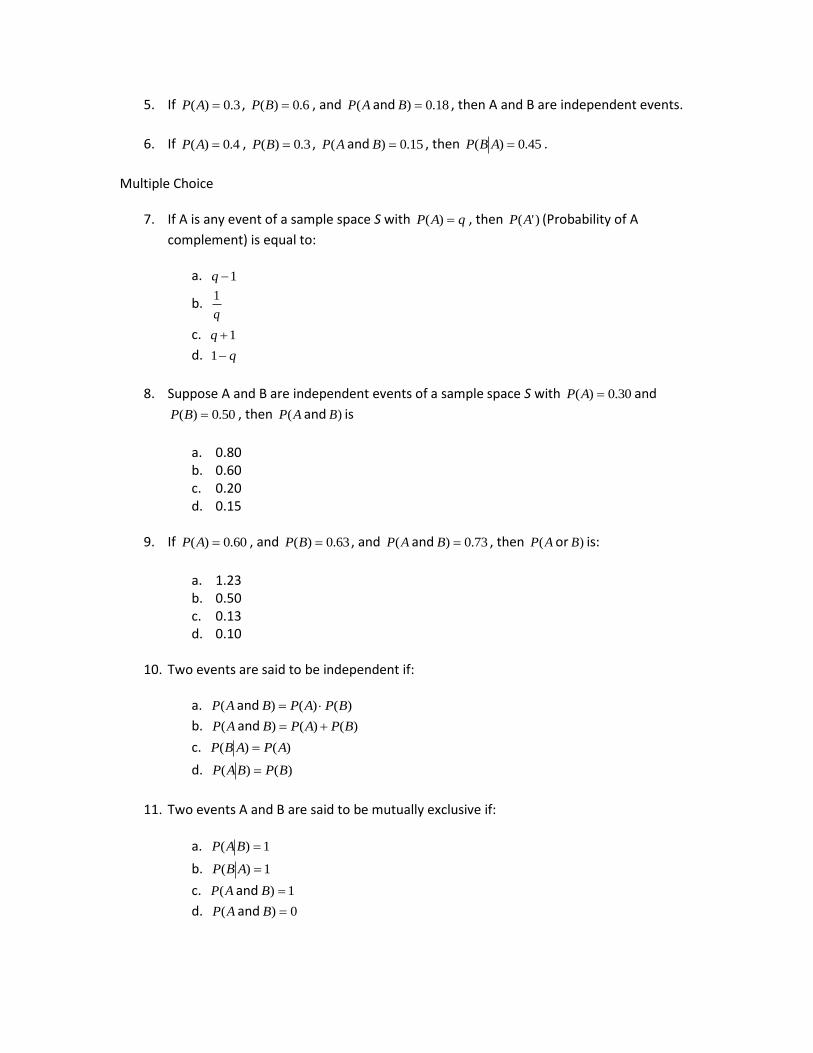
5. If 3.0)( AP , 6.0)( BP , and AP( and 18.0) B , then A and B are independent events.
6. If 4.0)( AP , 3.0)( BP , AP( and 15.0) B , then 45.0)( ABP .
Multiple Choice
7. If A is any event of a sample space S with qAP )( , then )'(AP (Probability of A
complement) is equal to:
a. 1q
b. q
1
c. 1q
d. q1
8. Suppose A and B are independent events of a sample space S with 30.0)( AP and
50.0)( BP , then AP( and )B is
a. 0.80 b. 0.60 c. 0.20 d. 0.15
9. If 60.0)( AP , and 63.0)( BP , and AP( and 73.0) B , then AP( or )B is:
a. 1.23 b. 0.50 c. 0.13 d. 0.10
10. Two events are said to be independent if:
a. AP( and )()() BPAPB
b. AP( and )()() BPAPB
c. )()( APABP
d. )()( BPBAP
11. Two events A and B are said to be mutually exclusive if:
a. 1)( BAP
b. 1)( ABP
c. AP( and 1) B
d. AP( and 0) B

Short Answer/Computations
12. A computer programmer produces a random integer between 0 and 9 inclusive. Find the probability that the integer is a number greater than 5.
13. A box contains five red, three blue, and two white poker chips. Two are selected
without replacement. Find the probability that both are the same color.
14. Twenty percent of the trees in a particular forest have a disease, 30% of the trees are too small to be used for lumber, and 40% are too small to be used for lumber or have a disease. What percent of the trees are too small to be used for lumber and have a disease?
15. The probability that a first-time tourist to the city of Toledo will visit the Art Museum is
0.5, will visit the Toledo Zoo is 0.4, and will visit both is 0.25. If a first-time tourist to Toledo is randomly selected, find the probability that the tourist will visit:
a. the Art Institute or the Toledo Zoo b. neither of these attractions c. one, but not both, of these attractions
16. Five hundred people are classified based on their smoking habits and whether or not
they have prominent wrinkles. The results are shown below:
One individual is randomly selected from that group of 500 people.
a. Given that the individual is a heavy smoker, what is the probability that he/she does not have prominent wrinkles?
b. What is the probability that the selected individual is a heavy smoker or has prominent wrinkles?
17. A box contains three defective units and 17 non-defective units. Two units are selected
from the box without replacement. What is the probability that both units are defective given that the first one selected was defective?
18. If 4.0)( AP and 5.0)( BP and A and B are independent events, what is the probability
of each of the following?
a. AP( and )B
b. )( ABP
c. )( BAP
d. AP( or )B
Prominent Wrinkles Wrinkles Not Prominent
Heavy Smoker 120 60
Light or Nonsmoker 75 245
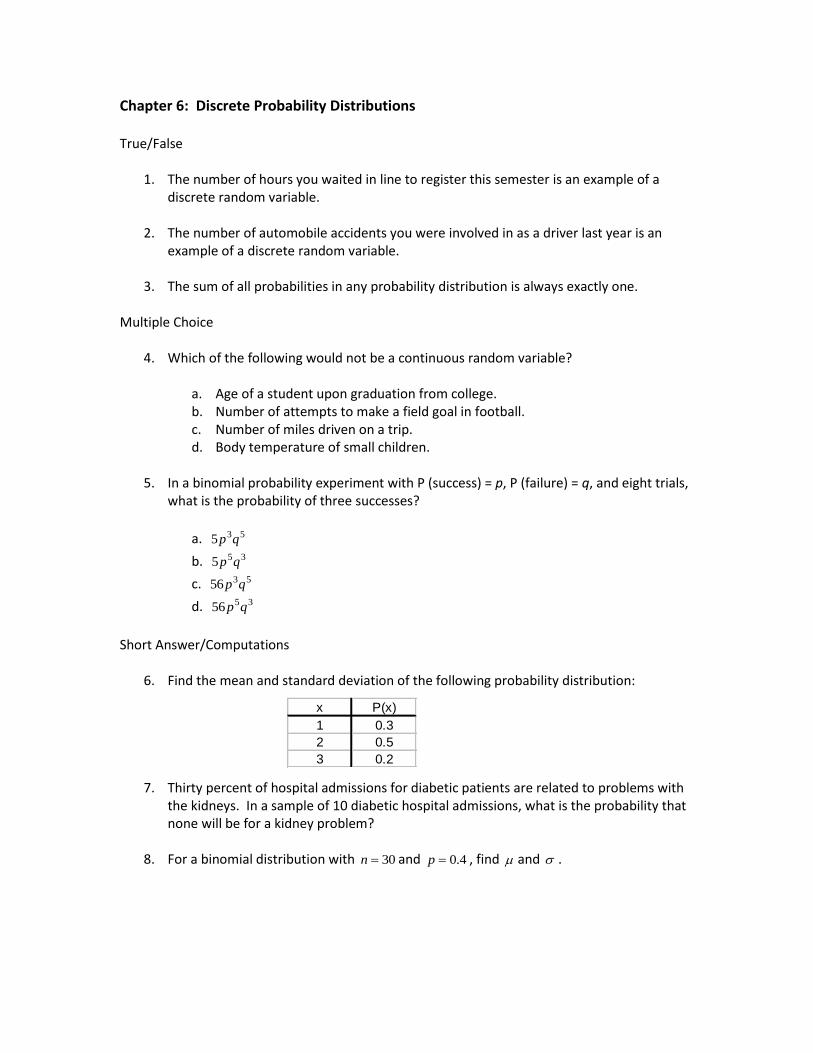
Chapter 6: Discrete Probability Distributions True/False
1. The number of hours you waited in line to register this semester is an example of a discrete random variable.
2. The number of automobile accidents you were involved in as a driver last year is an
example of a discrete random variable.
3. The sum of all probabilities in any probability distribution is always exactly one.
Multiple Choice
4. Which of the following would not be a continuous random variable?
a. Age of a student upon graduation from college. b. Number of attempts to make a field goal in football. c. Number of miles driven on a trip. d. Body temperature of small children.
5. In a binomial probability experiment with P (success) = p, P (failure) = q, and eight trials,
what is the probability of three successes?
a. 535 qp
b. 355 qp
c. 5356 qp
d. 3556 qp
Short Answer/Computations
6. Find the mean and standard deviation of the following probability distribution:
7. Thirty percent of hospital admissions for diabetic patients are related to problems with the kidneys. In a sample of 10 diabetic hospital admissions, what is the probability that none will be for a kidney problem?
8. For a binomial distribution with 30n and 4.0p , find and .
x P(x)
1 0.3
2 0.5
3 0.2
9. It was reported in a medical journal that about 70% of the individuals needing a kidney transplant find a suitable donor when they turn to registries of unrelated donors. In a group of ten individuals needing a kidney transplant, find the probability that:
a. all ten will find a suitable donor among the registries of unrelated donors. b. at least eight will find a suitable donor among the registries of unrelated donors.
10. In Florida, 40% of the people have a certain blood type. What is the probability that
exactly 5 out of a randomly selected group of 15 Floridians will have that blood type?
Chapter 7: Normal Probability Distributions
Multiple Choice
1. The area under the normal curve between 0.0z and 0.2z is
a. 0.9772 b. 0.7408 c. 0.1359 d. 0.4772
Short Answer/Computations
2. Find z if the area to the right of z is 0.6736.
3. Find the probability of a randomly selected piece of data from a normal population will have a z –score between 0 and 1.25.
4. Find the probability of a randomly selected piece of data from a normal population will
have a z –score less than 2.25.
5. For a normal distribution with 𝜇 = 50 and 𝜎 = 6, find 𝑃(𝑥 > 55).
6. For the normal distribution from #5 above, find 𝑃(48 < 𝑥 ≤ 51).
7. Suppose Dunlop Tire manufactures tires having the property that the mileage the tire lasts approximately follows a normal distribution with mean 70,000 miles and standard deviation 4400 miles.
a. What percent of tires will last at least 75,000 miles? b. Suppose Dunlop warrants the tires for 60,000 miles. What percent of the tires will
last 60,000 miles or less? c. Suppose Dunlop wants to replace no more than 2% of its tires. What mileage should
the company advertise as its warranty mileage?
Chapter 8: Sampling Distributions
1. A machine at K&A Tube and Manufacturing Company produces a certain copper tubing component in a refrigeration unit. The tubing components produced by the manufacturer have a mean diameter of 0.75 inches with a standard deviation 0.004 inches. The quality control inspector takes a random sample of 30 components once each week and calculates the mean diameter of these components. If the mean is either less than 0.748 inches or greater than 0.752 inches, the inspector concludes that the machine needs an adjustment. a. Describe the sampling distribution of �̅�, the sample mean diameter, for a random
sample of 30 such components. b. What is the probability that, based on a random sample of 30 such components, the
inspector will conclude that the machine needs an adjustment?
2. According to the National Center for Health Statistics (2004), 22.4% of adults are
smokers. Suppose a random sample of 300 adults is obtained.
a. Describe the sampling distribution of �̂�, the sample proportion of adults who smoke. b. In a random sample of 300 adults, what is the probability that at least 50 are
smokers?
ANSWERS
Chapter 1: Data Collection
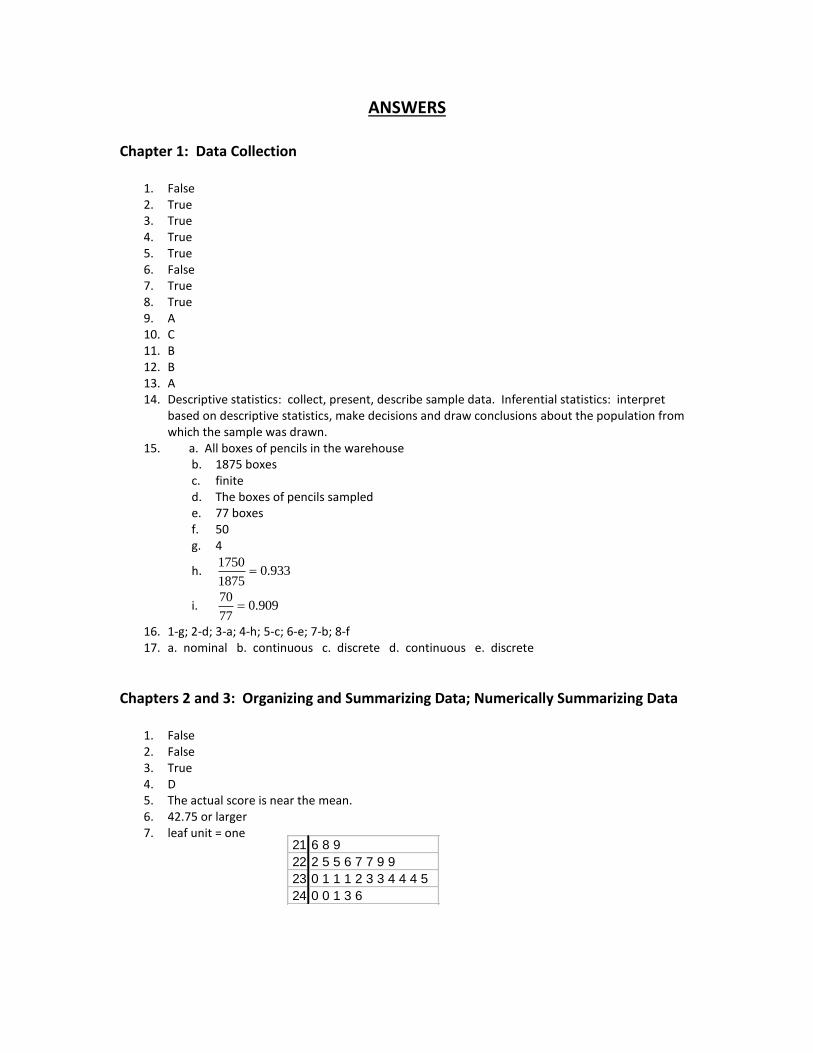
1. False 2. True 3. True 4. True 5. True 6. False 7. True 8. True 9. A 10. C 11. B 12. B 13. A 14. Descriptive statistics: collect, present, describe sample data. Inferential statistics: interpret
based on descriptive statistics, make decisions and draw conclusions about the population from which the sample was drawn.
15. a. All boxes of pencils in the warehouse b. 1875 boxes c. finite d. The boxes of pencils sampled e. 77 boxes f. 50 g. 4
h. 933.01875
1750
i. 909.077
70
16. 1-g; 2-d; 3-a; 4-h; 5-c; 6-e; 7-b; 8-f 17. a. nominal b. continuous c. discrete d. continuous e. discrete
Chapters 2 and 3: Organizing and Summarizing Data; Numerically Summarizing Data
1. False 2. False 3. True 4. D 5. The actual score is near the mean. 6. 42.75 or larger 7. leaf unit = one
21 6 8 9
22 2 5 5 6 7 7 9 9
23 0 1 1 1 2 3 3 4 4 4 5
24 0 0 1 3 6
0
20
40
1 2 3 4 5 6
Re
lati
ve F
req
ue
ncy
# of children
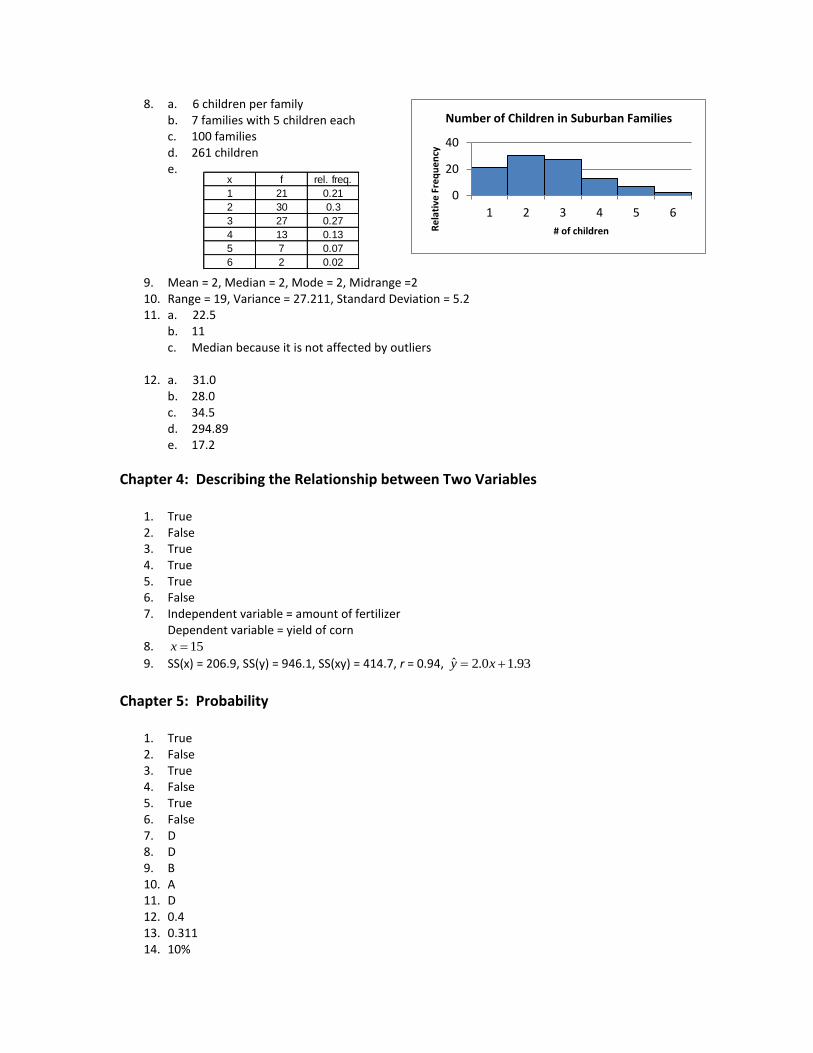
Number of Children in Suburban Families8. a. 6 children per family
b. 7 families with 5 children each c. 100 families d. 261 children e.
9. Mean = 2, Median = 2, Mode = 2, Midrange =2 10. Range = 19, Variance = 27.211, Standard Deviation = 5.2 11. a. 22.5
b. 11 c. Median because it is not affected by outliers
12. a. 31.0
b. 28.0 c. 34.5 d. 294.89 e. 17.2
Chapter 4: Describing the Relationship between Two Variables
1. True 2. False 3. True 4. True 5. True 6. False 7. Independent variable = amount of fertilizer
Dependent variable = yield of corn 8. 15x
9. SS(x) = 206.9, SS(y) = 946.1, SS(xy) = 414.7, r = 0.94, 93.10.2ˆ xy
Chapter 5: Probability
1. True 2. False 3. True 4. False 5. True 6. False 7. D 8. D 9. B 10. A 11. D 12. 0.4 13. 0.311 14. 10%
x f rel. freq.
1 21 0.21
2 30 0.3
3 27 0.27
4 13 0.13
5 7 0.07
6 2 0.02
15. a. 0.65 b. 0.35 c. 0.40
16. a. 0.333 b. 0.51
17. 0.105 18. a. 0.20
b. 0.50 c. 0.40 d. 0.70
Chapter 6: Discrete Probability Distributions
1. False 2. True 3. True 4. B 5. C 6. 9.1 , 7.0
7. 0.028 8. 12 , 7.2
9. a. 0.028 b. 0.382
10. 0.186
Chapter 7: Normal Probability Distributions
1. D 2. -0.45 3. 0.3944 4. 0.9878 5. 0.2023 6. 0.1967 7. a. 0.1279
b. 0.0115 c. 60,963.5 miles
8. a. 600 ∙ .02 ∙ .98 = 11.76 ≥ 10 b. 0.0075 c. 0.0026
Chapter 8: Sampling Distributions
1. a. approximately normal since the sample size is 30 with a mean of 0.75 and a standard deviation of 0.0007
b. 0.9957 2. a. approximately normal because 300 ∙ .224 ∙ .776 = 52.1472 ≥ 10 with a mean of 0.224 and a
standard deviation of 0.024 b. 0.9916