Embed Size (px)
Citation preview
Bernoulli Probability and the Normal Distribution Properties of the Normal Distribution Examples Conclusion
MATH 105: Finite Mathematics9-6: The Normal Distribution
Prof. Jonathan Duncan
Walla Walla College
Winter Quarter, 2006
Bernoulli Probability and the Normal Distribution Properties of the Normal Distribution Examples Conclusion
Outline
1 Bernoulli Probability and the Normal Distribution
2 Properties of the Normal Distribution
3 Examples
4 Conclusion
Bernoulli Probability and the Normal Distribution Properties of the Normal Distribution Examples Conclusion
Outline
1 Bernoulli Probability and the Normal Distribution
2 Properties of the Normal Distribution
3 Examples
4 Conclusion
Bernoulli Probability and the Normal Distribution Properties of the Normal Distribution Examples Conclusion
Graphing Bernoulli Probability Distributions
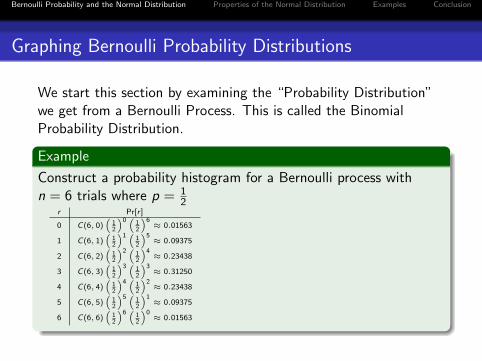
We start this section by examining the “Probability Distribution”we get from a Bernoulli Process. This is called the BinomialProbability Distribution.
Example
Construct a probability histogram for a Bernoulli process withn = 6 trials where p = 1
2
Bernoulli Probability and the Normal Distribution Properties of the Normal Distribution Examples Conclusion
Graphing Bernoulli Probability Distributions
We start this section by examining the “Probability Distribution”we get from a Bernoulli Process. This is called the BinomialProbability Distribution.
Example
Construct a probability histogram for a Bernoulli process withn = 6 trials where p = 1
2r Pr[r ]
0 C(6, 0)“
12
”0 “12
”6≈ 0.01563
1 C(6, 1)“
12
”1 “12
”5≈ 0.09375
2 C(6, 2)“
12
”2 “12
”4≈ 0.23438
3 C(6, 3)“
12
”3 “12
”3≈ 0.31250
4 C(6, 4)“
12
”4 “12
”2≈ 0.23438
5 C(6, 5)“
12
”5 “12
”1≈ 0.09375
6 C(6, 6)“
12
”6 “12
”0≈ 0.01563
Bernoulli Probability and the Normal Distribution Properties of the Normal Distribution Examples Conclusion
Graphing Bernoulli Probability Distributions
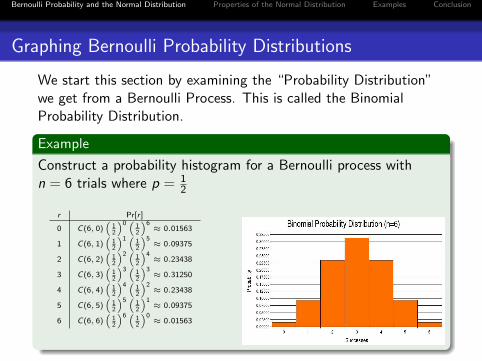
We start this section by examining the “Probability Distribution”we get from a Bernoulli Process. This is called the BinomialProbability Distribution.
Example
Construct a probability histogram for a Bernoulli process withn = 6 trials where p = 1
2
r Pr[r ]
0 C(6, 0)“
12
”0 “12
”6≈ 0.01563
1 C(6, 1)“
12
”1 “12
”5≈ 0.09375
2 C(6, 2)“
12
”2 “12
”4≈ 0.23438
3 C(6, 3)“
12
”3 “12
”3≈ 0.31250
4 C(6, 4)“
12
”4 “12
”2≈ 0.23438
5 C(6, 5)“
12
”5 “12
”1≈ 0.09375
6 C(6, 6)“
12
”6 “12
”0≈ 0.01563
Bernoulli Probability and the Normal Distribution Properties of the Normal Distribution Examples Conclusion
As n Increases. . .
As n increases, one could almost say the number of successesbecomes more like a continuous variable. The picture for n = 100is shown below.
Bernoulli Probability and the Normal Distribution Properties of the Normal Distribution Examples Conclusion
As n Increases. . .
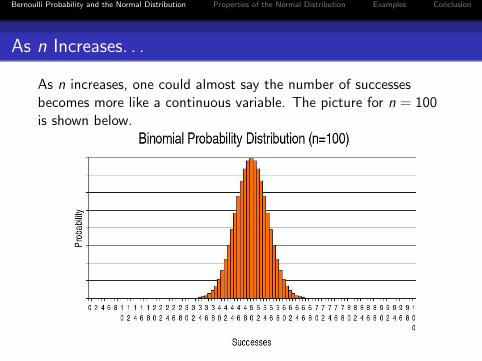
As n increases, one could almost say the number of successesbecomes more like a continuous variable. The picture for n = 100is shown below.
Bernoulli Probability and the Normal Distribution Properties of the Normal Distribution Examples Conclusion
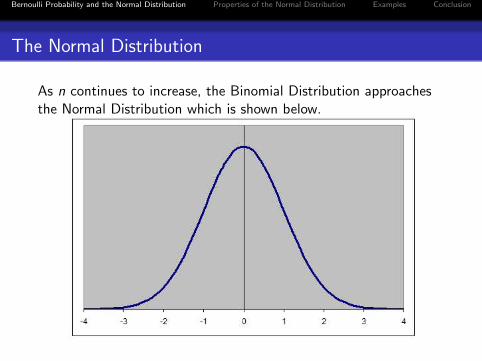
The Normal Distribution
As n continues to increase, the Binomial Distribution approachesthe Normal Distribution which is shown below.
Bernoulli Probability and the Normal Distribution Properties of the Normal Distribution Examples Conclusion
The Normal Distribution
As n continues to increase, the Binomial Distribution approachesthe Normal Distribution which is shown below.
Bernoulli Probability and the Normal Distribution Properties of the Normal Distribution Examples Conclusion
Outline
1 Bernoulli Probability and the Normal Distribution
2 Properties of the Normal Distribution
3 Examples
4 Conclusion
Bernoulli Probability and the Normal Distribution Properties of the Normal Distribution Examples Conclusion
General Properties
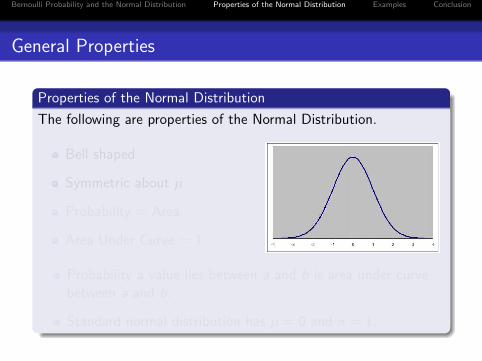
Properties of the Normal Distribution
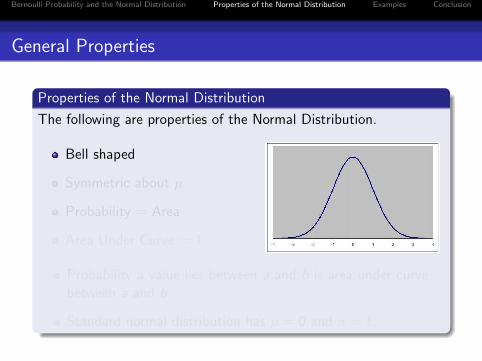
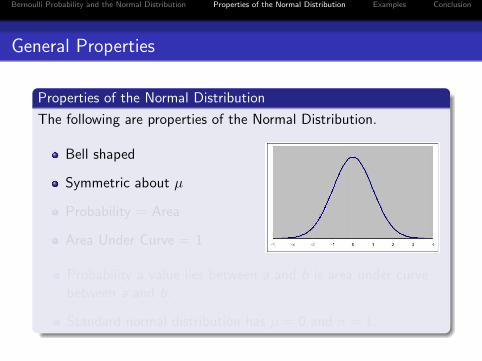
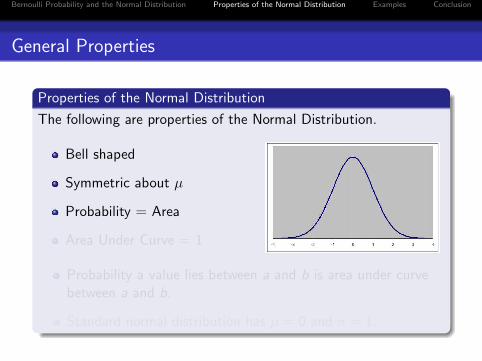
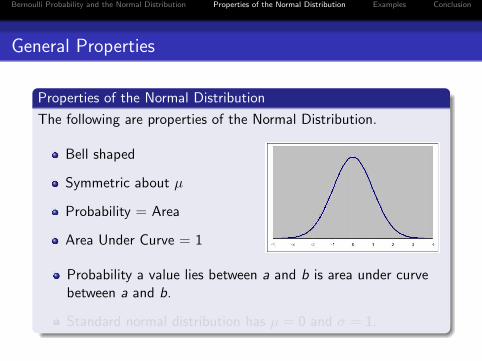
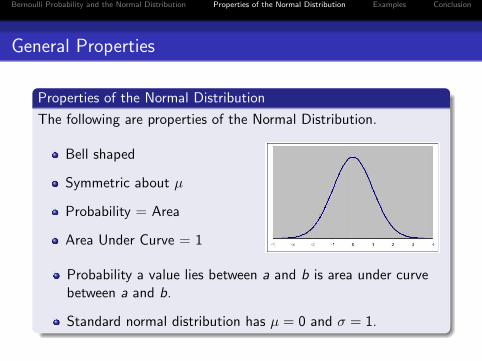
The following are properties of the Normal Distribution.
Bell shaped
Symmetric about µ
Probability = Area
Area Under Curve = 1
Probability a value lies between a and b is area under curvebetween a and b.
Standard normal distribution has µ = 0 and σ = 1.
Bernoulli Probability and the Normal Distribution Properties of the Normal Distribution Examples Conclusion
General Properties
Properties of the Normal Distribution
The following are properties of the Normal Distribution.
Bell shaped
Symmetric about µ
Probability = Area
Area Under Curve = 1
Probability a value lies between a and b is area under curvebetween a and b.
Standard normal distribution has µ = 0 and σ = 1.
Bernoulli Probability and the Normal Distribution Properties of the Normal Distribution Examples Conclusion
Empirical Rule
Empirical Rule
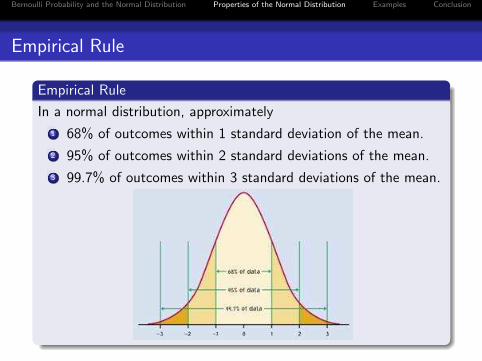
In a normal distribution, approximately
1 68% of outcomes within 1 standard deviation of the mean.
2 95% of outcomes within 2 standard deviations of the mean.
3 99.7% of outcomes within 3 standard deviations of the mean.
Bernoulli Probability and the Normal Distribution Properties of the Normal Distribution Examples Conclusion
Empirical Rule
Empirical Rule
In a normal distribution, approximately
1 68% of outcomes within 1 standard deviation of the mean.
2 95% of outcomes within 2 standard deviations of the mean.
3 99.7% of outcomes within 3 standard deviations of the mean.
Bernoulli Probability and the Normal Distribution Properties of the Normal Distribution Examples Conclusion
Applying the Empirical Rule
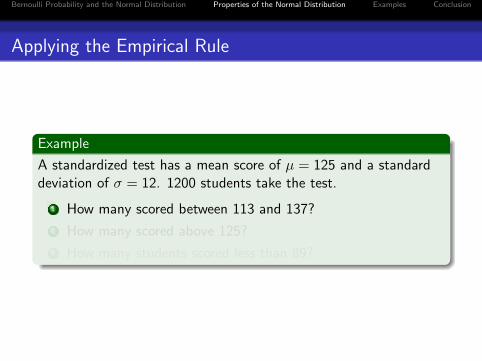
Example
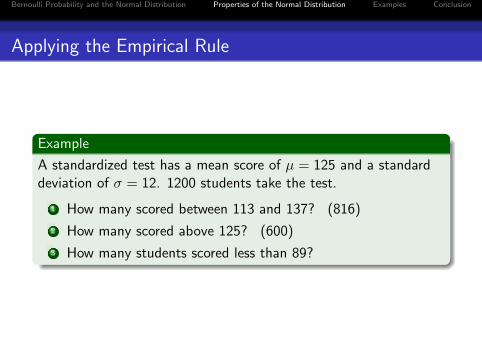
A standardized test has a mean score of µ = 125 and a standarddeviation of σ = 12. 1200 students take the test.
1 How many scored between 113 and 137?
2 How many scored above 125?
3 How many students scored less than 89?
Bernoulli Probability and the Normal Distribution Properties of the Normal Distribution Examples Conclusion
Applying the Empirical Rule
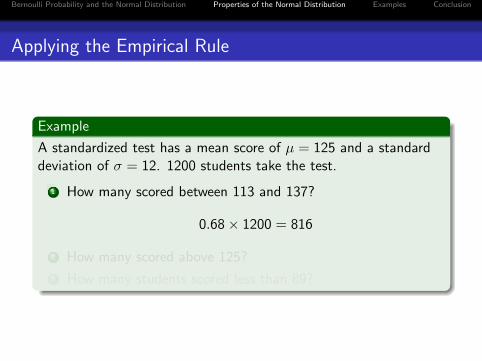
Example
A standardized test has a mean score of µ = 125 and a standarddeviation of σ = 12. 1200 students take the test.
1 How many scored between 113 and 137?
2 How many scored above 125?
3 How many students scored less than 89?
Bernoulli Probability and the Normal Distribution Properties of the Normal Distribution Examples Conclusion
Applying the Empirical Rule
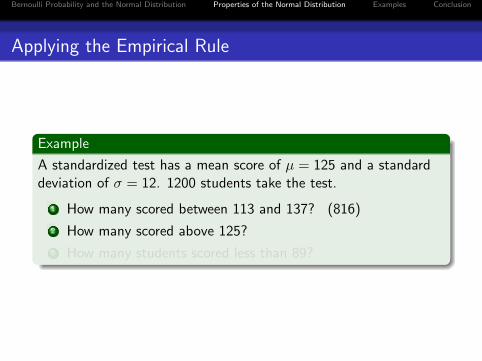
Example
A standardized test has a mean score of µ = 125 and a standarddeviation of σ = 12. 1200 students take the test.
1 How many scored between 113 and 137?
0.68× 1200 = 816
2 How many scored above 125?
3 How many students scored less than 89?
Bernoulli Probability and the Normal Distribution Properties of the Normal Distribution Examples Conclusion
Applying the Empirical Rule
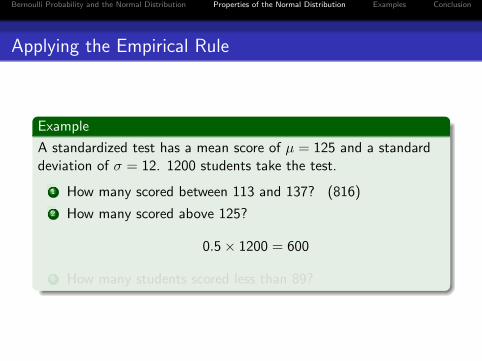
Example
A standardized test has a mean score of µ = 125 and a standarddeviation of σ = 12. 1200 students take the test.
1 How many scored between 113 and 137? (816)
2 How many scored above 125?
3 How many students scored less than 89?
Bernoulli Probability and the Normal Distribution Properties of the Normal Distribution Examples Conclusion
Applying the Empirical Rule
Example
A standardized test has a mean score of µ = 125 and a standarddeviation of σ = 12. 1200 students take the test.
1 How many scored between 113 and 137? (816)
2 How many scored above 125?
0.5× 1200 = 600
3 How many students scored less than 89?
Bernoulli Probability and the Normal Distribution Properties of the Normal Distribution Examples Conclusion
Applying the Empirical Rule
Example
A standardized test has a mean score of µ = 125 and a standarddeviation of σ = 12. 1200 students take the test.
1 How many scored between 113 and 137? (816)
2 How many scored above 125? (600)
3 How many students scored less than 89?
Bernoulli Probability and the Normal Distribution Properties of the Normal Distribution Examples Conclusion
Applying the Empirical Rule
Example
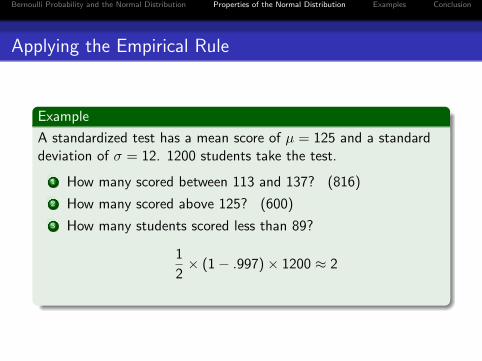
A standardized test has a mean score of µ = 125 and a standarddeviation of σ = 12. 1200 students take the test.
1 How many scored between 113 and 137? (816)
2 How many scored above 125? (600)
3 How many students scored less than 89?
1
2× (1− .997)× 1200 ≈ 2
Bernoulli Probability and the Normal Distribution Properties of the Normal Distribution Examples Conclusion
Other Shapes
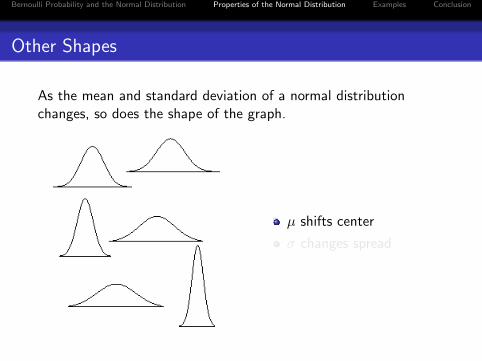
As the mean and standard deviation of a normal distributionchanges, so does the shape of the graph.
µ shifts center
σ changes spread
Bernoulli Probability and the Normal Distribution Properties of the Normal Distribution Examples Conclusion
Other Shapes
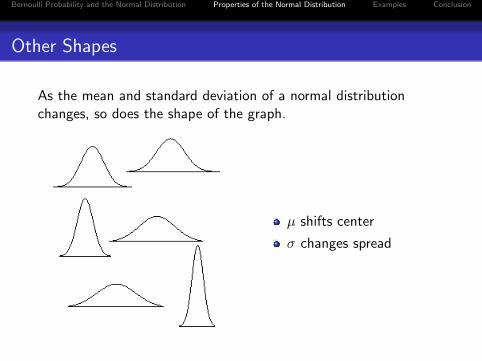
As the mean and standard deviation of a normal distributionchanges, so does the shape of the graph.
µ shifts center
σ changes spread
Bernoulli Probability and the Normal Distribution Properties of the Normal Distribution Examples Conclusion
Other Shapes
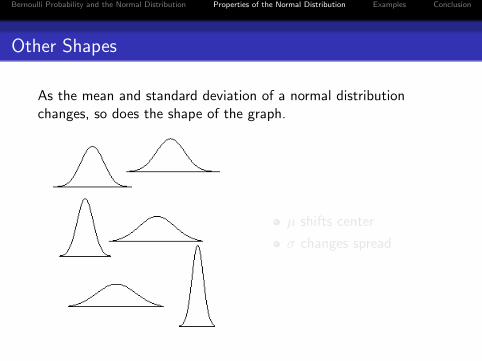
As the mean and standard deviation of a normal distributionchanges, so does the shape of the graph.
µ shifts center
σ changes spread
Bernoulli Probability and the Normal Distribution Properties of the Normal Distribution Examples Conclusion
Other Shapes
As the mean and standard deviation of a normal distributionchanges, so does the shape of the graph.
µ shifts center
σ changes spread
Bernoulli Probability and the Normal Distribution Properties of the Normal Distribution Examples Conclusion
Using the z-score
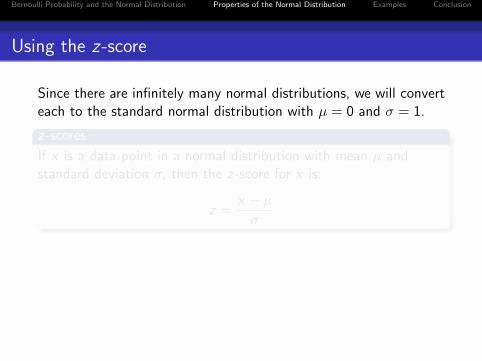
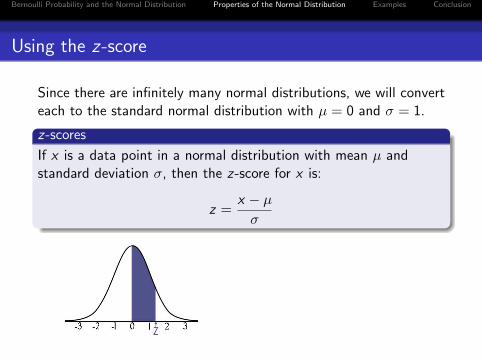
Since there are infinitely many normal distributions, we will converteach to the standard normal distribution with µ = 0 and σ = 1.
z-scores
If x is a data point in a normal distribution with mean µ andstandard deviation σ, then the z-score for x is:
z =x − µ
σ
Bernoulli Probability and the Normal Distribution Properties of the Normal Distribution Examples Conclusion
Using the z-score
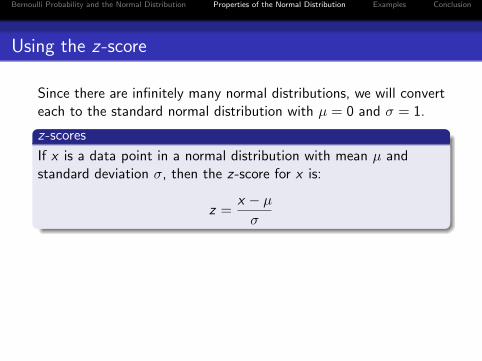
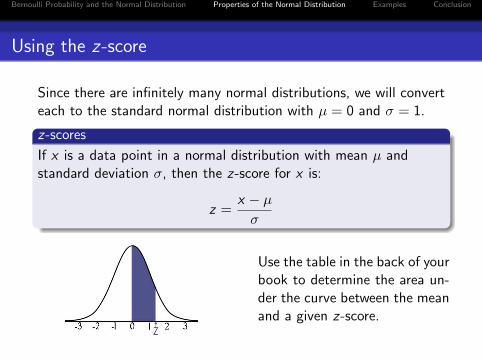
Since there are infinitely many normal distributions, we will converteach to the standard normal distribution with µ = 0 and σ = 1.
z-scores
If x is a data point in a normal distribution with mean µ andstandard deviation σ, then the z-score for x is:
z =x − µ
σ
Use the table in the back of yourbook to determine the area un-der the curve between the meanand a given z-score.
Bernoulli Probability and the Normal Distribution Properties of the Normal Distribution Examples Conclusion
Outline
1 Bernoulli Probability and the Normal Distribution
2 Properties of the Normal Distribution
3 Examples
4 Conclusion
Bernoulli Probability and the Normal Distribution Properties of the Normal Distribution Examples Conclusion
Height of Fir Trees
Example
The height of fir trees in a certain forest follows a normaldistribution with µ = 240 and σ = 40 inches.
Bernoulli Probability and the Normal Distribution Properties of the Normal Distribution Examples Conclusion
Height of Fir Trees
Example
The height of fir trees in a certain forest follows a normaldistribution with µ = 240 and σ = 40 inches.
(a) How many standard deviations away from the mean are treeswhich are 300 and 120 inches tall?
Bernoulli Probability and the Normal Distribution Properties of the Normal Distribution Examples Conclusion
Height of Fir Trees
Example
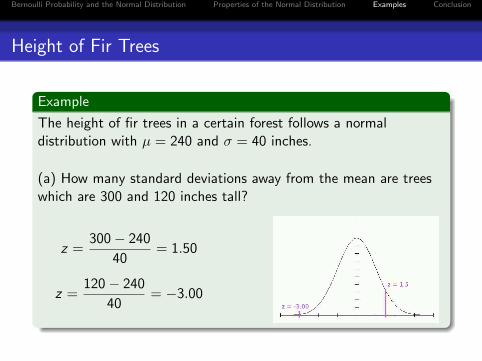
The height of fir trees in a certain forest follows a normaldistribution with µ = 240 and σ = 40 inches.
(a) How many standard deviations away from the mean are treeswhich are 300 and 120 inches tall?
z =300− 240
40= 1.50
z =120− 240
40= −3.00
Bernoulli Probability and the Normal Distribution Properties of the Normal Distribution Examples Conclusion
Height of Fir Trees
Example
The height of fir trees in a certain forest follows a normaldistribution with µ = 240 and σ = 40 inches.
(b) What percent of the trees are between 240 and 300 inches tall?
Bernoulli Probability and the Normal Distribution Properties of the Normal Distribution Examples Conclusion
Height of Fir Trees
Example
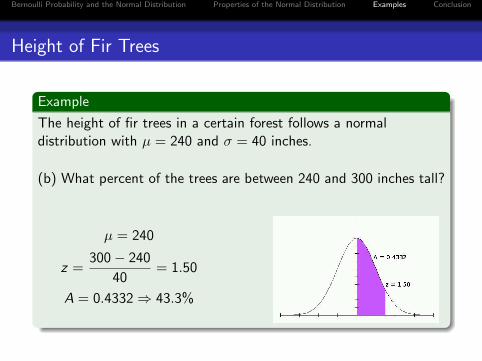
The height of fir trees in a certain forest follows a normaldistribution with µ = 240 and σ = 40 inches.
(b) What percent of the trees are between 240 and 300 inches tall?
µ = 240
z =300− 240
40= 1.50
A = 0.4332⇒ 43.3%
Bernoulli Probability and the Normal Distribution Properties of the Normal Distribution Examples Conclusion
Height of Fir Trees
Example
The height of fir trees in a certain forest follows a normaldistribution with µ = 240 and σ = 40 inches.
(c) What percent of the trees are greater than 300 inches tall?
Bernoulli Probability and the Normal Distribution Properties of the Normal Distribution Examples Conclusion
Height of Fir Trees
Example
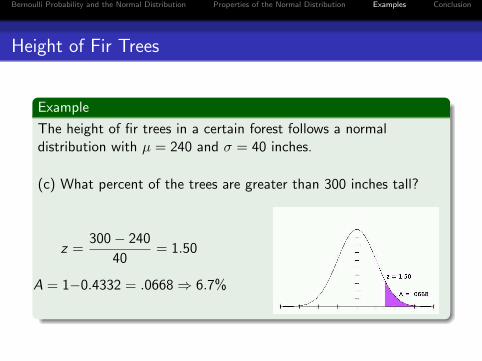
The height of fir trees in a certain forest follows a normaldistribution with µ = 240 and σ = 40 inches.
(c) What percent of the trees are greater than 300 inches tall?
z =300− 240
40= 1.50
A = 1−0.4332 = .0668⇒ 6.7%
Bernoulli Probability and the Normal Distribution Properties of the Normal Distribution Examples Conclusion
Height of Fir Trees
Example
The height of fir trees in a certain forest follows a normaldistribution with µ = 240 and σ = 40 inches.
(d) If you choose a tree at random, what is the probability it isbetween 225 and 275 inches tall?
Bernoulli Probability and the Normal Distribution Properties of the Normal Distribution Examples Conclusion
Height of Fir Trees
Example
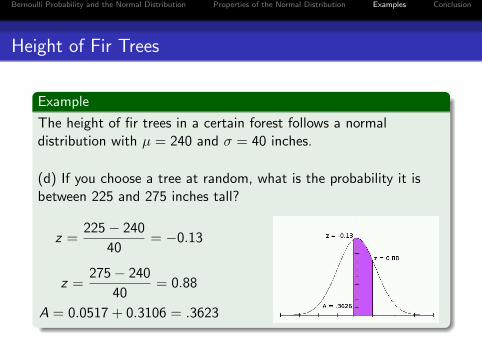
The height of fir trees in a certain forest follows a normaldistribution with µ = 240 and σ = 40 inches.
(d) If you choose a tree at random, what is the probability it isbetween 225 and 275 inches tall?
z =225− 240
40= −0.13
z =275− 240
40= 0.88
A = 0.0517 + 0.3106 = .3623
Bernoulli Probability and the Normal Distribution Properties of the Normal Distribution Examples Conclusion
Approximating the Binomial Distribution
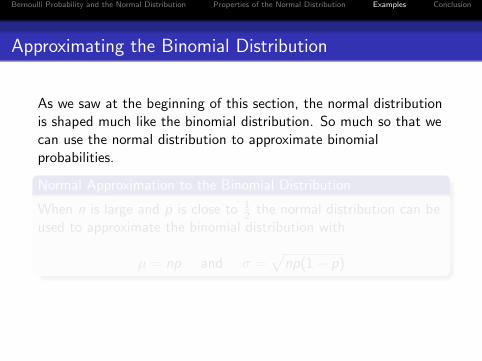
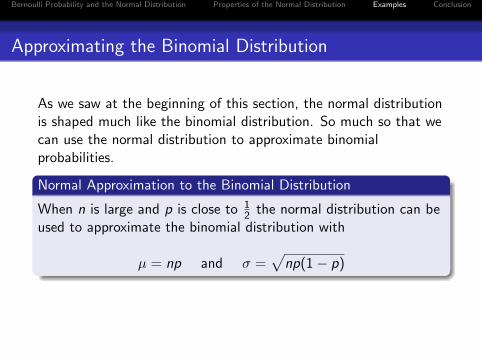
As we saw at the beginning of this section, the normal distributionis shaped much like the binomial distribution. So much so that wecan use the normal distribution to approximate binomialprobabilities.
Normal Approximation to the Binomial Distribution
When n is large and p is close to 12 the normal distribution can be
used to approximate the binomial distribution with
µ = np and σ =√
np(1− p)
Bernoulli Probability and the Normal Distribution Properties of the Normal Distribution Examples Conclusion
Approximating the Binomial Distribution
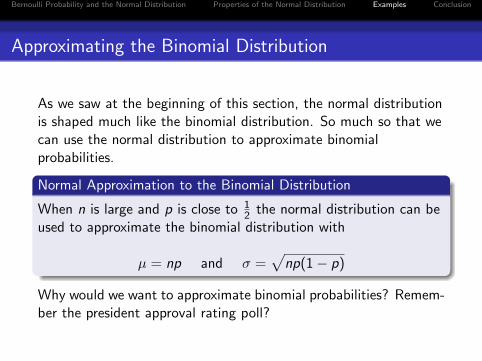
As we saw at the beginning of this section, the normal distributionis shaped much like the binomial distribution. So much so that wecan use the normal distribution to approximate binomialprobabilities.
Normal Approximation to the Binomial Distribution
When n is large and p is close to 12 the normal distribution can be
used to approximate the binomial distribution with
µ = np and σ =√
np(1− p)
Why would we want to approximate binomial probabilities? Remem-ber the president approval rating poll?
Bernoulli Probability and the Normal Distribution Properties of the Normal Distribution Examples Conclusion
Presidential Survey Question
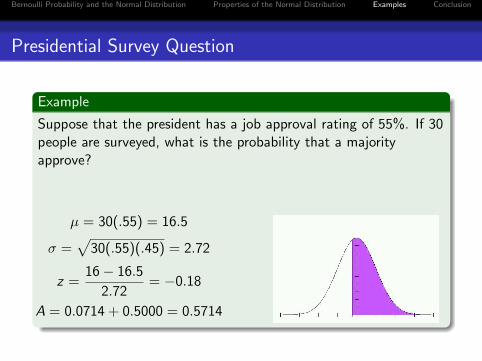
Example
Suppose that the president has a job approval rating of 55%. If 30people are surveyed, what is the probability that a majorityapprove?
Bernoulli Probability and the Normal Distribution Properties of the Normal Distribution Examples Conclusion
Presidential Survey Question
Example
Suppose that the president has a job approval rating of 55%. If 30people are surveyed, what is the probability that a majorityapprove?
µ = 30(.55) = 16.5
σ =√
30(.55)(.45) = 2.72
z =16− 16.5
2.72= −0.18
A = 0.0714 + 0.5000 = 0.5714
Bernoulli Probability and the Normal Distribution Properties of the Normal Distribution Examples Conclusion
Presidential Survey Question, Part II
Example
In the same survey, find the probability that:
1 Between 18 and 25 people approve.
2 All but 4 people surveyed approve.
Bernoulli Probability and the Normal Distribution Properties of the Normal Distribution Examples Conclusion
Presidential Survey Question, Part II
Example
In the same survey, find the probability that:
1 Between 18 and 25 people approve.
2 All but 4 people surveyed approve.
Bernoulli Probability and the Normal Distribution Properties of the Normal Distribution Examples Conclusion
Presidential Survey Question, Part II
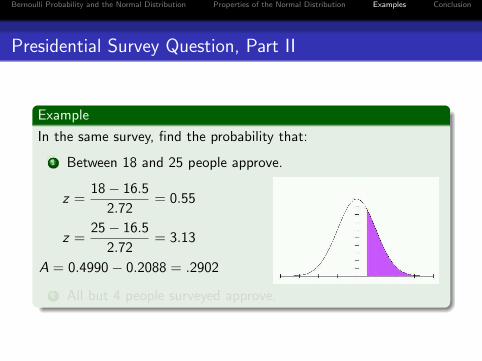
Example
In the same survey, find the probability that:
1 Between 18 and 25 people approve.
z =18− 16.5
2.72= 0.55
z =25− 16.5
2.72= 3.13
A = 0.4990− 0.2088 = .2902
2 All but 4 people surveyed approve.
Bernoulli Probability and the Normal Distribution Properties of the Normal Distribution Examples Conclusion
Presidential Survey Question, Part II
Example
In the same survey, find the probability that:
1 Between 18 and 25 people approve.
2 All but 4 people surveyed approve.
Bernoulli Probability and the Normal Distribution Properties of the Normal Distribution Examples Conclusion
Presidential Survey Question, Part II
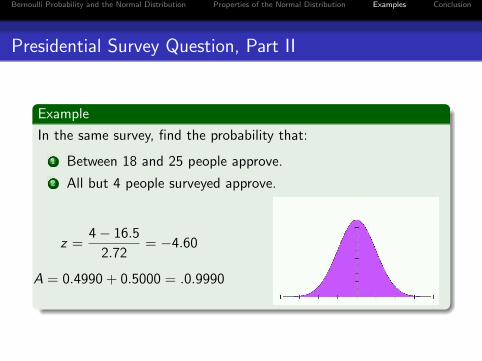
Example
In the same survey, find the probability that:
1 Between 18 and 25 people approve.
2 All but 4 people surveyed approve.
z =4− 16.5
2.72= −4.60
A = 0.4990 + 0.5000 = .0.9990
Bernoulli Probability and the Normal Distribution Properties of the Normal Distribution Examples Conclusion
Outline
1 Bernoulli Probability and the Normal Distribution
2 Properties of the Normal Distribution
3 Examples
4 Conclusion
Bernoulli Probability and the Normal Distribution Properties of the Normal Distribution Examples Conclusion
Important Concepts
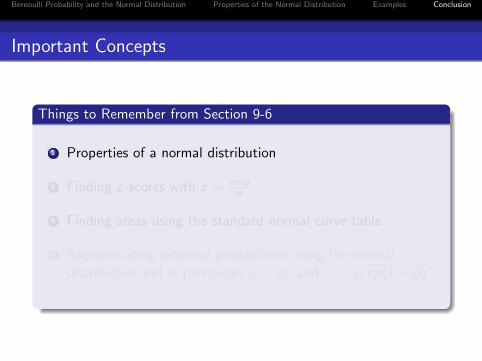
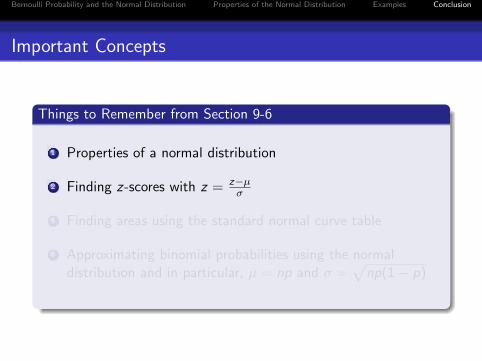
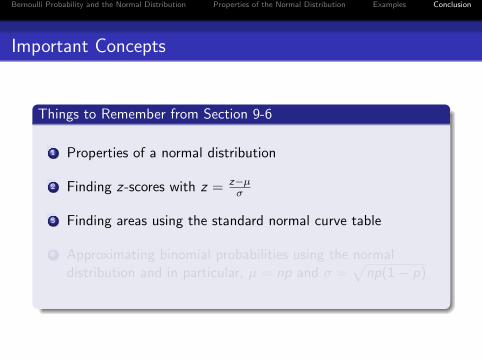
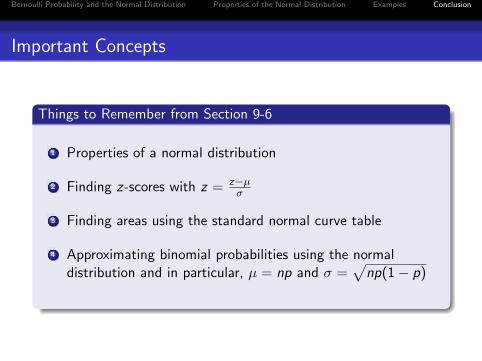
Things to Remember from Section 9-6
1 Properties of a normal distribution
2 Finding z-scores with z = z−µσ
3 Finding areas using the standard normal curve table
4 Approximating binomial probabilities using the normaldistribution and in particular, µ = np and σ =
√np(1− p)
Bernoulli Probability and the Normal Distribution Properties of the Normal Distribution Examples Conclusion
Important Concepts
Things to Remember from Section 9-6
1 Properties of a normal distribution
2 Finding z-scores with z = z−µσ
3 Finding areas using the standard normal curve table
4 Approximating binomial probabilities using the normaldistribution and in particular, µ = np and σ =
√np(1− p)

Bernoulli Probability and the Normal Distribution Properties of the Normal Distribution Examples Conclusion
Next Time. . .
Next time we will review for Exam II. Exam II will cover sections7-4 through 9-6 in your text.
For next time
Review sections 7-4 through 9-6
Bernoulli Probability and the Normal Distribution Properties of the Normal Distribution Examples Conclusion
Next Time. . .
Next time we will review for Exam II. Exam II will cover sections7-4 through 9-6 in your text.
For next time
Review sections 7-4 through 9-6