Embed Size (px)
Citation preview
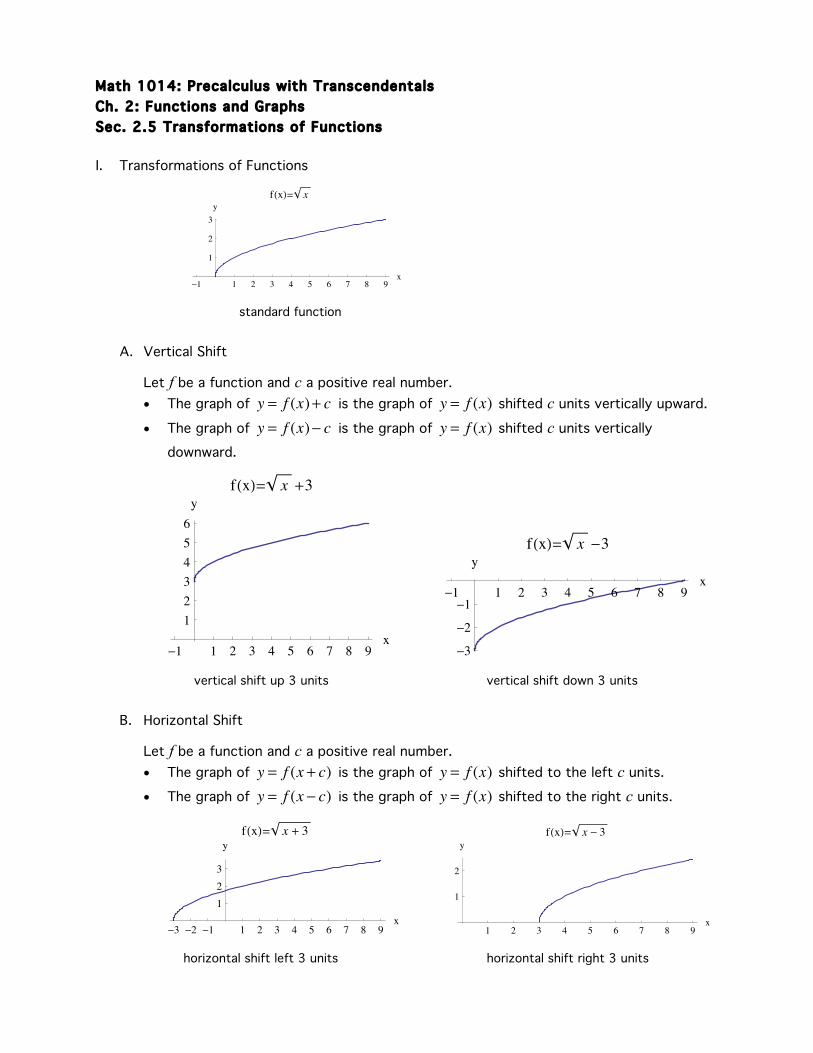
Math 1014: Precalculus with Transcendentals Ch. 2: Functions and Graphs Sec. 2.5 Transformations of Functions I. Transformations of Functions
-1 1 2 3 4 5 6 7 8 9x
1
2
3y
fHxL= x
standard function
A. Vertical Shift
Let f be a function and c a positive real number. • The graph of y = f (x)+ c is the graph of y = f (x) shifted c units vertically upward. • The graph of y = f (x)− c is the graph of y = f (x) shifted c units vertically
downward.
-1 1 2 3 4 5 6 7 8 9x
123456y
fHxL= x +3
-1 1 2 3 4 5 6 7 8 9x
-3
-2
-1
yfHxL= x -3
vertical shift up 3 units vertical shift down 3 units B. Horizontal Shift
Let f be a function and c a positive real number. • The graph of y = f (x + c) is the graph of y = f (x) shifted to the left c units. • The graph of y = f (x − c) is the graph of y = f (x) shifted to the right c units.
-3 -2 -1 1 2 3 4 5 6 7 8 9x
123
yfHxL= x + 3
1 2 3 4 5 6 7 8 9x
1
2
yfHxL= x - 3
horizontal shift left 3 units horizontal shift right 3 units
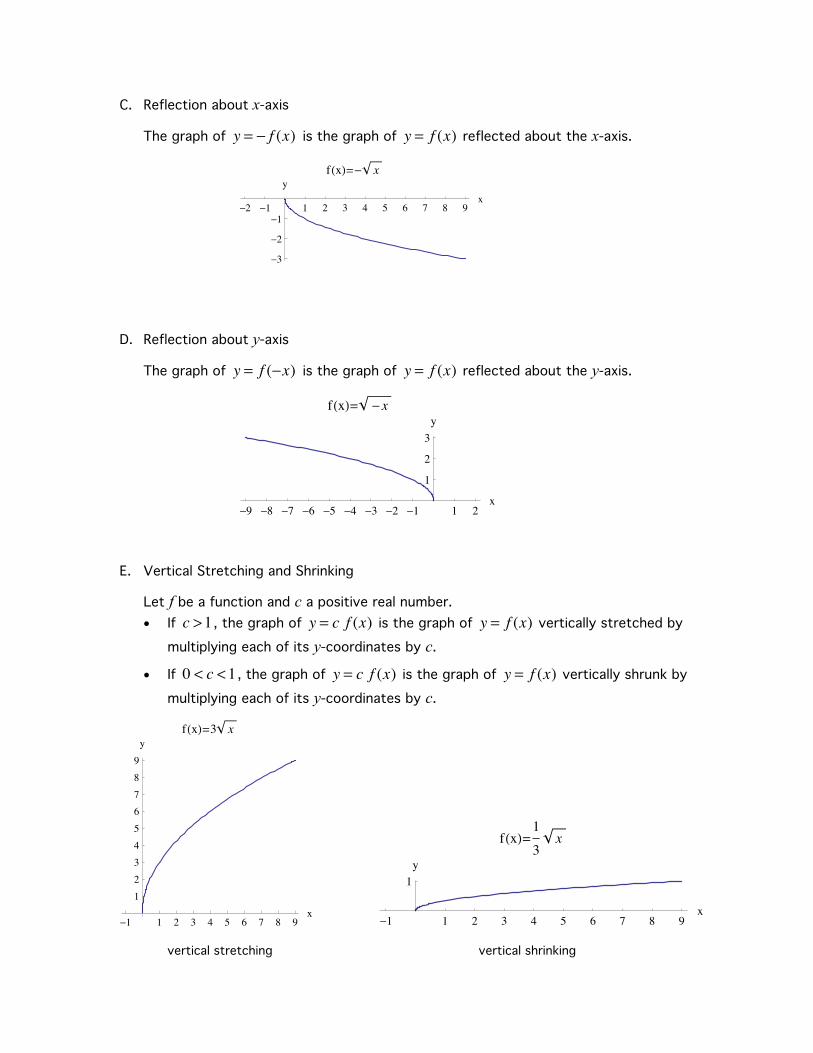
C. Reflection about x-axis
The graph of y = − f (x) is the graph of y = f (x) reflected about the x-axis.
-2 -1 1 2 3 4 5 6 7 8 9x
-3
-2
-1
yfHxL=- x
D. Reflection about y-axis
The graph of y = f (−x) is the graph of y = f (x) reflected about the y-axis.
-9 -8 -7 -6 -5 -4 -3 -2 -1 1 2x
1
2
3y
fHxL= -x
E. Vertical Stretching and Shrinking
Let f be a function and c a positive real number. • If c >1 , the graph of y = c f (x) is the graph of y = f (x) vertically stretched by
multiplying each of its y-coordinates by c.
• If 0 < c <1 , the graph of y = c f (x) is the graph of y = f (x) vertically shrunk by multiplying each of its y-coordinates by c.
-1 1 2 3 4 5 6 7 8 9x
123456789y
fHxL=3 x
-1 1 2 3 4 5 6 7 8 9x
1y
fHxL=13
x
vertical stretching vertical shrinking
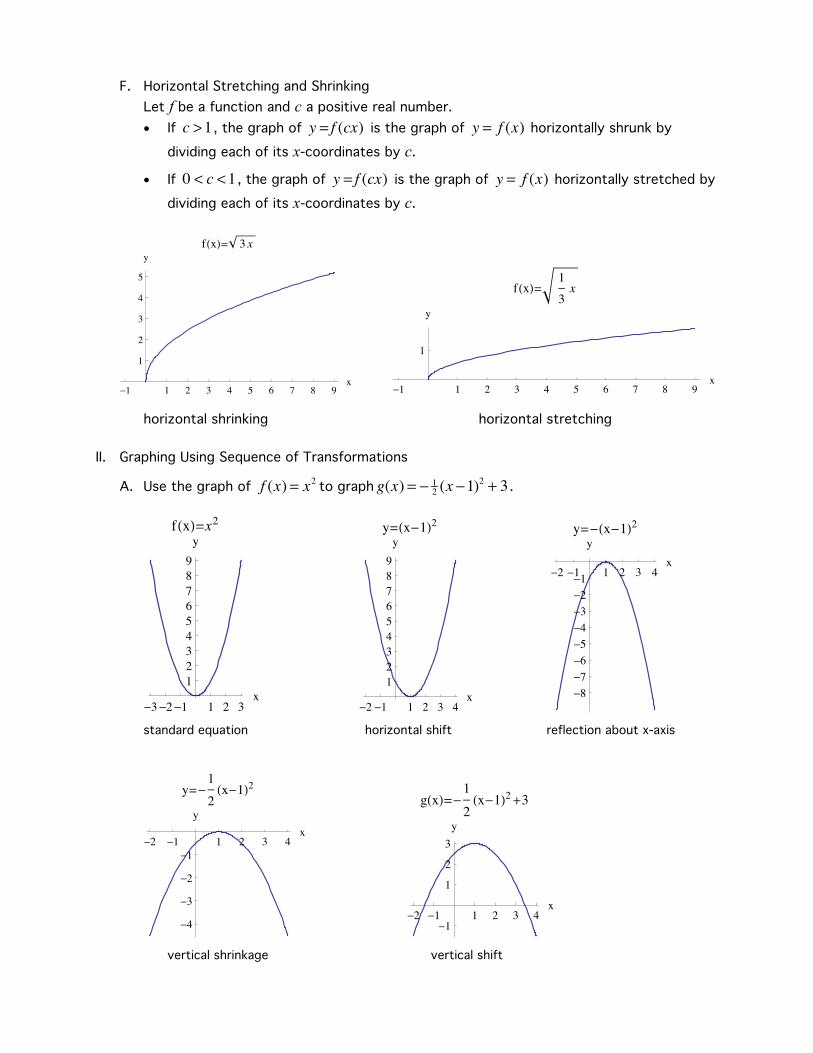
F. Horizontal Stretching and Shrinking Let f be a function and c a positive real number. • If c >1 , the graph of y = f (cx) is the graph of y = f (x) horizontally shrunk by
dividing each of its x-coordinates by c.
• If 0 < c <1 , the graph of y = f (cx) is the graph of y = f (x) horizontally stretched by dividing each of its x-coordinates by c.
-1 1 2 3 4 5 6 7 8 9x
1
2
3
4
5
yfHxL= 3 x
-1 1 2 3 4 5 6 7 8 9x
1
y
fHxL= 13x
horizontal shrinking horizontal stretching II. Graphing Using Sequence of Transformations
A. Use the graph of f (x) = x2 to graph g(x) = − 12 (x −1)
2 + 3 .
-3-2-1 1 2 3x
123456789y
fHxL=x2
-2-1 1 2 3 4x
123456789yy=Hx-1L2
-2 -1 1 2 3 4x
-8-7-6-5-4-3-2-1
yy=-Hx-1L2
standard equation horizontal shift reflection about x-axis
-2 -1 1 2 3 4x
-4
-3
-2
-1
y
y=-12Hx-1L2
-2 -1 1 2 3 4
x
-1
1
2
3y
gHxL=-12Hx-1L2+3
vertical shrinkage vertical shift
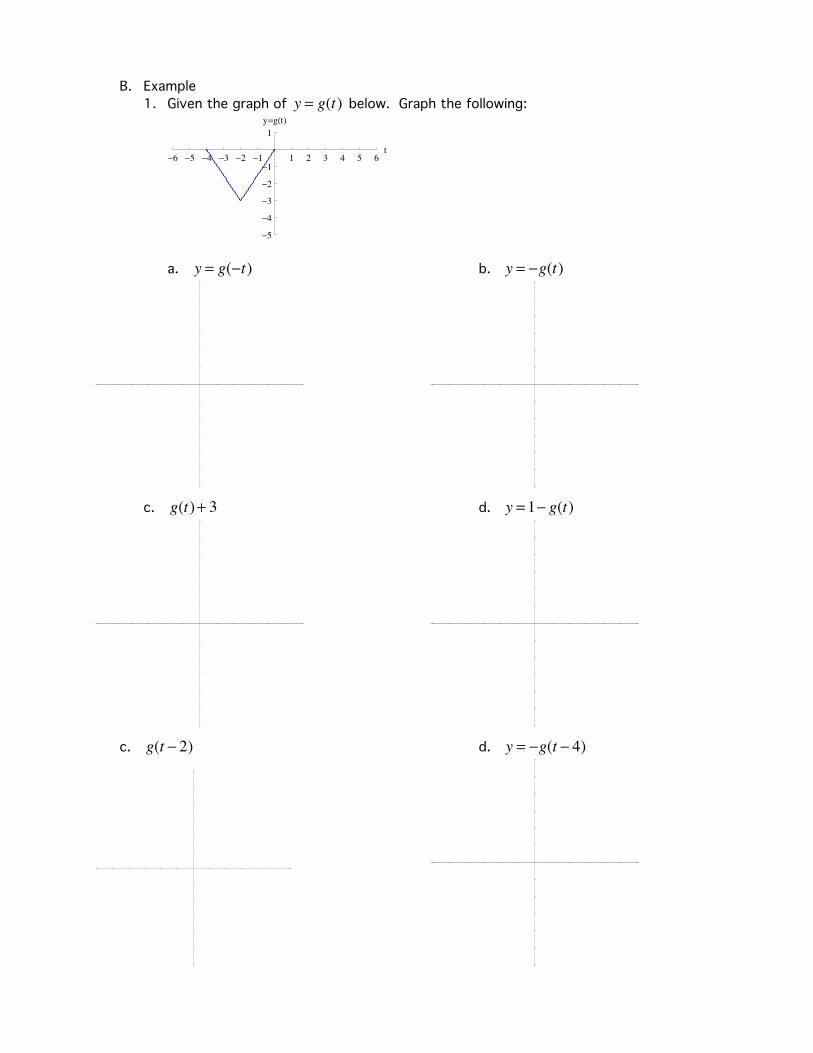
B. Example 1. Given the graph of y = g(t) below. Graph the following:
-6 -5 -4 -3 -2 -1 1 2 3 4 5 6t
-5
-4
-3
-2
-1
1y=gHtL
a. y = g(−t) b. y = −g(t)
c. g(t)+ 3 d. y = 1− g(t)
c. g(t − 2) d. y = −g(t − 4)
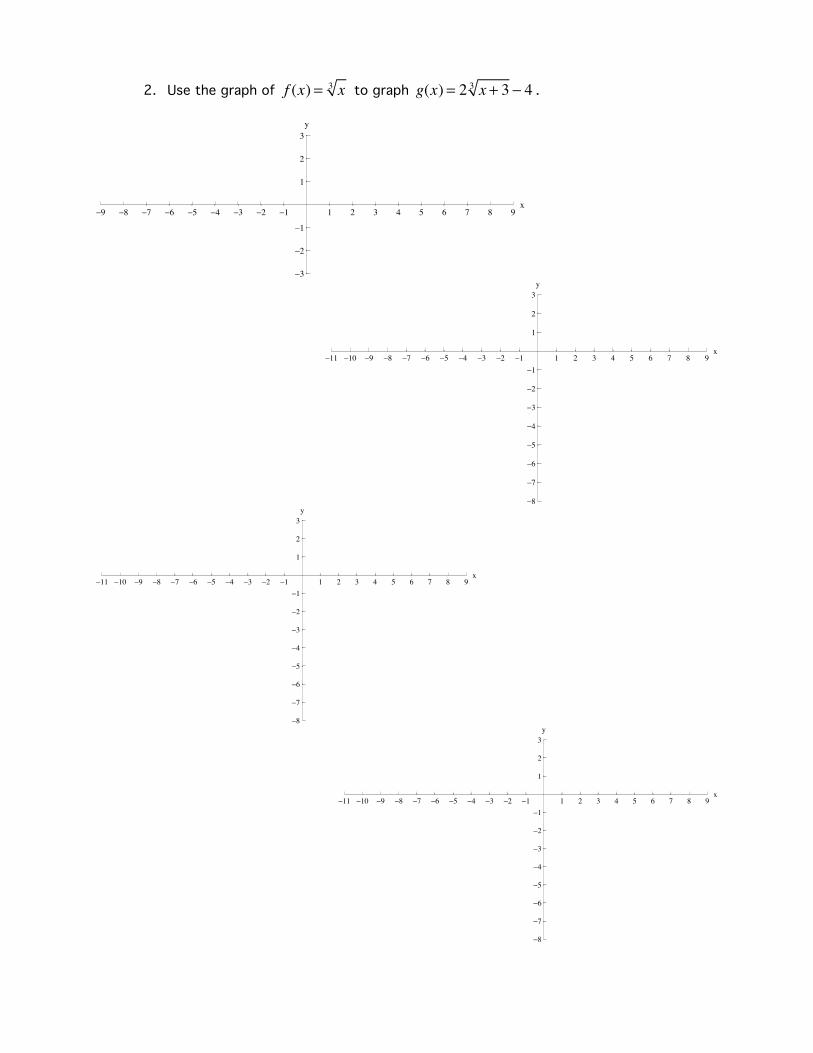
2. Use the graph of f (x) = x3 to graph g(x) = 2 x + 33 − 4 .
-9 -8 -7 -6 -5 -4 -3 -2 -1 1 2 3 4 5 6 7 8 9x
-3
-2
-1
1
2
3y
-11 -10 -9 -8 -7 -6 -5 -4 -3 -2 -1 1 2 3 4 5 6 7 8 9x
-8
-7
-6
-5
-4
-3
-2
-1
1
2
3y
-11 -10 -9 -8 -7 -6 -5 -4 -3 -2 -1 1 2 3 4 5 6 7 8 9x
-8
-7
-6
-5
-4
-3
-2
-1
1
2
3y
-11 -10 -9 -8 -7 -6 -5 -4 -3 -2 -1 1 2 3 4 5 6 7 8 9x
-8
-7
-6
-5
-4
-3
-2
-1
1
2
3y
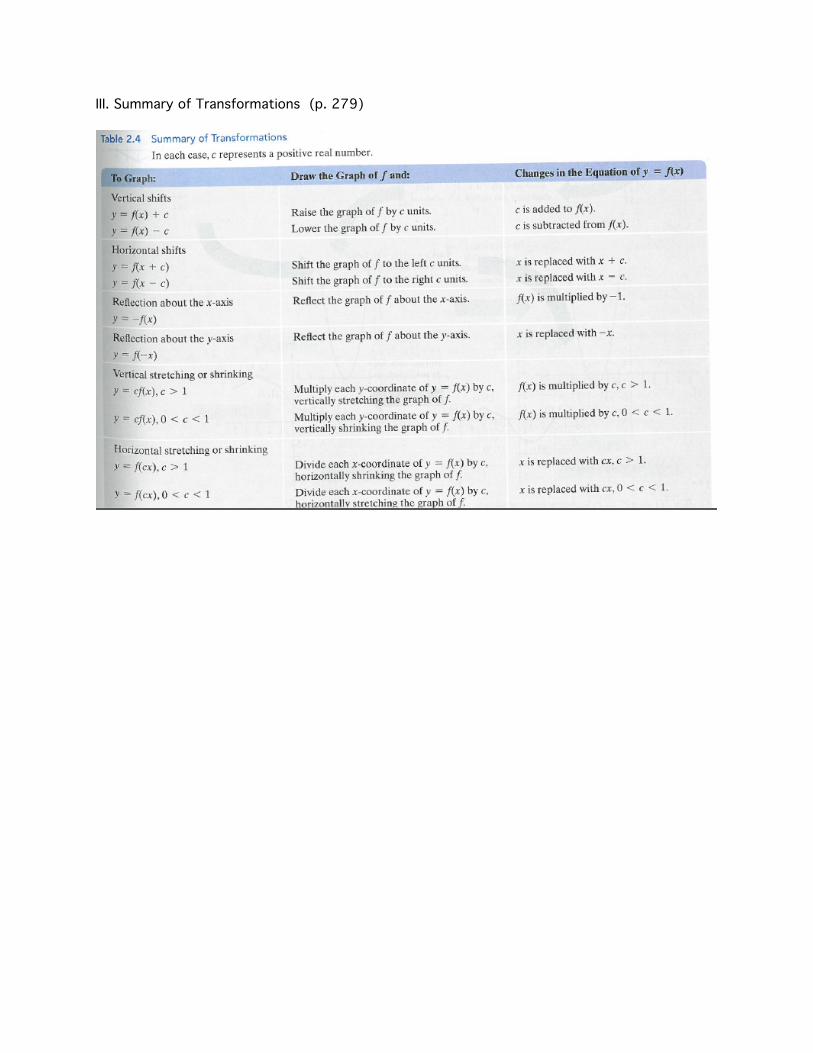
III. Summary of Transformations (p. 279)