Embed Size (px)
Citation preview
Maternity Locality Profiles
Presented at SEPHIG – 16 June 2015By
Ash More – Head of Public Health Intelligence & Nicola Higgins – Sr. Public Health Analyst
Buckinghamshire Public Health
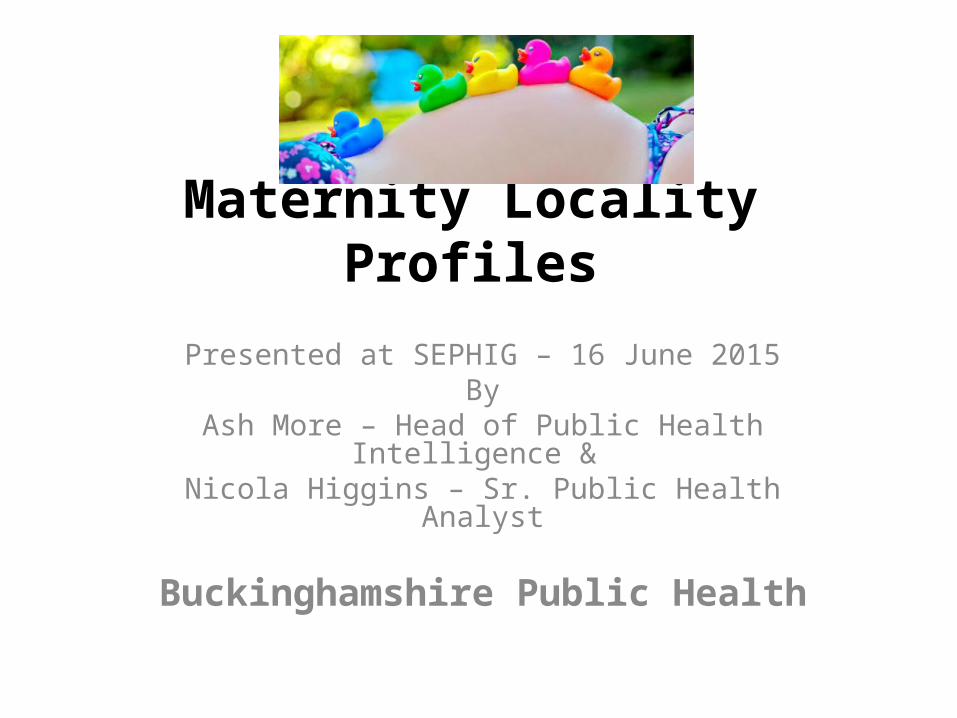
BackgroundGovernance in Buckinghamshire
Maternity Locality ProfilesRequested by this groupFollowing the Maternity
Needs Assessment
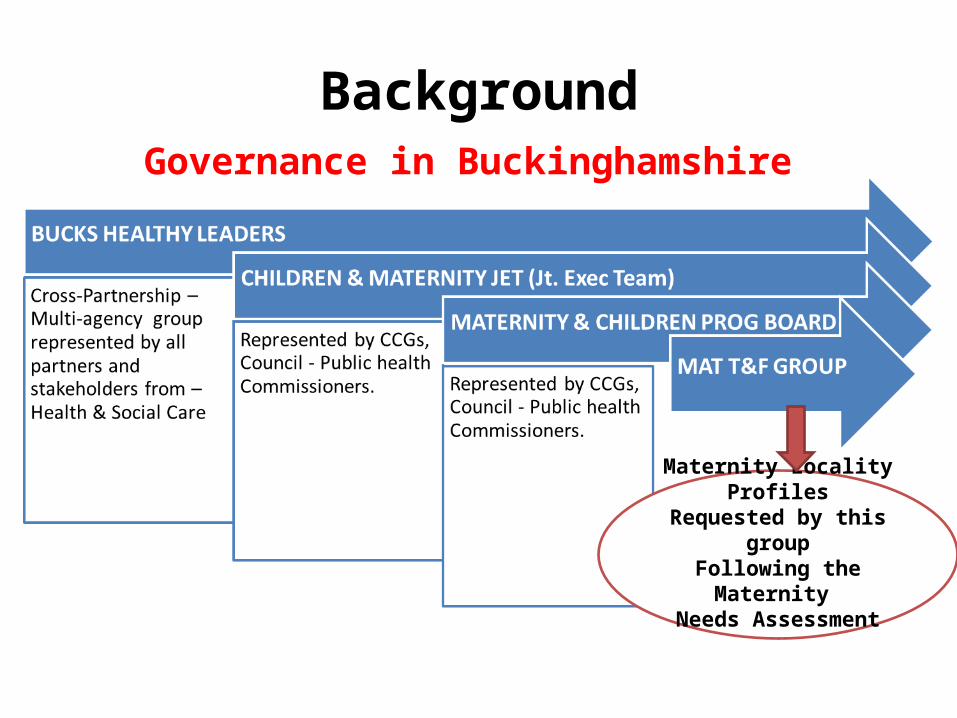
BUCKINGHAMSHIRE DISTRICT COUNCIL MAP
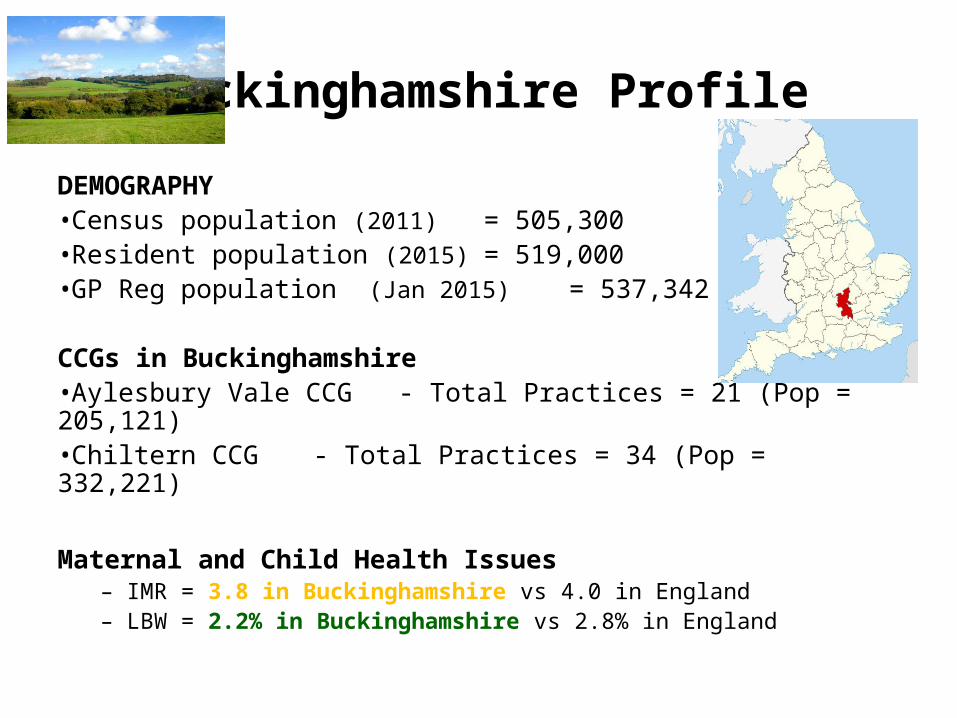
Buckinghamshire Profile
DEMOGRAPHY•Census population (2011) = 505,300 •Resident population (2015) = 519,000 •GP Reg population (Jan 2015) = 537,342
CCGs in Buckinghamshire •Aylesbury Vale CCG - Total Practices = 21 (Pop = 205,121)•Chiltern CCG - Total Practices = 34 (Pop = 332,221)
Maternal and Child Health Issues– IMR = 3.8 in Buckinghamshire vs 4.0 in England– LBW = 2.2% in Buckinghamshire vs 2.8% in England
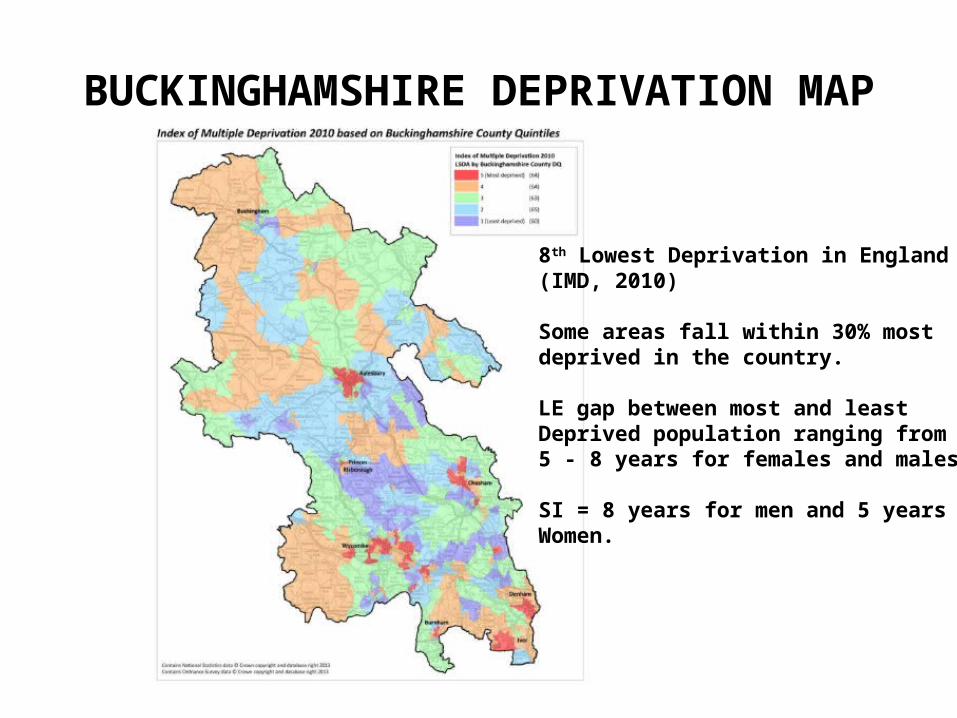
BUCKINGHAMSHIRE DEPRIVATION MAP
8th Lowest Deprivation in England (IMD, 2010)
Some areas fall within 30% most deprived in the country.
LE gap between most and least Deprived population ranging from 5 - 8 years for females and males
SI = 8 years for men and 5 years for Women.
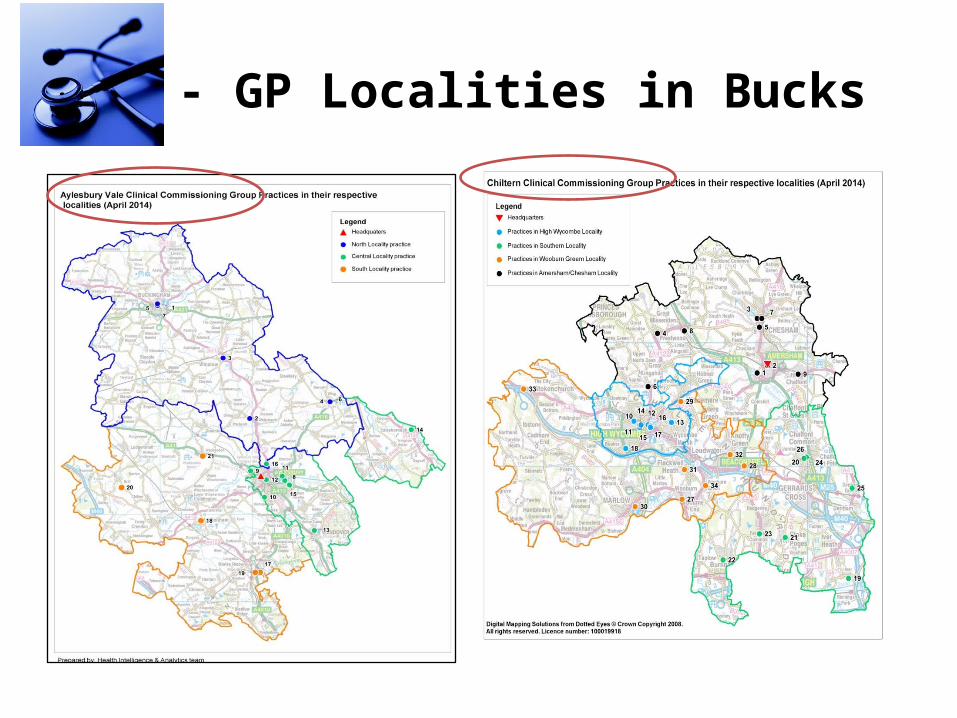
CCG - GP Localities in Bucks
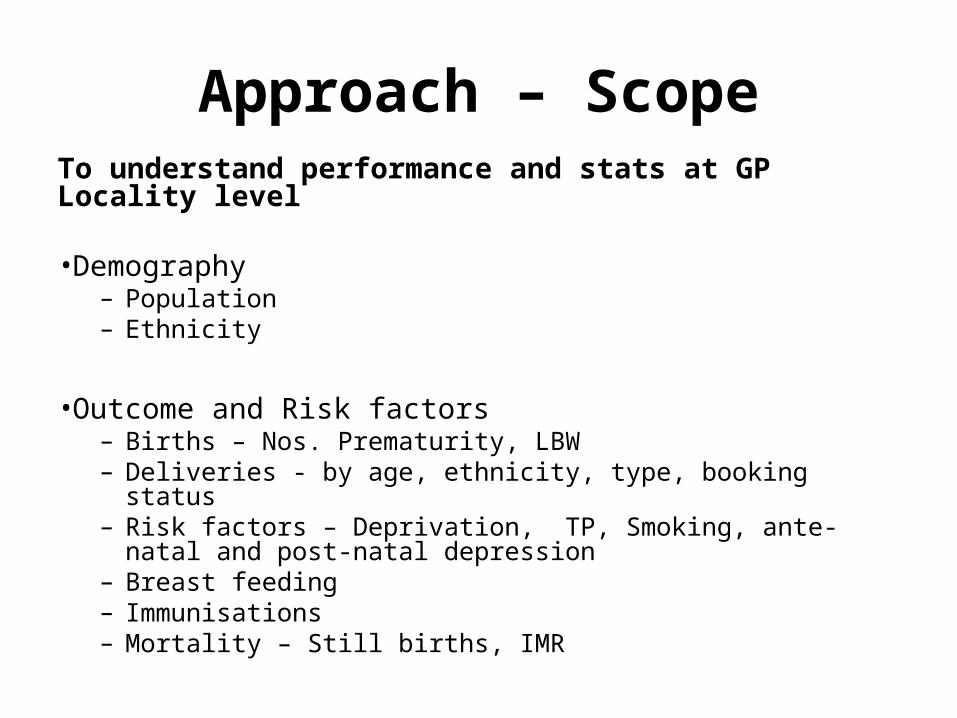
Approach – ScopeTo understand performance and stats at GP Locality level •Demography
– Population– Ethnicity
•Outcome and Risk factors– Births – Nos. Prematurity, LBW– Deliveries - by age, ethnicity, type, booking status– Risk factors – Deprivation, TP, Smoking, ante-natal and post-
natal depression– Breast feeding– Immunisations– Mortality – Still births, IMR
Methodology
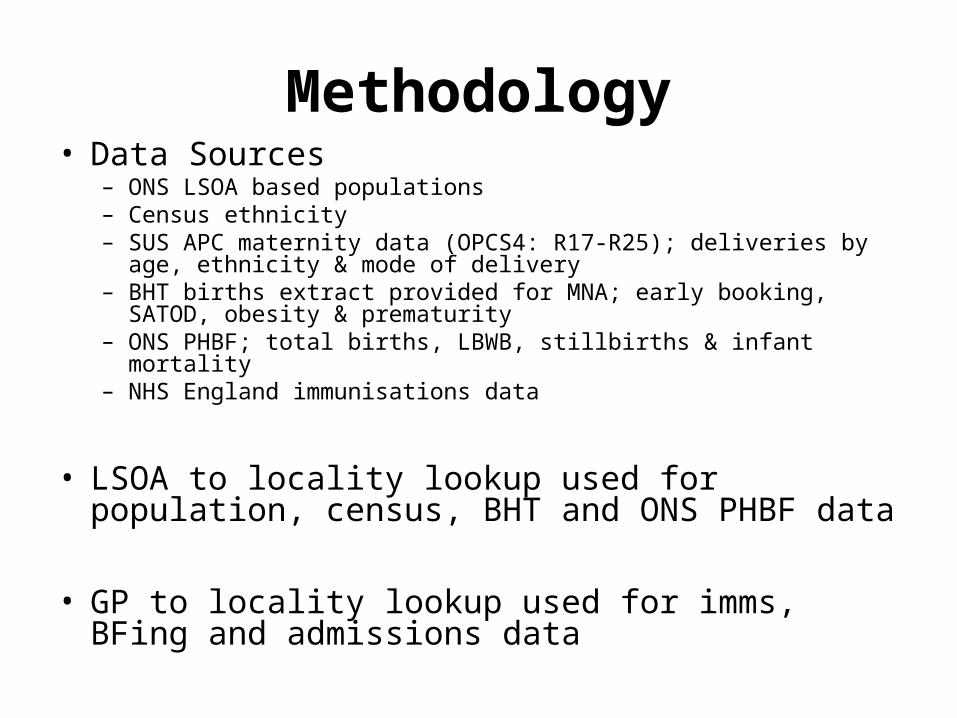
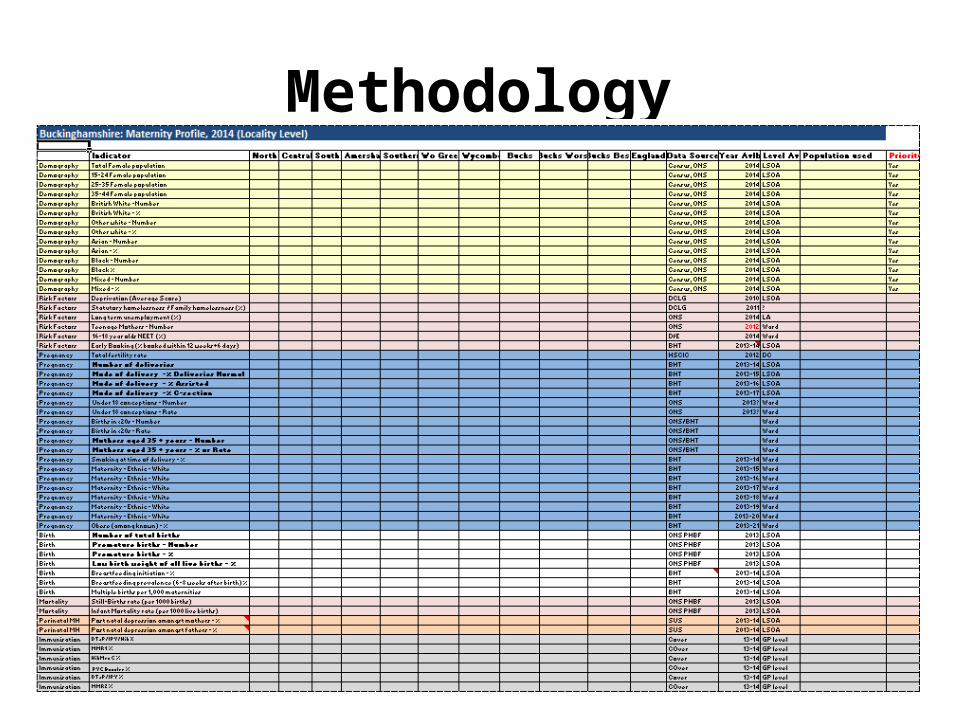
Methodology• Data Sources
– ONS LSOA based populations– Census ethnicity– SUS APC maternity data (OPCS4: R17-R25); deliveries by age, ethnicity &
mode of delivery– BHT births extract provided for MNA; early booking, SATOD, obesity &
prematurity– ONS PHBF; total births, LBWB, stillbirths & infant mortality– NHS England immunisations data
• LSOA to locality lookup used for population, census, BHT and ONS PHBF data
• GP to locality lookup used for imms, BFing and admissions data

Methodology• Spine chart v1
– Quartiles using 7 localities
– RAG rated based on being in the ‘worst’ quartile or ‘worst’ value, within the interquartile range or being in the ‘best’ quartile or ‘best’ value
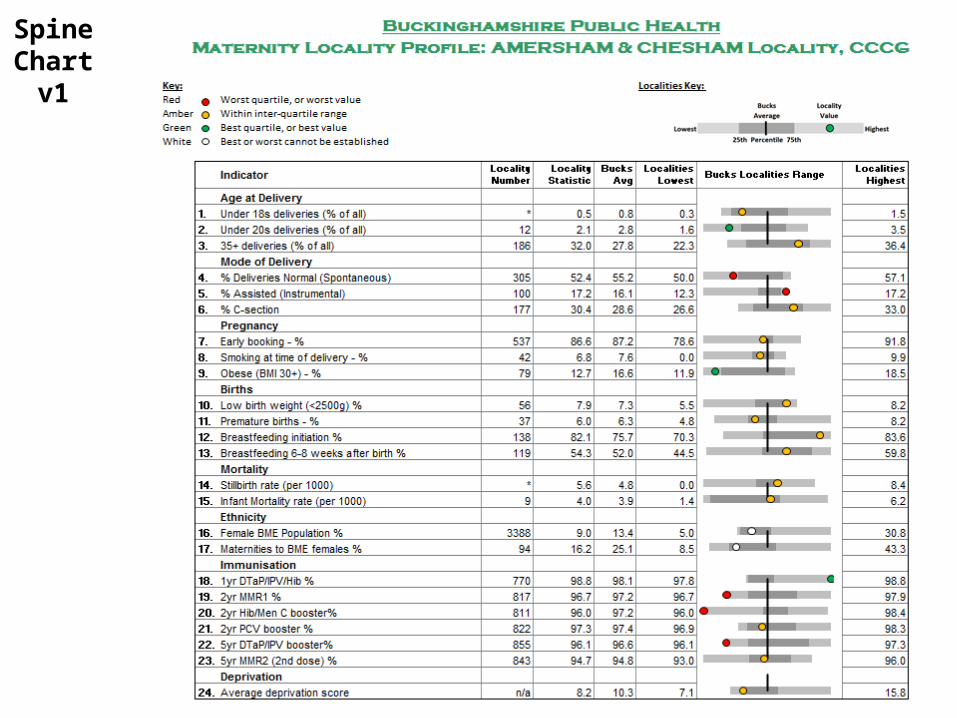
Spine Chart
v1
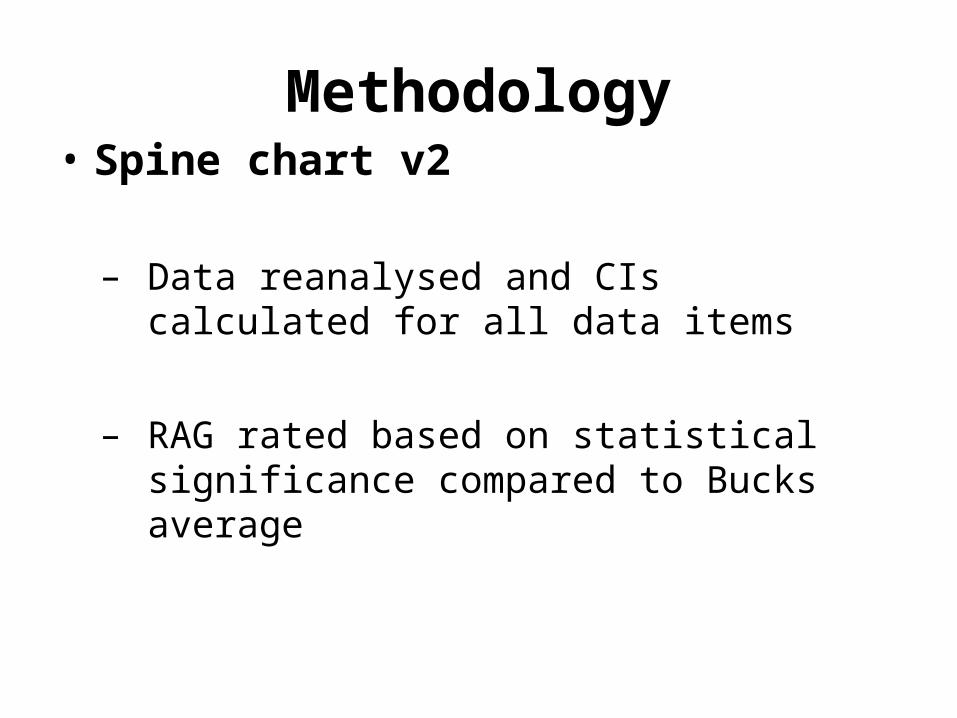
Methodology• Spine chart v2
– Data reanalysed and CIs calculated for all data items
– RAG rated based on statistical significance compared to Bucks average
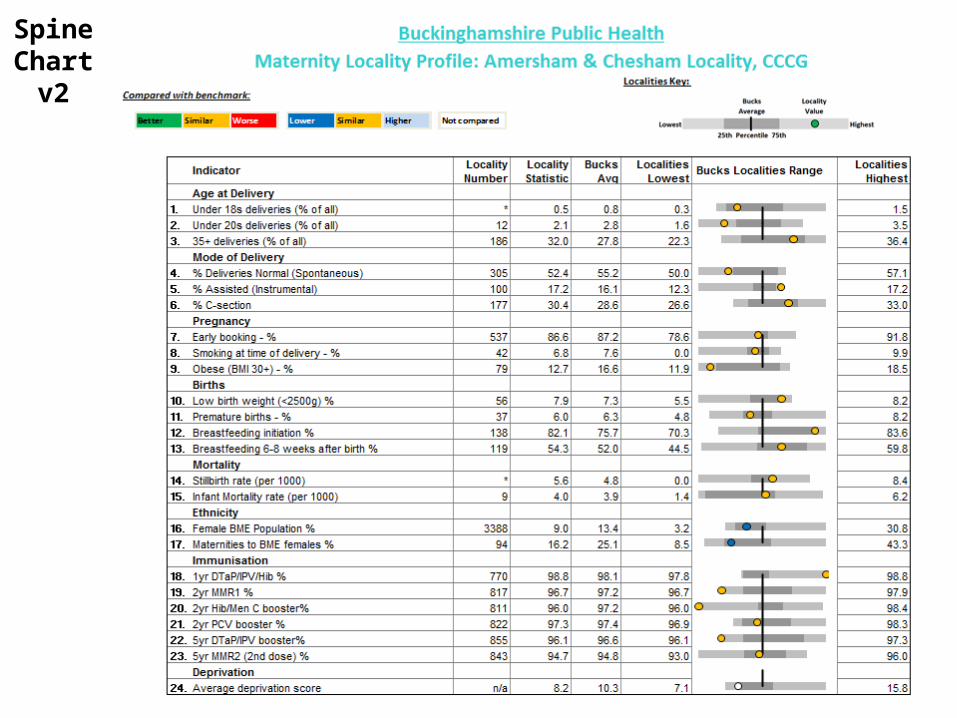
Spine Chart
v2
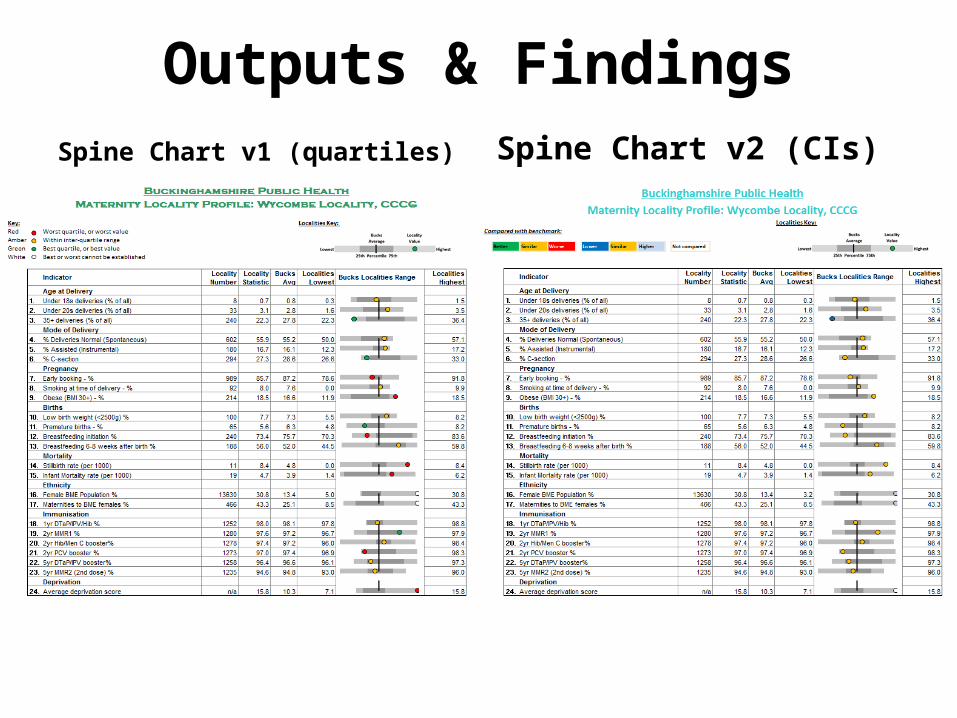
Outputs & FindingsSpine Chart v1 (quartiles) Spine Chart v2 (CIs)
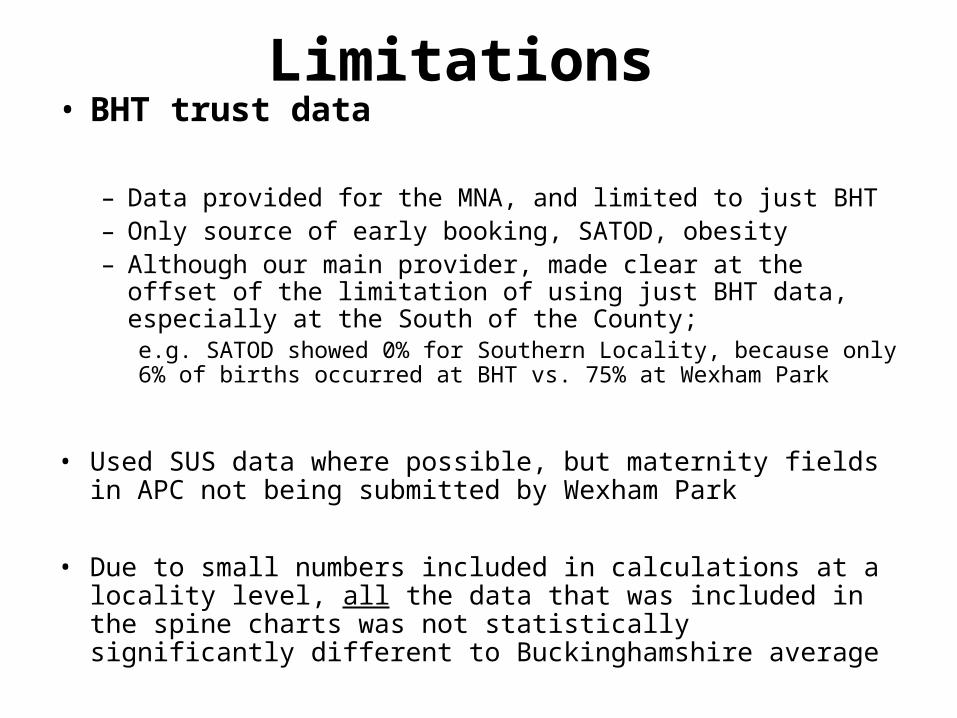
Limitations • BHT trust data
– Data provided for the MNA, and limited to just BHT– Only source of early booking, SATOD, obesity– Although our main provider, made clear at the offset of the
limitation of using just BHT data, especially at the South of the County;
e.g. SATOD showed 0% for Southern Locality, because only 6% of births occurred at BHT vs. 75% at Wexham Park
• Used SUS data where possible, but maternity fields in APC not being submitted by Wexham Park
• Due to small numbers included in calculations at a locality level, all the data that was included in the spine charts was not statistically significantly different to Buckinghamshire average
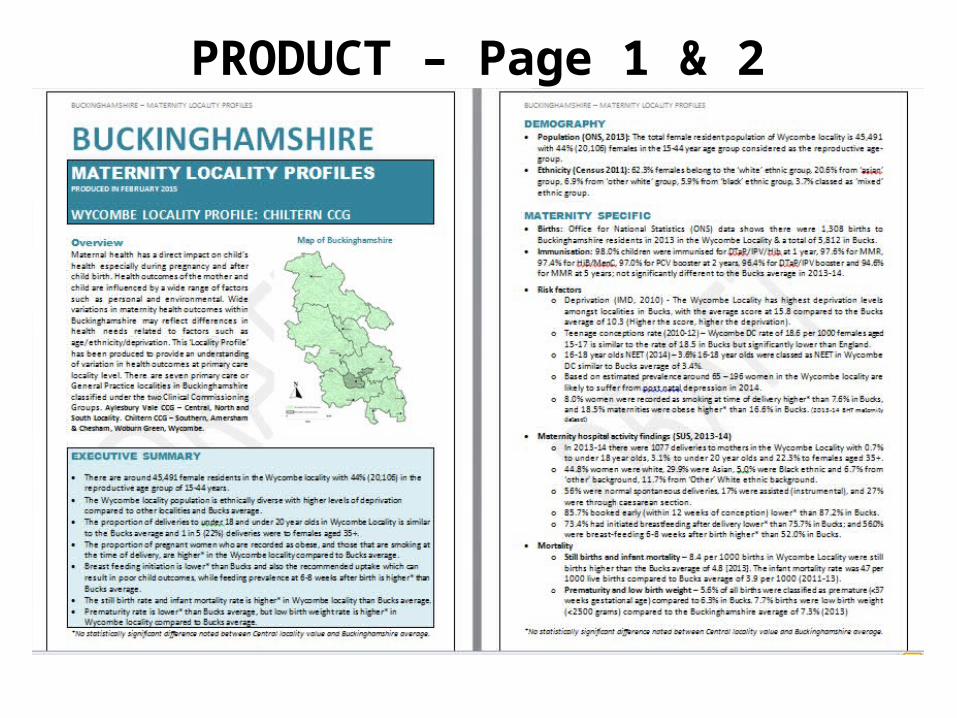
PRODUCT – Page 1 & 2
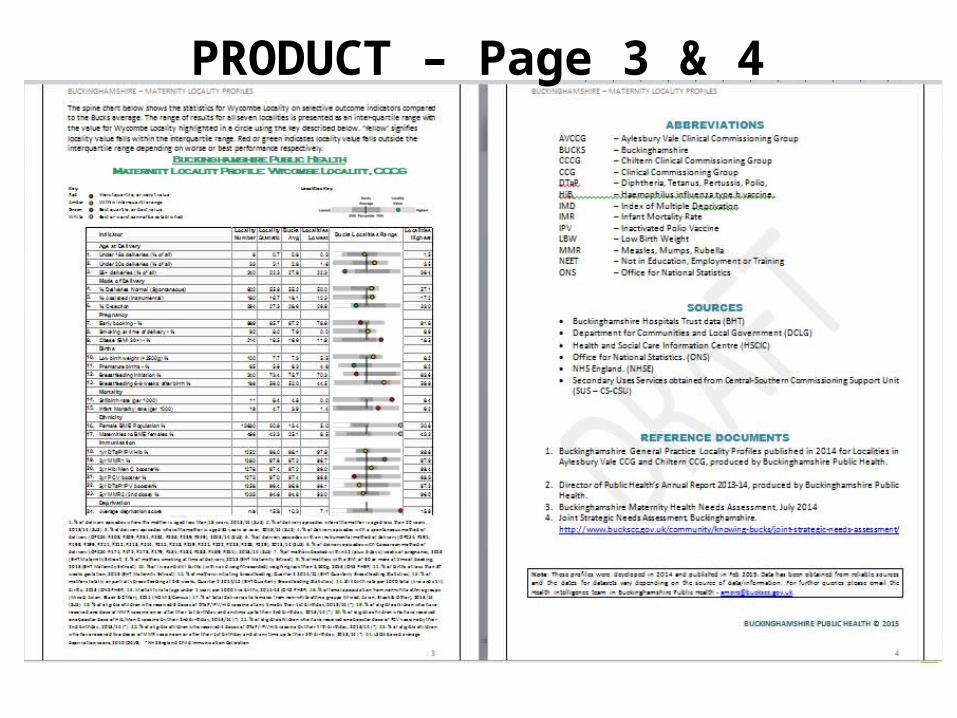
PRODUCT – Page 3 & 4
Challenges• Managing expectations within limited capacity (Started as a data
collation and ended up as profiles).
• Demanding and ambitious culture.
• Methodological dilemma: Utilising available intelligence in the best possible way – statistical methodology to present performance that will ensue action.
• Meaningful outputs to cater to a wide audience including clinicians, commissioners, public health professionals and lay persons.
Further Actions• Presenting findings to CCG Locality Groups to identify priority areas for
intervention over 2015-16
• LBW, IMR, Prematurity, Breast feeding, smoking in pregnancy are key areas alongside other priorities
• GP leads in each CCG for Maternity and Children to use the findings in developing the joint strategy
• Work will support development of CQUINS with local acute trust
• DPH is a sponsor for Maternity and Child health through the Health Bucks Leaders Group
• Findings will also support cross-partnership work with - CYP commissioners, Children’s centres, voluntary agencies etc.
Thank You