Embed Size (px)
Citation preview
Maternal, Newborn, and Child Health Indicators
1. Infant and Maternal Mortality
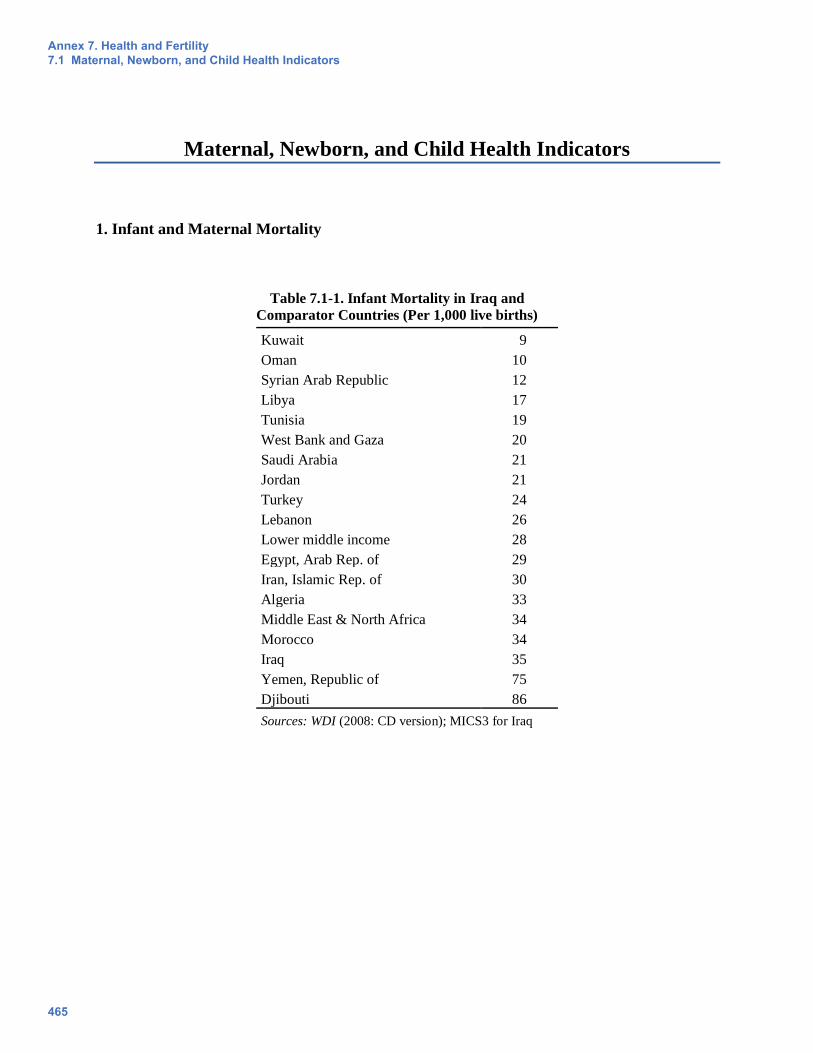
Table 7.1-1. Infant Mortality in Iraq and
Comparator Countries (Per 1,000 live births)
Kuwait 9
Oman 10
Syrian Arab Republic 12
Libya 17
Tunisia 19
West Bank and Gaza 20
Saudi Arabia 21
Jordan 21
Turkey 24
Lebanon 26
Lower middle income 28
Egypt, Arab Rep. of 29
Iran, Islamic Rep. of 30
Algeria 33
Middle East & North Africa 34
Morocco 34
Iraq 35
Yemen, Republic of 75
Djibouti 86
Sources: WDI (2008: CD version); MICS3 for Iraq
Annex 7. Health and Fertility 7.1 Maternal, Newborn, and Child Health Indicators
465
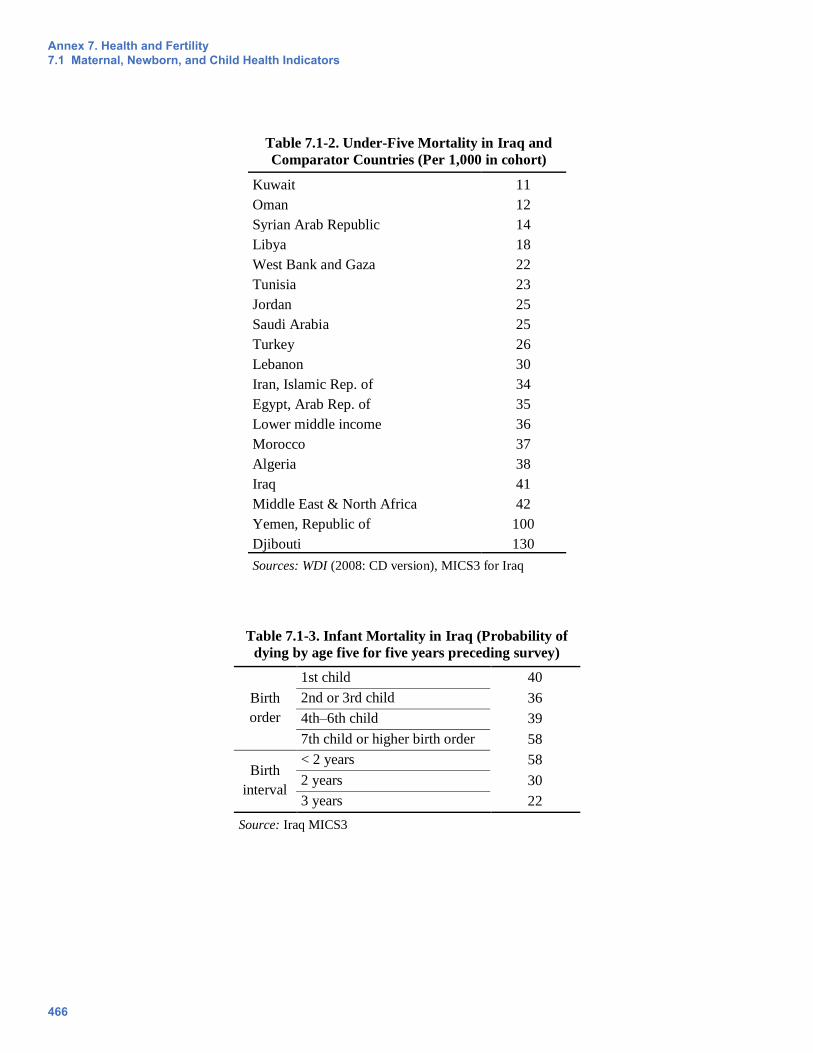
Table 7.1-2. Under-Five Mortality in Iraq and
Comparator Countries (Per 1,000 in cohort)
Kuwait 11
Oman 12
Syrian Arab Republic 14
Libya 18
West Bank and Gaza 22
Tunisia 23
Jordan 25
Saudi Arabia 25
Turkey 26
Lebanon 30
Iran, Islamic Rep. of 34
Egypt, Arab Rep. of 35
Lower middle income 36
Morocco 37
Algeria 38
Iraq 41
Middle East & North Africa 42
Yemen, Republic of 100
Djibouti 130
Sources: WDI (2008: CD version), MICS3 for Iraq
Table 7.1-3. Infant Mortality in Iraq (Probability of dying by age five for five years preceding survey)
Birth
order
1st child 40
2nd or 3rd child 36
4th–6th child 39
7th child or higher birth order 58
Birth
interval
< 2 years 58
2 years 30
3 years 22
Source: Iraq MICS3
Annex 7. Health and Fertility 7.1 Maternal, Newborn, and Child Health Indicators
466
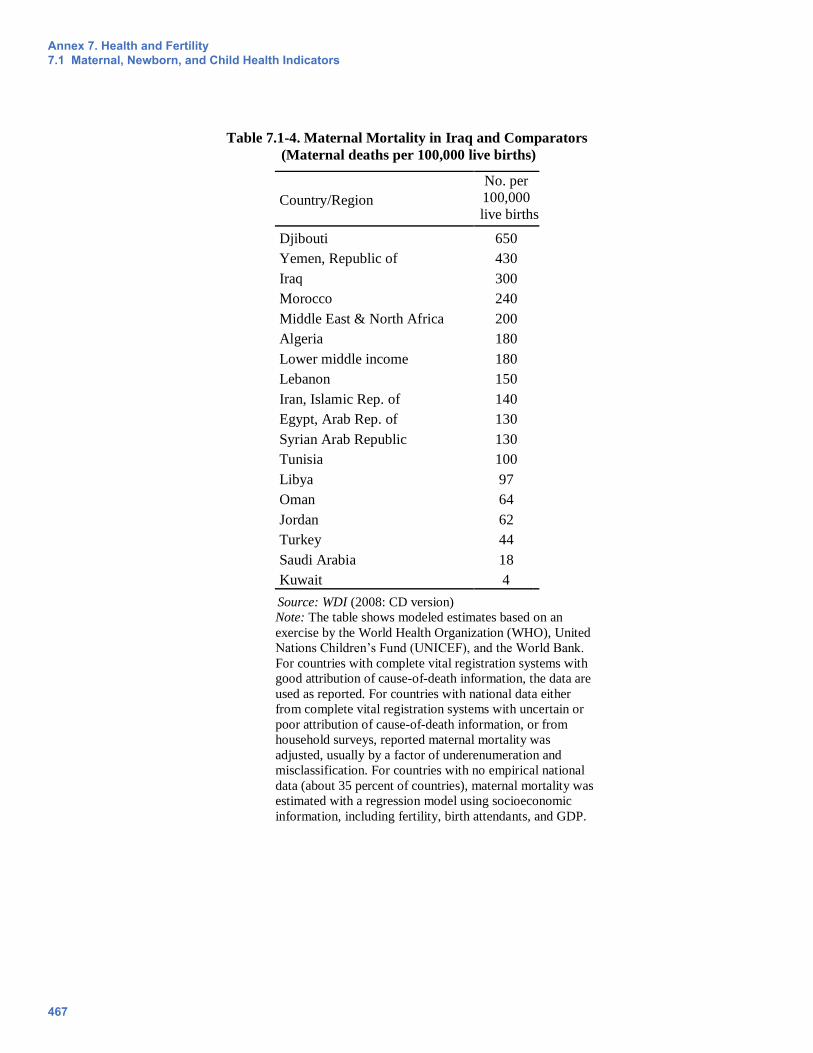
Table 7.1-4. Maternal Mortality in Iraq and Comparators
(Maternal deaths per 100,000 live births)
Country/Region
No. per
100,000
live births
Djibouti 650
Yemen, Republic of 430
Iraq 300
Morocco 240
Middle East & North Africa 200
Algeria 180
Lower middle income 180
Lebanon 150
Iran, Islamic Rep. of 140
Egypt, Arab Rep. of 130
Syrian Arab Republic 130
Tunisia 100
Libya 97
Oman 64
Jordan 62
Turkey 44
Saudi Arabia 18
Kuwait 4
Source: WDI (2008: CD version) Note: The table shows modeled estimates based on an
exercise by the World Health Organization (WHO), United
Nations Children’s Fund (UNICEF), and the World Bank.
For countries with complete vital registration systems with
good attribution of cause-of-death information, the data are
used as reported. For countries with national data either
from complete vital registration systems with uncertain or
poor attribution of cause-of-death information, or from
household surveys, reported maternal mortality was
adjusted, usually by a factor of underenumeration and
misclassification. For countries with no empirical national
data (about 35 percent of countries), maternal mortality was
estimated with a regression model using socioeconomic
information, including fertility, birth attendants, and GDP.
Annex 7. Health and Fertility 7.1 Maternal, Newborn, and Child Health Indicators
467
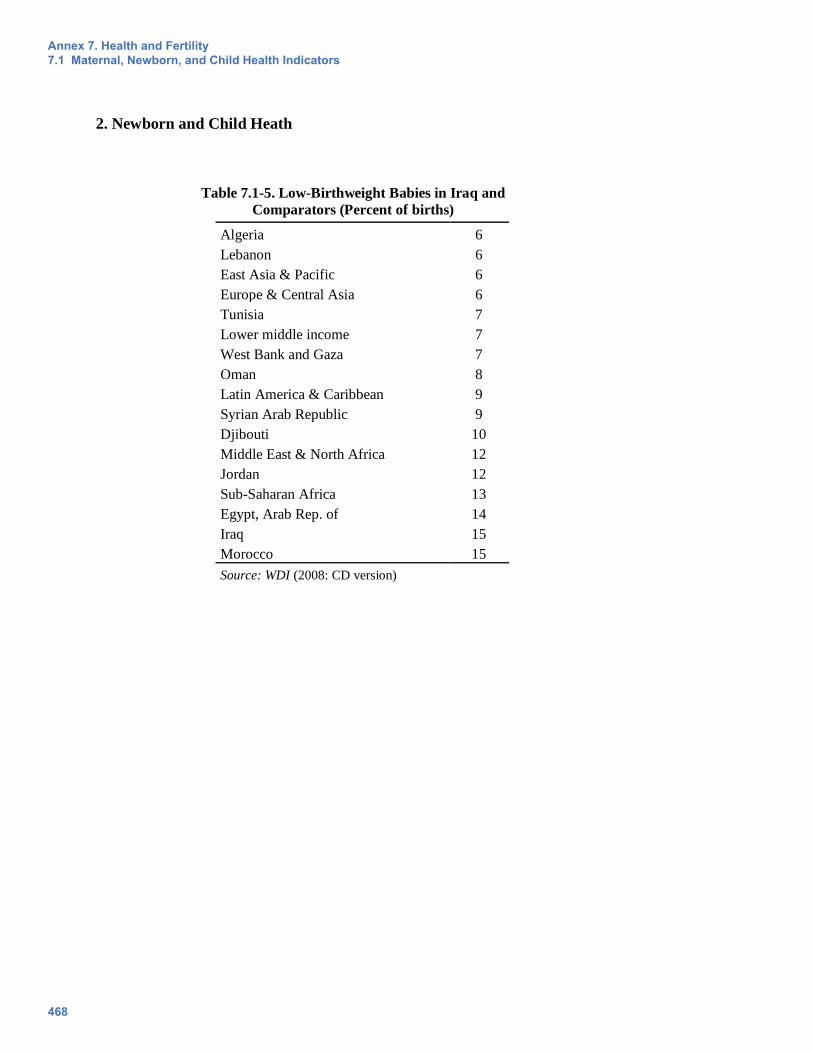
2. Newborn and Child Heath
Table 7.1-5. Low-Birthweight Babies in Iraq and
Comparators (Percent of births)
Algeria 6
Lebanon 6
East Asia & Pacific 6
Europe & Central Asia 6
Tunisia 7
Lower middle income 7
West Bank and Gaza 7
Oman 8
Latin America & Caribbean 9
Syrian Arab Republic 9
Djibouti 10
Middle East & North Africa 12
Jordan 12
Sub-Saharan Africa 13
Egypt, Arab Rep. of 14
Iraq 15
Morocco 15
Source: WDI (2008: CD version)
Annex 7. Health and Fertility 7.1 Maternal, Newborn, and Child Health Indicators
468
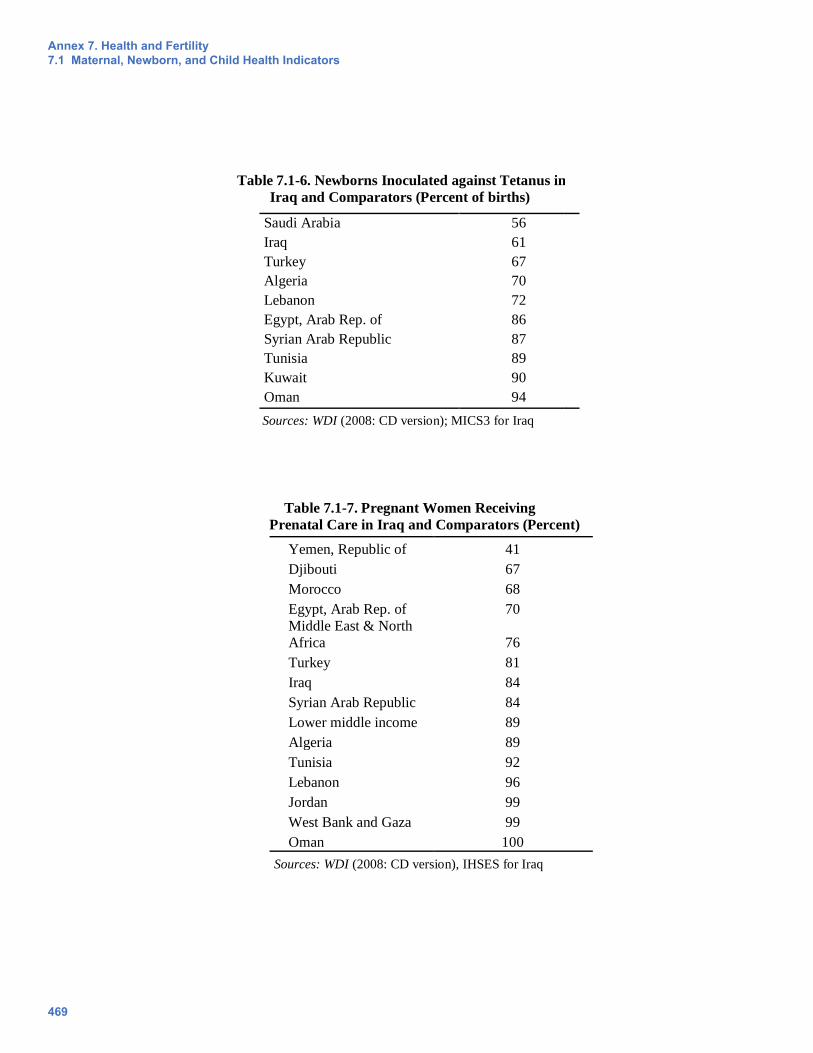
Table 7.1-6. Newborns Inoculated against Tetanus in
Iraq and Comparators (Percent of births)
Saudi Arabia 56
Iraq 61
Turkey 67
Algeria 70
Lebanon 72
Egypt, Arab Rep. of 86
Syrian Arab Republic 87
Tunisia 89
Kuwait 90
Oman 94
Sources: WDI (2008: CD version); MICS3 for Iraq
Table 7.1-7. Pregnant Women Receiving
Prenatal Care in Iraq and Comparators (Percent)
Yemen, Republic of 41
Djibouti 67
Morocco 68
Egypt, Arab Rep. of 70
Middle East & North
Africa 76
Turkey 81
Iraq 84
Syrian Arab Republic 84
Lower middle income 89
Algeria 89
Tunisia 92
Lebanon 96
Jordan 99
West Bank and Gaza 99
Oman 100
Sources: WDI (2008: CD version), IHSES for Iraq
Annex 7. Health and Fertility 7.1 Maternal, Newborn, and Child Health Indicators
469
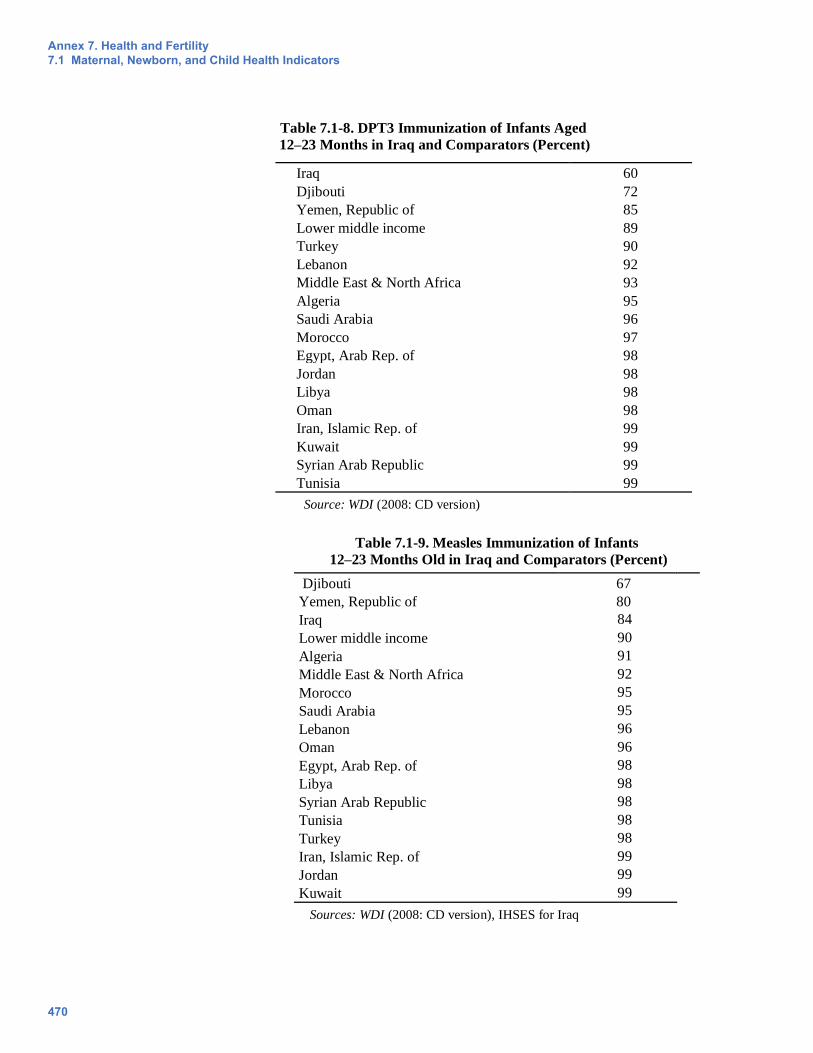
Table 7.1-8. DPT3 Immunization of Infants Aged
12–23 Months in Iraq and Comparators (Percent)
Iraq 60
Djibouti 72
Yemen, Republic of 85
Lower middle income 89
Turkey 90
Lebanon 92
Middle East & North Africa 93
Algeria 95
Saudi Arabia 96
Morocco 97
Egypt, Arab Rep. of 98
Jordan 98
Libya 98
Oman 98
Iran, Islamic Rep. of 99
Kuwait 99
Syrian Arab Republic 99
Tunisia 99
Source: WDI (2008: CD version)
Table 7.1-9. Measles Immunization of Infants
12–23 Months Old in Iraq and Comparators (Percent)
Djibouti 67
Yemen, Republic of 80
Iraq 84
Lower middle income 90
Algeria 91
Middle East & North Africa 92
Morocco 95
Saudi Arabia 95
Lebanon 96
Oman 96
Egypt, Arab Rep. of 98
Libya 98
Syrian Arab Republic 98
Tunisia 98
Turkey 98
Iran, Islamic Rep. of 99
Jordan 99
Kuwait 99
Sources: WDI (2008: CD version), IHSES for Iraq
Annex 7. Health and Fertility 7.1 Maternal, Newborn, and Child Health Indicators
470
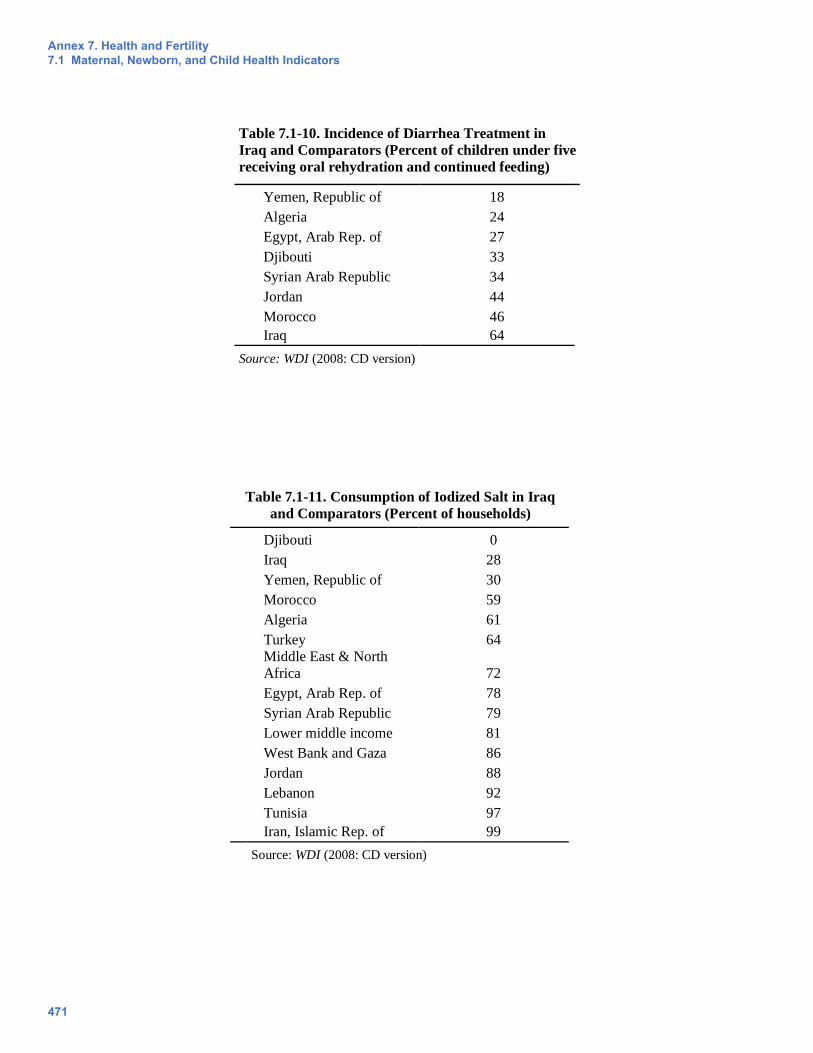
Table 7.1-10. Incidence of Diarrhea Treatment in
Iraq and Comparators (Percent of children under five
receiving oral rehydration and continued feeding)
Yemen, Republic of 18
Algeria 24
Egypt, Arab Rep. of 27
Djibouti 33
Syrian Arab Republic 34
Jordan 44
Morocco 46
Iraq 64
Source: WDI (2008: CD version)
Table 7.1-11. Consumption of Iodized Salt in Iraq
and Comparators (Percent of households)
Djibouti 0
Iraq 28
Yemen, Republic of 30
Morocco 59
Algeria 61
Turkey 64
Middle East & North
Africa 72
Egypt, Arab Rep. of 78
Syrian Arab Republic 79
Lower middle income 81
West Bank and Gaza 86
Jordan 88
Lebanon 92
Tunisia 97
Iran, Islamic Rep. of 99
Source: WDI (2008: CD version)
Annex 7. Health and Fertility 7.1 Maternal, Newborn, and Child Health Indicators
471
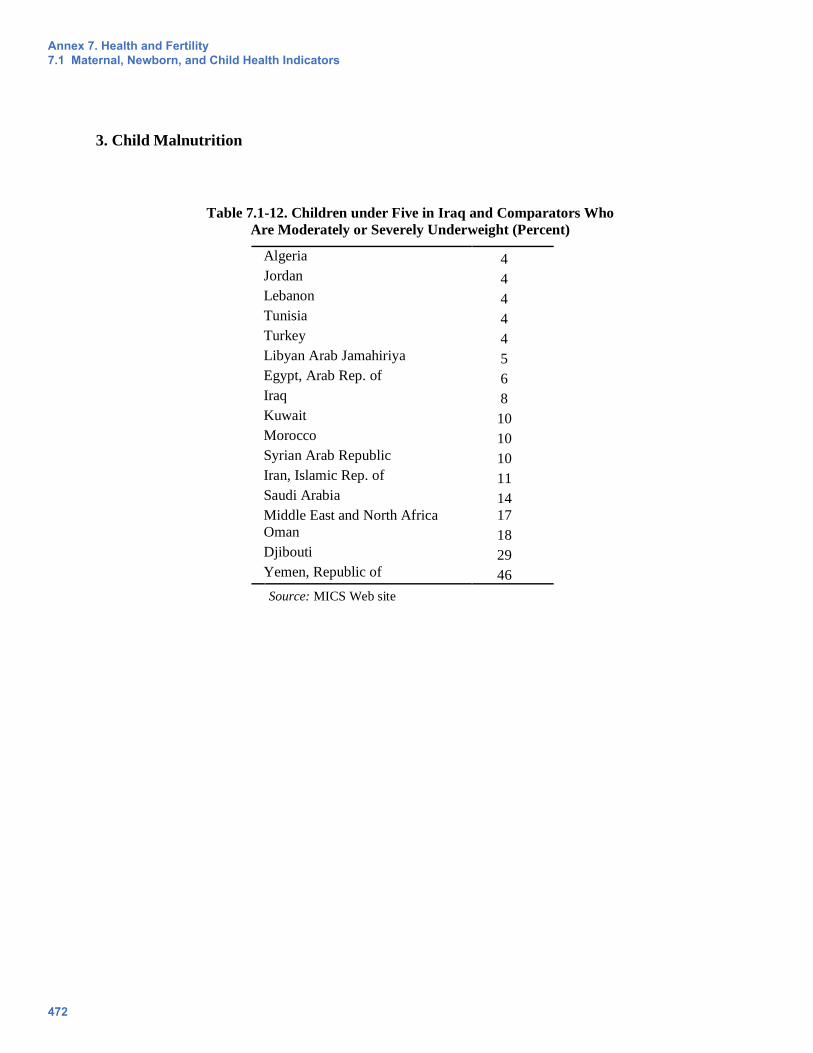
3. Child Malnutrition
Table 7.1-12. Children under Five in Iraq and Comparators Who
Are Moderately or Severely Underweight (Percent)
Algeria 4
Jordan 4
Lebanon 4
Tunisia 4
Turkey 4
Libyan Arab Jamahiriya 5
Egypt, Arab Rep. of 6
Iraq 8
Kuwait 10
Morocco 10
Syrian Arab Republic 10
Iran, Islamic Rep. of 11
Saudi Arabia 14
Middle East and North Africa 17
Oman 18
Djibouti 29
Yemen, Republic of 46
Source: MICS Web site
Annex 7. Health and Fertility 7.1 Maternal, Newborn, and Child Health Indicators
472
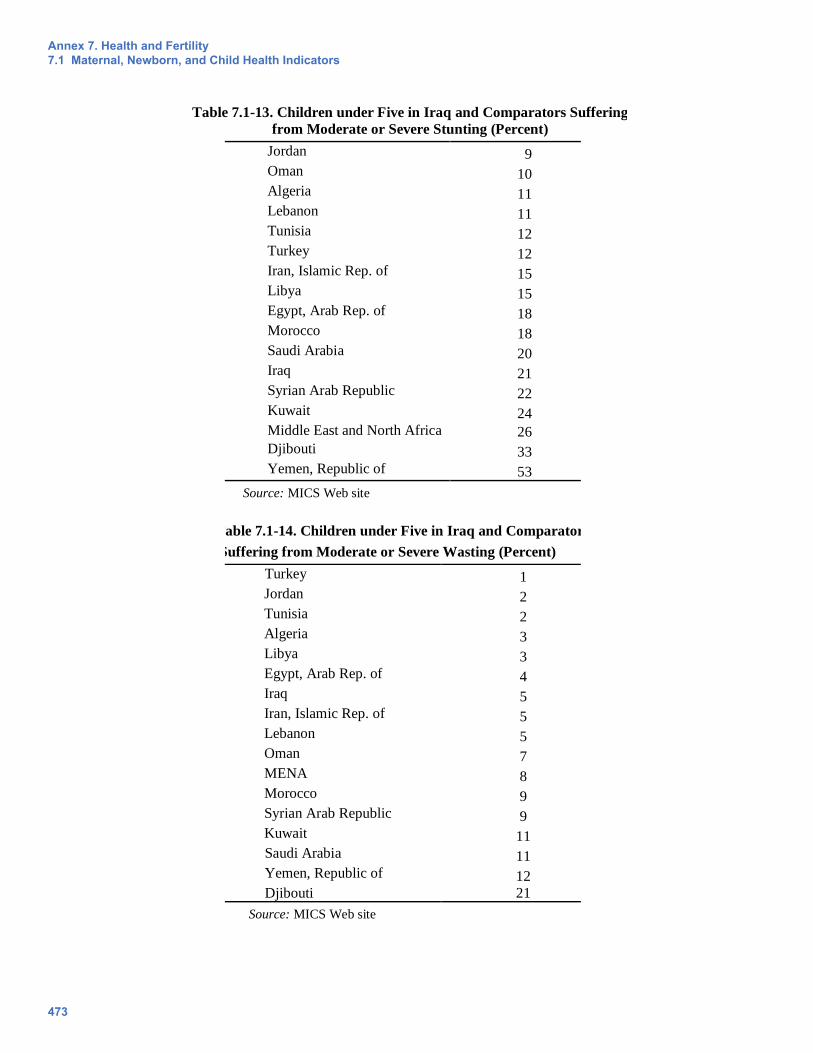
Table 7.1-13. Children under Five in Iraq and Comparators Suffering
from Moderate or Severe Stunting (Percent)
Jordan 9
Oman 10
Algeria 11
Lebanon 11
Tunisia 12
Turkey 12
Iran, Islamic Rep. of 15
Libya 15
Egypt, Arab Rep. of 18
Morocco 18
Saudi Arabia 20
Iraq 21
Syrian Arab Republic 22
Kuwait 24
Middle East and North Africa 26
Djibouti 33
Yemen, Republic of 53
Source: MICS Web site
Table 7.1-14. Children under Five in Iraq and Comparators
Suffering from Moderate or Severe Wasting (Percent)
Turkey 1
Jordan 2
Tunisia 2
Algeria 3
Libya 3
Egypt, Arab Rep. of 4
Iraq 5
Iran, Islamic Rep. of 5
Lebanon 5
Oman 7
MENA 8
Morocco 9
Syrian Arab Republic 9
Kuwait 11
Saudi Arabia 11
Yemen, Republic of 12
Djibouti 21
Source: MICS Web site
Annex 7. Health and Fertility 7.1 Maternal, Newborn, and Child Health Indicators
473
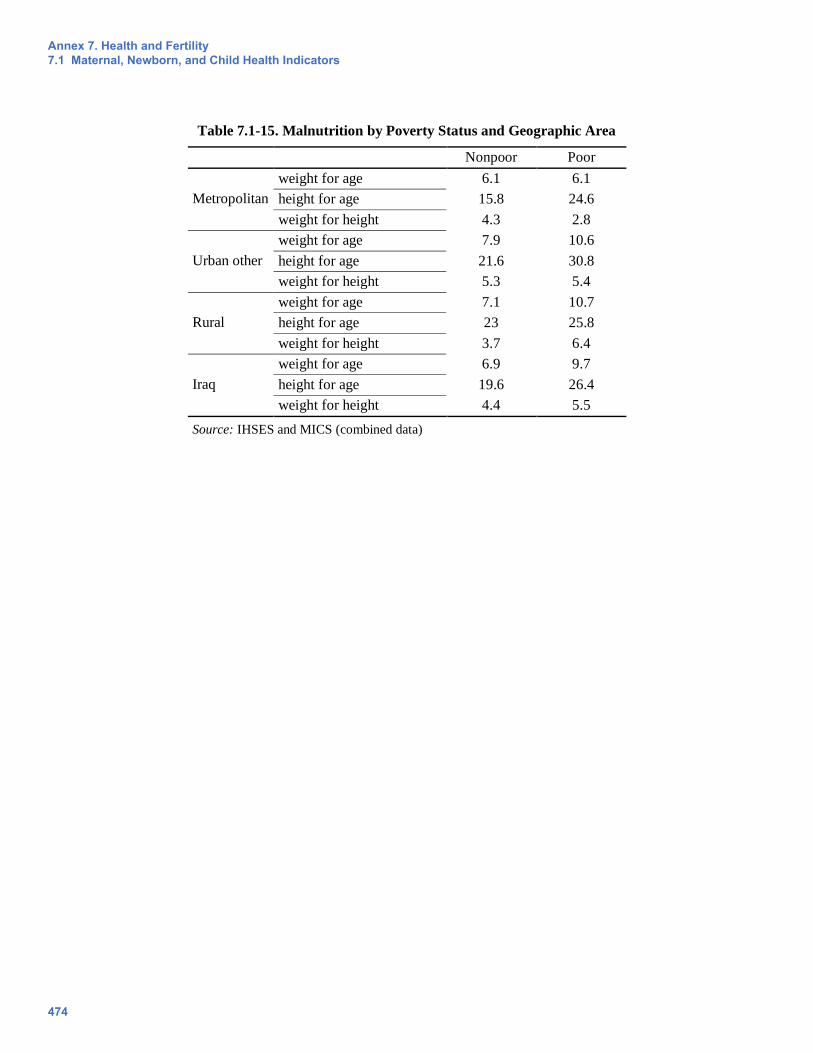
Table 7.1-15. Malnutrition by Poverty Status and Geographic Area
Nonpoor Poor
Metropolitan
weight for age 6.1 6.1
height for age 15.8 24.6
weight for height 4.3 2.8
Urban other
weight for age 7.9 10.6
height for age 21.6 30.8
weight for height 5.3 5.4
Rural
weight for age 7.1 10.7
height for age 23 25.8
weight for height 3.7 6.4
Iraq
weight for age 6.9 9.7
height for age 19.6 26.4
weight for height 4.4 5.5
Source: IHSES and MICS (combined data)
Annex 7. Health and Fertility 7.1 Maternal, Newborn, and Child Health Indicators
474
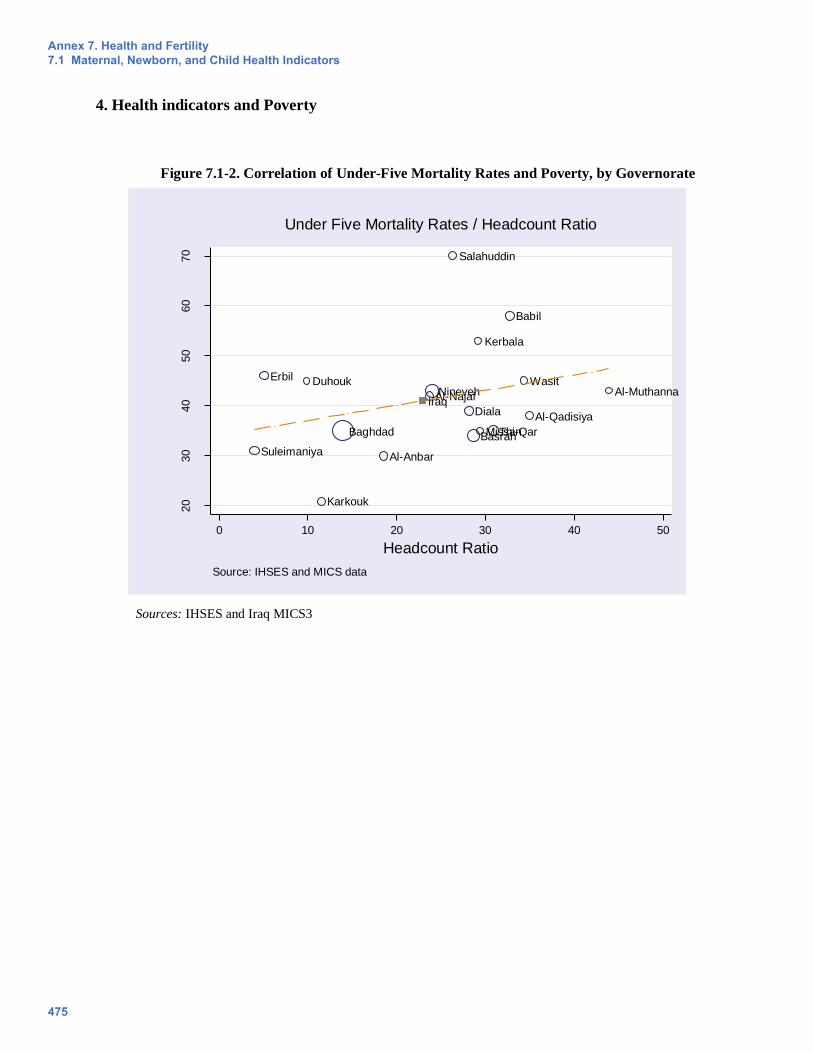
4. Health indicators and Poverty
Figure 7.1-2. Correlation of Under-Five Mortality Rates and Poverty, by Governorate
Sources: IHSES and Iraq MICS3
DuhoukNineveh
Suleimaniya
Karkouk
Erbil
Diala
Al-Anbar
Baghdad
Babil
Kerbala
Wasit
Salahuddin
Al-Najaf
Al-Qadisiya
Al-Muthanna
Thi-QarMissanBasrah
Iraq
20
30
40
50
60
70
Und
er
Fiv
e M
ort
alit
y R
ate
0 10 20 30 40 50
Headcount Ratio
Source: IHSES and MICS data
Under Five Mortality Rates / Headcount Ratio
Annex 7. Health and Fertility 7.1 Maternal, Newborn, and Child Health Indicators
475
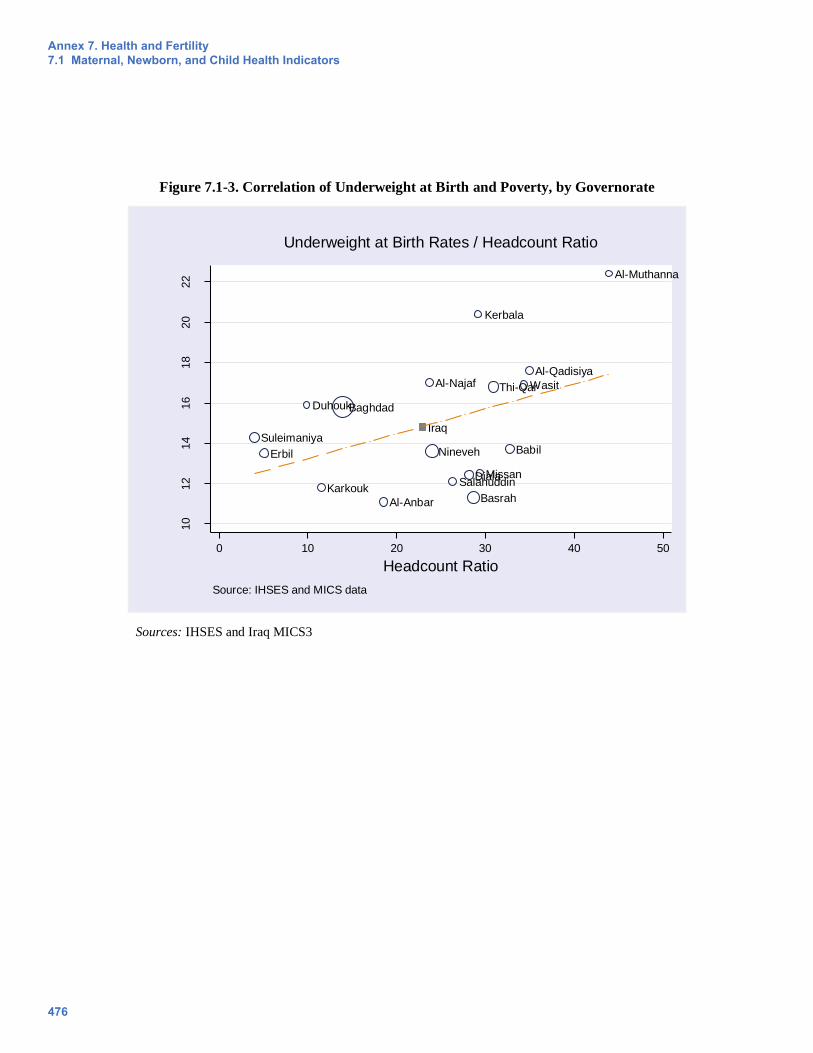
Figure 7.1-3. Correlation of Underweight at Birth and Poverty, by Governorate
Sources: IHSES and Iraq MICS3
Duhouk
Nineveh
Suleimaniya
Karkouk
Erbil
Diala
Al-Anbar
Baghdad
Babil
Kerbala
Wasit
Salahuddin
Al-NajafAl-Qadisiya
Al-Muthanna
Thi-Qar
Missan
Basrah
Iraq
10
12
14
16
18
20
22
Und
erw
eig
ht
at
Bir
th R
ate
0 10 20 30 40 50
Headcount Ratio
Source: IHSES and MICS data
Underweight at Birth Rates / Headcount Ratio
Annex 7. Health and Fertility 7.1 Maternal, Newborn, and Child Health Indicators
476
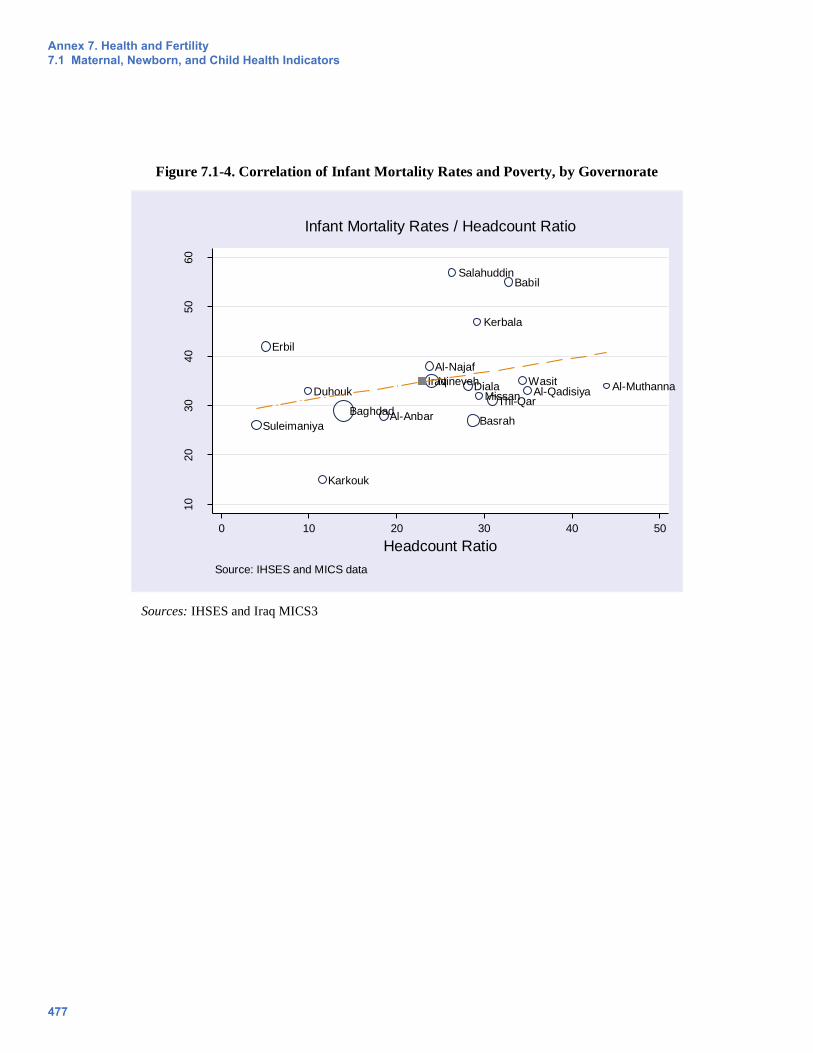
Figure 7.1-4. Correlation of Infant Mortality Rates and Poverty, by Governorate
Sources: IHSES and Iraq MICS3
DuhoukNineveh
Suleimaniya
Karkouk
Erbil
Diala
Al-AnbarBaghdad
Babil
Kerbala
Wasit
Salahuddin
Al-Najaf
Al-Qadisiya Al-Muthanna
Thi-QarMissan
Basrah
Iraq
10
20
30
40
50
60
Infa
nt
Mort
alit
y R
ate
0 10 20 30 40 50
Headcount Ratio
Source: IHSES and MICS data
Infant Mortality Rates / Headcount Ratio
Annex 7. Health and Fertility 7.1 Maternal, Newborn, and Child Health Indicators
477