Embed Size (px)
Citation preview

The Gambia
Maternal and Newborn Health Disparities
© U
NIC
EF/
UN
0616
66/D
ejo
ng
h
The Gambia 2
Key FactsMaternal and Newborn Health Disparities in The Gambia
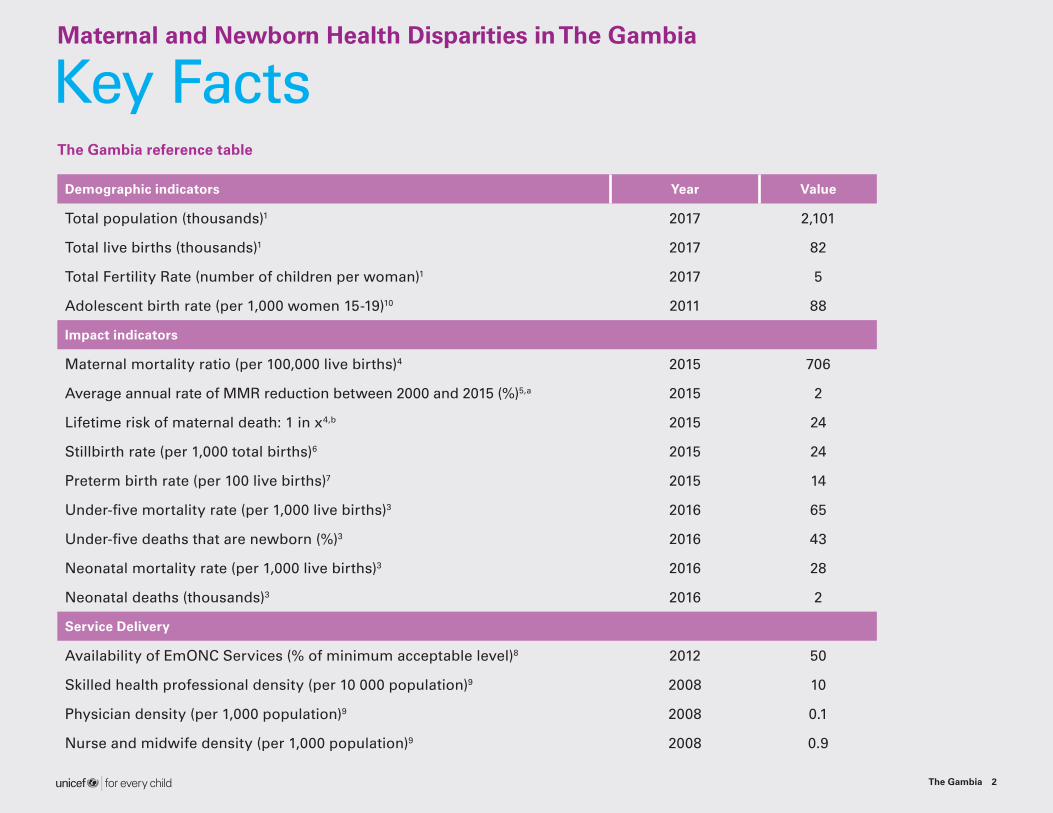
The Gambia reference table
Demographic indicators Year Value
Total population (thousands)1 2017 2,101
Total live births (thousands)1 2017 82
Total Fertility Rate (number of children per woman)1 2017 5
Adolescent birth rate (per 1,000 women 15-19)10 2011 88
Impact indicators
Maternal mortality ratio (per 100,000 live births)4 2015 706
Average annual rate of MMR reduction between 2000 and 2015 (%)5,a 2015 2
Lifetime risk of maternal death: 1 in x4,b 2015 24
Stillbirth rate (per 1,000 total births)6 2015 24
Preterm birth rate (per 100 live births)7 2015 14
Under-five mortality rate (per 1,000 live births)3 2016 65
Under-five deaths that are newborn (%)3 2016 43
Neonatal mortality rate (per 1,000 live births)3 2016 28
Neonatal deaths (thousands)3 2016 2
Service Delivery
Availability of EmONC Services (% of minimum acceptable level)8 2012 50
Skilled health professional density (per 10 000 population)9 2008 10
Physician density (per 1,000 population)9 2008 0.1
Nurse and midwife density (per 1,000 population)9 2008 0.9
Maternal and Newborn Health Disparities in The Gambia
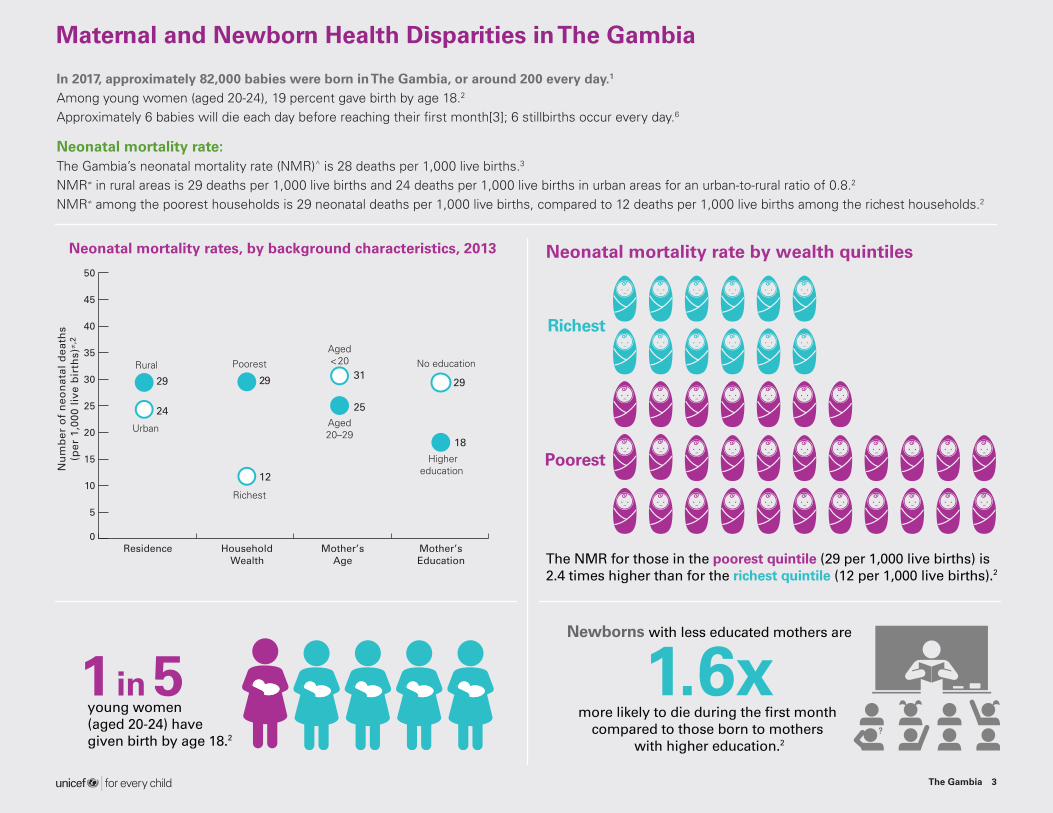
In 2017, approximately 82,000 babies were born in The Gambia, or around 200 every day.1
Among young women (aged 20-24), 19 percent gave birth by age 18.2
Approximately 6 babies will die each day before reaching their first month[3]; 6 stillbirths occur every day.6
Neonatal mortality rate:The Gambia’s neonatal mortality rate (NMR)^ is 28 deaths per 1,000 live births.3
NMR≠ in rural areas is 29 deaths per 1,000 live births and 24 deaths per 1,000 live births in urban areas for an urban-to-rural ratio of 0.8.2
NMR≠ among the poorest households is 29 neonatal deaths per 1,000 live births, compared to 12 deaths per 1,000 live births among the richest households.2
Neonatal mortality rates, by background characteristics, 2013
Nu
mb
er o
f n
eon
atal
dea
ths
(per
1,0
00 l
ive
bir
ths)
≠,2
0
5
10
15
20
25
30
35
40
45
50
Mother’sEducation
Mother’sAge
HouseholdWealth
Residence
Rural Poorest No education
Highereducation
Richest
29
Urban
24
12
3129
18
Aged20–29
Aged<20
25
29
Poorest
Richest
The NMR for those in the poorest quintile (29 per 1,000 live births) is 2.4 times higher than for the richest quintile (12 per 1,000 live births).2
Neonatal mortality rate by wealth quintiles
more likely to die during the first month compared to those born to mothers
with higher education.2
1.6xNewborns with less educated mothers are
1 in 5young women (aged 20-24) have given birth by age 18.2
The Gambia 3

Other noncommunicablediseases, <1%
Acuterespiratoryinfections,7%
Birth asphyxiaand birth trauma
29%
Sepsis22%
Prematurity25%
Other communicable andperinatal conditions, 5%
Congenitalanomalies,10%
The Gambia — Causes of Neonatal Mortality, 2016
In The Gambia, the main causes of neonatal deaths in 2016 were prematurity (25 per cent), birth asphyxia and birth trauma (29 per cent) and sepsis (22 per cent).11
Only 75% of mothers in the poorest households have 4 antenatal care visits compared to...
...83% of mothers in the richest households.
Poorest Richest
75% 83%
Maternal and newborn health coverage indicators
By residence:2
• In rural areas, 78 per cent of women made at least 4 antenatal care visits, compared to 77 per cent in urban areas.
• Coverage of skilled attendance at birth is 75 per cent in rural areas, compared to 41 per cent in urban areas.
• 13 per cent of newborns in rural areas receive postnatal care (PNC) within 2 days of birth, compared to 22 per cent in urban areas.
By household wealth:2
• Most mothers among richest households (83 per cent) made at least 4 antenatal care visits, compared to 75 per cent of mothers from the poorest households.
• Only 46 per cent of mothers in the poorest households had a skilled attendant at birth, compared to 82 per cent of mothers in the richest households.
• 33 per cent of newborns in the richest households receive PNC within 2 days of birth, compared to 16 per cent among the poorest households.
Maternal and Newborn Health Disparities in The Gambia
Source: WHO-MCEE, 2017 Source: DHS 2013
The Gambia 4

Maternal and newborn health coverage indicators
By mother’s age:2
• 77 per cent of mothers aged 20-34 made at least four ANC visits, compared to 74 per cent among younger mothers (aged less than 20).
• Mothers aged 20-34 and younger mothers have similar levels of skilled attendance at birth (56 per cent and 62 per cent, respectively).
• Their newborns receive low levels of postnatal care: 16 per cent and 14 per cent, respectively.
By mother’s education:2
• 82 per cent of mothers with higher education made at least four ANC visits, compared to 76 per cent of mothers with no education.
• 49 per cent of mothers with no education had a skilled attendant at birth, compared to 62 per cent with primary education and 74 per cent for mothers with higher education.
• 12 per cent of newborns are checked within 2 days of birth if their mothers have no education, compare to 20 per cent of mothers with a primary education and 26 per cent of mothers who received higher education.
Maternal and Newborn Health Disparities in The Gambia
Skilled attendant at birth (%) Antenatal care coverage at least 4 times (%)a
Postnatal care of newborns within 2 days (%)
Pe
rce
nt2
Banjul
Kanifin
g
Brikam
a
Man
sako
nko
Kerew
an
Janja
nbur
eh
Kunta
ur
Basse
0
10
20
30
40
50
60
70
80
90
100
89
83
15
84
5
77
85
82
68
26
76
55
44
3335
31
35
81
73
12
5
72
Selected maternal and newborn health indicators, by region, 2013
Source: DHS 2013
The better educated the mother is, the more likely she will receive critical maternal health services
Percentage of women having a skilled birth attendant relative to their education level
PrimaryNone Higher
74%62%
49%
The Gambia 5
Maternal and Newborn Health Disparities in The Gambia
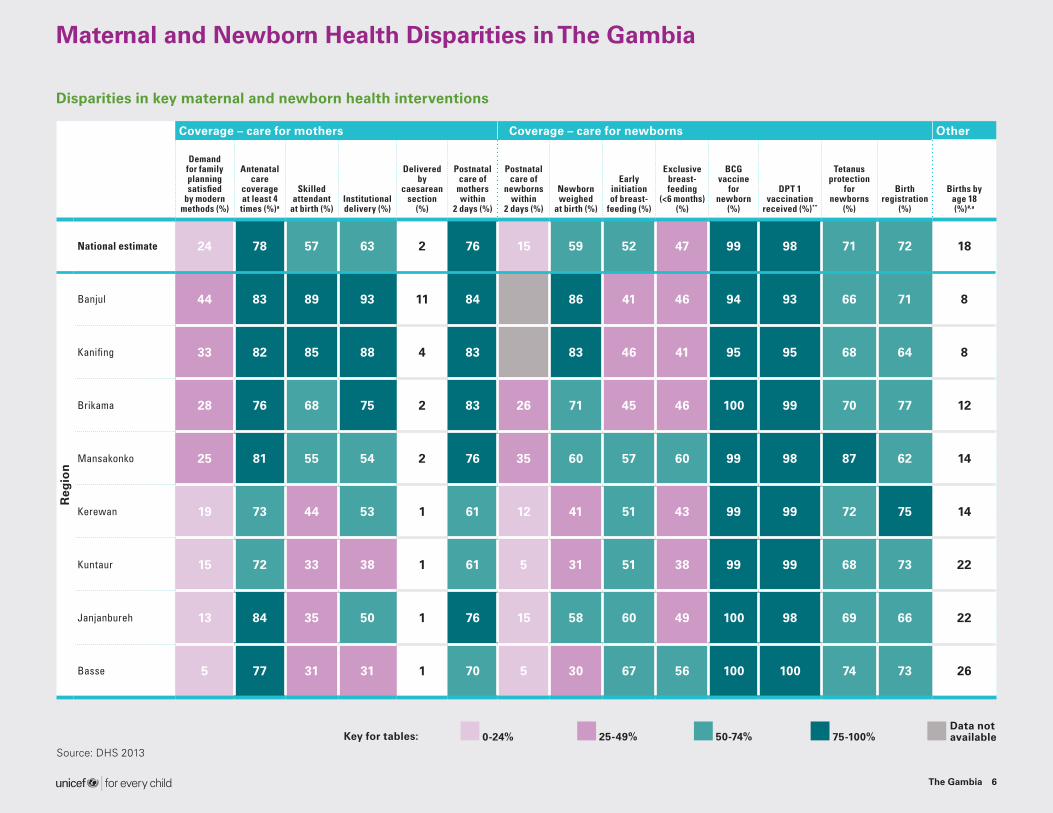
Disparities in key maternal and newborn health interventions
The Gambia 6
Source: DHS 2013
Coverage – care for mothers Coverage – care for newborns Other
Demand for family planning satisfied
by modern methods (%)
Antenatal care
coverage at least 4 times (%)a
Skilled attendant
at birth (%)Institutional delivery (%)
Delivered by
caesarean section
(%)
Postnatal care of
mothers within
2 days (%)
Postnatal care of
newborns within
2 days (%)
Newborn weighed
at birth (%)
Early initiation of breast-
feeding (%)
Exclusive breast-feeding
(<6 months) (%)
BCG vaccine
for newborn
(%)
DPT 1 vaccination
received (%)**
Tetanus protection
for newborns
(%)
Birth registration
(%)
Births by age 18 (%)#,a
National estimate 24 78 57 63 2 76 15 59 52 47 99 98 71 72 18
Reg
ion
Banjul 44 83 89 93 11 84 86 41 46 94 93 66 71 8
Kanifing 33 82 85 88 4 83 83 46 41 95 95 68 64 8
Brikama 28 76 68 75 2 83 26 71 45 46 100 99 70 77 12
Mansakonko 25 81 55 54 2 76 35 60 57 60 99 98 87 62 14
Kerewan 19 73 44 53 1 61 12 41 51 43 99 99 72 75 14
Kuntaur 15 72 33 38 1 61 5 31 51 38 99 99 68 73 22
Janjanbureh 13 84 35 50 1 76 15 58 60 49 100 98 69 66 22
Basse 5 77 31 31 1 70 5 30 67 56 100 100 74 73 26
Key for tables: 0-24% 25-49% 50-74% 75-100% Data not available
Maternal and Newborn Health Disparities in The Gambia
The Gambia 7
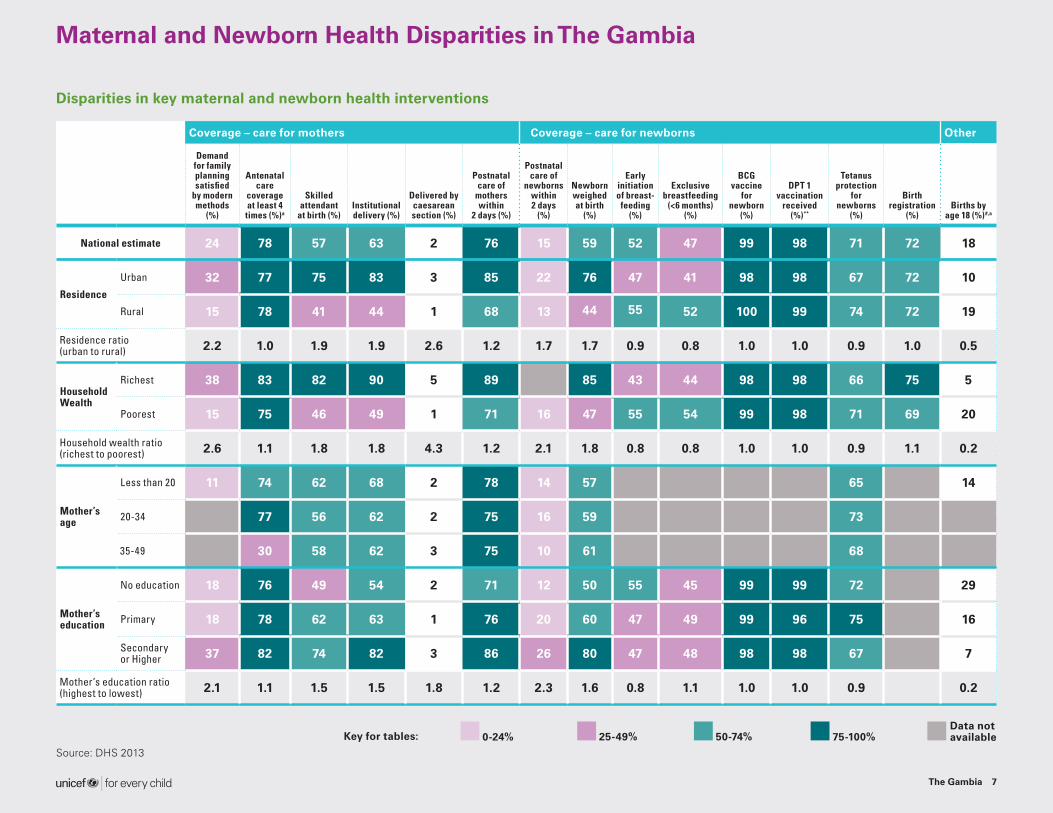
Disparities in key maternal and newborn health interventions
Source: DHS 2013
Coverage – care for mothers Coverage – care for newborns Other
Demand for family planning satisfied
by modern methods
(%)
Antenatal care
coverage at least 4 times (%)a
Skilled attendant
at birth (%)Institutional delivery (%)
Delivered by caesarean section (%)
Postnatal care of
mothers within
2 days (%)
Postnatal care of
newborns within 2 days
(%)
Newborn weighed at birth
(%)
Early initiation of breast-
feeding (%)
Exclusive breastfeeding
(<6 months) (%)
BCG vaccine
for newborn
(%)
DPT 1 vaccination
received (%)**
Tetanus protection
for newborns
(%)
Birth registration
(%)Births by
age 18 (%)#,a
National estimate 24 78 57 63 2 76 15 59 52 47 99 98 71 72 18
Residence
Urban 32 77 75 83 3 85 22 76 47 41 98 98 67 72 10
Rural 15 78 41 44 1 68 13 44 55 52 100 99 74 72 19
Residence ratio (urban to rural) 2.2 1.0 1.9 1.9 2.6 1.2 1.7 1.7 0.9 0.8 1.0 1.0 0.9 1.0 0.5
Household Wealth
Richest 38 83 82 90 5 89 85 43 44 98 98 66 75 5
Poorest 15 75 46 49 1 71 16 47 55 54 99 98 71 69 20
Household wealth ratio (richest to poorest) 2.6 1.1 1.8 1.8 4.3 1.2 2.1 1.8 0.8 0.8 1.0 1.0 0.9 1.1 0.2
Mother’s age
Less than 20 11 74 62 68 2 78 14 57 65 14
20-34 77 56 62 2 75 16 59 73
35-49 30 58 62 3 75 10 61 68
Mother’s education
No education 18 76 49 54 2 71 12 50 55 45 99 99 72 29
Primary 18 78 62 63 1 76 20 60 47 49 99 96 75 16
Secondary or Higher 37 82 74 82 3 86 26 80 47 48 98 98 67 7
Mother’s education ratio (highest to lowest) 2.1 1.1 1.5 1.5 1.8 1.2 2.3 1.6 0.8 1.1 1.0 1.0 0.9 0.2
Key for tables: 0-24% 25-49% 50-74% 75-100% Data not available

Sources:
1 United Nations, Department of Economic and Social Affairs, Population Division (2017). World Population Prospects: The 2017 Revision.
2 The Gambia Demographic and Health Survey 2013.
3 United Nations Inter-agency Group for Child Mortality Estimation (UNICEF, WHO, United Nations Population Division and the World Bank).
4 United Nations Maternal Mortality Estimation Inter-agency Group (WHO, UNICEF, UNFPA, United Nations Population Division and the World Bank).
5 Trends in maternal mortality: 1990 to 2015: estimates by WHO, UNICEF, UNFPA, World Bank Group and the United Nations Population Division.
6 Trends in maternal mortality: 1990 to 2015: estimates by WHO, UNICEF, UNFPA, World Bank Group and the United Nations Population Division. Lawn JE, Blencowe H, Waiswa P, et al, for The Lancet Ending Preventable Stillbirths Series study group with The Lancet Stillbirth Epidemiology investigator group. Stillbirths: rates, risk factors, and acceleration towards 2030. Lancet 2016; published online Jan 18. http://dx.doi.org/10.1016/S0140-6736(15)00837-5.
7 Blencowe H, Cousens S, Oestergaard M, Chou D, Moller AB, Narwal R, Adler A, Garcia CV, Rohde S, Say L, Lawn JE. National, regional and worldwide estimates of preterm birth rates in the year 2015 with time trends since 1990 for selected countries: a systematic analysis and implications.
8 Averting Maternal Death and Disability, United Nations Children’s Fund, and United Nations Population Fund special data compilation, 2015.
9 Global Health Workforce Statistics database, World Health Organization, Geneva. (http://www.who.int/hrh/statistics/hwfstats/).
10 United Nations, Department of Economic and Social Affairs, Population Division (2015). 2015 Update for the MDG Database.
11 WHO-MCEE estimates for child causes of death, 2000-2016.
Notes:
a MMR estimates have been rounded according to the following scheme: < 100 rounded to nearest 1; 100–999 rounded to nearest 1; and ≥ 1000 rounded to nearest 10.
b Life time risk has been rounded according to the following scheme: < 100 rounded to nearest 1; 100–999 rounded to nearest 10; and ≥ 1000 rounded to nearest 100.
^ Reference period: five years preceding the survey.
≠ Reference period: ten years preceding the survey.
# Births by age 18 among 20-24 year olds.
( ) Based on small denominators (typically 25-49 unweighted cases). No data based on fewer than 25 unweighted cases are displayed.
Email: [email protected]: data.unicef.org
Prepared by: UNICEF Data and Analytics, Division of Data, Research and Policy in collaboration with Health Section Programme Division. March 2018.