Embed Size (px)
Citation preview
Materials Science and Engineering C 29 (2009) 1442–1452
Contents lists available at ScienceDirect
Materials Science and Engineering C
j ourna l homepage: www.e lsev ie r.com/ locate /msec
An investigation of the initial attachment and orientation of osteoblast-like cells onlaser grooved Ti-6Al-4V surfaces
J. Chen a,b,⁎, J.P. Ulerich b, E. Abelev c, A. Fasasi a,d, C.B. Arnold a,b, W.O. Soboyejo a,b
a Princeton Institute of Science and Technology of Materials, Princeton University, Princeton, NJ 08544, USAb Department of Mechanical and Aerospace Engineering, Princeton University, Princeton, NJ 08544, USAc Department of Chemistry, Princeton University, Princeton, NJ 08544, USAd Center for Energy Research, Obafemi Awolowo University, Ile-Ife, Nigeria
⁎ Corresponding author. Princeton Institute of SciencPrinceton University, Princeton, NJ 08544, USA.
E-mail address: [email protected] (J. Chen).
0928-4931/$ – see front matter © 2008 Elsevier B.V. Adoi:10.1016/j.msec.2008.11.014
a b s t r a c t
a r t i c l e i n f oArticle history:
This paper presents the re Received 1 July 2008Received in revised form 11 November 2008Accepted 15 November 2008Available online 27 November 2008Keywords:Titanium texturingLaser processingMicrogroovesInitial cell spreading and adhesionContact guidance
sults of an experimental study of the initial cell spreading and adhesion onlongitudinally- and transversally-oriented micro-grooves produced by the laser irradiation of laser groovedTi-6Al-4V surfaces. The initial spreading and orientations of human osteosarcoma (HOS) cells were observedand quantified after 15-min, 1-hour, 4-hour and 24-hour cell culture periods. Immuno-fluorescence stainingof adhesion proteins (actin and vinculin) was then used to study the spreading and adhesion of HOS cells in1 hour and 4 hour culture experiments. The initial cell adhesion was also quantified using enzymaticdetachment tests. The results showed that cell spreading and adhesion were enhanced by longitudinally- andtransversally-oriented micro-grooves. The effects, which increase with time, were not remarkable after1 hour, but obvious after 4 hours. Contact guidance was found to promote cell adhesion due to the increase ininteractions between the focal adhesions and the patterned extra-cellular matrix (ECM) proteins on the lasermicro-grooved surfaces.
© 2008 Elsevier B.V. All rights reserved.
1. Introduction
Ti and Ti-6Al-4V alloys are widely used in orthopedic and dentalimplants because of their excellent mechanical properties andexceptional biocompatibility [1,2]. Since current orthopedic implantshave relatively short lifespans, which result from the looseningbetween the implants and surrounding bone [2,3], there is a need forimproved adhesion betweenTi implants and bone. This has stimulatedprior work on the effects of surface modification techniques, such asgrit blasting and porous coating [4–7].
More recently, however, laser-ablated micro-grooves have beenused tomodify the surface characteristics of biomaterials and influencecellular behavior [8–14]. Unlike blast-textured surfaces that give rise torandom cell orientations [5,7], laser micro-grooved Ti-6Al-4V surfaceshave been shown to promote contact guidance (cell alignment)[10,12], a phenomenon that involves the alignment and migration ofcells alongmicro-grooves. This has been shown to reduce the extent ofscar tissue formation and promote osseointegration [8,9].
Although enhanced cell attachment and obvious cell alignment havebeen observed on laser-ablated micro-grooved surface after a few daysculture [8–14], the actual mechanism of contact guidance and celladhesion enhancement on laser grooves remains unclear. There is,
e and Technology of Materials,
ll rights reserved.
therefore, a need to develop a fundamental understanding of themechanisms of cell spreading and adhesion that are associated withcontact guidance. Thesewill be explored in this paper using lasermicro-grooved geometries with well controlled groove spacings and surfacetextures, since prior work has shown that both groove spacing [8–10,12]and groove surface texture [11,13,14] are important factors that affect thespreading and attachment of cells onto grooved Ti-6Al-4V surfaces.
Unlike prior studies [8–14] that focus on cell spreading after 1 to7 days of cell culture, the current work examines the phenomena thatoccur during the first few hours (0.25 h, 1 h, 2 h, 4 h and 24 h) of cellculture on laser grooved titanium surfaces. The focus on the early stagesof cell spreading is important because they are thought to be a majordeterminantof the long-termbone-biomaterial interfacial response thatis associated with the subsequent spreading and growth of osteoblastson implant surfaces [7]. Hence, an improved understanding of the bone-biomaterial response may lead to faster and more extensive implantintegration and improved long-term stability [13–16].
This paper presents the results of an experimental study of theinitial stages of cell spreading and adhesion to laser micro-groovedTi-6Al-4V surfaces with well-controlled groove spacings and surfacetextures. Cell spreading and orientation were studied using scanningelectron microscopy (SEM) and analyzed using image analysissoftware (ImageJ, NIH, Bethesda, MD). Enzymatic detachment testswere also used to quantify cell adhesion after 1-hour and 4-hour cellculture periods. Based on these results, the relationship between cellcontact guidance and enhanced cell adhesion (on laser-irradiated
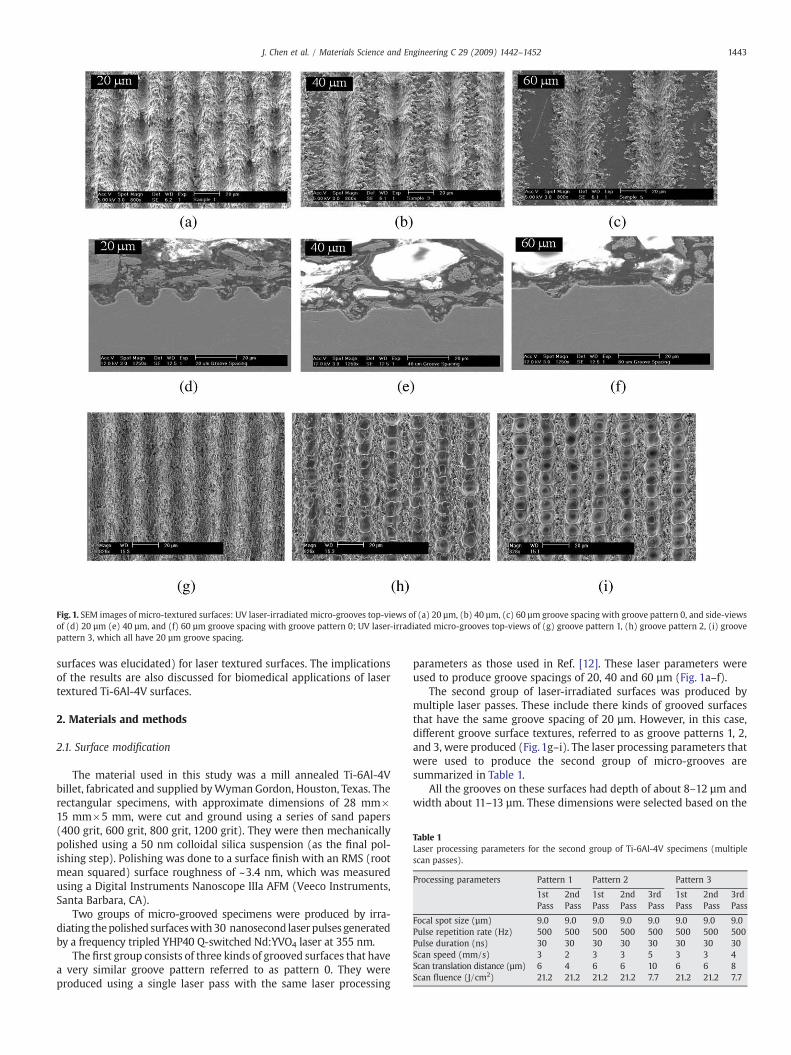
Fig. 1. SEM images of micro-textured surfaces: UV laser-irradiated micro-grooves top-views of (a) 20 µm, (b) 40 µm, (c) 60 µm groove spacing with groove pattern 0, and side-viewsof (d) 20 µm (e) 40 µm, and (f) 60 µm groove spacing with groove pattern 0; UV laser-irradiated micro-grooves top-views of (g) groove pattern 1, (h) groove pattern 2, (i) groovepattern 3, which all have 20 µm groove spacing.
Table 1Laser processing parameters for the second group of Ti-6Al-4V specimens (multiplescan passes).
Processing parameters Pattern 1 Pattern 2 Pattern 3
1stPass
2ndPass
1stPass
2ndPass
3rdPass
1stPass
2ndPass
3rdPass
Focal spot size (µm) 9.0 9.0 9.0 9.0 9.0 9.0 9.0 9.0Pulse repetition rate (Hz) 500 500 500 500 500 500 500 500Pulse duration (ns) 30 30 30 30 30 30 30 30Scan speed (mm/s) 3 2 3 3 5 3 3 4Scan translation distance (µm) 6 4 6 6 10 6 6 8Scan fluence (J/cm2) 21.2 21.2 21.2 21.2 7.7 21.2 21.2 7.7
1443J. Chen et al. / Materials Science and Engineering C 29 (2009) 1442–1452
surfaces was elucidated) for laser textured surfaces. The implicationsof the results are also discussed for biomedical applications of lasertextured Ti-6Al-4V surfaces.
2. Materials and methods
2.1. Surface modification
The material used in this study was a mill annealed Ti-6Al-4Vbillet, fabricated and supplied byWyman Gordon, Houston, Texas. Therectangular specimens, with approximate dimensions of 28 mm×15 mm×5 mm, were cut and ground using a series of sand papers(400 grit, 600 grit, 800 grit, 1200 grit). They were then mechanicallypolished using a 50 nm colloidal silica suspension (as the final pol-ishing step). Polishing was done to a surface finish with an RMS (rootmean squared) surface roughness of ~3.4 nm, which was measuredusing a Digital Instruments Nanoscope IIIa AFM (Veeco Instruments,Santa Barbara, CA).
Two groups of micro-grooved specimens were produced by irra-diating thepolished surfaceswith 30 nanosecond laser pulses generatedby a frequency tripled YHP40 Q-switched Nd:YVO4 laser at 355 nm.
The first group consists of three kinds of grooved surfaces that havea very similar groove pattern referred to as pattern 0. They wereproduced using a single laser pass with the same laser processing
parameters as those used in Ref. [12]. These laser parameters wereused to produce groove spacings of 20, 40 and 60 µm (Fig. 1a–f).
The second group of laser-irradiated surfaces was produced bymultiple laser passes. These include there kinds of grooved surfacesthat have the same groove spacing of 20 µm. However, in this case,different groove surface textures, referred to as groove patterns 1, 2,and 3, were produced (Fig. 1g–i). The laser processing parameters thatwere used to produce the second group of micro-grooves aresummarized in Table 1.
All the grooves on these surfaces had depth of about 8–12 µm andwidth about 11–13 µm. These dimensions were selected based on the
1444 J. Chen et al. / Materials Science and Engineering C 29 (2009) 1442–1452
results from earlier studies [12] that suggested that the optimal groovedimensions for osteoblast ingrowth are on the order of 8 µm to 12 µm,which also promote contact guidance and osseointegration. Furtherdetails of the prior work on nanosecond laser-irradiation of Ti-6Al-4Vare presented in Ref. [17].
2.2. Surface characterization
Pre- and post-processing examination of the textured surfaceregions were performed using SEM (Philips XL30 FEG- SEM), stylusprofilometry (KLA-Tencor P15 Surface Profiler) and atomic forcemicroscopy (Digital Instruments Nanoscope IIIa AFM). The geometriesof grooves (widths and depths) were measured using profilometry,while the groove inside roughness values were measured using AFM.
The adsorptionof extracelluarmatrix proteins to biomedical surfacesis very sensitive to the surface chemistry [1,2,18]. It is, therefore,important to reveal the possible effects of laser irradiation on surfacechemical composition. In addition to using energy dispersive spectro-scopy (EDS), which characterizes the underlying microchemistries inregions within 5 µm from the top surfaces [12], x-ray photoelectronspectroscopy (XPS) was used to examine the surface chemicalcompositions within 10 nm of the top surfaces.
XPS spectra were collected using a VG Scientific ESCALAB2 spec-trometer in which mono-chromated Mg Kα radiat ion(hν=1253.6 eV) was applied to the Ti-6Al-4V surfaces before andafter laser irradiation. A pass energy of 100 eVwas used for wide rangescans (survey scans), while a 20 eV pass energy was used for highresolution measurements of Ti 2p, Al 2p, O 1s and C 1s regions.
For all measurements, the binding energy scale was normalized tothe position of the C 1s peak at 285 eV. Curve fitting of the core-levelXPS lines was carried out using CasaXPS software (Casa Software Ltd.,UK) with a Gaussian–Lorentzian product function and a non-linearShirley background subtraction. A Gaussian–Lorentzian mixing ratiowas taken as 0.3 for all lines.
2.3. Cell culture and SEM observation
To investigate the effects of surface texture on initial cell spreadingand adhesion, osteoblast-like cells human osteosarcoma (HOS; ATCC,Manassas, VA) were incubated with the micro-textured specimens for15-min, 1-hour, 4-hour and 24-hour culture periods. It has beenshown that these cells exhibit a developmental sequence that issimilar to osteoblasts in bone tissue [18].
The HOS cells were cultured in 25 cm2flasks (Becton-Dickinson,
Franklin Lakes, NJ), and maintained in an incubator at an incubationtemperature of 37 °C regulated with 5% CO2, 95% air, and a saturatedhumidity. A Dulbecco’sModified EagleMedium (DMEM) supplementedwith 10% fetal bovine serum and 1% penicillin/streptomycin/amphoter-icin B was used as the cell culture medium (Quality Biological,Giathersburg, MD). At confluence, the cells were sub-cultured bysplitting.. Prior to cell seeding, 50 pieces of Ti-6Al-4V specimens werecleaned, passivated, and sterilized in order to create a clean, titanium-oxide surface for cell proliferation. Briefly, each sample was ultra-sonically cleaned in a solution of double distilled water (dd H2O) anddetergent for 20 min. This was followed by a rinse in dd H2O. Thesurfaces were subsequently sonicated in acetone for 20 min and rinsedwith dd H2O. Each sample was then passivated in 30% nitric acid for15min and rinsedwith ddH2O. All sampleswere then sterilized in 100%ethanol for 5 min and dried with nitrogen gas before being placed inmulti-well culture plates (Becton-Dickinson, Franklin Lakes, NJ). Aftersterilization treatment, HOS cells were trypsinized, harvested, andseeded onto these specimens at a concentration of 5×10⁴ cells/cm2, asdetermined bya hemocytometer count. Themulti-well plateswere thenincubated in a water saturated atmosphere of 95% air−5% CO2 at 37 °C.
After culturing for 15min,1 h, 4 h and 24h, the sampleswere rinsedwith 0.1 M phosphate-buffered saline (PBS). They were then fixed in
3% glutaraldehyde solution for 1 h at room temperature. Subsequently,the samples were rinsed with 0.1 M PBS before dehydrating them atroom-temperature in a graded ethanol series (30%, 50%, 70%, 80%, 90%,95%, and 100%) for 15min at each concentration. Finally, sampleswerecritical point dried, sputter-coated with a 20 nm thick gold layer, andexamined using SEM (Philips XL30 FEG- SEM).
2.4. Immuno-fluorescence staining
After the 1-hour and 4-hhour incubation periods, immuno-fluores-cence staining (IF) was performed using protocols described in detail in[12]. Thesewereused to stain for vinculin (focal adhesions) and the actincyto-skeletal structure. Briefly, the specimenswere first fixed for 15minin a 3.7% formaldehyde solution. Then they were permeablized throughexposure to a 0.5% Triton solution for 15 min. After that, they were thenexposed to a primary antiserum, containing the primary anti-vinculinantibody. The samples were incubated in the primary antiserum for30min in a humid, 37 °C atmosphere. The sampleswere then rinsed andincubated in a secondary antiserum, containing rhodamine phalloidinand a secondary anti-vinculin. The samples were incubated whileexposed to the secondary antiserum for 30 min at 37 °C. IF microscopywas subsequently carried out using a Nikon 50i research microscope,with an EPI-fluorescence attachment and images were taken using aNikon Instruments DXM 1200F color digital camera (Nikon, Melville,NY). Confocal IF microscopy images were taken using a PerkinElmerspinning disk confocaleica SP5 spectral system (PerkinElmer, Waltham,Massachusetts).
2.5. Enzymatic detachment
A 0.25% (v/v) trypsin enzymatic detachment test was used toquantify the adhesion of HOS cells cultured on the micro-texturedsurfaces for durations of 1 and 4 h. To ensure that the samples werefree of nonviable cells, the micro-textured specimens were rinsed 5times in a phosphate buffered solution. Exposure to the trypsinsolution lasted 2.5 min at room temperature. This was followed by a1 ml rinse of PBS. The fluid was collected and saved, and the sampleswere again exposed to trypsin solution. This process was repeated fourmore times with trypsin exposure periods of 2.5, 5, and 10 min.
Each portion of the fluid was then examined for cellular contentusing a hemocytometer. At the end of the experiment, any remainingcells were removed from the specimens by long-term (over an hour)exposure to a 0.5% trypsin solution and physical agitation. A cell countwas then performed again, and normalized with respect to the orig-inal total number of cells on each surface. The data obtained in thismannerwasused to establish a curve of the percentage of cells detachedagainst trypsination time.
2.6. Statistical analysis
Formeasurements of theextentof cell contact guidance (alignment),3 samples per group were subjected to the ImageJ software analyses ofcell areas, with at least 100 cells per sample analyzed. For all celladhesion measurements using enzymatic detachment, 5 specimens pergroup were evaluated. Data were plotted as mean+s.e.m. (stand errorofmean), and comparisonbetween themeanvalues of the experimentalgroupswasmade by the two-sample t-test, which assumes that the twosampled populations are normal and have equal variance. A confidencelevel of 95% (pb0.05) was considered significant.
3. Results
3.1. Surface texture
The SEM images in Fig. 1 show the micro-textured surfacesinvestigated in this study. Fig.1(a)–(c) show the surfacemorphologies
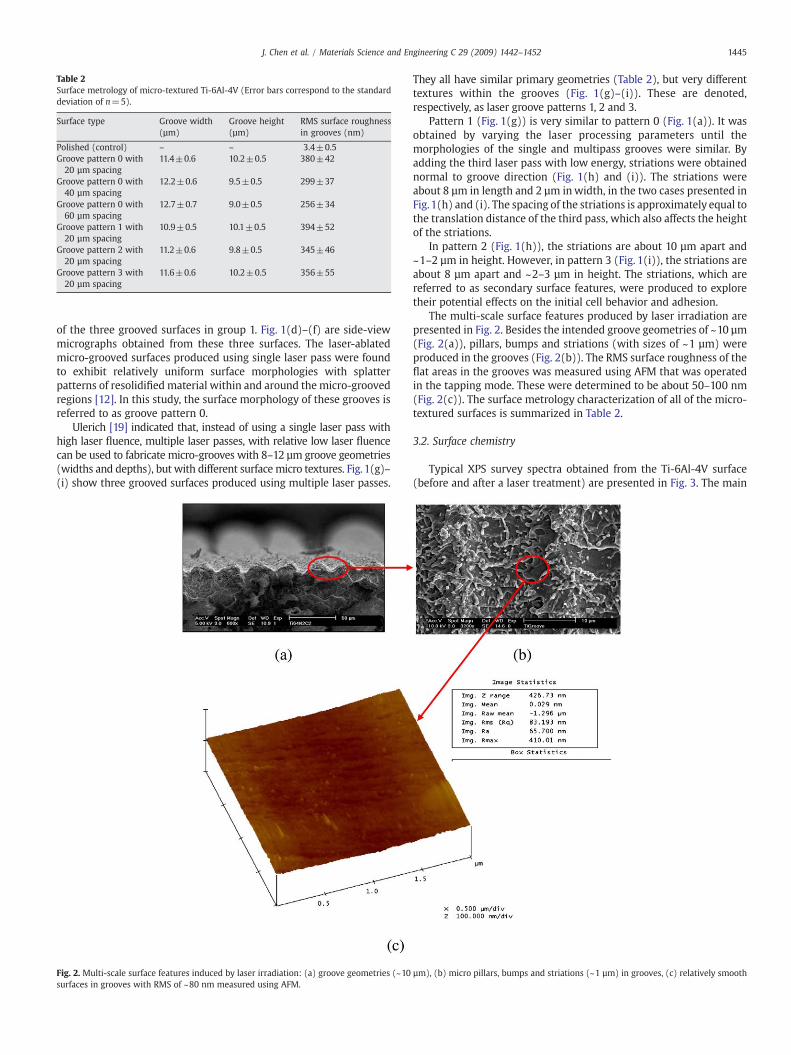
Table 2Surface metrology of micro-textured Ti-6Al-4V (Error bars correspond to the standarddeviation of n=5).
Surface type Groove width(µm)
Groove height(µm)
RMS surface roughnessin grooves (nm)
Polished (control) – – 3.4±0.5Groove pattern 0 with20 µm spacing
11.4±0.6 10.2±0.5 380±42
Groove pattern 0 with40 µm spacing
12.2±0.6 9.5±0.5 299±37
Groove pattern 0 with60 µm spacing
12.7±0.7 9.0±0.5 256±34
Groove pattern 1 with20 µm spacing
10.9±0.5 10.1±0.5 394±52
Groove pattern 2 with20 µm spacing
11.2±0.6 9.8±0.5 345±46
Groove pattern 3 with20 µm spacing
11.6±0.6 10.2±0.5 356±55
1445J. Chen et al. / Materials Science and Engineering C 29 (2009) 1442–1452
of the three grooved surfaces in group 1. Fig. 1(d)–(f) are side-viewmicrographs obtained from these three surfaces. The laser-ablatedmicro-grooved surfaces produced using single laser pass were foundto exhibit relatively uniform surface morphologies with splatterpatterns of resolidified material within and around the micro-groovedregions [12]. In this study, the surface morphology of these grooves isreferred to as groove pattern 0.
Ulerich [19] indicated that, instead of using a single laser pass withhigh laser fluence, multiple laser passes, with relative low laser fluencecan be used to fabricate micro-grooves with 8–12 µm groove geometries(widths and depths), but with different surface micro textures. Fig. 1(g)–(i) show three grooved surfaces produced using multiple laser passes.
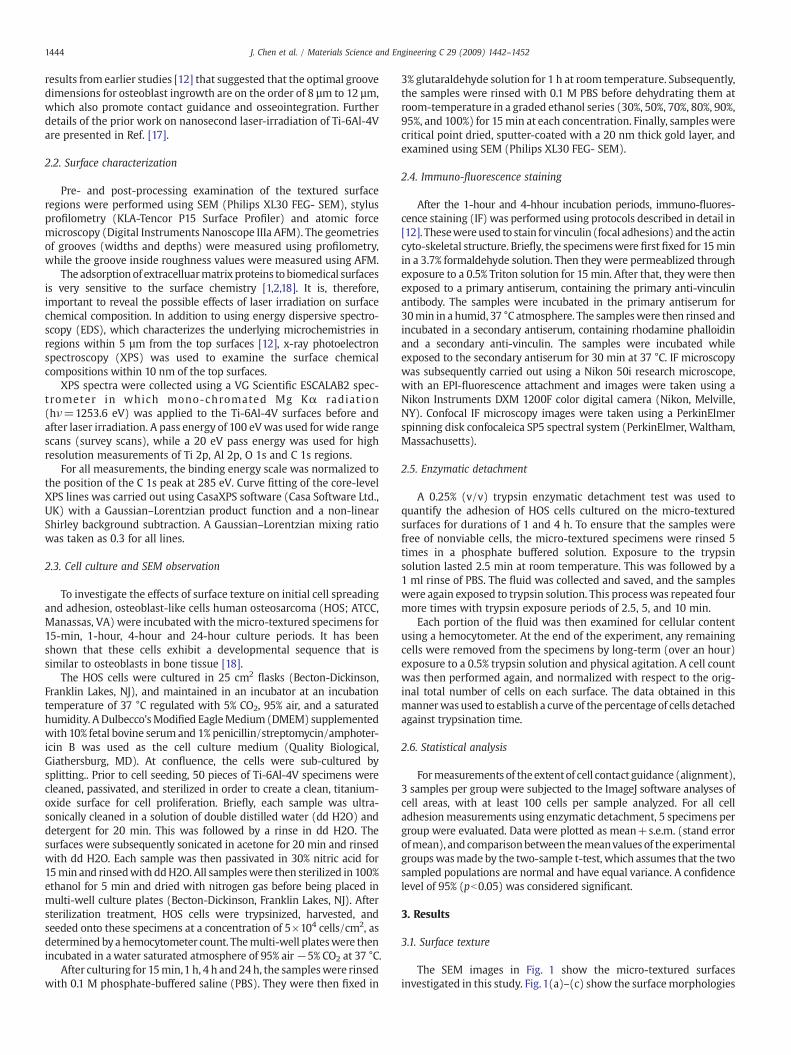
Fig. 2. Multi-scale surface features induced by laser irradiation: (a) groove geometries (~10surfaces in grooves with RMS of ~80 nm measured using AFM.
They all have similar primary geometries (Table 2), but very differenttextures within the grooves (Fig. 1(g)–(i)). These are denoted,respectively, as laser groove patterns 1, 2 and 3.
Pattern 1 (Fig. 1(g)) is very similar to pattern 0 (Fig. 1(a)). It wasobtained by varying the laser processing parameters until themorphologies of the single and multipass grooves were similar. Byadding the third laser pass with low energy, striations were obtainednormal to groove direction (Fig. 1(h) and (i)). The striations wereabout 8 µm in length and 2 µm inwidth, in the two cases presented inFig.1(h) and (i). The spacing of the striations is approximately equal tothe translation distance of the third pass, which also affects the heightof the striations.
In pattern 2 (Fig. 1(h)), the striations are about 10 µm apart and~1–2 µm in height. However, in pattern 3 (Fig. 1(i)), the striations areabout 8 µm apart and ~2–3 µm in height. The striations, which arereferred to as secondary surface features, were produced to exploretheir potential effects on the initial cell behavior and adhesion.
The multi-scale surface features produced by laser irradiation arepresented in Fig. 2. Besides the intended groove geometries of ~10 µm(Fig. 2(a)), pillars, bumps and striations (with sizes of ~1 µm) wereproduced in the grooves (Fig. 2(b)). The RMS surface roughness of theflat areas in the grooves was measured using AFM that was operatedin the tapping mode. These were determined to be about 50–100 nm(Fig. 2(c)). The surface metrology characterization of all of the micro-textured surfaces is summarized in Table 2.
3.2. Surface chemistry
Typical XPS survey spectra obtained from the Ti-6Al-4V surface(before and after a laser treatment) are presented in Fig. 3. The main
µm), (b) micro pillars, bumps and striations (~1 µm) in grooves, (c) relatively smooth
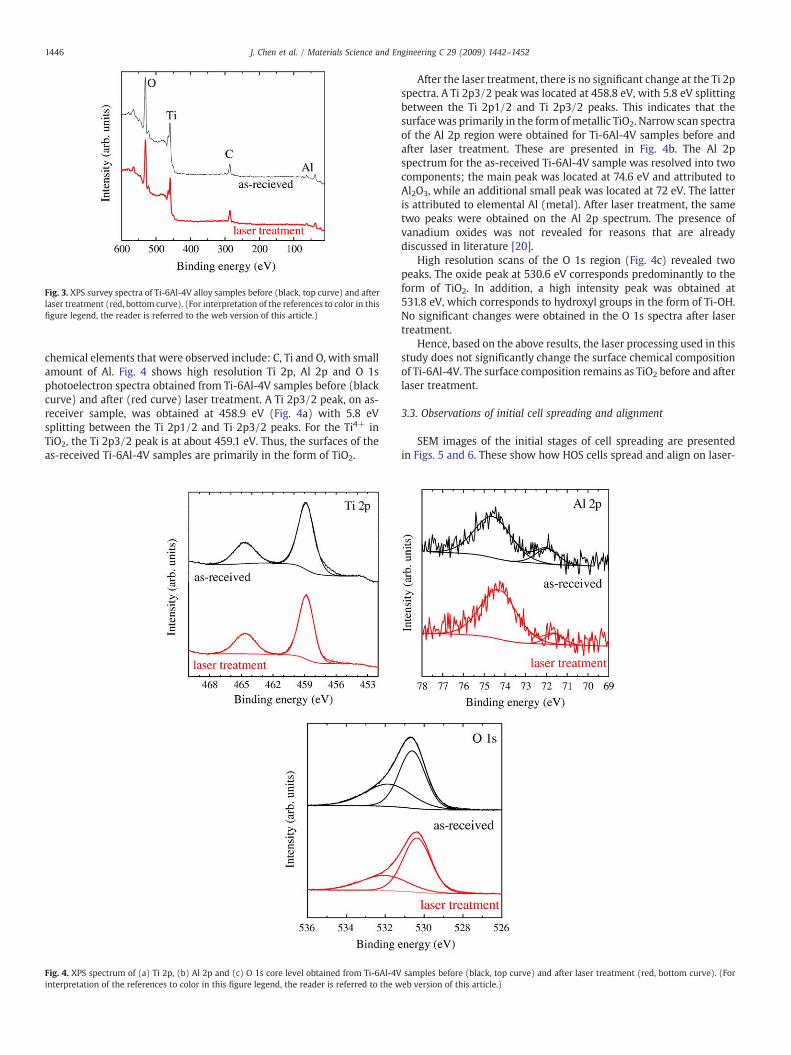
Fig. 3. XPS survey spectra of Ti-6Al-4V alloy samples before (black, top curve) and afterlaser treatment (red, bottom curve). (For interpretation of the references to color in thisfigure legend, the reader is referred to the web version of this article.)
1446 J. Chen et al. / Materials Science and Engineering C 29 (2009) 1442–1452
chemical elements that were observed include: C, Ti and O, with smallamount of Al. Fig. 4 shows high resolution Ti 2p, Al 2p and O 1sphotoelectron spectra obtained from Ti-6Al-4V samples before (blackcurve) and after (red curve) laser treatment. A Ti 2p3/2 peak, on as-receiver sample, was obtained at 458.9 eV (Fig. 4a) with 5.8 eVsplitting between the Ti 2p1/2 and Ti 2p3/2 peaks. For the Ti4+ inTiO2, the Ti 2p3/2 peak is at about 459.1 eV. Thus, the surfaces of theas-received Ti-6Al-4V samples are primarily in the form of TiO2.
Fig. 4. XPS spectrum of (a) Ti 2p, (b) Al 2p and (c) O 1s core level obtained from Ti-6Al-4Vinterpretation of the references to color in this figure legend, the reader is referred to the w
After the laser treatment, there is no significant change at the Ti 2pspectra. A Ti 2p3/2 peak was located at 458.8 eV, with 5.8 eV splittingbetween the Ti 2p1/2 and Ti 2p3/2 peaks. This indicates that thesurfacewas primarily in the form ofmetallic TiO2. Narrow scan spectraof the Al 2p region were obtained for Ti-6Al-4V samples before andafter laser treatment. These are presented in Fig. 4b. The Al 2pspectrum for the as-received Ti-6Al-4V sample was resolved into twocomponents; the main peak was located at 74.6 eV and attributed toAl2O3, while an additional small peak was located at 72 eV. The latteris attributed to elemental Al (metal). After laser treatment, the sametwo peaks were obtained on the Al 2p spectrum. The presence ofvanadium oxides was not revealed for reasons that are alreadydiscussed in literature [20].
High resolution scans of the O 1s region (Fig. 4c) revealed twopeaks. The oxide peak at 530.6 eV corresponds predominantly to theform of TiO2. In addition, a high intensity peak was obtained at531.8 eV, which corresponds to hydroxyl groups in the form of Ti-OH.No significant changes were obtained in the O 1s spectra after lasertreatment.
Hence, based on the above results, the laser processing used in thisstudy does not significantly change the surface chemical compositionof Ti-6Al-4V. The surface composition remains as TiO2 before and afterlaser treatment.
3.3. Observations of initial cell spreading and alignment
SEM images of the initial stages of cell spreading are presentedin Figs. 5 and 6. These show how HOS cells spread and align on laser-
samples before (black, top curve) and after laser treatment (red, bottom curve). (Foreb version of this article.)
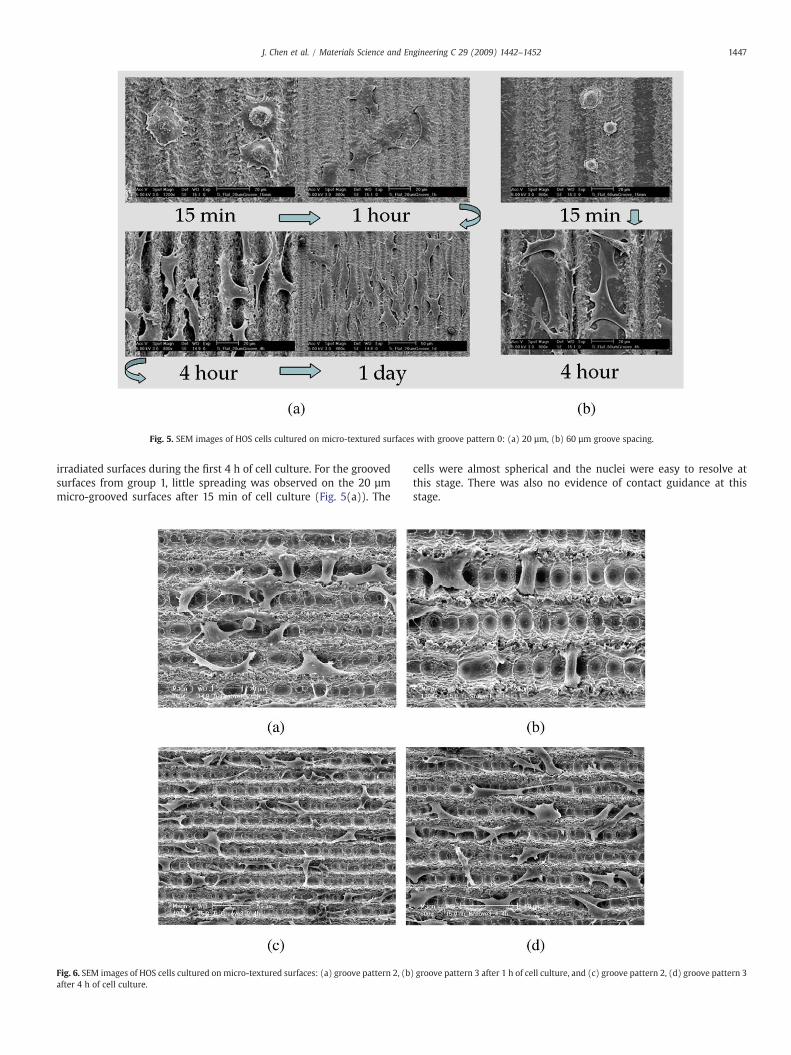
Fig. 5. SEM images of HOS cells cultured on micro-textured surfaces with groove pattern 0: (a) 20 µm, (b) 60 µm groove spacing.
1447J. Chen et al. / Materials Science and Engineering C 29 (2009) 1442–1452
irradiated surfaces during the first 4 h of cell culture. For the groovedsurfaces from group 1, little spreading was observed on the 20 µmmicro-grooved surfaces after 15 min of cell culture (Fig. 5(a)). The
Fig. 6. SEM images of HOS cells cultured on micro-textured surfaces: (a) groove pattern 2, (bafter 4 h of cell culture.
cells were almost spherical and the nuclei were easy to resolve atthis stage. There was also no evidence of contact guidance at thisstage.
) groove pattern 3 after 1 h of cell culture, and (c) groove pattern 2, (d) groove pattern 3
1448 J. Chen et al. / Materials Science and Engineering C 29 (2009) 1442–1452
After 1 h, the cells were observed to spread within the grooves andabove the grooves (Fig. 5(a)). Therewas clear evidence of cell stretchingalong and across the grooves. Many of cells were observed to cover twoadjacent grooves. However, the dominant direction of all stretchingwasalong the grooves.
The stretching and alignment was more evident after 4 h of cellculture (Fig. 5(a)). Compared to the many cells that covered the twogrooves after 1 h, most of the cells were found to spread within agroove (in a groove or along the ridges of a groove). The cells appearedto shrink from the cross groove direction and stretchedmore along thegroove direction in durations between 1 and 4 h. The cell orientationwas clearly evident after 24 h of cell culture, which resulted in almostcomplete coverage of the surfaces. Similar results were observed onthe surfaces with groove separations of 40 and 60 µm. However, therandomness of the cell orientations between the grooves increasedwith increased groove spacing.
For grooved surfaces in group 2,we focus on groove patterns 2 and 3,since the observed cell behavior on grooved pattern 1was very similar tothatongroovepattern 0with20µmspacing.Different fromwhatwe sawon groove patterns 0 and 1, after 1 h, a number of cells were observed tostretch along a direction perpendicular to the groove orientation. This isin contrast to the longitudinal groove orientation observed in groovepatterns 0 and1. The transverse orientation ismorenoticeable onpattern3 thanonpattern 2. However, this effect changeswith culture time. After4 h of cell culture, obvious cell contact guidancewas observed along thegrooves for both patterns 2 and 3 (Fig. 6(c) and (d)).
In order to quantify the effects of contact guidance, the SEM imageswere examined with respect to cell orientation. Orientation wasmeasured by the angular separation between the groove axis and themajor cell axis, as described in Ref. [12]. This was done using theImageJ software package. About 100 cells were measured on eachsample. A smaller orientation angle means a better cell alignment(contact guidance).
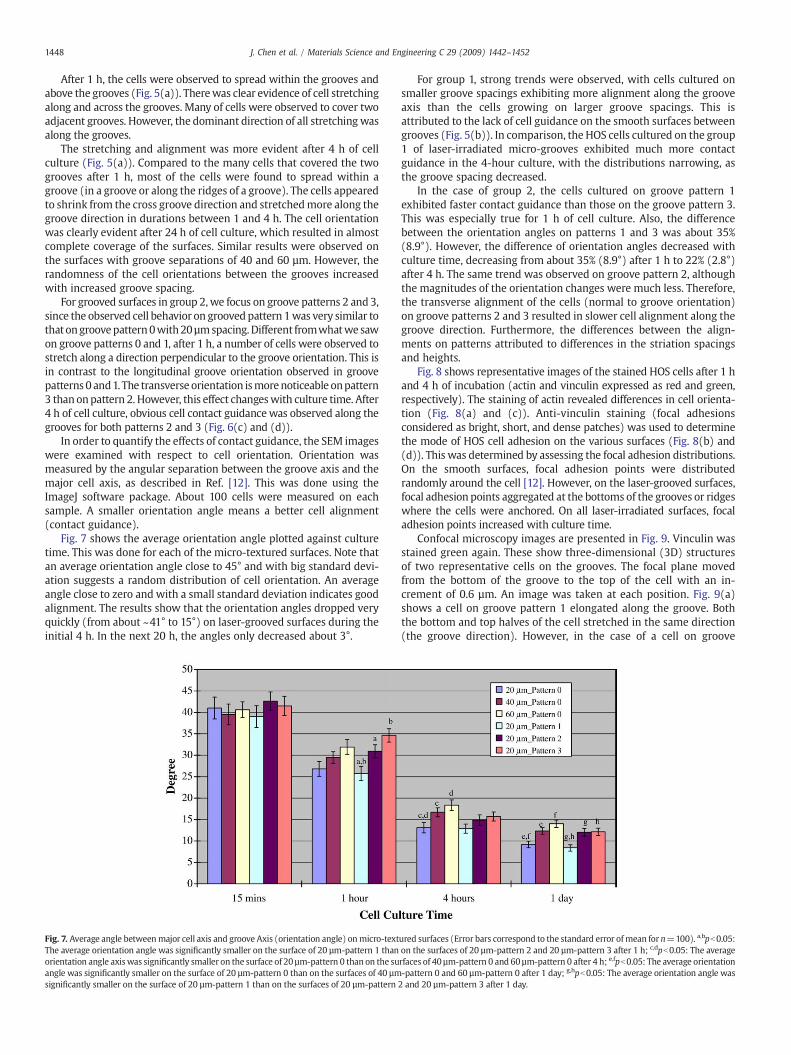
Fig. 7 shows the average orientation angle plotted against culturetime. This was done for each of the micro-textured surfaces. Note thatan average orientation angle close to 45° and with big standard devi-ation suggests a random distribution of cell orientation. An averageangle close to zero and with a small standard deviation indicates goodalignment. The results show that the orientation angles dropped veryquickly (from about ~41° to 15°) on laser-grooved surfaces during theinitial 4 h. In the next 20 h, the angles only decreased about 3°.
Fig. 7. Average angle betweenmajor cell axis and groove Axis (orientation angle) onmicro-textThe average orientation angle was significantly smaller on the surface of 20 µm-pattern 1 thanorientation angle axiswas significantly smaller on the surface of 20 µm-pattern 0 than on the suangle was significantly smaller on the surface of 20 µm-pattern 0 than on the surfaces of 40 µmsignificantly smaller on the surface of 20 µm-pattern 1 than on the surfaces of 20 µm-pattern
For group 1, strong trends were observed, with cells cultured onsmaller groove spacings exhibiting more alignment along the grooveaxis than the cells growing on larger groove spacings. This isattributed to the lack of cell guidance on the smooth surfaces betweengrooves (Fig. 5(b)). In comparison, the HOS cells cultured on the group1 of laser-irradiated micro-grooves exhibited much more contactguidance in the 4-hour culture, with the distributions narrowing, asthe groove spacing decreased.
In the case of group 2, the cells cultured on groove pattern 1exhibited faster contact guidance than those on the groove pattern 3.This was especially true for 1 h of cell culture. Also, the differencebetween the orientation angles on patterns 1 and 3 was about 35%(8.9°). However, the difference of orientation angles decreased withculture time, decreasing from about 35% (8.9°) after 1 h to 22% (2.8°)after 4 h. The same trend was observed on groove pattern 2, althoughthe magnitudes of the orientation changes were much less. Therefore,the transverse alignment of the cells (normal to groove orientation)on groove patterns 2 and 3 resulted in slower cell alignment along thegroove direction. Furthermore, the differences between the align-ments on patterns attributed to differences in the striation spacingsand heights.
Fig. 8 shows representative images of the stained HOS cells after 1 hand 4 h of incubation (actin and vinculin expressed as red and green,respectively). The staining of actin revealed differences in cell orienta-tion (Fig. 8(a) and (c)). Anti-vinculin staining (focal adhesionsconsidered as bright, short, and dense patches) was used to determinethe mode of HOS cell adhesion on the various surfaces (Fig. 8(b) and(d)). This was determined by assessing the focal adhesion distributions.On the smooth surfaces, focal adhesion points were distributedrandomly around the cell [12]. However, on the laser-grooved surfaces,focal adhesion points aggregated at the bottoms of the grooves or ridgeswhere the cells were anchored. On all laser-irradiated surfaces, focaladhesion points increased with culture time.
Confocal microscopy images are presented in Fig. 9. Vinculin wasstained green again. These show three-dimensional (3D) structuresof two representative cells on the grooves. The focal plane movedfrom the bottom of the groove to the top of the cell with an in-crement of 0.6 µm. An image was taken at each position. Fig. 9(a)shows a cell on groove pattern 1 elongated along the groove. Boththe bottom and top halves of the cell stretched in the same direction(the groove direction). However, in the case of a cell on groove
ured surfaces (Error bars correspond to the standard error ofmean for n=100). a,bpb0.05:on the surfaces of 20 µm-pattern 2 and 20 µm-pattern 3 after 1 h; c,dpb0.05: The averagerfaces of 40 µm-pattern 0 and 60 µm-pattern 0 after 4 h; e,fpb0.05: The average orientation-pattern 0 and 60 µm-pattern 0 after 1 day; g,hpb0.05: The average orientation angle was2 and 20 µm-pattern 3 after 1 day.
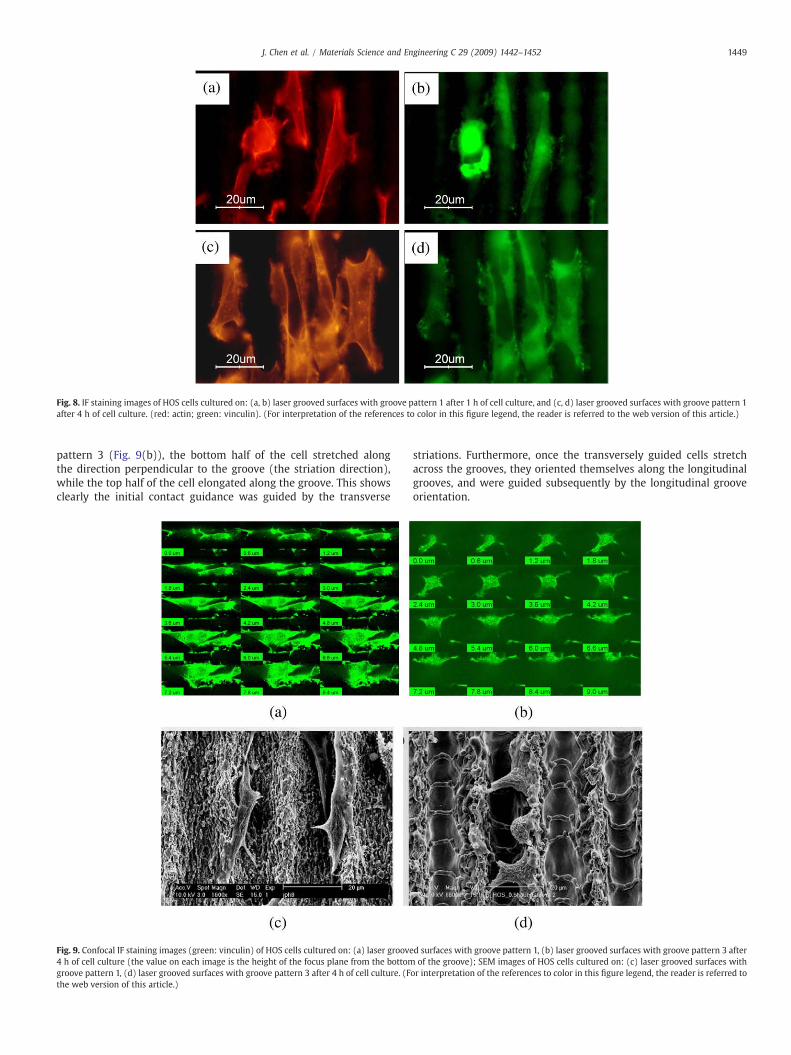
Fig. 8. IF staining images of HOS cells cultured on: (a, b) laser grooved surfaces with groove pattern 1 after 1 h of cell culture, and (c, d) laser grooved surfaces with groove pattern 1after 4 h of cell culture. (red: actin; green: vinculin). (For interpretation of the references to color in this figure legend, the reader is referred to the web version of this article.)
1449J. Chen et al. / Materials Science and Engineering C 29 (2009) 1442–1452
pattern 3 (Fig. 9(b)), the bottom half of the cell stretched alongthe direction perpendicular to the groove (the striation direction),while the top half of the cell elongated along the groove. This showsclearly the initial contact guidance was guided by the transverse
Fig. 9. Confocal IF staining images (green: vinculin) of HOS cells cultured on: (a) laser groove4 h of cell culture (the value on each image is the height of the focus plane from the bottomgroove pattern 1, (d) laser grooved surfaces with groove pattern 3 after 4 h of cell culture. (Fthe web version of this article.)
striations. Furthermore, once the transversely guided cells stretchacross the grooves, they oriented themselves along the longitudinalgrooves, and were guided subsequently by the longitudinal grooveorientation.
d surfaces with groove pattern 1, (b) laser grooved surfaces with groove pattern 3 afterof the groove); SEM images of HOS cells cultured on: (c) laser grooved surfaces with
or interpretation of the references to color in this figure legend, the reader is referred to
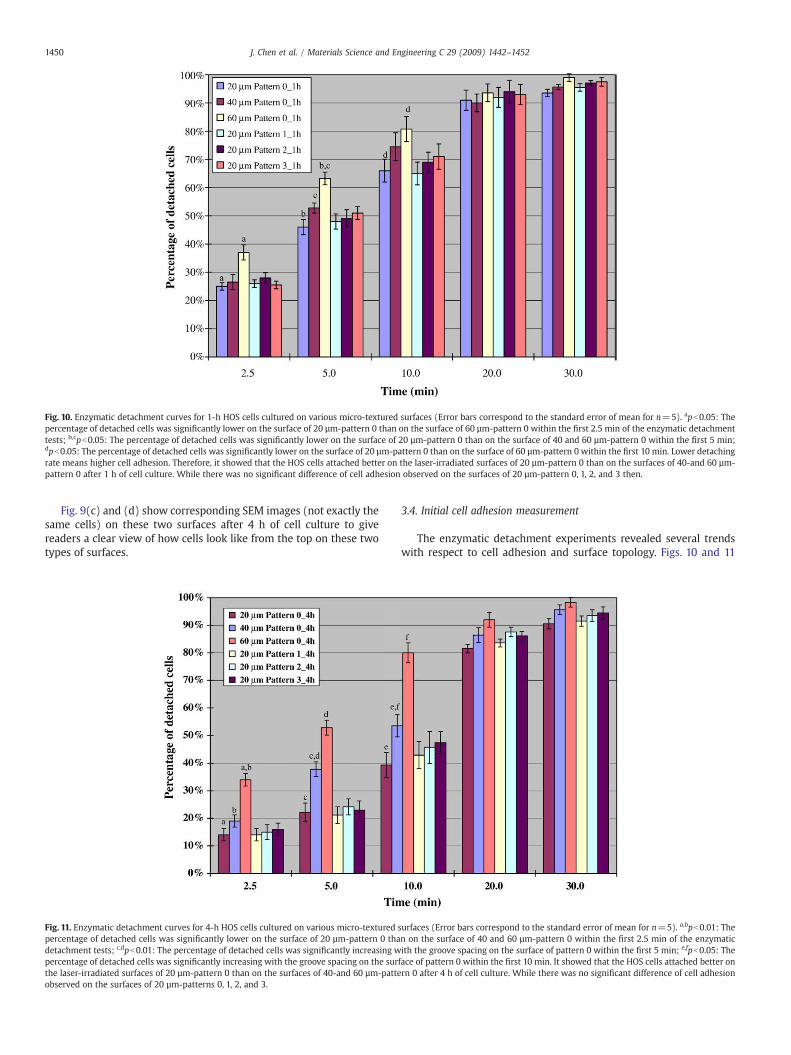
Fig. 10. Enzymatic detachment curves for 1-h HOS cells cultured on various micro-textured surfaces (Error bars correspond to the standard error of mean for n=5). apb0.05: Thepercentage of detached cells was significantly lower on the surface of 20 µm-pattern 0 than on the surface of 60 µm-pattern 0 within the first 2.5 min of the enzymatic detachmenttests; b,cpb0.05: The percentage of detached cells was significantly lower on the surface of 20 µm-pattern 0 than on the surface of 40 and 60 µm-pattern 0 within the first 5 min;dpb0.05: The percentage of detached cells was significantly lower on the surface of 20 µm-pattern 0 than on the surface of 60 µm-pattern 0 within the first 10 min. Lower detachingrate means higher cell adhesion. Therefore, it showed that the HOS cells attached better on the laser-irradiated surfaces of 20 µm-pattern 0 than on the surfaces of 40-and 60 µm-pattern 0 after 1 h of cell culture. While there was no significant difference of cell adhesion observed on the surfaces of 20 µm-pattern 0, 1, 2, and 3 then.
1450 J. Chen et al. / Materials Science and Engineering C 29 (2009) 1442–1452
Fig. 9(c) and (d) show corresponding SEM images (not exactly thesame cells) on these two surfaces after 4 h of cell culture to givereaders a clear view of how cells look like from the top on these twotypes of surfaces.
Fig. 11. Enzymatic detachment curves for 4-h HOS cells cultured on various micro-texturedpercentage of detached cells was significantly lower on the surface of 20 µm-pattern 0 thadetachment tests; c,dpb0.01: The percentage of detached cells was significantly increasing wpercentage of detached cells was significantly increasing with the groove spacing on the surthe laser-irradiated surfaces of 20 µm-pattern 0 than on the surfaces of 40-and 60 µm-patteobserved on the surfaces of 20 µm-patterns 0, 1, 2, and 3.
3.4. Initial cell adhesion measurement
The enzymatic detachment experiments revealed several trendswith respect to cell adhesion and surface topology. Figs. 10 and 11
surfaces (Error bars correspond to the standard error of mean for n=5). a,bpb0.01: Then on the surface of 40 and 60 µm-pattern 0 within the first 2.5 min of the enzymaticith the groove spacing on the surface of pattern 0 within the first 5 min; e,fpb0.05: Theface of pattern 0 within the first 10 min. It showed that the HOS cells attached better onrn 0 after 4 h of cell culture. While there was no significant difference of cell adhesion
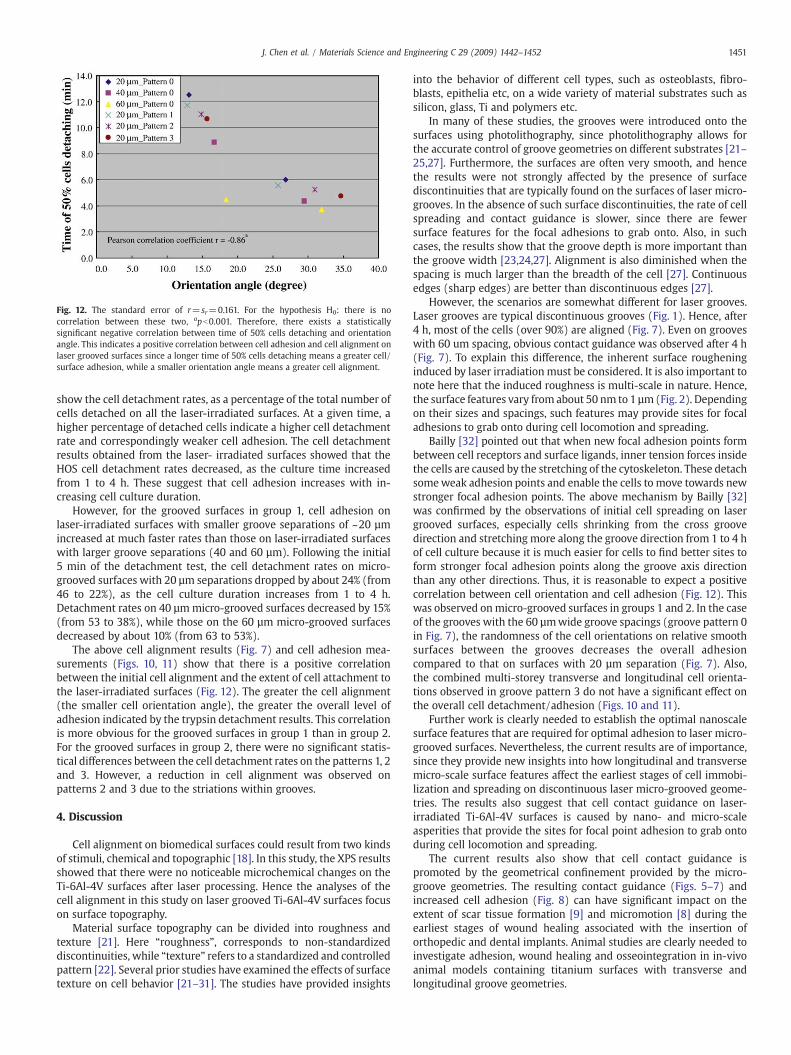
Fig. 12. The standard error of r=sr=0.161. For the hypothesis H0: there is nocorrelation between these two, apb0.001. Therefore, there exists a statisticallysignificant negative correlation between time of 50% cells detaching and orientationangle. This indicates a positive correlation between cell adhesion and cell alignment onlaser grooved surfaces since a longer time of 50% cells detaching means a greater cell/surface adhesion, while a smaller orientation angle means a greater cell alignment.
1451J. Chen et al. / Materials Science and Engineering C 29 (2009) 1442–1452
show the cell detachment rates, as a percentage of the total number ofcells detached on all the laser-irradiated surfaces. At a given time, ahigher percentage of detached cells indicate a higher cell detachmentrate and correspondingly weaker cell adhesion. The cell detachmentresults obtained from the laser- irradiated surfaces showed that theHOS cell detachment rates decreased, as the culture time increasedfrom 1 to 4 h. These suggest that cell adhesion increases with in-creasing cell culture duration.
However, for the grooved surfaces in group 1, cell adhesion onlaser-irradiated surfaces with smaller groove separations of ~20 µmincreased at much faster rates than those on laser-irradiated surfaceswith larger groove separations (40 and 60 µm). Following the initial5 min of the detachment test, the cell detachment rates on micro-grooved surfaces with 20 µm separations dropped by about 24% (from46 to 22%), as the cell culture duration increases from 1 to 4 h.Detachment rates on 40 µmmicro-grooved surfaces decreased by 15%(from 53 to 38%), while those on the 60 µm micro-grooved surfacesdecreased by about 10% (from 63 to 53%).
The above cell alignment results (Fig. 7) and cell adhesion mea-surements (Figs. 10, 11) show that there is a positive correlationbetween the initial cell alignment and the extent of cell attachment tothe laser-irradiated surfaces (Fig. 12). The greater the cell alignment(the smaller cell orientation angle), the greater the overall level ofadhesion indicated by the trypsin detachment results. This correlationis more obvious for the grooved surfaces in group 1 than in group 2.For the grooved surfaces in group 2, there were no significant statis-tical differences between the cell detachment rates on the patterns 1, 2and 3. However, a reduction in cell alignment was observed onpatterns 2 and 3 due to the striations within grooves.
4. Discussion
Cell alignment on biomedical surfaces could result from two kindsof stimuli, chemical and topographic [18]. In this study, the XPS resultsshowed that there were no noticeable microchemical changes on theTi-6Al-4V surfaces after laser processing. Hence the analyses of thecell alignment in this study on laser grooved Ti-6Al-4V surfaces focuson surface topography.
Material surface topography can be divided into roughness andtexture [21]. Here “roughness”, corresponds to non-standardizeddiscontinuities, while “texture” refers to a standardized and controlledpattern [22]. Several prior studies have examined the effects of surfacetexture on cell behavior [21–31]. The studies have provided insights
into the behavior of different cell types, such as osteoblasts, fibro-blasts, epithelia etc, on a wide variety of material substrates such assilicon, glass, Ti and polymers etc.
In many of these studies, the grooves were introduced onto thesurfaces using photolithography, since photolithography allows forthe accurate control of groove geometries on different substrates [21–25,27]. Furthermore, the surfaces are often very smooth, and hencethe results were not strongly affected by the presence of surfacediscontinuities that are typically found on the surfaces of laser micro-grooves. In the absence of such surface discontinuities, the rate of cellspreading and contact guidance is slower, since there are fewersurface features for the focal adhesions to grab onto. Also, in suchcases, the results show that the groove depth is more important thanthe groove width [23,24,27]. Alignment is also diminished when thespacing is much larger than the breadth of the cell [27]. Continuousedges (sharp edges) are better than discontinuous edges [27].
However, the scenarios are somewhat different for laser grooves.Laser grooves are typical discontinuous grooves (Fig. 1). Hence, after4 h, most of the cells (over 90%) are aligned (Fig. 7). Even on grooveswith 60 um spacing, obvious contact guidance was observed after 4 h(Fig. 7). To explain this difference, the inherent surface rougheninginduced by laser irradiation must be considered. It is also important tonote here that the induced roughness is multi-scale in nature. Hence,the surface features vary from about 50 nm to 1 µm (Fig. 2). Dependingon their sizes and spacings, such features may provide sites for focaladhesions to grab onto during cell locomotion and spreading.
Bailly [32] pointed out that when new focal adhesion points formbetween cell receptors and surface ligands, inner tension forces insidethe cells are caused by the stretching of the cytoskeleton. These detachsomeweak adhesion points and enable the cells to move towards newstronger focal adhesion points. The above mechanism by Bailly [32]was confirmed by the observations of initial cell spreading on lasergrooved surfaces, especially cells shrinking from the cross groovedirection and stretching more along the groove direction from 1 to 4 hof cell culture because it is much easier for cells to find better sites toform stronger focal adhesion points along the groove axis directionthan any other directions. Thus, it is reasonable to expect a positivecorrelation between cell orientation and cell adhesion (Fig. 12). Thiswas observed onmicro-grooved surfaces in groups 1 and 2. In the caseof the grooves with the 60 µmwide groove spacings (groove pattern 0in Fig. 7), the randomness of the cell orientations on relative smoothsurfaces between the grooves decreases the overall adhesioncompared to that on surfaces with 20 µm separation (Fig. 7). Also,the combined multi-storey transverse and longitudinal cell orienta-tions observed in groove pattern 3 do not have a significant effect onthe overall cell detachment/adhesion (Figs. 10 and 11).
Further work is clearly needed to establish the optimal nanoscalesurface features that are required for optimal adhesion to laser micro-grooved surfaces. Nevertheless, the current results are of importance,since they provide new insights into how longitudinal and transversemicro-scale surface features affect the earliest stages of cell immobi-lization and spreading on discontinuous laser micro-grooved geome-tries. The results also suggest that cell contact guidance on laser-irradiated Ti-6Al-4V surfaces is caused by nano- and micro-scaleasperities that provide the sites for focal point adhesion to grab ontoduring cell locomotion and spreading.
The current results also show that cell contact guidance ispromoted by the geometrical confinement provided by the micro-groove geometries. The resulting contact guidance (Figs. 5–7) andincreased cell adhesion (Fig. 8) can have significant impact on theextent of scar tissue formation [9] and micromotion [8] during theearliest stages of wound healing associated with the insertion oforthopedic and dental implants. Animal studies are clearly needed toinvestigate adhesion, wound healing and osseointegration in in-vivoanimal models containing titanium surfaces with transverse andlongitudinal groove geometries.
1452 J. Chen et al. / Materials Science and Engineering C 29 (2009) 1442–1452
5. Conclusion
This paper presents the results of an experimental study of theinitial cell spreading and adhesion of HOS cells on laser-irradiatedTi-6Al-4V surfaces with well-controlled micro-groove spacings andorientations. The spreading and adhesion of HOS cellswas investigatedduring thefirst 24h of cell culture. Salient conclusions arising from thisstudy are summarized below.
1. Relatively straight and uniform micro-grooves are produced onTi-6Al-4V using a UV laser operated atwavelength of 355 nm. Thesegrooves have micron-scale (~1 µm) and sub-micron-scale(~0.1 µm) surface features on the ridges between the grooves,and along the grooved surfaces that affect subsequent cell spreadingand adhesion.
2. No significant changes in surface microchemistry occur for therange of laser processing parameters that was employed in thisstudy. Themicrochemical analyses show that the surfaces consist ofTiO2 layers in all cases.
3. Longitudinal cell contact guidance (alignment along the groovedirections) was observed on all of the six types of laser-irradiatedmicro-grooved surfaces that were examined in this study. Also theextent of longitudinal cell contact guidance increased withdecreasing longitudinal groove spacing.
4. Some short-term (1–4 h) transverse cell contact guidance was alsopromoted by transverse patterns, although long-term contactguidance occurred in the longitudinal direction after ~4 h of cellculture.
5. The enzymatic detachment results showed that enhanced attach-ment occurred on the micro-grooved Ti-6Al-4V surfaces during theinitial 4 h of cell culture. The overall adhesion (measured by atrypsin detachment test) almost doubles, as the cell culture periodincreases from 1 to 4 h. There exists a positive correlation betweencell orientation and cell adhesion.
Acknowledgments
We would like to thank Dr. Minwei Li and Steve Mwenifumbo fortheir help with experimental techniques. The research was supportedby the Division of Materials Research of The National ScienceFoundation (Grant No. DMR-0231418). The authors are grateful tothe Program Manager, Dr. Carmen Huber, for her encouragement andsupport.
References
[1] B.D. Ratner, A.S. Hoffman, F.J. Schoen, J.E. Lemons, Biomaterials Science: anIntroduction to Materials in Medicine, Academic Press, San Diego, 1996.
[2] D.M. Brunette, P. Tengvall, M. Textor, P. Thomsen, Titanium in Medicine: MaterialScience, Surface Science, Engineering, Biological Responses and Medical Applica-tions, Springer, New York, 2001.
[3] W.H. Harris, Clinical Orthopaedics 311 (1995) 46.[4] B.S. Park, S.J. Heo, C.S. Kim, J. Oh, J. Kim, G. Lee, W.H. Park, C. Chung, B. Min, Journal
of Biomedical Materials Research Part A 74A (2005) 640.[5] A. Piattelli, A. Scarano, M. Piattelli, L. Calabrese, Biomaterials 17 (1996) 1015.[6] C.Y. Yang, B.C. Wang, E. Chang, B.C. Wu, Journal of Materials Science: Materials in
Medicine 6 (1995) 258.[7] K. Anselme, P. Linez, M. Bigerelle, D.L. Maguer, A.L. Maguer, P. Hardouin, H.F.
Hildebrand, A. Iost, J.M. Leroy, Biomaterials 21 (2000) 1567.[8] J.L. Ricci, H. Alexander, Key Engineering Materials 198–199 (2001) 179.[9] J.L. Ricci, J. Charvet, S.R. Frenkel, R. Chang, P. Nadkarni, J. Turner, H. Alexander, Bone
Response to Laser Microtextured Surfaces, Em2 Inc., Toronto, 2000, p. 1.[10] W.O. Soboyejo, C. Mercer, S. Allameh, B. Nemetski, N. Marcantonio, J.L. Ricci, Key
Engineering Materials 198–199 (2001) 203.[11] S. Mwenifumbo, M. Li, J. Chen, A. Beye, W.O. Soboyejo, Journal of Materials Science:
Materials in Medicine 18 (2007) 9.[12] J. Chen, S. Mwenifumbo, C. Langhammer, J.-P. McGovern, M. Li, A. Beye, W.O.
Soboyejo, Journal of Biomedical Materials Research Part B: Applied Biomaterials82B (2006) 360.
[13] L. Hao, J. Lawrence, L. Li, Applied Surface Science 247 (2005) 602.[14] N. Mirhosseini, P.L. Crouse, M.J.J. Schmidtha, L. Li, D. Garrod, Applied Surface
Science 253 (2007) 7738.[15] D.A. Puleo, R. Bizios, Journal of Biomedical Materials Research 26 (1992) 291.[16] L.L. Hench, Journal of Biomedical Materials Research 41 (1998) 511.[17] S. Mwenifumbo, N.D. Morris, M. Li, W.O. Soboyejo, An investigation of nano-second
uv laser processing parameters on surface micro-groove geometry and micro-structure in Ti6Al4V, TMS, San Diego, 2003, p. 141.
[18] K. Anselme, Biomaterials 21 (2000) 667.[19] J.P. Ulerich, Multi-scale laser surface modification of Ti-6Al-4V and its effect on cell
adhesion, Department of Mechanical and Aerospace Engineering, vol Bachelor,Princeton University, Princeton, 2007, p. 37.
[20] I. Miloev, M. Metiko-Hukovi, H.H. Strehblow, Biomaterials 21 (2000) 2103.[21] X.F. Walboomers, J.A. Jansen, Odontology 89 (2001) 2.[22] A.F. von Recum, T.G. van Kooten, Journal of Biomaterials Science. Polymer Ed. 7
(1995) 181.[23] A.I. Teixeira, G.A. McKie, J.D. Foley, P.J. Bertics, P.F. Nealey, C.J. Murphy, Biomaterials
27 (2006) 3945.[24] C.J. Bettinger, B. Orrick, A. Misra, R. Langer, J.T. Borenstein, Biomaterials 27 (2006)
2558.[25] E. Leclerc, A. Corlu, L. Griscom, R. Baudoin, C. Legallais, Biomaterials 27 (2006)
4109.[26] L. Ponsonnet, V. Comte, A. Othmane, C. Lagneau,M. Charbonnier, M. Lissac, N. Jaffrezic,
Materials Science and Engineering: C 21 (2002) 157.[27] A.-S. Andersson, P. Olsson, U. Lidberg, D. Sutherland, Experimental Cell Research
288 (2003) 177.[28] H.J. Kim, S.H. Kim, M.S. Kim, E.J. Lee, H.G. Oh, W.M. Oh, S.W. Park, W.J. Kim, G.J. Lee,
N.G. Choi, J.T. Koh, D.B. Dinh, R.R. Hardin, K. Johnson, V.L. Sylvia, J.P. Schmitz, D.D.Dean, Journal of Biomedical Materials Research Part A 74A (2005) 366.
[29] B. Baharloo, M. Textor, D.M. Brunette, Journal of Biomedical Materials ResearchPart A 74A (2005) 12.
[30] H.H. Huang, C.T. Ho, T.H. Lee, T.L. Lee, K.K. Liao, F.L. Chen, Biomolecular Engineering21 (2004) 93.
[31] W. Zhou, X. Zhong, X. Wu, L. Yuan, Z. Zhao, H. Wang, Y. Xia, Y. Feng, J. He, W. Chen,Surface & Coatings Technology 200 (2006) 6155.
[32] M. Bailly, J. Condeelis, Nature Cell Biology 4(E) (2002) 292.


![microRNA-29c inhibits cell proliferation by targeting NASP in … · 2017. 8. 28. · WIP1 [9]. In lung cancer, miR-29c was shown to suppress cell adhesion and metastasis by targeting](https://img.pdfslide.us/doc/110x75/612cfe7f1ecc51586941e9e7/microrna-29c-inhibits-cell-proliferation-by-targeting-nasp-in-2017-8-28-wip1.jpg)