Embed Size (px)
Citation preview

Materials published here have a working paper character. They can be subject to further
publication. The views and opinions expressed here reflect the author(s) point of view and not
necessarily those of CASE Network.
Keywords: Special Economic Zones, Panel Data, Policy Evaluation, Regional Development, Reindustrialization, Competitiveness JEL Codes: F13, F23, C23, R11, P25 © CASE – Center for Social and Economic Research, Warsaw, 2014 Graphic Design: Agnieszka Natalia Bury
EAN 9788371785993
Publisher:
CASE-Center for Social and Economic Research on behalf of CASE Network
al. Jana Pawla II 61, office 212, 01-031 Warsaw, Poland
tel.: (48 22) 206 29 00, 828 61 33, fax: (48 22) 206 29 01
e-mail: [email protected]
http://www.case-research.eu
CASE Network Studies & Analyses No. 467 –Special Economic Zones - 20 years later
�
The CASE Network is a group of economic and social research centers in Poland, Kyrgyzstan,
Ukraine, Georgia, Moldova, and Belarus. Organizations in the network regularly conduct joint
research and advisory projects. The research covers a wide spectrum of economic and social
issues, including economic effects of the European integration process, economic relations
between the EU and CIS, monetary policy and euro-accession, innovation and competitive-
ness, and labour markets and social policy. The network aims to increase the range and quality
of economic research and information available to policy-makers and civil society, and takes
an active role in on-going debates on how to meet the economic challenges facing the EU,
post-transition countries and the global economy.
The CASE Network consists of:
- CASE – Center for Social and Economic Research, Warsaw, est. �99�,
www.case-research.eu
- CASE – Center for Social and Economic Research – Kyrgyzstan, est. �998,
http://case.jet.kg/
- Center for Social and Economic Research - CASE Ukraine, est. �999,
www.case-ukraine.com.ua
- Foundation for Social and Economic Research CASE Moldova, est. 2003,
www.case.com.md
- CASE Belarus - Center for Social and Economic Research Belarus, est. 2007,
www. case-belarus.eu
- Center for Social and Economic Research CASE Georgia, est. 20��
CASE Network Studies & Analyses No. 467 –Special Economic Zones - 20 years later
2
Contents
Contents ............................................................................................................................. 3
Abstract .............................................................................................................................. 6
1. Special economic zones (SEZs) as a recurring topic in economics and regional
development studies ........................................................................................................ 7
2. Are SEZs effective according to existing literature? ................................................. 8
3. Background and policy context of the Polish SEZs ................................................ 11
4. Data and methodology used to evaluate the SEZ policy ........................................ 13
4.1 Data variables ....................................................................................................... 13
4.2 Pooled descriptive statistics ............................................................................... 15
4.3 Econometric methods used to analyze the data ............................................... 16
4.3.1 Panel descriptive statistics .............................................................................. 17
4.3.2 Panel data estimators ....................................................................................... 17
5. Statistical results ........................................................................................................ 18
5.1 Difference-in-difference estimates ..................................................................... 18
5.2 Employment effect in panel regressions ........................................................... 20
5.3 Business creation effects in panel regressions ................................................ 22
5.4 Income (wage) effect in panel regressions ....................................................... 24
5.5 Environmental impact in panel regressions ...................................................... 25
6. Discussion of the results and conclusion of the study .......................................... 27
References ...................................................................................................................... 30
Appendix ......................................................................................................................... 32
CASE Network Studies & Analyses No. 467 –Special Economic Zones - 20 years later
3
List of tables
Table � – Study variables ................................................................................................. �4
Table 2 – Coefficient of variation for the dependent variables, comparing nuts4 and nuts5 .......................................................................................................................... �6
Table 3 – Difference-in-difference estimates for the SEZ policy ....................................... �9
Table 4 – Panel regressions for the employment effect of the SEZ policy, nuts5 level (villages) ........................................................................................................................... 2�
Table 5 – Panel regressions for the firm creation effect of the SEZ policy, nuts5 level (villages) ...........................................................................................................................
Table 6 – Panel regressions for the foreign firm creation effect of the SEZ policy, nuts5 level (villages) ........................................................................................................................... 23
Table 7 – Panel regressions for the investment effect of the SEZ policy, nuts4 level (communes) ..................................................................................................................... 24
Table 8 – Panel regressions for the income effect of the SEZ policy, nuts4 level (communes) .................................................................................................................... 25
Table 9 – Panel regressions for the emission effect of the SEZ policy, nuts5 level (villages) ........................................................................................................................... 26
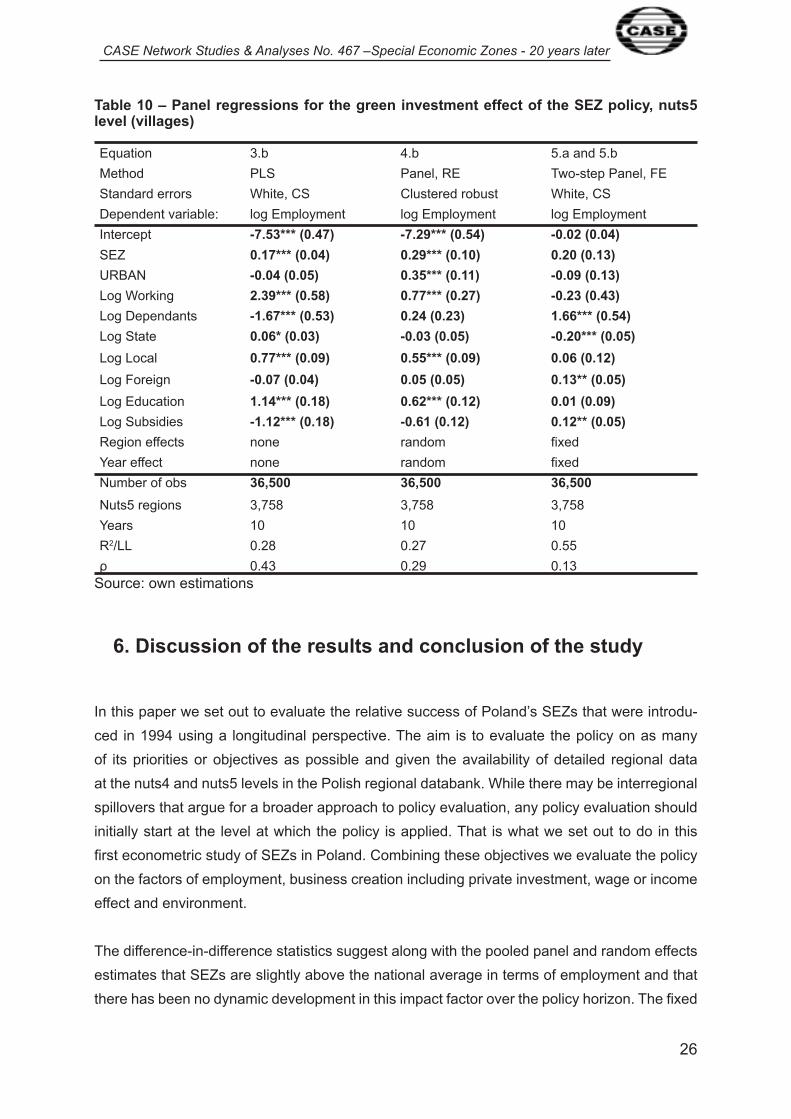
Table �0 – Panel regressions for the green investment effect of the SEZ policy, nuts5 level (villages) ........................................................................................................................... 27
CASE Network Studies & Analyses No. 467 –Special Economic Zones - 20 years later
4
Camilla Jensen is Associate Professor in International Business and Entrepreneurship
at University of Southern Denmark and Research Fellow at Center for Social
and Economic Research (CASE) in Warsaw. Prior to this she has worked as Director of Studies
at Nottingham School of Economics, Malsia Campus, as Associate Professor
at Kadir Has University in Istanbul and as Associate and Assistant Professor
at Copenhagen Business School. She has extensive experience from living, teaching
and doing research in the field. Her field experience includes work on Poland, Cuba,
Turkey and Malaysia. Camilla holds a PhD in economics from University of Southern Denmark,
Odense Campus. Her thesis was on Foreign Direct Investment and Technological Change
in Polish manufacturing. Since then her research has focused on topics in economic
development and transition and in particular related with firm performance and economic
growth.
Marcin Winiarczyk is currently Senior Auditor at Danske Bank in Copenhagen. He is
lead auditor on assignments involving the internal capital adequacy assessment process,
stress testing, capital allocation and operational risk management. Between 2006-2012, he
worked as economist at Copenhagen Economics A/S, where he delivered impact assessments
and policy advice to the European Commission (DG Internal Market and Services and DG
Taxation and Customs Union), the European Parliament and a range of public and private clients,
focusing on market opening in the postal sector, tax reforms, energy and environment,
and foreign direct investment. Marcin holds a M.Sc. in Applied Economics and Finance
from Copenhagen Business School and the CEMS Master’s in International Management,
both from 2006.”

CASE Network Studies & Analyses No. 467 –Special Economic Zones - 20 years later
5
Abstract
In this paper we undertake an ex-post evaluation of whether the special economic zones
(SEZs) introduced in Poland in �994 have been successful in meeting regional development
objectives. We evaluate the policy on as many of its objectives as possible: employment cre-
ation, business creation (which includes attracting foreign direct investment), income or wage
effects, and environmental sustainability.
We use different panel data methods to investigate this question at the powiat (nuts4 or so-
mething similar to a commune) and gmina (nuts5 or something similar to a village) levels
in Poland during the �995-20�� period. It is also possible to include numerous controls to redu-
ce the problem of the omitted variables bias such as education level, dependency rates, state
ownership, general subsidies and whether the area is urban or rural.
Our results indicate that SEZs in Poland have been successful in a number of their obje-
ctives such as private business creation. The positive effect of the policy however mainly
comes through foreign direct investment (FDI), whereas the effects on e.g. investment and
employment are small or insignificant. In other areas, such as securing higher income levels
and locking firms into the sustainability agenda through the adoption of green technologies
and reduced air pollution, we find only a small positively moderating effect of the policy
on what are traditionally economically disadvantaged areas in Poland that used to be depen-
dent on the socialist production model. Hence, despite high levels of FDI, the zones policy has
not managed to overcome the legacy of backwardness or lagging regions.
The main policy implication of the paper is that SEZs may be successful in stimulating activity
in the short run but the policy must be seen as one of necessary temporality and can therefore
not stand alone. Before launching SEZs, policymakers must have plans in place for follow up
measures to ensure the longer term competitiveness and sustainability implications of such
an initiative. There is a need to understand the connection between the specific incentive sche-
mes used (in this particular case tax incentives were used) and the kinds of firms and activities
they attract, including the behavioral models that those incentives promote.
CASE Network Studies & Analyses No. 467 –Special Economic Zones - 20 years later
6
1. Special economic zones (SEZs) as a recurring topic
in economics and regional development studies
Special economic zones (SEZs) is an old topic in economics and regional science dating back
at least to Grubel’s �982 paper published in Weltwirtschaftliches Archiv. In that paper, Grubel
offered a general theory on the welfare effects of free economic zones or what the literature
over time has come to label SEZs. Grubel concluded that there is no general theoretical ans-
wer to the welfare effects as they hinge on the balance of the creation and diversion of econo-
mic activity.
According to Grubel, the existence of SEZs can be explained by a political-economy with diffe-
rential preferences for deregulation that can be geographically sorted. This aspect of Grubel’s
paper may explain why SEZs have been so popular especially in transition countries. In these
countries, the preference for SEZs over deregulation and special incentives to reconstruct
the economy is likely to be highly locational due to the economic geography of socialism
and the high concentration of economic activity in large plants which left some economic areas
highly disadvantaged upon privatization.
The theoretical question pursued by Grubel and other authors has been a recurring question
for policy-makers, most recently in the 20�2 EU debates over the investment crisis in Greece
and whether the country should be allowed to use this type of trade policy-related instrument
to counteract the effects of the debt crisis (The Economist, 20�2). It appears the question
of the creation and diversion of economic activity is what the debate centers on, while a more
longitudinal perspective on these zones and development suggests that we should also care
about what happens when the special rules are dismantled. In fact Greece’s present situation
may be more a result of the recent dismantlement of similar policies (e.g. structural funds
are close neighbors to SEZs as a policy tool) than a reflection of the need to (re)introduce
them.
The SEZ policy as mentioned above has been used amply in recent years by transition co-
untries such as Poland and China that are looking to leave behind the socialist model of in-
dustrialization and transition into a free market economic model, often placing foreign direct
investors at the forefront as the locomotive of this new industrial development policy. Despite
the theoretical contributions, few rigorous econometric studies of this particular type of trade
policy exist. Therefore we seek to fill this gap in the literature with the present paper that offers
a panel data evaluation of the Polish policy spanning the �995-20�� period. In Section 2 we
review some econometric studies of SEZs in China and other papers that focus more broadly
CASE Network Studies & Analyses No. 467 –Special Economic Zones - 20 years later
7
on FDI or EU regional policies.
However, in Section 2 we also observe that most of the available knowledge about SEZs co-
mes from case studies. We can only identify one study of China by Ebenstein (20�2) that is
similar in scope to ours in terms of the different welfare perspectives considered. Often, as for
example in Wang (20�2), the scope is limited to one success factor such the attraction of FDI
which is the most common factor focused upon in the literature on SEZs in developing coun-
tries, or income convergence, which is the most common factor focused on in the literature
on EU regional policy. In isolation, these success factors bring us only limited insight into
the static and dynamic or short and long run welfare effects of SEZ policies.
Our study is therefore the first to bring together an econometric study of a variety of welfare
effects and a broad array of panel data methods. We therefore believe that our study allows us
to make general policy conclusions about SEZs relevant to the European policy context.
In Section 3 we review the particular contents of the Polish policy and how its implementation
has developed over time. Section 4 presents the available data along with descriptive stati-
stics from the Polish Regional Databank published by the Central Statistical Office in Poland
(GUS). In Section 5 the results from applying different types of panel data models to the data
are discussed. First we present some panel data based on descriptive statistics (e.g. differen-
ce-in-difference estimates) and then we proceed to analyze the data using different estimators
such as panel least squares, panel random effects and finally a panel two-stage fixed effect
estimator. Section 6 concludes the paper.
2. Are SEZs effective according to existing literature?
There is a large body of empirical literature on SEZs. Most of it consists of case studies due
to the difficulties of accessing relevant geographical data of the necessary quality to conduct
policy analysis using econometrics (Farole, 20�0, WB, 2009, Gibbon, 2008). Whereas case
studies are informative, they are often inconclusive as to whether or not a certain policy can
be deemed to be welfare-enhancing or not. For example, one of the largest reports published
by the World Bank in 2009, the World Development Report, combined the findings of a wide
range of case studies of spatially related policies and concluded that intervention in econo-
mic geography is often not desirable due to the sheer interests that agglomeration econo-
mies present for the process of development more generally. The report therefore advocated
the adoption of spatially blind policies which other authors observe are in stark contrast with
the European approach of supporting lagging regions (Barca et al, 20�2). Following World
CASE Network Studies & Analyses No. 467 –Special Economic Zones - 20 years later
8
Bank advocacy, the question then becomes how developing countries, through better urban
design and smart city structures, can deal with mega-cities and their inherent problems in more
humane and sustainable ways. A more recent follow up study concluded by the World Bank
in 20�3 (Farole, 20�3) on the same question took a more in-depth focus on the country cases
of India and Indonesia (two countries that have both targeted lagging regions with their spa-
tial policies). The study concludes that in both cases, the policies have been largely unsuc-
cessful in meeting their objectives. The report also suggests that policies should focus more
on the long-term competitiveness of the lagging regions and the firms that inhabit them,
e.g. through institution-building that targets the particular objectives of achieving this and ensu-
ring market access through facilitating connectivity between lagging regions and existing cen-
ters with high growth rates.
Meanwhile, this report also placed at the forefront the question of what will be the longer term
consequences of failed policies in this particular area. Due to the enormous differences in re-
gional development in developing countries, it seems this is an area where policy analysis has
a large stake and role to play. More informed policy-making will be desirable as the demand
for more democratic governance also at the regional level goes up in the developing parts
of the world. Hence the search for solutions to the problem of uneven regional development
continues.
A number of econometric studies have been conducted on SEZ policies in particular. FDI po-
licies with a spatial element could also be deemed relevant to the present paper since such
a policy was used purposefully in Poland as leverage in negotiations with foreign investors
in particular. EU structural fund policies can also be considered similar to the SEZ policy
and we will briefly review some of the more recent panel data studies in this area.
The study that comes closest to ours was conducted by Ebenstein (20�2). The study eva-
luated the SEZ policy adopted by the Chinese government since the opening of the reform
window by Deng in �978. However, the unit of analysis is different as the dataset focuses
on the development, wages, policies, and profits of individual firms and is drawn from a dataset
of all major firms operating out of China and household surveys that follow the welfare of indi-
vidual workers depending on their sector of employment.
Ebenstein (20�2) uses a random effect approach to account for the panel nature structure
of the data. Besides this structure, the analysis is conducted using single univarate re-
gressions with the policy response variables on the left hand side and the policy variable
on the right hand side (SEZ and closely related zone policies such as free trade zones, export
processing zones and coastal open cities are also subject to analysis).
CASE Network Studies & Analyses No. 467 –Special Economic Zones - 20 years later
9
Although not necessarily the chosen variables by Chinese policy-makers, the policy variab-
les evaluated include: ownership or FDI, labour productivity, profits and wages. The results
of the study show that FDI, labour productivity, and profits responded very positively to the
SEZ policy in China. On the other hand, the author found that there was little effect on the wa-
ges earned by workers participating in the zones. For example, the wages were not affected
positively by FDI or higher productivity levels in the firms operating out of the zones. This may
be because labour markets, as opposed to markets, for firm-specific capital are much more
competitive, less based on human capital-specific skills and/or centrally regulated in China.
The author concludes that since the cost of living is often much higher in coastal and SEZ
areas that the policy has been quite detrimental to Chinese worker welfare and therefore not
a policy example from which development in Asia could benefit more broadly.
While Wang’s (20�2) study is methodologically more comprehensive than the one conducted
by Ebenstein (20�2) and the dataset used is much more similar to ours (the unit of analysis
is the location), its results are quite limited because it narrowly focuses on FDI and total fac-
tor productivity as the central policy objective variables (whereas Ebenstein also investigated
worker welfare). Furthermore, Wang’s findings do not substantially deviate from Ebenstein’s
with additional statistical remedies for the omitted variables bias and various types of sample
biases such as selection effects.
Aggarwal (�996) conducted a number of econometric and case studies on India for the World
Bank and UNIDO. Summarizing his study of India (page 4536), he concludes:
‘..the creation of zones which offer the easy option of competing on the basis of cost
minimization should only be treated as a transitory policy arrangement…..(and)….not be
regarded as a substitute for pursuing institutional and infrastructural improvements.’
Lessons from the literature focusing narrowly on SEZs thus suggest that the policy has been
successful only for some objectives and in particular affecting the location choice of foreign in-
vestors. This is supported by related studies that report a positive impact of locational policies
or institutions on the location choice of foreign investors (Cheng and Kwan, 2000, Basile et al,
2003, Crozet et al, 2004, Ledyaeva, 2009). Despite the success of attracting foreign investors
to SEZs, some authors report findings that policy-created clusters do not render the same be-
nefits for economic development as pre-existing clusters (De Propris and Driffield, 2006).
In other areas such as employment and income effects, there is still a lack of substantial evi-
dence. Chinese experiences are in direct contrast to the general goal of income convergence
since the policy is not designed for that purpose in the Chinese context. As Chinese policies
in some sense are designed to exploit a spatial element of temporary differences in wages,
CASE Network Studies & Analyses No. 467 –Special Economic Zones - 20 years later
�0
product and land prices it is perhaps not surprising that it affects worker welfare negatively whi-
le at the same time achieving the return of the labor force from rural to urban China. In India,
on the contrary, is it clear that the regional policy targeting lagging regions has bitterly failed
on the objective of income convergence (Farole, 20�3).
Some studies of the EU structural funds that also aim to support lagging regions via inco-
me transfers report a positive effect on income convergence (Becker et al, 20�0, Mohl and
Hagen, 20�0). Others report the opposite in their results (Dall’Erba and Le Gallo, 2008)
or argue that the EU consists of different convergence clubs (Ramajo et al, 2008). No one
has found in isolation a positive impact of the transfers for variables other than GDP per capita
such as employment. Experiences with EU structural funds are therefore mixed at best where
the overarching research question pursued has been that of income convergence and it
seems the research has often been conducted at quite aggregate levels. This renders policy
analysis in this context less meaningful as we need to address the policies at least starting
from the level from which they are applied (Bradley, 2006). Only then can we start to tackle
more difficult questions such as whether there are spillovers, other spatial effects or fiscal cro-
wding out (Ederveen et al, 2006).
We found no econometric studies that report the impact of regional policies for other important
aspects of economic development such as innovation, firm entry rates and the environment.
Overall the literature review shows that we may expect SEZ-type policies to be successful
on some objectives such as meeting short term objectives of attracting foreign investors.
Meanwhile evidence on longer term development goals, such as securing higher income le-
vels for lagging regions and thereby income convergence, is at best mixed. A lot of important
side objectives of the policies such as generation of exports, innovation, technology transfer
and upgrading, and environmental sustainability aspects have not been covered in the exist-
ing literature at all. A general observation from the literature is that the success of the regional
policy may depend quite a lot on the overall national institutional context and its specific deve-
lopmental antecedents (Aggarwal, �996, Rodriguez-Pose, 20�2, Farole, 20�3). Hence a wider
comparison of country cases will be extremely useful for drawing policy implications.
3. Background and policy context of the Polish SEZs
The SEZs were introduced in Poland in �994. The initiative was launched by the returning
left-wing government in the early �990s to combat rising income disparities across Poland
and especially those that contained a regional element. The SEZ policy typically targeted high

CASE Network Studies & Analyses No. 467 –Special Economic Zones - 20 years later
��
unemployment regions at the outset of transition. During the �950s to -80s, the East Euro-
pean socialist countries followed a tradition of heavy interference in the location of economic
activity. At the beginning of the transition, the old production patterns were subject to sud-
den disruptions due to the liberalization of international trade and the introduction of harde-
ning budget constraints in the public sector combined with privatization. This hit many regions
in Poland and other transition countries hard and intervention at the state level was often
necessary. However, regional authorities were not in a financial position to be able to deal
with these challenges.
Hence the ad hoc construction of SEZs came into place to help alleviate the situation and at-
tract new employment opportunities, new technologies and investment, with the aim of building
a new export base. In Poland, this was combined with a slower approach to the privatization
of large and medium scaled firms in the most severely affected regions. The Special Econo-
mic Zones Act of �994 sets out the following policy objectives: �) to develop the designated
areas of economic activity, 2) to facilitate technology transfer to the zones, 3) to boost exports
from the designated areas, 4) to increase the competitiveness of the goods and services pro-
duced, 5) to develop the existing industrial make-up and upgrade the economic infrastructure,
6) to create new places of employment and 7) to facilitate the adoption of sustainable techno-
logies and energy sources.
Over time the policy has been subject to many revisions including a constant enlargement in
terms of villages that have been allowed to adopt the policy, changes in specific rules concer-
ning tax incentives and changes in the transitory regime of when the policy is expected to be
faced out. Just recently the policy has been prolonged to 2026 up from 20�7 as the original
deadline for when the incentives had to be phased out upon Poland’s EU membership. The
history of the policy is described in detail by KPMG (2009) and a critical analysis is given
by Gwosdz et al (2008). They describe how the policy developed from a theoretical concep-
tion of public support to backward regions into one of practice. For example, the initial idea of
keeping the zones strictly concentrated to the very localized and originally designated areas
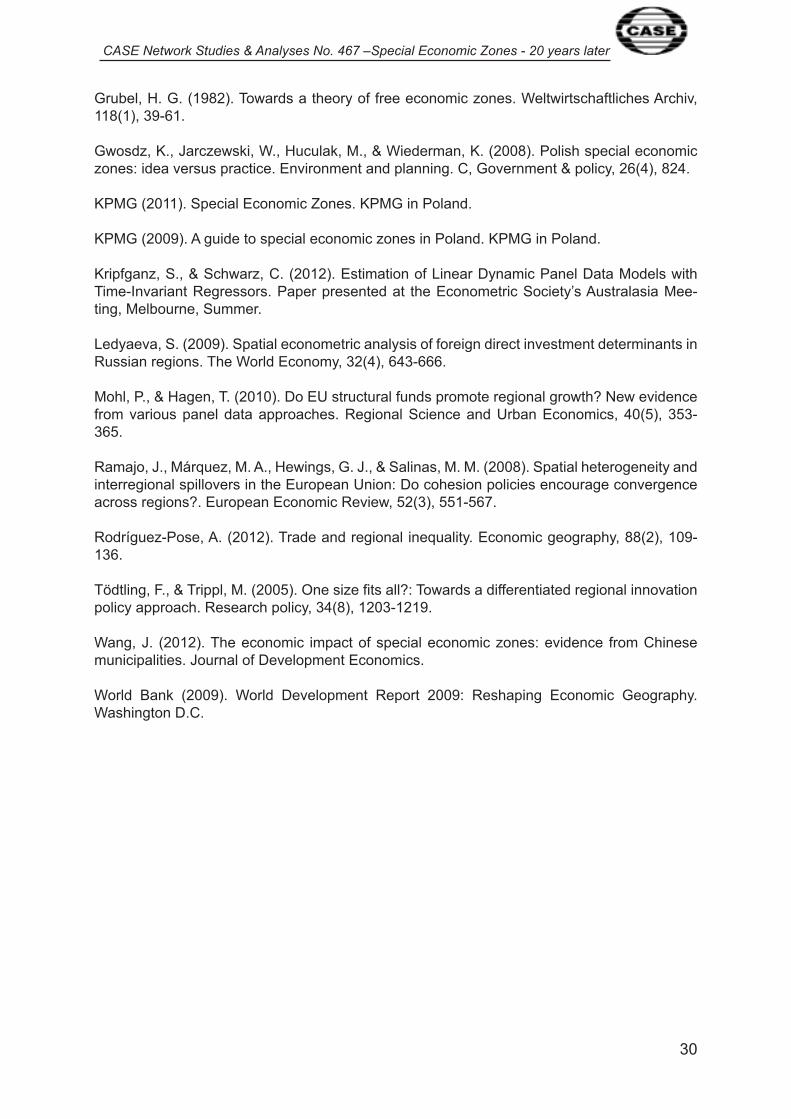
broke down as early as �997, mainly for political reasons (Gwosdz et al, 2008) (see also Figu-
res A� and A2 in the Appendix). Subsequently, local governors, including zone administrators
and also in some cases indirectly the foreign investors themselves, have been able to bargain
to make the policy applicable in areas adjacent areas to the original zones, whereby the zones
over time have become ‘wandering’. In other words, a supply-side policy in terms of localities
offered to potential investors with special incentives turned into a policy dominated by a set
of demand-side processes whereby the de facto geographical delineation of the SEZs became
fuzzy.
Gwosdz et al (2008) speculate whether this was unfortunate for the development objectives.
CASE Network Studies & Analyses No. 467 –Special Economic Zones - 20 years later
�2
We argue that the flexibility and bargaining space that was allowed under the Polish SEZ act
in the end saved the policy. What was originally seen as a redundant supply of industrial land
for development changed into a de facto demand for incentives to develop land AND existing
state owned enterprises that were otherwise under threat of redundancy.
Finally, an important aspect of the Polish SEZs that is not dealt with separately in the present
paper is that with Poland’s accession to the EU in 2004, many of the same regions became
eligible to participate in the EU structural funds. Whether the SEZs have served as a platform
for putting structural funds at work in Poland would be a topic for a separate paper. In this
paper we just control for any possible by-influence that general subsidies, including EU sub-
sidies, may have on the regional development objectives under evaluation. Another important
research question that arises out of this paper is whether SEZ policies and structural fund-type
of policies in general will lead to stand-alone development once the policy and public support
scheme is phased out.
4. Data and methodology used to evaluate the SEZ policy
In this section the data from the Polish regional databank published by GUS is introduced.
The data quality and availability is briefly discussed. The descriptive statistics for the pooled
dataset are reported as well. More detailed descriptive statistics are given in Section 5 while
the methods used for their calculation are mentioned in this section. Finally, the panel data esti-
mators are introduced and explained at the end of this section before moving to the reporting
of econometric results in Section 5.
4.1 Data variables
The study variables are listed in alphabetical order in Table �. Different equations in the study
will have a different number of observations due to the availability of the particular variables
included in each equation. Some of the variables that are adopted as dependent variables
in the study are only available at the less detailed (nuts4) level. This is true for investments
and the index of wages. The dependent variables used in the study are marked in bold
in the table: emissions, employment, firms, foreign, greeninvest, invest and wages.
There is a relative large number of observations with values of zeros in the regional data-
bank. We believe the zeros occur for two reasons. Sometimes zeros exist because of changes
in the definition of territorial units. Typically this will affect the population variables. Therefore
we remove all observations that have zeros for population-related variables. However, there

CASE Network Studies & Analyses No. 467 –Special Economic Zones - 20 years later
�3
are also real zeros present in the data and removing these could result in data censoring.
Therefore we do allow for zeros for other variables where it may be reasonable to expect that
Table 1 – Study variables
VARIABLE DESCRIPTION AVAILABILITY
Code Number that identifies the territorial unit j. The code also
has an alphabetic descriptor. The code is the cross sec-
tion unit of analysis.
-
Dependants Calculated as the difference between the total population
and the working population. Observations of zeros are
removed from the data.
�995-20��
Education Expenditure on education, in PLN. Observations of zeros
are allowed.
�995-20��
Emissions Emission of air pollutants from manufacturing plants
considered especially noxious to air purity, quoted in tons
of particulates emitted from known pollutants in each
geographical area. Observations of zeros are allowed.
�996-20�� (nuts4)
�996-2005 (nuts5)
Employment Employed persons. Observations of zeros are removed
from the data.
�995-20��
EUsubsidies Revenue to finance EU-sponsored programs and proje-
cts, in PLN. Observations of zeros are allowed.
2006-20��
Firms All firms listed in REGON (Polish company register).
Observations of zeros are removed from the data
�995-20��
Foreign Private sector firms with foreign capital participation in
REGON. Observations of zeros are allowed.
�995-20��
Greeninvest Outlays on fixed assets serving environmental protection,
in ths PLN. Observations of zeros are allowed.
�999-2008
Invest Investment outlays in enterprises, in mln PLN. Observa-
tions of zeros are allowed.
2002-2008 (nuts4)
Nuts4� A dummy for cities with powiat status -
Nuts5� A dummy for urban gminas. -
Population Total population. Observations of zeros are removed from
the data.
�995-20�0(nuts4)
�995-20��(nuts5)
Local Locally owned, privately held firms listed in REGON.
Observations of zeros are allowed
�995-20��
SEZ A dummy for territorial units with a special economic zone
using the alpha betical listing published in KMPG, 2004
and the alphabetic descriptors in the regional database
published by GUS
-
State State owned firms in REGON. Observations of zeros are
allowed.
�995-20��
Subsidies Grand total of general subsidies in public sector revenue.
Observations of zeros are allowed.
�995-20��
Wages Average wage index with Poland=�00. 2002-20��(nuts4)
Working Population at working age, women �5-59, men �5-64.
Observations of zeros are removed from the data.
�995-20�0(nuts4)
�995-20��(nuts5)
Year The year of the observation time t is the time series unit
of analysis
-
Source: own estimations
CASE Network Studies & Analyses No. 467 –Special Economic Zones - 20 years later
�4
the variable takes a value of 0 for some years and/or regions. Table � also mentions how we
dealt with the problem of zeros for each of the relevant variables. Since population related
variables occur in all the estimated equations, we argue that this approach appropriately deals
with the impact that changing territorial units over time may have on the dataset.
The aim is to evaluate the SEZ policy on as many of its specific objectives (as explained
in Section 2) as possible. However, lacking data availability in particular for exports and tech-
nology only renders it possible to achieve the research objective on some of the potential
dimensions of the policy.
The empirical strategy is to adopt the dependent variables in their direct form (log transformed)
while controlling for the population of firms and people within which they occur on the right
hand side of the equation.
4.2 Pooled descriptive statistics
Appendix Tables A�a and A�b show the general descriptive statistics of the pooled data
at the nuts4 and nuts5 levels, respectively. These descriptive statistics give access to some
general observations about the relative heterogeneity of economic development at powiat
and gmina levels in Poland. One interesting variable to compare in particular is the occurrence
of SEZs at the two levels. For the nuts4 level, SEZs occur in 47% of all locations, whereas
at the nuts5 level they only occur in 8% of all locations. This suggests as the map in Figure A2
also shows that the SEZs are quite geographically dispersed across Poland.
The most straightforward way to compare the statistics across the two geographical units
is to calculate the coefficient of variation by dividing the standard deviation with the mean.
The results are shown in Table 2.
Here we see that the coefficient of variation is typically three times higher for the nuts5 com-
pared with the nuts4 level. This suggests that heterogeneity increases as the areas or loca-
tions compared decrease in size as nuts5 represents the more detailed village level whereas
nuts4 represents the less detailed commune level. Hence villages are generally more different
than communes in Poland. This also suggests that there is an averaging out effect moving
from the specific to more general level which is common in regional datasets. Had for example
all the rich villages been located in one commune and all the poor villages in another commu-
ne, the opposite result should have come about.
The above observations also suggest that the evaluation of the policy is best conducted
at the level at which it is applied, at least in any initial analysis and that spillover effects can
CASE Network Studies & Analyses No. 467 –Special Economic Zones - 20 years later
�5
then be dealt with in addition to but not in substitution of the analysis at the most detailed level
of data availability.
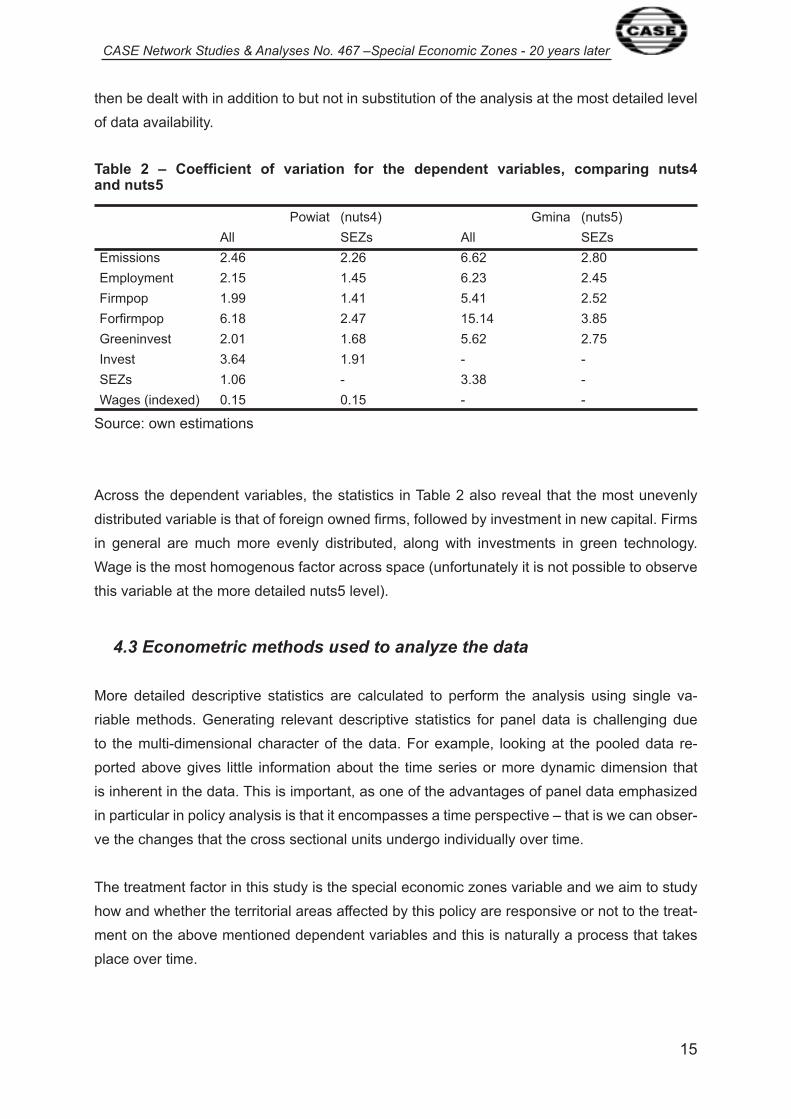
Table 2 – Coefficient of variation for the dependent variables, comparing nuts4 and nuts5
Powiat (nuts4) Gmina (nuts5)
All SEZs All SEZs
Emissions 2.46 2.26 6.62 2.80
Employment 2.�5 �.45 6.23 2.45
Firmpop �.99 �.4� 5.4� 2.52
Forfirmpop 6.�8 2.47 �5.�4 3.85
Greeninvest 2.0� �.68 5.62 2.75
Invest 3.64 �.9� - -
SEZs �.06 - 3.38 -
Wages (indexed) 0.�5 0.�5 - -
Source: own estimations
Across the dependent variables, the statistics in Table 2 also reveal that the most unevenly
distributed variable is that of foreign owned firms, followed by investment in new capital. Firms
in general are much more evenly distributed, along with investments in green technology.
Wage is the most homogenous factor across space (unfortunately it is not possible to observe
this variable at the more detailed nuts5 level).
4.3 Econometric methods used to analyze the data
More detailed descriptive statistics are calculated to perform the analysis using single va-
riable methods. Generating relevant descriptive statistics for panel data is challenging due
to the multi-dimensional character of the data. For example, looking at the pooled data re-
ported above gives little information about the time series or more dynamic dimension that
is inherent in the data. This is important, as one of the advantages of panel data emphasized
in particular in policy analysis is that it encompasses a time perspective – that is we can obser-
ve the changes that the cross sectional units undergo individually over time.
The treatment factor in this study is the special economic zones variable and we aim to study
how and whether the territorial areas affected by this policy are responsive or not to the treat-
ment on the above mentioned dependent variables and this is naturally a process that takes
place over time.
CASE Network Studies & Analyses No. 467 –Special Economic Zones - 20 years later
�6
4.3.1 Panel descriptive statistics
To compile descriptive statistics for panel data that reveal more about the dynamics of the de-
pendent variables y, first, a simple difference-in-difference statistic is calculated. This is done
by running the regression in Equation � for the first (t=�) and last (t=T) year of observation,
where the difference-in-difference statistic is obtained as βt=T - βt=1. The statistic gives us the average effect over time span T of running the SEZ policy experiment. The reason we
would still maintain it as a descriptive statistic is that it does not account for common statistical
problems inherent in regression analysis.
Eq.� yjt=1=α
0+α
t=1SEZ
j+ϵ
jt=1
To check how much this statistic is affected alone by other available control factors we also cal-
culate the difference-in-difference statistic including all the relevant control factors available:
Eq.2 yjt=1=α
0+α
t=1 SEZ
j+β
i jt=1+ϵ
jt=1
4.3.2 Panel data estimators
After compiling the time-varying descriptive statistics, we jump to panel data analysis
as the best strategy to analyze the data given the available information. The simplest type
of panel data analysis is performed on the data as if it were cross-sectional data. This is called
a pooled panel data regression (where y is the dependent variable and x is an explanatory
variable) and is also commonly referred to as panel least squares:
Eq.3.a yjt=α
0+βx
jt+ϵ
jt
In this equation we can then adopt the policy as a simple dummy variable to investigate whether
the level in the dependent variable is affected by the policy while controlling for other factors
that in competition with our main variable could explain the difference in the observed levels.
In this analysis it is implicitly assumed that the policy works independent of any of the other
explanatory variables, e.g. it is not conditional on other factors such as education level in order
to have any impact:
Eq.3.b yjt=α
0+α
1SEZ
j+βx
jt+ϵ
jt
An alternative approach to reducing heterogeneity in panels is to estimate a random or fixed
effect model. The random effect model has advantages when we want to study fixed effects
that are collinear with the cross sectional fixed effects as the correlation within the cross sec-
CASE Network Studies & Analyses No. 467 –Special Economic Zones - 20 years later
�7
tion is only accounted for with an additional error term (or here two errors as we also take
into account correlation in the time series to reduce problems of serial correlation):
Eq. 4.a yjt=α
0+βx
jt+
j+
t+ϵ
jt
Eq. 4b yjt=α
0+α
1SEZ
j+βx
jt+
j+
t+ϵ
jt
The fixed effect model must be considered superior in cases where we suspect that there are
underlying structural factors that have a strong determining impact on our economic variables.
This is often the case in regional datasets such as ours.
We therefore use the two-stage fixed effect model as proposed by Kripfganz and Schwarz
(20�2) to solve the problem of collinearity between the fixed effects and the SEZ dummy.
In the first stage we estimate the ordinary two-way fixed effect model without the SEZ dummies
which takes the following form:
Eq.5.a yjt=α
j+
t+βx
jt+ϵ
jt
Using this equation we obtain an estimate of each territorial unit’s fixed effect for the response
variable y. In the second stage we investigate if this fixed effect differs across economic areas
with and without the SEZ policy:
Eq.5.b αj=α
0+α
1SEZ
j+ϵ
j
5. Statistical results
This section presents the main statistical results of the study. First the panel descriptive stati-
stics are presented. After that we show the comparative results of applying the different panel
data estimators to the dataset.
5.1 Difference-in-difference estimates
Table 3 presents the difference-in-difference statistics for the dependent variables: employ-
ment effects, business creation effects (general firm population, foreign firm population and
investment), income effect and environmental (emissions and green investment) impact.
These first results are only indicative and descriptive and even though we go beyond descrip-
tive statistics in Equation 2 by controlling for other relevant variables using multivariate regres-
sion analysis, these results are purely repeated cross sectional statistics and do not exploit
nor account for the efficiency properties of panel data.

CASE Network Studies & Analyses No. 467 –Special Economic Zones - 20 years later
�8
Table 3 – Difference-in-difference estimates for the SEZ policy
Equation � 2
Difference at time: D(t=�) D(t=T) DiD D(t=�) D(t=T) DiD
Dependent vars:
Log Employment
(nuts5)
�.70*** �.76*** 0.06*** 0.08*** 0.07*** -0.0�***
Log Firmpop (nuts5) �.48*** �.40*** -0.08*** -0.0� -0.07***- -0.06***
Log Forfirmpop (nuts5) �.22*** �.57*** 0.35*** 0.�6*** 0.�2** -0.04***
Log Investment (nuts4) 0.53*** 0.48*** -0.05*** 0.09 0.�2** 0.03***
Wages (nuts4) �.�7 �.00 -0.�7 -2.00* -�.30 0.70*
Log Emissions (nuts5) 2.55*** �.98*** -0.57*** 0.38*** 0.28*** -0.�0***
Log Greeninvest (nuts5) 2.47*** 2.8�*** 0.34*** -0.06 0.�8 0.24
Source: own estimations
For the employment effect the descriptive statistics suggest without additional controls that
SEZs have a much higher level of employment compared to other villages at the nuts5 level.
Quantitatively the effect of an SEZ on employment is estimated to be in the order of �70%
higher employment and increasing over time. However, once we control for other relevant
factors such as population structure and number of firms, most of the difference disappears.
A small positive effect of SEZs on employment at around 8% remains when adopting additional
controls. An obvious reason for this result is that SEZs may provide for a sorting that attenu-
ates employment differences at this level of geographical detail. For example, many people
that work in SEZs will typically live with their dependants in adjacent villages that offer little
employment. Hence once we take into account such structural differences between economic
areas we still register a small positive effect of the policy on employment. However, this effect
is slightly declining rather than increasing over time according to the equation with controls.
Moving to the 2nd to 4th rows in Table 3, the focus is on business creation effects by using
firm populations, foreign firm populations and investments as dependent variables. Before ad-
opting additional controls, SEZs are positive outliers in terms of business creation. For overall
firm population and investments, the effects are declining over time, e.g. net entry rates are
smaller than for other economic areas at the village level over time. It may be because the zo-
nes typically favor larger investors that we observe a tendency for new firm creation to go down
over time. There is a very strong effect in particular for attracting foreign investors as business
creators or entrepreneurs to the zones. Similarly, we observe at the level of investment (which
is only available at the Nuts4 level and which may explain why the effect is less strong) that
areas with SEZs have more business creation when measured on the level of investment.
Introducing additional controls moderate the results somewhat. Again, we see that the effects
of the SEZ policy on the dependent variables are smaller and sometimes somewhat less signi-

CASE Network Studies & Analyses No. 467 –Special Economic Zones - 20 years later
�9
ficant when we include controls for other relevant variables. In particular, the foreign firm factor
may be dominant so that it in itself absorbs the explanatory power when used as a control
in equations that have other dependent variables such as e.g. investment. This suggests that
the observed effect may run through other factors rather than the policy itself and we must
therefore also be concerned about other omitted variables biases.
The results for investigating the effect of the SEZ policy on income by using the wage index
at the nuts4 level as a dependent variable is rather inconclusive. We detect a weak systematic
relationship between the special zones and the level and development in wages over time.
The equation with controls (equation 2) suggests that SEZs exist significantly below the ave-
rage income level in Poland and that the policy has a slightly moderating effect in a positive
direction over time, e.g. the policy has helped to somewhat reduce the income gap that exists
between SEZs and other economic areas in Poland.
The last two rows show the descriptive results for the dependent variables related to the im-
pact of the policy on the environment. SEZs typically exist at a much higher level of emissions,
e.g. emissions are estimated to be more than 200% above other economic areas. Even though
the difference is much smaller for Equation 2, we see the same result with and without controls
- that emissions are quite significantly reduced in areas affected by the SEZ policy. This could
be due in part to a higher level of green investment as registered in the last row. However,
this effect disappears when controlling for other factors. Again, we think this result is because
of the control for foreign ownership in particular with Equation 2. It is possible that general sub-
sidies, including EU structural funds that often target the environment, could also explain why
the effect of the policy disappears once we introduce such additional control factors.
To further investigate the effect of the policy we move to different panel data estimators that
can address both common issues in econometric analysis including in particular investigating
for omitted variables biases that relate to the structural characteristics of the SEZs. We expect
the result of this analysis will be to substantiate and add statistical robustness to the results
obtained with the descriptive statistics.
5.2 Employment effect in panel regressions
Table 4 compares the panel regressions for the employment effect. Notice that all reported
standard errors are robust to heteroscedasticity in the cross section. Generally serial corre-
lation is high as is to be expected given the longitudinal nature of the study. Once including a
random (2nd column) or fixed (3rd column) effect, the serial correlation coefficient is typically
reduced to around 0.5. Serial correlation is therefore not further addressed in this study.
CASE Network Studies & Analyses No. 467 –Special Economic Zones - 20 years later
20
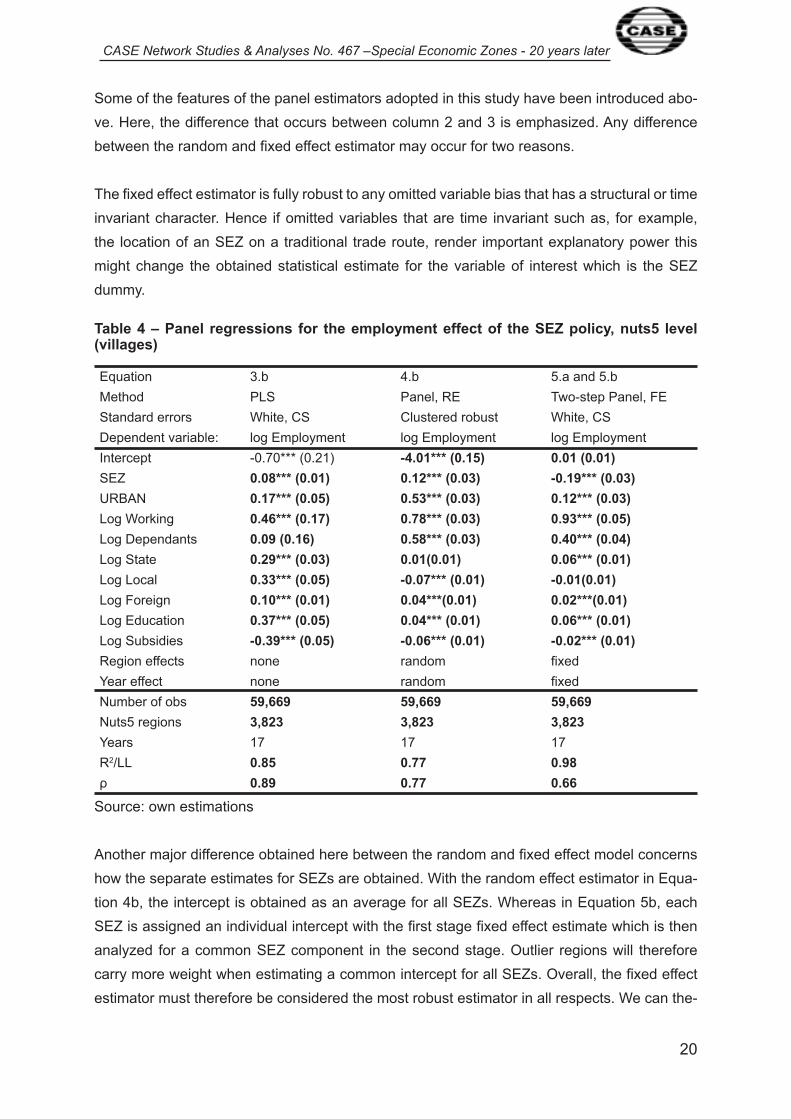
Some of the features of the panel estimators adopted in this study have been introduced abo-
ve. Here, the difference that occurs between column 2 and 3 is emphasized. Any difference
between the random and fixed effect estimator may occur for two reasons.
The fixed effect estimator is fully robust to any omitted variable bias that has a structural or time
invariant character. Hence if omitted variables that are time invariant such as, for example,
the location of an SEZ on a traditional trade route, render important explanatory power this
might change the obtained statistical estimate for the variable of interest which is the SEZ
dummy.
Table 4 – Panel regressions for the employment effect of the SEZ policy, nuts5 level (villages)
Equation 3.b 4.b 5.a and 5.b
Method PLS Panel, RE Two-step Panel, FE
Standard errors White, CS Clustered robust White, CS
Dependent variable: log Employment log Employment log Employment
Intercept -0.70*** (0.2�) -4.01*** (0.15) 0.01 (0.01)
SEZ 0.08*** (0.01) 0.12*** (0.03) -0.19*** (0.03)
URBAN 0.17*** (0.05) 0.53*** (0.03) 0.12*** (0.03)
Log Working 0.46*** (0.17) 0.78*** (0.03) 0.93*** (0.05)
Log Dependants 0.09 (0.16) 0.58*** (0.03) 0.40*** (0.04)
Log State 0.29*** (0.03) 0.01(0.01) 0.06*** (0.01)
Log Local 0.33*** (0.05) -0.07*** (0.01) -0.01(0.01)
Log Foreign 0.10*** (0.01) 0.04***(0.01) 0.02***(0.01)
Log Education 0.37*** (0.05) 0.04*** (0.01) 0.06*** (0.01)
Log Subsidies -0.39*** (0.05) -0.06*** (0.01) -0.02*** (0.01)
Region effects none random fixed
Year effect none random fixed
Number of obs 59,669 59,669 59,669
Nuts5 regions 3,823 3,823 3,823
Years �7 �7 �7
R2/LL 0.85 0.77 0.98
ρ 0.89 0.77 0.66
Source: own estimations
Another major difference obtained here between the random and fixed effect model concerns
how the separate estimates for SEZs are obtained. With the random effect estimator in Equa-
tion 4b, the intercept is obtained as an average for all SEZs. Whereas in Equation 5b, each
SEZ is assigned an individual intercept with the first stage fixed effect estimate which is then
analyzed for a common SEZ component in the second stage. Outlier regions will therefore
carry more weight when estimating a common intercept for all SEZs. Overall, the fixed effect
estimator must therefore be considered the most robust estimator in all respects. We can the-
CASE Network Studies & Analyses No. 467 –Special Economic Zones - 20 years later
2�
refore also conclude that SEZs do not have a general positive effect on employment during
the period of study. Rather, traditional factors including the general presence of foreign inve-
stors irrespective of their participation in SEZs have a positive impact on employment. This is
a quite surprising result given the objectives of the SEZ policy, but perhaps not from the per-
spective that the villages receiving support are the structurally lagging regions and especially
with respect to unemployment. The policy has not been able to overcome that legacy during
the current horizon of the policy.
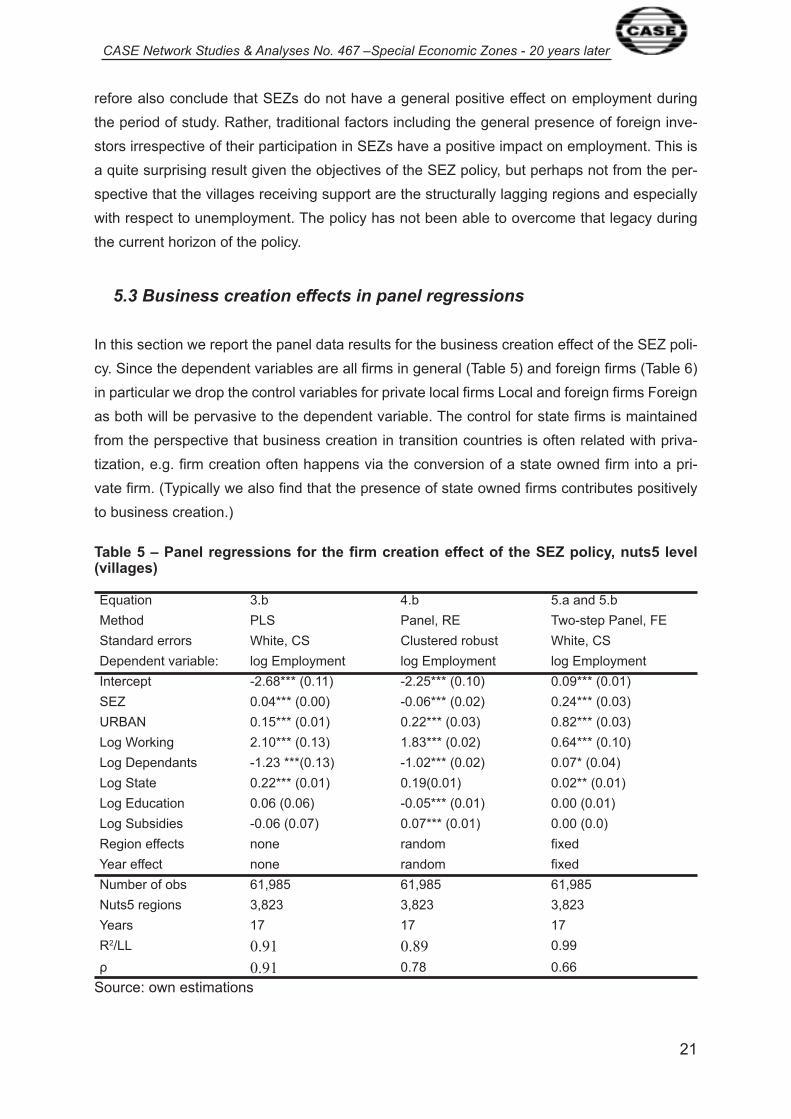
5.3 Business creation effects in panel regressions
In this section we report the panel data results for the business creation effect of the SEZ poli-
cy. Since the dependent variables are all firms in general (Table 5) and foreign firms (Table 6)
in particular we drop the control variables for private local firms Local and foreign firms Foreign
as both will be pervasive to the dependent variable. The control for state firms is maintained
from the perspective that business creation in transition countries is often related with priva-
tization, e.g. firm creation often happens via the conversion of a state owned firm into a pri-
vate firm. (Typically we also find that the presence of state owned firms contributes positively
to business creation.)
Table 5 – Panel regressions for the firm creation effect of the SEZ policy, nuts5 level (villages)
Equation 3.b 4.b 5.a and 5.b
Method PLS Panel, RE Two-step Panel, FE
Standard errors White, CS Clustered robust White, CS
Dependent variable: log Employment log Employment log Employment
Intercept -2.68*** (0.��) -2.25*** (0.�0) 0.09*** (0.0�)
SEZ 0.04*** (0.00) -0.06*** (0.02) 0.24*** (0.03)
URBAN 0.�5*** (0.0�) 0.22*** (0.03) 0.82*** (0.03)
Log Working 2.�0*** (0.�3) �.83*** (0.02) 0.64*** (0.�0)
Log Dependants -�.23 ***(0.�3) -�.02*** (0.02) 0.07* (0.04)
Log State 0.22*** (0.0�) 0.�9(0.0�) 0.02** (0.0�)
Log Education 0.06 (0.06) -0.05*** (0.0�) 0.00 (0.0�)
Log Subsidies -0.06 (0.07) 0.07*** (0.0�) 0.00 (0.0)
Region effects none random fixed
Year effect none random fixed
Number of obs 6�,985 6�,985 6�,985
Nuts5 regions 3,823 3,823 3,823
Years �7 �7 �7
R2/LL 0.91 0.89 0.99
ρ 0.91 0.78 0.66
Source: own estimations
CASE Network Studies & Analyses No. 467 –Special Economic Zones - 20 years later
22
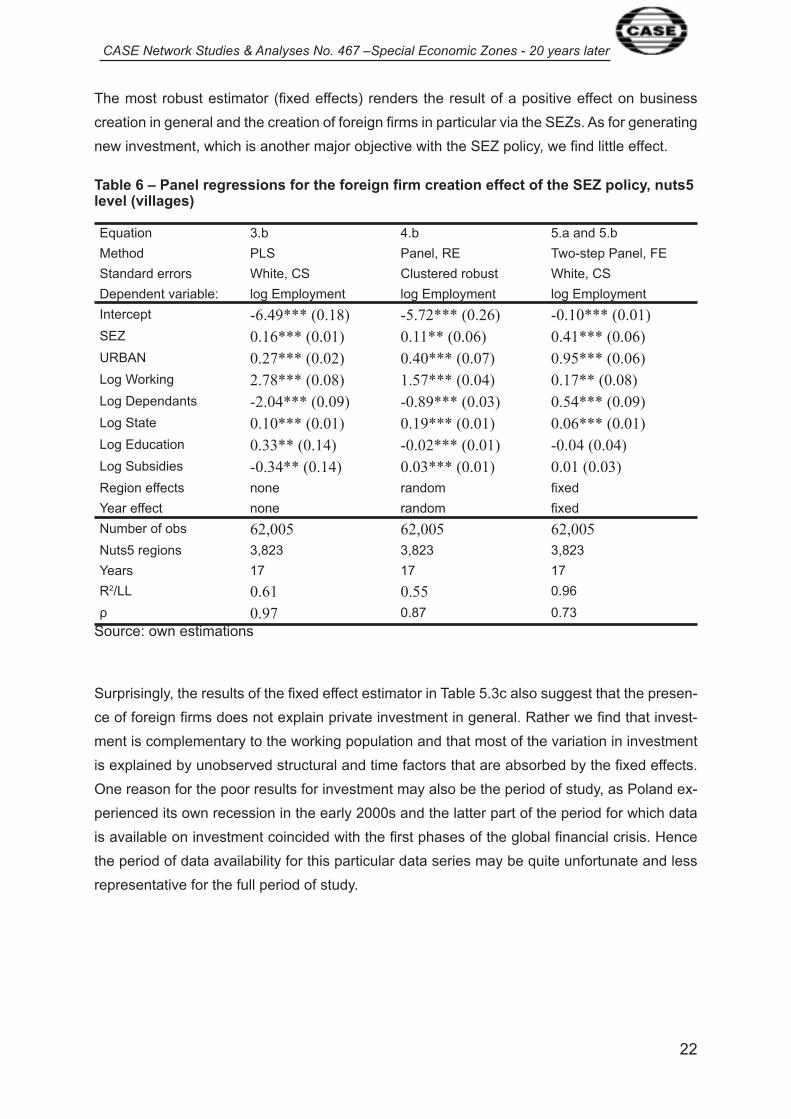
The most robust estimator (fixed effects) renders the result of a positive effect on business
creation in general and the creation of foreign firms in particular via the SEZs. As for generating
new investment, which is another major objective with the SEZ policy, we find little effect.
Table 6 – Panel regressions for the foreign firm creation effect of the SEZ policy, nuts5 level (villages)
Equation 3.b 4.b 5.a and 5.b
Method PLS Panel, RE Two-step Panel, FE
Standard errors White, CS Clustered robust White, CS
Dependent variable: log Employment log Employment log Employment
Intercept -6.49*** (0.18) -5.72*** (0.26) -0.10*** (0.01)
SEZ 0.16*** (0.01) 0.11** (0.06) 0.41*** (0.06)
URBAN 0.27*** (0.02) 0.40*** (0.07) 0.95*** (0.06)
Log Working 2.78*** (0.08) 1.57*** (0.04) 0.17** (0.08)
Log Dependants -2.04*** (0.09) -0.89*** (0.03) 0.54*** (0.09)
Log State 0.10*** (0.01) 0.19*** (0.01) 0.06*** (0.01)
Log Education 0.33** (0.14) -0.02*** (0.01) -0.04 (0.04)
Log Subsidies -0.34** (0.14) 0.03*** (0.01) 0.01 (0.03)
Region effects none random fixed
Year effect none random fixed
Number of obs 62,005 62,005 62,005
Nuts5 regions 3,823 3,823 3,823
Years �7 �7 �7
R2/LL 0.61 0.55 0.96
ρ 0.97 0.87 0.73
Source: own estimations
Surprisingly, the results of the fixed effect estimator in Table 5.3c also suggest that the presen-
ce of foreign firms does not explain private investment in general. Rather we find that invest-
ment is complementary to the working population and that most of the variation in investment
is explained by unobserved structural and time factors that are absorbed by the fixed effects.
One reason for the poor results for investment may also be the period of study, as Poland ex-
perienced its own recession in the early 2000s and the latter part of the period for which data
is available on investment coincided with the first phases of the global financial crisis. Hence
the period of data availability for this particular data series may be quite unfortunate and less
representative for the full period of study.

CASE Network Studies & Analyses No. 467 –Special Economic Zones - 20 years later
23
Table 7 – Panel regressions for the investment effect of the SEZ policy, nuts4 level (communes)
Equation 3.b 4.b 5.a and 5.b
Method PLS Panel, RE Two-step Panel, FE
Standard errors White, CS Clustered robust White, CS
Dependent variable: log Employment log Employment log Employment
Intercept -�4.9�*** (�.06) -�9.20*** (0.85) -0.00 (0.05)
SEZ 0.�2*** (0.02) 0.07 (0.05) 0.0� (0.07)
URBAN -0.05 (0.05) -0.34*** (0.08) -0.2�** (0.�0)
Log Working �.67*** (0.26) �.66*** (0.34) �.63*** (0.29)
Log Dependants -�.49*** (0.24) -2.�4*** (0.25) 0.43 (0.50)
Log State -0.06*** (0.02) -0.03 (0.06) 0.�� (0.07)
Log Local 0.36*** (0.03) 0.44*** (0.�3) -0.0� (0.20)
Log Foreign 0.04*** (0.0�) 0.�5*** (0.04) 0.�3 (0.��)
Log Education �.70*** (0.�2) �.�2*** (0.08) -0.04 (0.06)
Log Subsidies -0.96*** (0.06) 0.�8* (0.��) 0.�2 (0.��)
Region effects none random fixed
Year effect none random fixed
Number of obs 2,654 2,654 2,654
Nuts5 regions 380 380 380
Years �7 �7 �7
R2/LL 0.77 0.75 0.92
ρ 0.69 0.56 0.�4
Source: own estimations
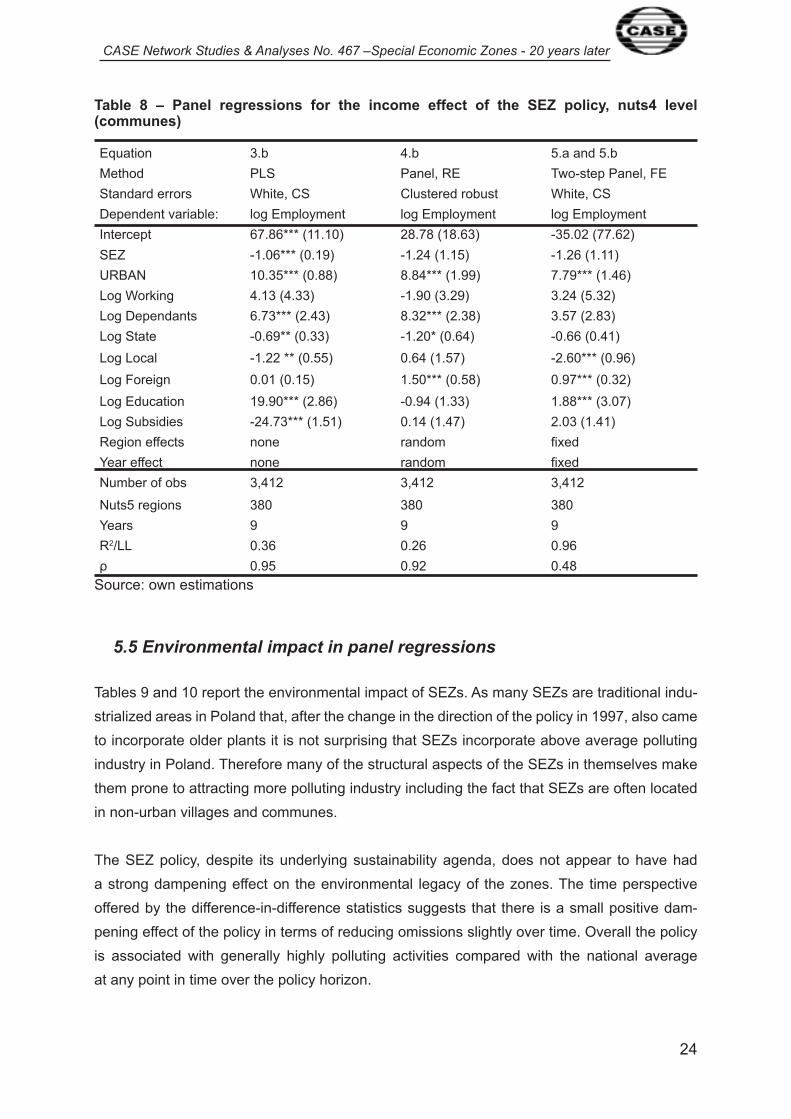
5.4 Income (wage) effect in panel regressions
The wage, or average worker’s income effect of the SEZ policy, is reported in Table 8.
Note that wages in the study are captured with a commune level wage index that deviates
as an index from the national average (Poland=�00). Somewhat in opposition to the diffe-
rence-in-difference estimates, we find no positive or negative effect of SEZs on wages. Note
that this result is obtained while holding other factors such as foreign direct investment con-
stant. Hence we can quite robustly conclude that while foreign investors contribute positively
to the wage development of workers in Poland this behavior is not strongly associated with
the SEZ policy. Furthermore it is the educated, urban workers in Poland that experienced re-
lative wage increases during the period of study. In this respect, SEZ workers do not have ant
advantage over other workers in similar localities as themselves.
CASE Network Studies & Analyses No. 467 –Special Economic Zones - 20 years later
24
Table 8 – Panel regressions for the income effect of the SEZ policy, nuts4 level (communes)
Equation 3.b 4.b 5.a and 5.b
Method PLS Panel, RE Two-step Panel, FE
Standard errors White, CS Clustered robust White, CS
Dependent variable: log Employment log Employment log Employment
Intercept 67.86*** (��.�0) 28.78 (�8.63) -35.02 (77.62)
SEZ -�.06*** (0.�9) -�.24 (�.�5) -�.26 (�.��)
URBAN �0.35*** (0.88) 8.84*** (�.99) 7.79*** (�.46)
Log Working 4.�3 (4.33) -�.90 (3.29) 3.24 (5.32)
Log Dependants 6.73*** (2.43) 8.32*** (2.38) 3.57 (2.83)
Log State -0.69** (0.33) -�.20* (0.64) -0.66 (0.4�)
Log Local -�.22 ** (0.55) 0.64 (�.57) -2.60*** (0.96)
Log Foreign 0.0� (0.�5) �.50*** (0.58) 0.97*** (0.32)
Log Education �9.90*** (2.86) -0.94 (�.33) �.88*** (3.07)
Log Subsidies -24.73*** (�.5�) 0.�4 (�.47) 2.03 (�.4�)
Region effects none random fixed
Year effect none random fixed
Number of obs 3,4�2 3,4�2 3,4�2
Nuts5 regions 380 380 380
Years 9 9 9
R2/LL 0.36 0.26 0.96
ρ 0.95 0.92 0.48
Source: own estimations
5.5 Environmental impact in panel regressions
Tables 9 and �0 report the environmental impact of SEZs. As many SEZs are traditional indu-
strialized areas in Poland that, after the change in the direction of the policy in �997, also came
to incorporate older plants it is not surprising that SEZs incorporate above average polluting
industry in Poland. Therefore many of the structural aspects of the SEZs in themselves make
them prone to attracting more polluting industry including the fact that SEZs are often located
in non-urban villages and communes.
The SEZ policy, despite its underlying sustainability agenda, does not appear to have had
a strong dampening effect on the environmental legacy of the zones. The time perspective
offered by the difference-in-difference statistics suggests that there is a small positive dam-
pening effect of the policy in terms of reducing omissions slightly over time. Overall the policy
is associated with generally highly polluting activities compared with the national average
at any point in time over the policy horizon.

CASE Network Studies & Analyses No. 467 –Special Economic Zones - 20 years later
25
Table 9 – Panel regressions for the emission effect of the SEZ policy, nuts5 level (villages)
Equation 3.b 4.b 5.a and 5.b
Method PLS Panel, RE Two-step Panel, FE
Standard errors White, CS Clustered robust White, CS
Dependent variable: log Employment log Employment log Employment
Intercept -�0.��*** (0.4�) -8.08*** (0.50) -0.�8*** (0.03)
SEZ 0.39*** (0.02) 0.59*** (0.�2) 0.42*** (0.�0)
URBAN �.27*** (0.06) �.79*** (0.�3) �.68*** (0.�0)
Log Working �.93*** (0.27) 0.48*** (0.�0) 0.96*** (0.�4)
Log Dependants -0.84*** (0.24) 0.96*** (0.09) -0.�8*** (0.06)
Log State 0.56*** (0.05) -0.�4*** (0.03) -0.�4*** (0.03)
Log Local -0.32*** (0.03) 0.03 (0.02) 0.�4*** (0.04)
Log Foreign -0.02** (0.0�) -0.��*** (0.02) -0.�2*** (0.02)
Log Education 0.52*** (0.��) 0.02 (0.02) 0.09*** (0.03)
Log Subsidies -0.55*** (0.�0) -0.06*** (0.02) -0.0� (0.02)
Region effects none random fixed
Year effect none random fixed
Number of obs 36,349 36,349 36,349
Nuts5 regions 3,75� 3,75� 3,75�
Years �0 �0 �0
R2/LL 0.47 0.4� 0.963
ρ 0.92 0.84 0.63
Source: own estimations
Whereas foreign investors in general reduce omissions, their attraction to SEZs is not as-
sociated with a general conformity to this behavioral pattern according to the results ob-
tained with the fixed effect panel estimator. These findings for emissions are quite consistent
with the related results for the adoption of green technologies.
Firms that are located in SEZs are not more likely to adopt green technologies; the policy does
not appear to have any impact on adoption rates, especially when we look at the results ob-
tained with the most robust estimator. Again, it does it appear that foreign investors generally
exhibit a positive impact on the environment and in combination, the results suggest especially
for environmental sustainability that there is a tendency with the zones policy to lead to a de-
gradation in the standards normally exhibited and associated with foreign investors. Overall
this suggests that the policy has a number of down side effects because of the type of foreign
investors that it attracts which could relate specifically with a policy instrument that focuses
solely on the cost side of operations.
CASE Network Studies & Analyses No. 467 –Special Economic Zones - 20 years later
26
Table 10 – Panel regressions for the green investment effect of the SEZ policy, nuts5 level (villages)
Equation 3.b 4.b 5.a and 5.b
Method PLS Panel, RE Two-step Panel, FE
Standard errors White, CS Clustered robust White, CS
Dependent variable: log Employment log Employment log Employment
Intercept -7.53*** (0.47) -7.29*** (0.54) -0.02 (0.04)
SEZ 0.17*** (0.04) 0.29*** (0.10) 0.20 (0.13)
URBAN -0.04 (0.05) 0.35*** (0.11) -0.09 (0.13)
Log Working 2.39*** (0.58) 0.77*** (0.27) -0.23 (0.43)
Log Dependants -1.67*** (0.53) 0.24 (0.23) 1.66*** (0.54)
Log State 0.06* (0.03) -0.03 (0.05) -0.20*** (0.05)
Log Local 0.77*** (0.09) 0.55*** (0.09) 0.06 (0.12)
Log Foreign -0.07 (0.04) 0.05 (0.05) 0.13** (0.05)
Log Education 1.14*** (0.18) 0.62*** (0.12) 0.01 (0.09)
Log Subsidies -1.12*** (0.18) -0.61 (0.12) 0.12** (0.05)
Region effects none random fixed
Year effect none random fixed
Number of obs 36,500 36,500 36,500
Nuts5 regions 3,758 3,758 3,758
Years �0 �0 �0
R2/LL 0.28 0.27 0.55
ρ 0.43 0.29 0.�3
Source: own estimations
6. Discussion of the results and conclusion of the study
In this paper we set out to evaluate the relative success of Poland’s SEZs that were introdu-
ced in �994 using a longitudinal perspective. The aim is to evaluate the policy on as many
of its priorities or objectives as possible and given the availability of detailed regional data
at the nuts4 and nuts5 levels in the Polish regional databank. While there may be interregional
spillovers that argue for a broader approach to policy evaluation, any policy evaluation should
initially start at the level at which the policy is applied. That is what we set out to do in this
first econometric study of SEZs in Poland. Combining these objectives we evaluate the policy
on the factors of employment, business creation including private investment, wage or income
effect and environment.
The difference-in-difference statistics suggest along with the pooled panel and random effects
estimates that SEZs are slightly above the national average in terms of employment and that
there has been no dynamic development in this impact factor over the policy horizon. The fixed
CASE Network Studies & Analyses No. 467 –Special Economic Zones - 20 years later
27
effect estimator which is deemed to be robust to any omitted variables bias suggests the oppo-
site - that SEZs, despite the influence of the policy on business creation, have been ineffective
in generating a higher level of employment among the SEZ areas in particular and that these
areas throughout the period continue to perform below the average village in terms of genera-
ting places of employment. However, especially for employment, the comparison across SEZs
and other village sized areas is difficult to make since SEZs do not have many typical village
style features such as offering both a place to live and work.
In terms of business creation, we find this is where the SEZ policy has been mostly success-
ful so far and we estimate that most of the effect comes about through the attraction of FDI
into the special economic zones. Here we also suggest that the policy change that came in
�997 whereby new areas were allowed to use the policy that was designated originally to �7
confined greenfield areas is part of the reason why the SEZ policy has been able over time
to meet its target objectives in this respect. Many large scale foreign investors acquired exist-
ing plants under privatization and it was often in the interest of other follow up investors to be
located adjacent to the pioneer investors. The data on investment does not give the same
positive account of the SEZs. In fact, the fixed effect model means most capital investment
must be explained by structural and time factors in combination with working population as the
only time variant locational element that is positively and strongly associated with investment
levels. Neither the SEZ policy nor FDI is able to significantly explain the geographical distri-
bution of investment. A hindering factor may be that data is only available for quite as short
span and at the nuts4 level. It makes the particular results for the investment aspect relatively
incomparable with the other parts of the econometric analysis.
The wage or income effect of the SEZ policy is absent. Again, we propose that this is related
to the specific structural features of the SEZs and also associated with the below average em-
ployment impact which may tend to create a natural ceiling on wage developments. Groups
that led wage developments in Poland during the period of study were the urban, educa-
ted workers and those employed by foreign firms in general but not in particular attached
to the SEZs.
For environmental sustainability we offer the first result on this aspect of SEZs. Here also the
welfare impact of the policy appears to be negative and appears to have led to more rather
than less negative externalities. We suggest that the policy may involve a certain element
of downgrading standards among foreign investors in general. Whereas foreign investors
on average pollute less, this impact does not come through when looking at SEZs in isolation.
Similarly, whereas foreign investors in Poland on average are more likely to adopt green tech-
nologies we find the opposite is true when focusing specifically on the impact of the SEZ policy
on the environmental objectives.
CASE Network Studies & Analyses No. 467 –Special Economic Zones - 20 years later
28
The study opens up for a wealth of new questions on SEZs and related public policies such
as the EU structural funds and other similar policies targeting FDI or innovation (e.g. cluster
generation) by using place as a means to decide who is to receive special incentives. In view
of the ample usage of such policies, it is worrisome from a policy evaluation perspective that so
little is known about the long run impact of these policies on factors such as business creation
and the longer run competitiveness effect on the firm and the region.
Our study is among the first to take a step in that direction. Our results as discussed above
supported other findings that brought into question the more long run impact of these pla-
ce-based policies. A major worrying factor is whether or not it is a good idea for developing
and transition countries to market their space through cost-based incentives such as tax in-
centives alone. The very nature of the policy may be the seed of the continued legacy of prob-
lems with upgrading and shifting out of an industrialization scenario that is purely cost based
and prone to race-to-the-bottom type of situations. Here it would be relevant to try to compare
the usage of tax based incentives with other types of incentives such as those that target
the innovation activities, quality orientation or seek to set minimum standards among the firms
involved in the special incentives schemes.
Our literature review shows that there are no ex-post studies of what happens after the special
incentives have been dismantled. Poland, with its very solid regional databank, will therefo-
re be an interesting case on which to do follow up studies. Our review of the literature also
suggests that in order to draw solid policy advice across countries, it is necessary to connect
the impact analysis of individual SEZ schemes in a comparative institutional perspective whe-
reby one can also start to understand whether and how the underlying national institutional
framework affects their relative success and failure. Finally we also identified a gap in terms
of studies that focused on other impact factors besides FDI, productivity, and income differen-
ces such as in particular innovation, exports and other aspects of technological, environmental
and quality upgrading.
CASE Network Studies & Analyses No. 467 –Special Economic Zones - 20 years later
29
References
Aggarwal, A. (2006). Special economic zones: revisiting the policy debate. Economic and Po-
litical Weekly, 4533-4536.
Barca, F., McCann, P., & Rodríguez-Pose, A. (20�2). The case for regional development inter-
vention: place-based versus place-neutral approaches*. Journal of Regional Science, 52(�),
�34-�52.
Basile, R., Castellani, D., & Zanfei, A. (2003). Location choices of multinational firms in Euro-
pe: the role of national boundaries and EU policy. Univ. of Urbino, Economics, Mathematics &
Statistics Working Paper, (78).
Becker, S. O., Egger, P. H., & Von Ehrlich, M. (20�0). Going NUTS: The effect of EU Structural
Funds on regional performance. Journal of Public Economics, 94(9), 578-590.
Bradley, J. (2006). Evaluating the impact of European Union cohesion policy in less-developed
countries and regions. Regional Studies, 40(02), �89-200.
Cheng, L. K., & Kwan, Y. K. (2000). What are the determinants of the location of foreign direct
investment? The Chinese experience. Journal of international economics, 5�(2), 379-400.
Crozet, M., Mayer, T., & Mucchielli, J. L. (2004). How do firms agglomerate? A study of FDI in
France. Regional Science and Urban Economics, 34(�), 27-54.
Dall’Erba, S., & Le Gallo, J. (2008). Regional convergence and the impact of European stru-
ctural funds over �989–�999: A spatial econometric analysis*. Papers in Regional Science,
87(2), 2�9-244.
De Propris, L., & Driffield, N. (2006). The importance of clusters for spillovers from foreign dire-
ct investment and technology sourcing. Cambridge Journal of Economics, 30(2), 277-29�.
The Economist (20�2). Government proposes introduction of „special economic zones”. The
Economist. August 29th 20�2.
Ebenstein, A. (20�2). Winners and Losers of Multinational Firm Entry into Developing Coun-
tries: Evidence from the Special Economic Zones of the People’s Republic of China. Asian
Development Review, 29(�).
Ederveen, S., Groot, H. L., & Nahuis, R. (2006). Fertile soil for structural funds? A panel data
analysis of the conditional effectiveness of European cohesion policy. Kyklos, 59(�), �7-42.
Farole, T. (20�0). Second Best? Investment Climate and Performance in Africa’s Special Eco-
nomic Zones. Policy Research Working Paper. The World Bank.
Farole, T. (Ed.) (20�3). The Internal Geography of Trade: Lagging Regions and Global Mar-
kets. The World Bank.
Gibbon, P. (Ed.) (2008). Export Processing Zones as an economic development strategy. Da-
nish Institute for International Studies study for Danish Foreign Ministry.
CASE Network Studies & Analyses No. 467 –Special Economic Zones - 20 years later
30
Grubel, H. G. (�982). Towards a theory of free economic zones. Weltwirtschaftliches Archiv,
��8(�), 39-6�.
Gwosdz, K., Jarczewski, W., Huculak, M., & Wiederman, K. (2008). Polish special economic
zones: idea versus practice. Environment and planning. C, Government & policy, 26(4), 824.
KPMG (20��). Special Economic Zones. KPMG in Poland.
KPMG (2009). A guide to special economic zones in Poland. KPMG in Poland.
Kripfganz, S., & Schwarz, C. (20�2). Estimation of Linear Dynamic Panel Data Models with
Time-Invariant Regressors. Paper presented at the Econometric Society’s Australasia Mee-
ting, Melbourne, Summer.
Ledyaeva, S. (2009). Spatial econometric analysis of foreign direct investment determinants in
Russian regions. The World Economy, 32(4), 643-666.
Mohl, P., & Hagen, T. (20�0). Do EU structural funds promote regional growth? New evidence
from various panel data approaches. Regional Science and Urban Economics, 40(5), 353-
365.
Ramajo, J., Márquez, M. A., Hewings, G. J., & Salinas, M. M. (2008). Spatial heterogeneity and
interregional spillovers in the European Union: Do cohesion policies encourage convergence
across regions?. European Economic Review, 52(3), 55�-567.
Rodríguez-Pose, A. (20�2). Trade and regional inequality. Economic geography, 88(2), �09-
�36.
Tödtling, F., & Trippl, M. (2005). One size fits all?: Towards a differentiated regional innovation
policy approach. Research policy, 34(8), �203-�2�9.
Wang, J. (20�2). The economic impact of special economic zones: evidence from Chinese
municipalities. Journal of Development Economics.
World Bank (2009). World Development Report 2009: Reshaping Economic Geography.
Washington D.C.
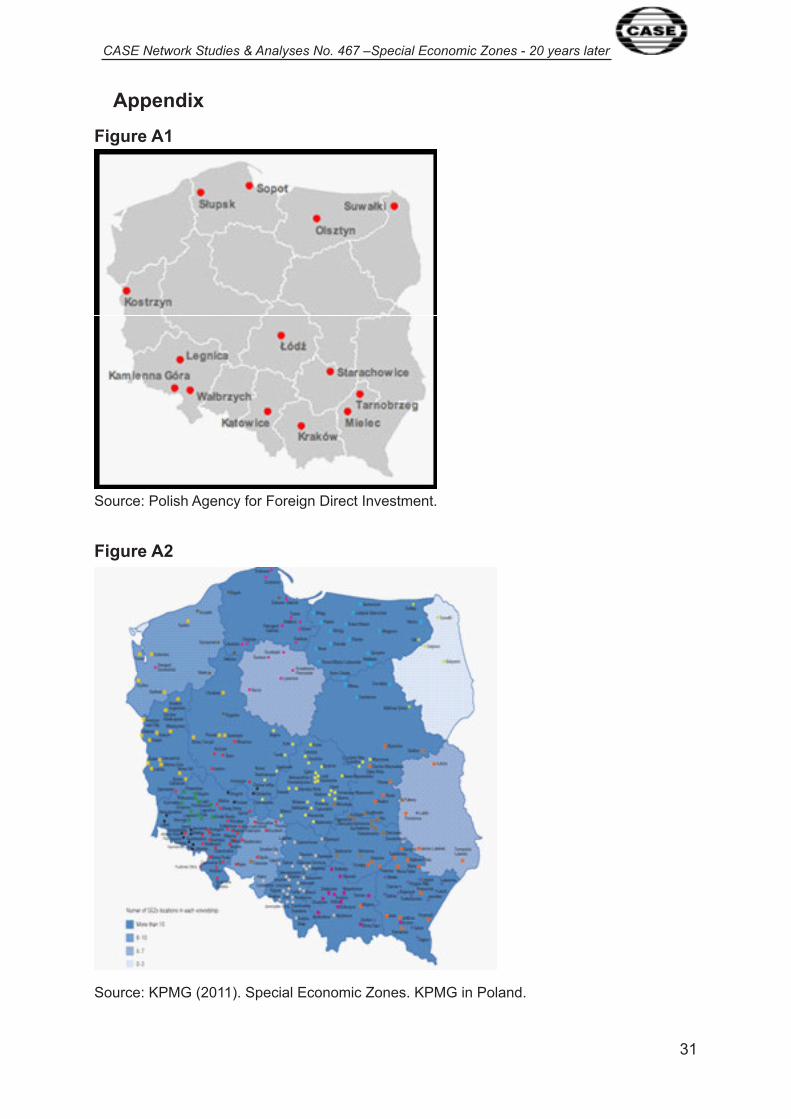
CASE Network Studies & Analyses No. 467 –Special Economic Zones - 20 years later
3�
Appendix
Figure A1
Source: Polish Agency for Foreign Direct Investment.
Figure A2
Source: KPMG (20��). Special Economic Zones. KPMG in Poland.

CASE Network Studies & Analyses No. 467 –Special Economic Zones - 20 years later
32
Table A1 – Descriptive statistics for the pooled data, nuts4 level
DEPENDRATE EDUCATION EDUCPERCAP EMISSIONS EMPLOYMENT
Mean 0.34 70�53902.�2 644.�5 4��.03 22435.50
Median 0.33 48032457.86 627.36 �22.00 �2853.50.
Maximum 0.43 2259244559.03 �936.65 22�30.00 29478.00
Minimum 0.24 82�725.00 30.54 0.00 �927.00
Std. Dev. 0.03 �03�40358.79 280.96 �0��.45 48303.29
Skewness 0.42 �0.38 0.32 7.68 ��.02
Kurtosis 2.75 �7�.�4 3.32 95.4� �59.�0
Observations 6023 6402 6023 6029 6402
EMPRATE EUSUBSIDIES FIRMPOP FORFIRMPOP GREENINVEST
Mean 0.28 6304787.24 8804.62 �3�.23 �7424.76
Median 0.25 225983�.76 5475.00 35.00 8336.60
Maximum 0.87 3�77060�4.37 34426�.00 2�5�5.00 93083�.00
Minimum 0.09 0.00 498.00 0.00 20.00
Std. Dev. 0.�� �6440882.35 �7543.65 809.75 35087.47
Skewness �.39 9.65 ��.�7 �8.84 8.86
Kurtosis 5.62 �36.66 �68.77 403.48 �53.46
Observations 2274 6402 6402 3773 6023
INVEST POPULATION PRIVFIRMPOP SEZ SOERATE
Mean 236.64 �0�746.56 85�9.44 0.47 0.04
Median 89.95 76464.00 5257.00 0.00 0.04
Maximum 20536.70 �720398.00 339862.00 �.00 0.�4
Minimum 2.90 20934.00 443.00 0.00 0.0�
Std. Dev. 860.3� ��6492.29 �7234.20 0.50 0.02
Skewness �5.4� 8.26 ��.26 0.�2 �.�4
Kurtosis 296.�6 97.58 �7�.�8 �.0� 5.34
Observations 2654 6023 6402 6477 6402
SUBSIDIES SUBSPERCAP WAGES WORKING POPULATION
Mean 57722089.�0 568.25 83.94 67982.89
Median 42323872.50 565.66 80.70 50�52.00
Maximum �32830�842.00 �766.8� �83.60 ��6272�.00
Minimum 403492.00 �0.46 58.60 �3�49.00
Std. Dev. 67538785.44 278.0� �2.49 7949�.9�
Skewness 7.�3 0.28 2.54 8.��
Kurtosis 9�.26 2.95 �3.39 94.32
Observations 6402 6023 379� 6023
Source: own estimations
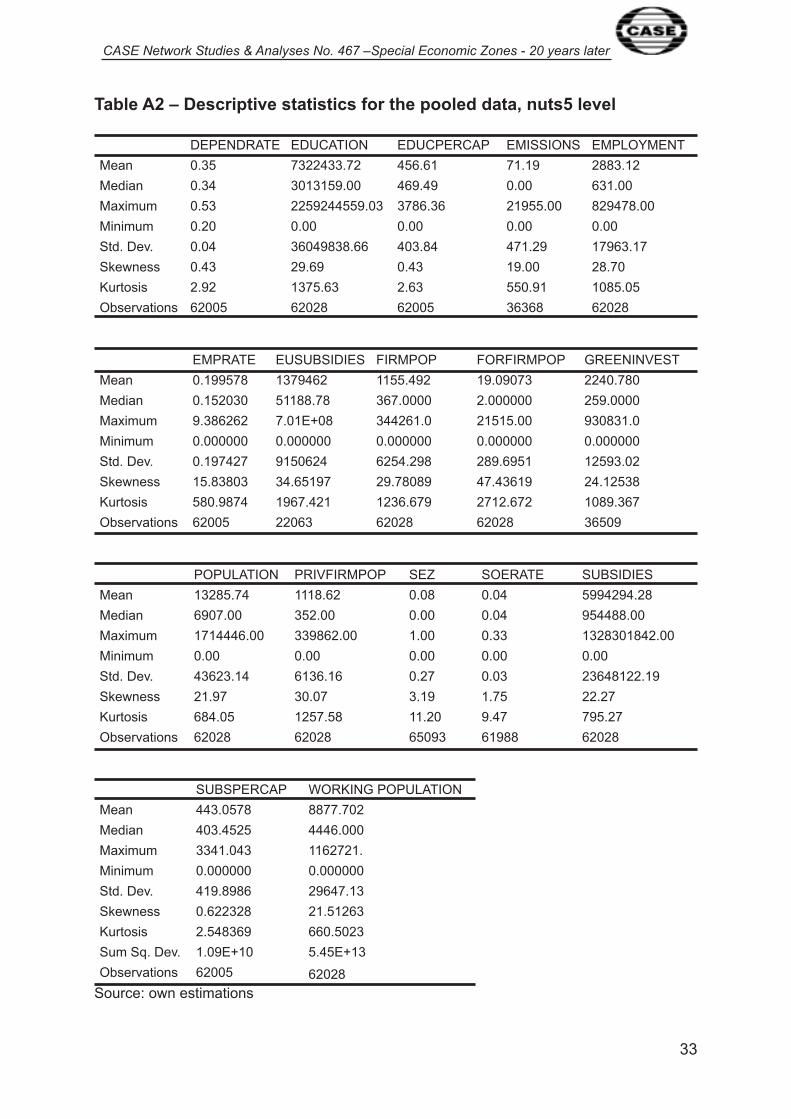
CASE Network Studies & Analyses No. 467 –Special Economic Zones - 20 years later
33
Table A2 – Descriptive statistics for the pooled data, nuts5 level
DEPENDRATE EDUCATION EDUCPERCAP EMISSIONS EMPLOYMENT
Mean 0.35 7322433.72 456.6� 7�.�9 2883.�2
Median 0.34 30�3�59.00 469.49 0.00 63�.00
Maximum 0.53 2259244559.03 3786.36 2�955.00 829478.00
Minimum 0.20 0.00 0.00 0.00 0.00
Std. Dev. 0.04 36049838.66 403.84 47�.29 �7963.�7
Skewness 0.43 29.69 0.43 �9.00 28.70
Kurtosis 2.92 �375.63 2.63 550.9� �085.05
Observations 62005 62028 62005 36368 62028
EMPRATE EUSUBSIDIES FIRMPOP FORFIRMPOP GREENINVEST
Mean 0.�99578 �379462 ��55.492 �9.09073 2240.780
Median 0.�52030 5��88.78 367.0000 2.000000 259.0000
Maximum 9.386262 7.0�E+08 34426�.0 2�5�5.00 93083�.0
Minimum 0.000000 0.000000 0.000000 0.000000 0.000000
Std. Dev. 0.�97427 9�50624 6254.298 289.695� �2593.02
Skewness �5.83803 34.65�97 29.78089 47.436�9 24.�2538
Kurtosis 580.9874 �967.42� �236.679 27�2.672 �089.367
Observations 62005 22063 62028 62028 36509
POPULATION PRIVFIRMPOP SEZ SOERATE SUBSIDIES
Mean �3285.74 ���8.62 0.08 0.04 5994294.28
Median 6907.00 352.00 0.00 0.04 954488.00
Maximum �7�4446.00 339862.00 �.00 0.33 �32830�842.00
Minimum 0.00 0.00 0.00 0.00 0.00
Std. Dev. 43623.�4 6�36.�6 0.27 0.03 23648�22.�9
Skewness 2�.97 30.07 3.�9 �.75 22.27
Kurtosis 684.05 �257.58 ��.20 9.47 795.27
Observations 62028 62028 65093 6�988 62028
SUBSPERCAP WORKING POPULATION
Mean 443.0578 8877.702
Median 403.4525 4446.000
Maximum 334�.043 ��6272�.
Minimum 0.000000 0.000000
Std. Dev. 4�9.8986 29647.�3
Skewness 0.622328 2�.5�263
Kurtosis 2.548369 660.5023
Sum Sq. Dev. �.09E+�0 5.45E+�3
Observations 62005 62028
Source: own estimations