Embed Size (px)
Citation preview
7/6/2010
1
WisDOT/WAPA Asphalt Pavement
Project Manager Training
June 2010
1
Topics
• HMA Materials and Mix Design
• HMA Plant Overview
• Hauling, Laydown and Compaction
• Quality Management Program
• Overlay Applications and Asphaltic Surfaces
2
Let’s talk about
• What the specifications say
• Good construction practices
• Project Managers/Leaders roles and
responsibilities
3
Hot Mix Asphalt Materials
and Mix Design
WisDOT/WAPA Asphalt Pavement
Project Manager Training
June 2010
4
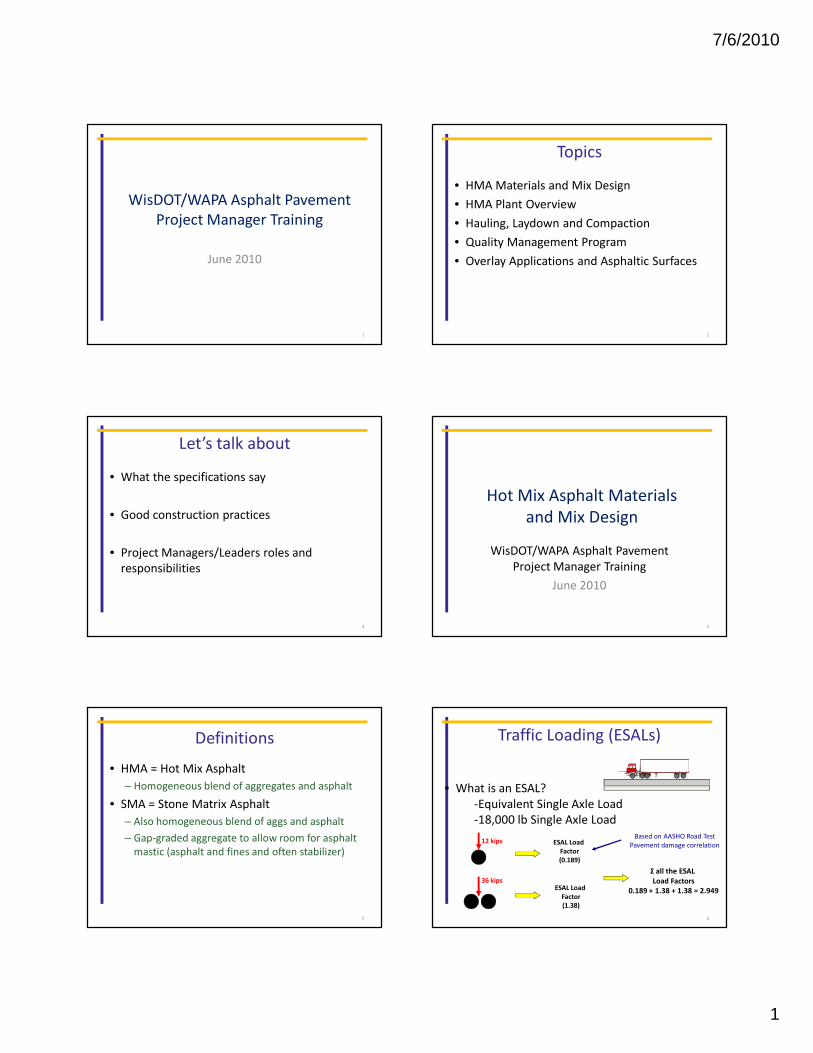
Definitions
• HMA = Hot Mix Asphalt
– Homogeneous blend of aggregates and asphalt
• SMA = Stone Matrix Asphalt
– Also homogeneous blend of aggs and asphalt
– Gap-graded aggregate to allow room for asphalt
mastic (asphalt and fines and often stabilizer)
5
Traffic Loading (ESALs)
• What is an ESAL?
-Equivalent Single Axle Load
-18,000 lb Single Axle Load
12 kips
36 kips
ESAL Load
Factor
(0.189)
ESAL Load
Factor
(1.38)
Based on AASHO Road Test
Pavement damage correlation
Σ all the ESAL
Load Factors
0.189 + 1.38 + 1.38 = 2.949
6
7/6/2010
2
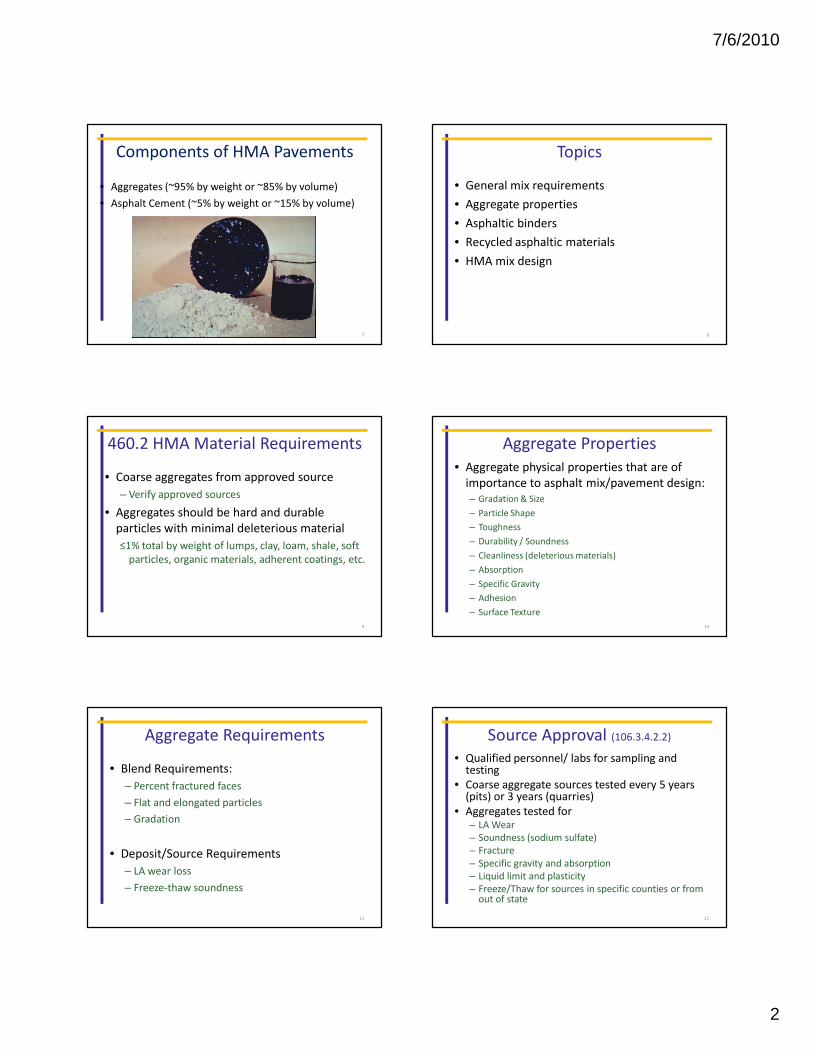
Components of HMA Pavements
• Aggregates (~95% by weight or ~85% by volume)
• Asphalt Cement (~5% by weight or ~15% by volume)
7
Topics
• General mix requirements
• Aggregate properties
• Asphaltic binders
• Recycled asphaltic materials
• HMA mix design
8
460.2 HMA Material Requirements
• Coarse aggregates from approved source
– Verify approved sources
• Aggregates should be hard and durable
particles with minimal deleterious material
≤1% total by weight of lumps, clay, loam, shale, soft
particles, organic materials, adherent coatings, etc.
9
Aggregate Properties
• Aggregate physical properties that are of
importance to asphalt mix/pavement design:
– Gradation & Size
– Particle Shape
– Toughness
– Durability / Soundness
– Cleanliness (deleterious materials)
– Absorption
– Specific Gravity
– Adhesion
– Surface Texture
10
Aggregate Requirements
• Blend Requirements:
– Percent fractured faces
– Flat and elongated particles
– Gradation
• Deposit/Source Requirements
– LA wear loss
– Freeze-thaw soundness
11
Source Approval (106.3.4.2.2)
• Qualified personnel/ labs for sampling and testing
• Coarse aggregate sources tested every 5 years (pits) or 3 years (quarries)
• Aggregates tested for– LA Wear
– Soundness (sodium sulfate)
– Fracture
– Specific gravity and absorption
– Liquid limit and plasticity
– Freeze/Thaw for sources in specific counties or from out of state
12
7/6/2010
3
Aggregate Gradation
• Distribution of particle sizes expressed as percent of total weight
• Determined by sieve analysis
13
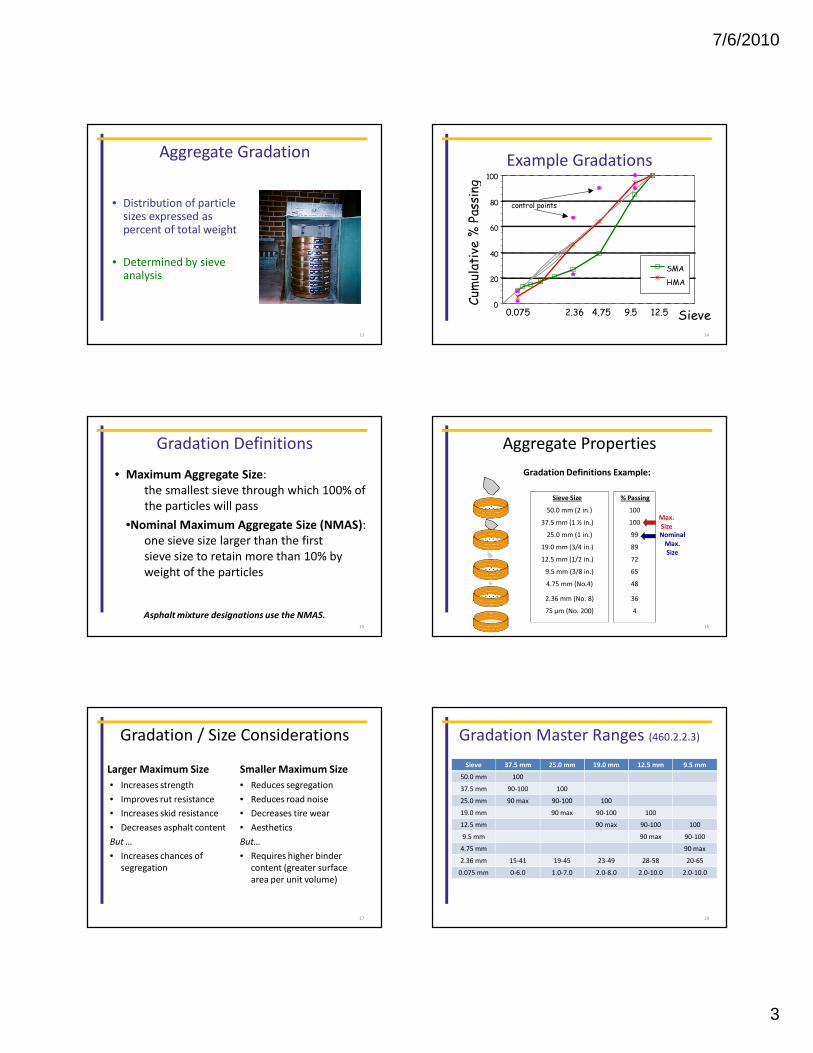
0
20
40
60
80
100
Sieve
Cum
ulative % Passing
SMA
HMA
control points
0.075 2.36 4.75 9.5 12.5
Example Gradations
14
• Maximum Aggregate Size:
the smallest sieve through which 100% of
the particles will pass
•Nominal Maximum Aggregate Size (NMAS):
one sieve size larger than the first
sieve size to retain more than 10% by
weight of the particles
Asphalt mixture designations use the NMAS.
Gradation Definitions
15
Sieve Size
50.0 mm (2 in.)
37.5 mm (1 ½ in.)
25.0 mm (1 in.)
19.0 mm (3/4 in.)
12.5 mm (1/2 in.)
9.5 mm (3/8 in.)
4.75 mm (No.4)
2.36 mm (No. 8)
75 μm (No. 200)
% Passing
100
99
100
89
72
65
48
36
4
Max.
Size
Nominal
Max.
Size
Aggregate Properties
Gradation Definitions Example:
16
Gradation / Size Considerations
Larger Maximum Size
• Increases strength
• Improves rut resistance
• Increases skid resistance
• Decreases asphalt content
But …
• Increases chances of
segregation
Smaller Maximum Size
• Reduces segregation
• Reduces road noise
• Decreases tire wear
• Aesthetics
But…
• Requires higher binder
content (greater surface
area per unit volume)
17
Gradation Master Ranges (460.2.2.3)
Sieve 37.5 mm 25.0 mm 19.0 mm 12.5 mm 9.5 mm
50.0 mm 100
37.5 mm 90-100 100
25.0 mm 90 max 90-100 100
19.0 mm 90 max 90-100 100
12.5 mm 90 max 90-100 100
9.5 mm 90 max 90-100
4.75 mm 90 max
2.36 mm 15-41 19-45 23-49 28-58 20-65
0.075 mm 0-6.0 1.0-7.0 2.0-8.0 2.0-10.0 2.0-10.0
18
7/6/2010
4
SMA Gradation Requirements
Sieve SMA 12.5 mm SMA 9.5 mm
19.0 mm 100
12.5 mm 90-97 100
9.5 mm 58-72 90-100
4.75 mm 25-35 35-45
2.36 mm 15-25 18-28
0.075 mm 8.0-12.0 10.0-14.0
19
Nominal Sizes for Layers
• Lower pavement level 19.0 mm
• Upper pavement level 12.5 mm
• SMA layer 12.5 mm
Unless otherwise specified in contract.
20
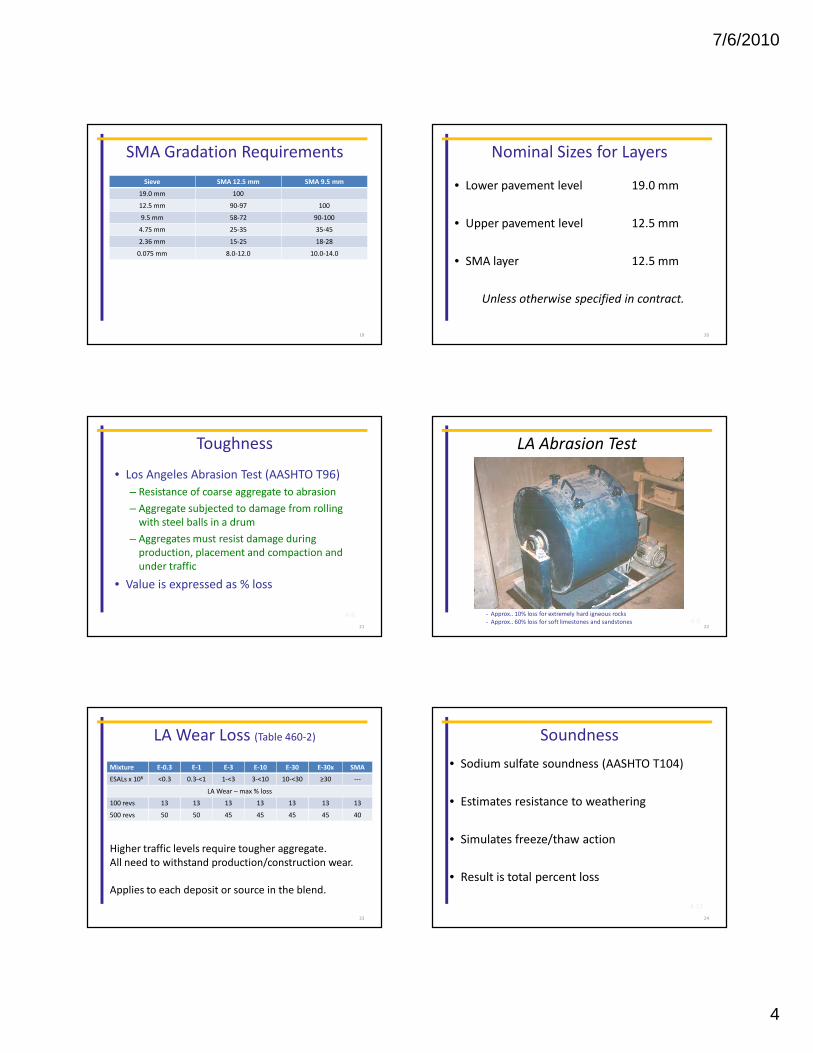
Toughness
• Los Angeles Abrasion Test (AASHTO T96)
– Resistance of coarse aggregate to abrasion
– Aggregate subjected to damage from rolling
with steel balls in a drum
– Aggregates must resist damage during
production, placement and compaction and
under traffic
• Value is expressed as % loss
4-8
21
LA Abrasion Test
- Approx.. 10% loss for extremely hard igneous rocks
- Approx.. 60% loss for soft limestones and sandstones 4-922
LA Wear Loss (Table 460-2)
Mixture E-0.3 E-1 E-3 E-10 E-30 E-30x SMA
ESALs x 106 <0.3 0.3-<1 1-<3 3-<10 10-<30 ≥30 ---
LA Wear – max % loss
100 revs 13 13 13 13 13 13 13
500 revs 50 50 45 45 45 45 40
Higher traffic levels require tougher aggregate.
All need to withstand production/construction wear.
Applies to each deposit or source in the blend.
23
4-11
Soundness
• Sodium sulfate soundness (AASHTO T104)
• Estimates resistance to weathering
• Simulates freeze/thaw action
• Result is total percent loss
24

7/6/2010
5
Soundness
Before After
4-12
25
Freeze-Thaw Durability
• AASHTO T 103
• Similar to soundness test but with alcohol-
water solution
• Required for limestone/dolomite sources and
gravel sources in specific counties or from out
of state (106.3.4.2.2.2)
26
Soundness and Freeze-Thaw
Mixture E-0.3 E-1 E-3 E-10 E-30 E-30x SMA
ESALs x 106 <0.3 0.3-<1 1-<3 3-<10 10-<30 ≥30 ---
Soundness 12 12 12 12 12 12 12
Freeze-Thaw 18 18 18 18 18 18 18
Applies to each source or deposit used in blend.
27
• Cubical preferred over flat, thin, elongated or
round.
• Greater interlock and internal friction →
stable mix.
• Coarse and fine aggregate angularity
• Influences workability and compaction
Particle Shape
28
Shape – Fractured Faces
• Determined by visual inspection and count
• Percent of particles with one or more crushed
faces and with two or more crushed faces.
• Stability, rut resistance
29
Shape – Flat and Elongated Particles
• ASTM D4791
– Total flat and elongated
– Maximum to minimum dimension
• 5:1 (3:1 for SMA)
• “Flaky” particles can break under
rollers or make mix harsh and hard
to compact4-26
30
7/6/2010
6
B
A
MaximumMinimum
4-28
Flat and Elongated
31
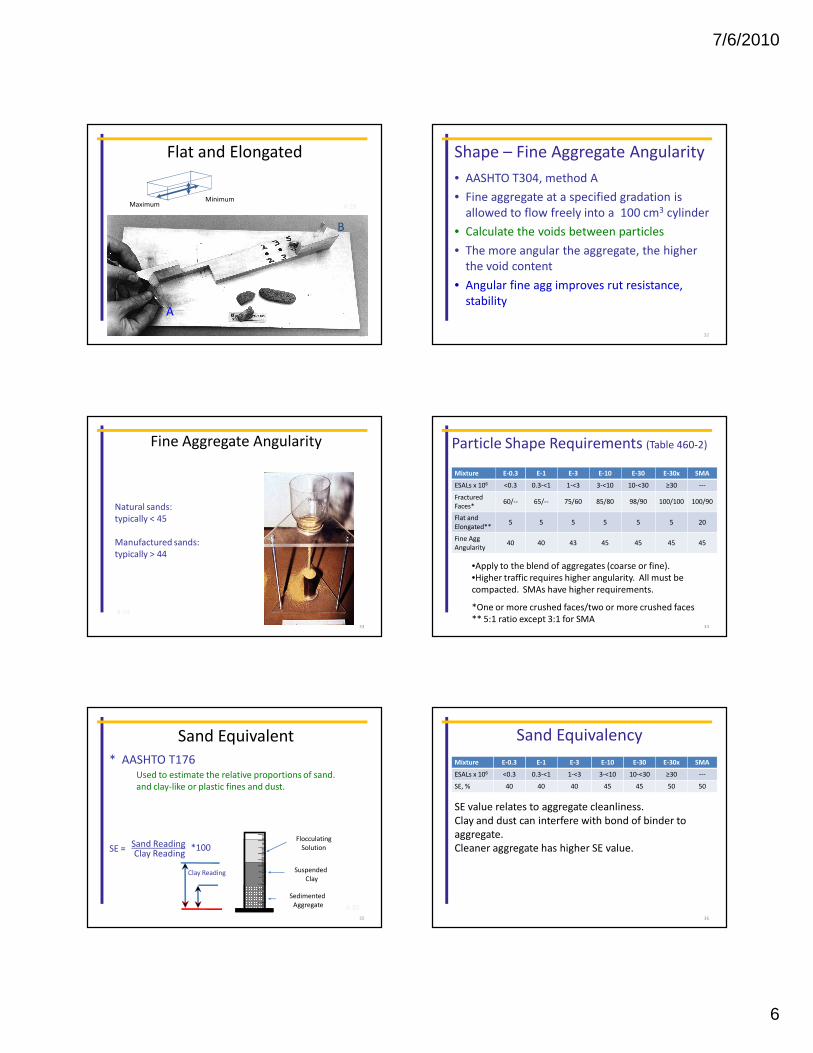
Shape – Fine Aggregate Angularity
• AASHTO T304, method A
• Fine aggregate at a specified gradation is
allowed to flow freely into a 100 cm3 cylinder
• Calculate the voids between particles
• The more angular the aggregate, the higher
the void content
• Angular fine agg improves rut resistance,
stability
32
Fine Aggregate Angularity
Natural sands:
typically < 45
Manufactured sands:
typically > 44
4-24
33
Particle Shape Requirements (Table 460-2)
Mixture E-0.3 E-1 E-3 E-10 E-30 E-30x SMA
ESALs x 106 <0.3 0.3-<1 1-<3 3-<10 10-<30 ≥30 ---
Fractured
Faces*60/-- 65/-- 75/60 85/80 98/90 100/100 100/90
Flat and
Elongated**5 5 5 5 5 5 20
Fine Agg
Angularity40 40 43 45 45 45 45
•Apply to the blend of aggregates (coarse or fine).
•Higher traffic requires higher angularity. All must be
compacted. SMAs have higher requirements.
*One or more crushed faces/two or more crushed faces
** 5:1 ratio except 3:1 for SMA34
* AASHTO T176Used to estimate the relative proportions of sand.
and clay-like or plastic fines and dust.
SE = Sand ReadingClay Reading
Sand
Reading
Clay Reading
Flocculating
Solution
Suspended
Clay
Sedimented
Aggregate
*100
Sand Equivalent
4-30
35
Sand Equivalency
Mixture E-0.3 E-1 E-3 E-10 E-30 E-30x SMA
ESALs x 106 <0.3 0.3-<1 1-<3 3-<10 10-<30 ≥30 ---
SE, % 40 40 40 45 45 50 50
SE value relates to aggregate cleanliness.
Clay and dust can interfere with bond of binder to
aggregate.
Cleaner aggregate has higher SE value.
36
7/6/2010
7
• All aggregates are porous to varying degrees, which
affects the amount of asphalt needed to coat the
aggregate particles and the percentage of air voids
in the final mixture.
• Some absorption is good – improves bond with
binder.
• Too much is uneconomical and makes mix design
tricky.
Aggregate Properties
37
Asphaltic Binders
38
Binder Grades
• Specified in contract.
• Contractor option to use virgin, modified or
blend with recovered (RAP) binder
• Resultant blend must meet specified grade.
39
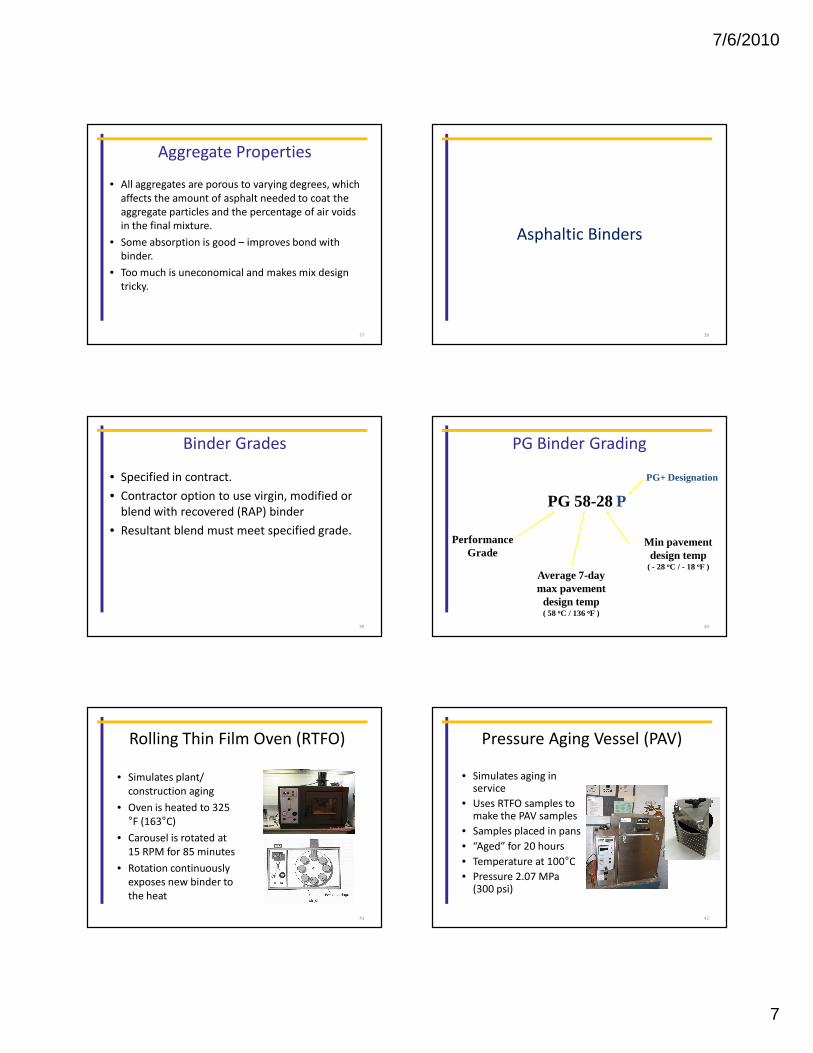
PG 58-28
PerformanceGrade
Average 7-daymax pavement
design temp( 58 oC / 136 oF )
Min pavementdesign temp
( - 28 oC / - 18 oF )
PG Binder Grading
P
PG+ Designation
40
Rolling Thin Film Oven (RTFO)
• Simulates plant/
construction aging
• Oven is heated to 325
°F (163°C)
• Carousel is rotated at
15 RPM for 85 minutes
• Rotation continuously
exposes new binder to
the heat
41
Pressure Aging Vessel (PAV)
• Simulates aging in service
• Uses RTFO samples to make the PAV samples
• Samples placed in pans
• “Aged” for 20 hours
• Temperature at 100°C
• Pressure 2.07 MPa (300 psi)
42

7/6/2010
8
Rotational Viscometer (RV)
• For pumping and mixing at
the plant.
• Measures the required
torque to maintain a
constant rotational speed
(20 RPM)
• Converts the torque to
viscosity at high
temperature (135°C)
43
Dynamic Shear Rheometer (DSR)
• Relates to resistance to rutting
and fatigue.
• Test sandwiches the sample
between two circular plates
• Upper plate oscillates back and
forth at a specified rate (Hz)
• Quantifies both the elastic and
viscous properties
• Measures phase angle
(elasticity)
44
Bending Beam Rheometer (BBR)
• Tests for resistance to low
temperature cracking.
• A load is applied to beam of
asphalt and its deflection is
measured against time
• Stiffness is calculated based
on measured deflection and
standard beam properties
• Direct tension test can also
be used for thermal cracking
45
Elastic Recovery
• Stretch binder sample at low temperature
• Cut the thread of binder
• Allow thread to recover (retract)
• Put ends together and determine how much
the thread “snapped back”
• Want elastic binders to resist rutting.
46
Putting It All TogetherThermal
Cracking
Fatigue
Cracking
Permanent
Deformation
Workability
(Mix & Compact)
-202060135
Pavement Temperature, C
RTFO
Sample
Unaged
SampleRTFO & PAV
Sample
RTFO & PAV
Sample
47
PG Binder Grading SpecPG 46 PG 52 PG 58 PG 64 PG 70 PG 76 PG 82
(Rotational Viscosity) RV
90 90 100 100 100 (110) 100 (110) 110 (110)
(Flash Point) FP
46 52 58 64 70 76 82
46 52 58 64 70 76 82
(ROLLING THIN FILM OVEN) (ROLLING THIN FILM OVEN) RTFO RTFO Mass Loss Mass Loss << 1.00 %1.00 %
(Direct Tension) DT
(Bending Beam Rheometer) BBR Physical Hardening
28
-34 -40 -46 -10 -16 -22 -28 -34 -40 -46 -16 -22 -28 -34 -40 -10 -16 -22 -28 -34 -40 -10 -16 -22 -28 -34 -40 -10 -16 -22 -28 -34 -10 -16 -22 -28 -34
Avg 7-day Max, oC
1-day Min, oC
(PRESSURE AGING VESSEL) (PRESSURE AGING VESSEL) PAVPAV
ORIGINALORIGINAL
> 1.00 kPa
< 5000 kPa
> 2.20 kPa
S < 300 MPa m > 0.300
Report Value
> 1.00 %
20 Hours, 2.07 MPa
10 7 4 25 22 19 16 13 10 7 25 22 19 16 13 31 28 25 22 19 16 34 31 28 25 22 19 37 34 31 28 25 40 37 34 31
(Dynamic Shear Rheometer) DSR G* sin δδδδ
( Bending Beam Rheometer) BBR “S” Stiffness & “m”- value
-24 -30 -36 0 -6 -12 -18 -24 -30 -36 -6 -12 -18 -24 -30 0 -6 -12 -18 -24 -30 0 -6 -12 -18 -24 -30 0 -6 -12 -18 -24 0 -6 -12 -18 -24
-24 -30 -36 0 -6 -12 -18 -24 -30 -36 -6 -12 -18 -24 -30 0 -6 -12 -18 -24 -30 0 -6 -12 -18 -24 -30 0 -6 -12 -18 -24 0 -6 -12 -18 -24
(Dynamic Shear Rheometer) DSR G*/sin δδδδ
(Dynamic Shear Rheometer) DSR G*/sin δδδδ
< 3 Pa.s @ 135 oC
> 230 oC
CEC
Safety
High Temp Handling
Workability
Rutting Resistance
Fatigue Cracking
Thermal Cracking
Thermal Cracking48
7/6/2010
9
PG + (PGXX-XXP)
For Temperature Spread:
• 92° - ER ≥ 65%, δ ≤ 77.0
• 98° - ER ≥ 65%, δ ≤ 75.0
• 104° - ER ≥ 65%, δ ≤ 73.0
δ measured on original binder.
49
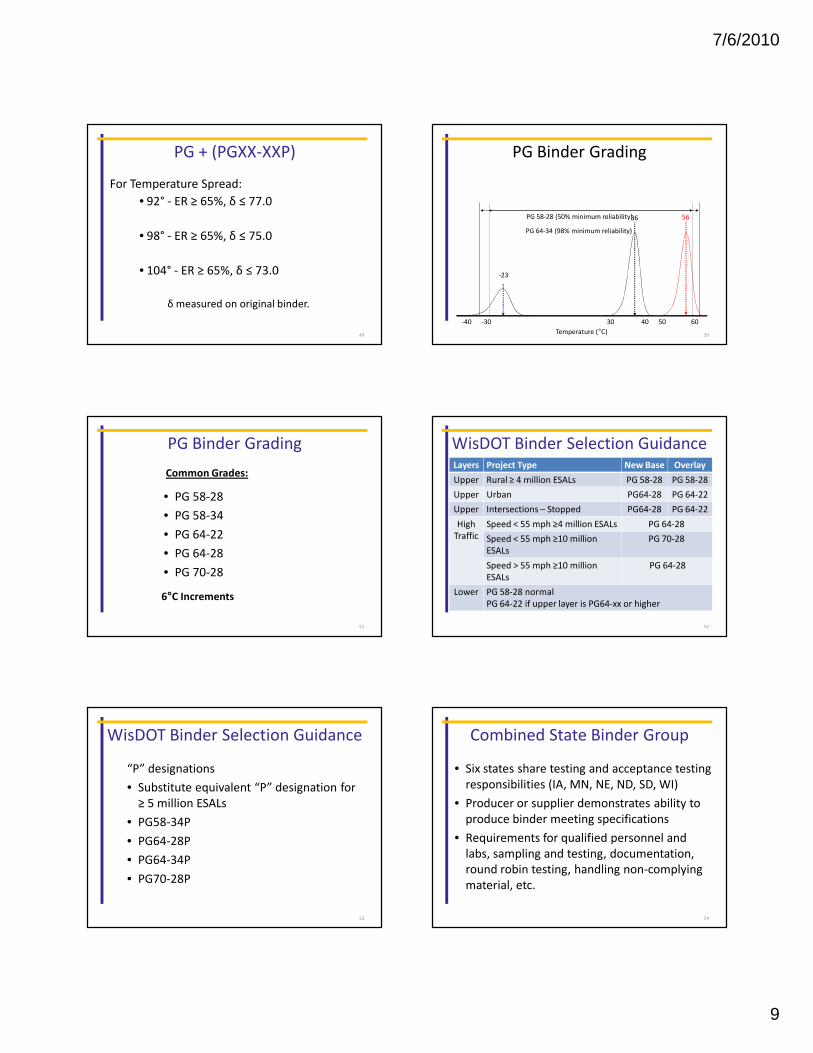
PG 58-28 (50% minimum reliability)
PG 64-34 (98% minimum reliability)
PG Binder Grading
Temperature (°C)
-30-40 30 40 50 60
-23
36 56
50
• PG 58-28
• PG 58-34
• PG 64-22
• PG 64-28
• PG 70-28
PG Binder Grading
Common Grades:
6°C Increments
51
WisDOT Binder Selection GuidanceLayers Project Type New Base Overlay
Upper Rural ≥ 4 million ESALs PG 58-28 PG 58-28
Upper Urban PG64-28 PG 64-22
Upper Intersections – Stopped PG64-28 PG 64-22
High
Traffic
Speed < 55 mph ≥4 million ESALs PG 64-28
Speed < 55 mph ≥10 million
ESALs
PG 70-28
Speed > 55 mph ≥10 million
ESALs
PG 64-28
Lower PG 58-28 normal
PG 64-22 if upper layer is PG64-xx or higher
52
WisDOT Binder Selection Guidance
“P” designations
• Substitute equivalent “P” designation for
≥ 5 million ESALs
• PG58-34P
• PG64-28P
• PG64-34P
• PG70-28P
53
Combined State Binder Group
• Six states share testing and acceptance testing
responsibilities (IA, MN, NE, ND, SD, WI)
• Producer or supplier demonstrates ability to
produce binder meeting specifications
• Requirements for qualified personnel and
labs, sampling and testing, documentation,
round robin testing, handling non-complying
material, etc.
54
7/6/2010
10
Project Personnel
• Obtain samples to monitor quality at plant for
alterations made to site storage, plant
handling process or if modification is
occurring at plant.
55
Recycled Asphaltic Materials
56
Definitions
• RAP = Reclaimed Asphalt Pavement
• FRAP = Fractionated Reclaimed Asphalt Pavement
– RAP separated into different size fractions
– Fine fraction contains higher binder content
– Coarse fraction may be easier to incorporate and meet specs
• RAS = Recycled Asphalt Shingles
57
Recycled Asphaltic Materials
• Contractor option to use RAP, FRAP and RAS
• Stockpile recycled materials separately
• Treat as individual JMF components
• Allowable contents based on percent binder
replacement
– Ratio of recovered binder to total binder
58
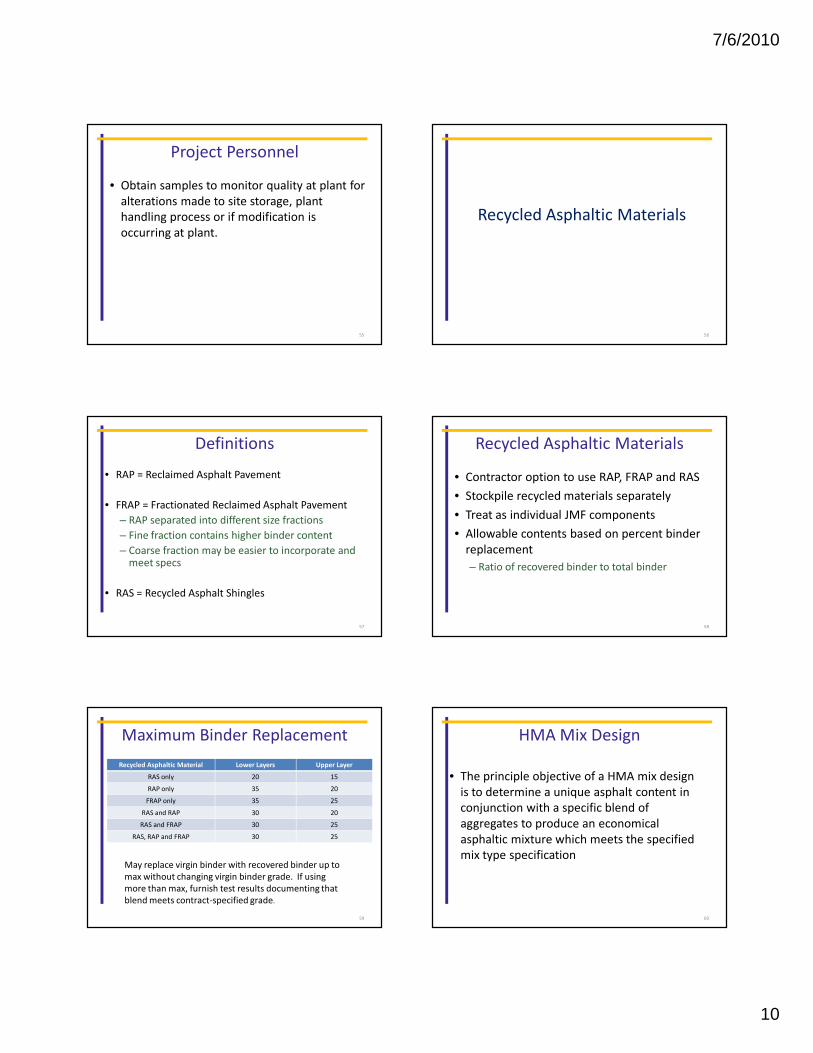
Maximum Binder Replacement
Recycled Asphaltic Material Lower Layers Upper Layer
RAS only 20 15
RAP only 35 20
FRAP only 35 25
RAS and RAP 30 20
RAS and FRAP 30 25
RAS, RAP and FRAP 30 25
May replace virgin binder with recovered binder up to
max without changing virgin binder grade. If using
more than max, furnish test results documenting that
blend meets contract-specified grade.
59
HMA Mix Design
• The principle objective of a HMA mix design
is to determine a unique asphalt content in
conjunction with a specific blend of
aggregates to produce an economical
asphaltic mixture which meets the specified
mix type specification
60
7/6/2010
11
• Factors related to durability
– Sufficient asphalt binder in the mixture
– Sufficient compactive effort
– Sufficient air voids
– Quality of aggregates
HMA Mix Design
61
• The amount of air voids measured in the
HMA mixture is the most important factor in
predicting HMA pavement performance
– 3-5% air voids has historically proven to provide
the best pavement performance
– Compaction specifications require ~10% air voids
(or min. 89.5% density)
• After 3 years of traffic loading, the pavement air voids
reduce to ~4%
HMA Mix Design
62
Mix Design
Balance
• Rut Resistance vs.
Cracking Resistance
• Durability vs.
Stability
• VMA, Air Voids,
Binder Content
63
Volumetrics
• Designed Air Void (Va) Target = 4%
• VMA Target based on nominal aggregate size
• Asphalt Content (Pb) dependent upon volumetrics with the required Va and VMA at Ndesign
64
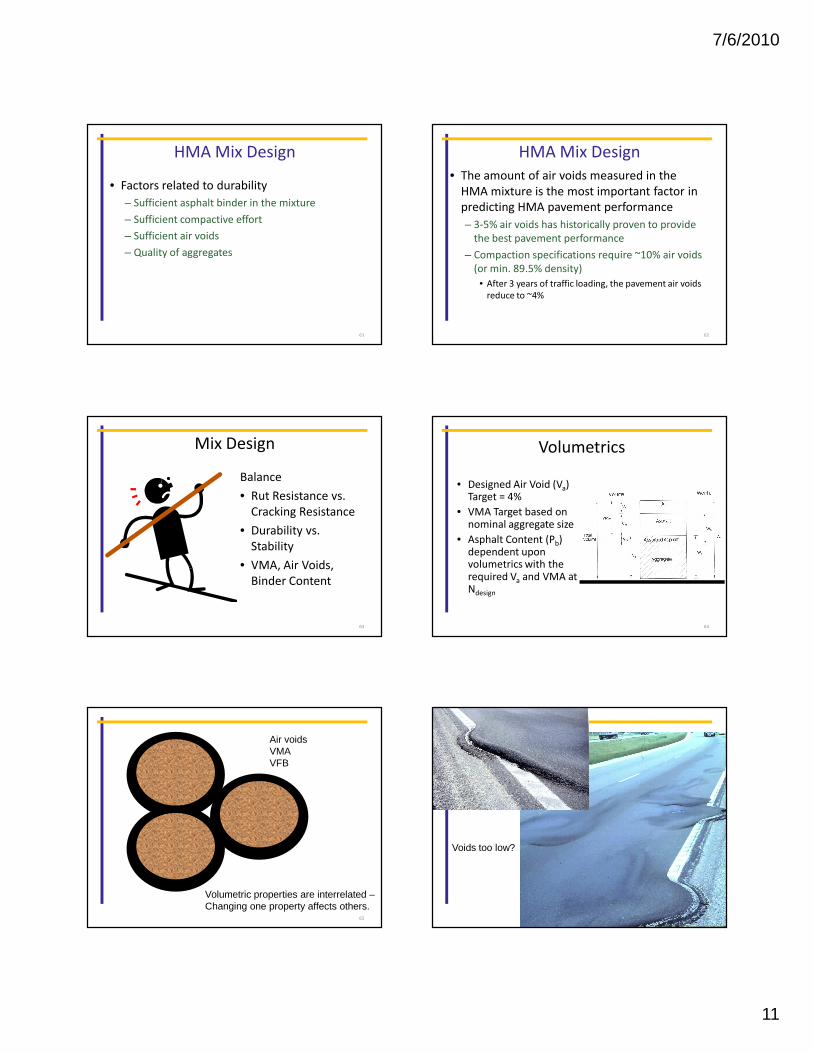
Volumetric properties are interrelated –Changing one property affects others.
Air voidsVMAVFB
65
Voids too low?
66
7/6/2010
12
1. Materials Selection
– Approved agg sources
– Specified binder grade
2. Design Aggregate Structure
– Mix trials and evaluate volumetrics
3. Design Asphalt Binder Content
– For selected aggregate blend
4. Moisture Sensitivity Check
Steps in Mix Design
Based on 20 year traffic loading (ESALs)67
Superpave Mix Design Equipment
Marshall Hammer
Superpave Gyratory Compactor
•Better simulates roller
compactive effort
•Kneads material similar
to traffic
•Indicates pavement
performance at three
stages of pavement life
68
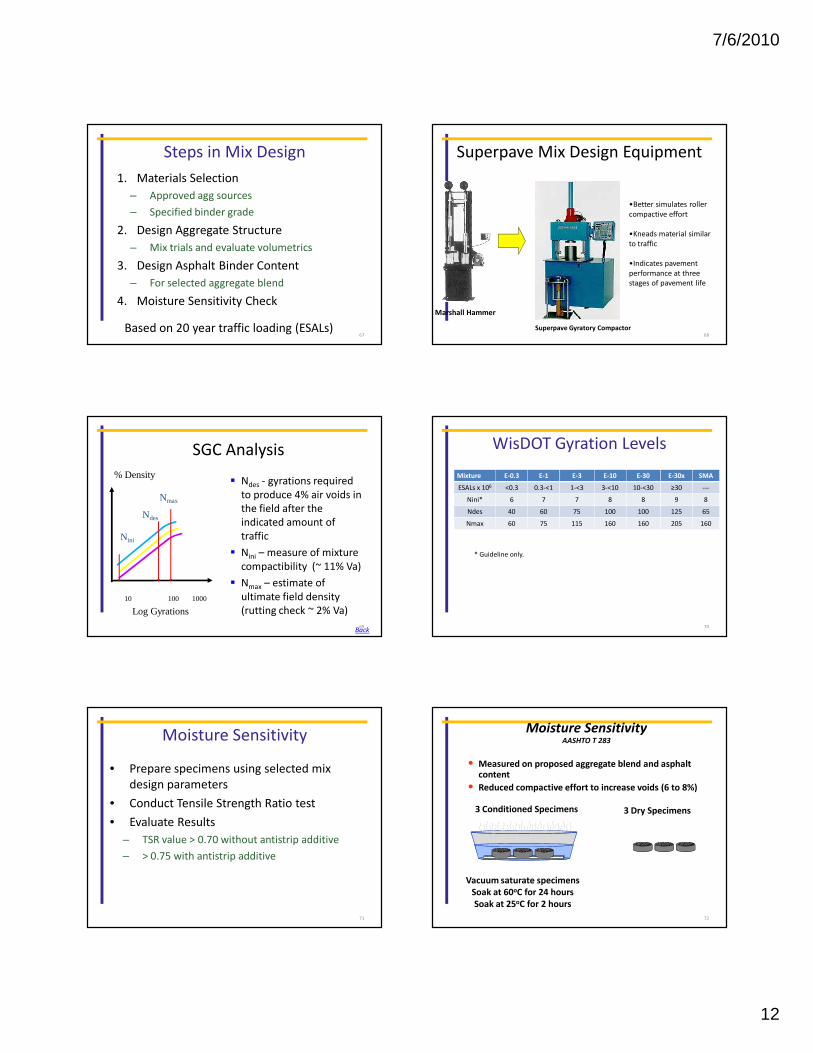
% Density
Log Gyrations10 100 1000
Nini
Ndes
Nmax
� Ndes - gyrations required
to produce 4% air voids in
the field after the
indicated amount of
traffic
� Nini – measure of mixture
compactibility (~ 11% Va)
� Nmax – estimate of
ultimate field density
(rutting check ~ 2% Va)
SGC Analysis
Back69
WisDOT Gyration Levels
Mixture E-0.3 E-1 E-3 E-10 E-30 E-30x SMA
ESALs x 106 <0.3 0.3-<1 1-<3 3-<10 10-<30 ≥30 ---
Nini* 6 7 7 8 8 9 8
Ndes 40 60 75 100 100 125 65
Nmax 60 75 115 160 160 205 160
* Guideline only.
70
• Prepare specimens using selected mix
design parameters
• Conduct Tensile Strength Ratio test
• Evaluate Results
– TSR value > 0.70 without antistrip additive
– > 0.75 with antistrip additive
Moisture Sensitivity
71
Moisture SensitivityAASHTO T 283
• Measured on proposed aggregate blend and asphalt content
• Reduced compactive effort to increase voids (6 to 8%)
3 Conditioned Specimens 3 Dry Specimens
Vacuum saturate specimens
Soak at 60oC for 24 hours
Soak at 25oC for 2 hours
72
7/6/2010
13
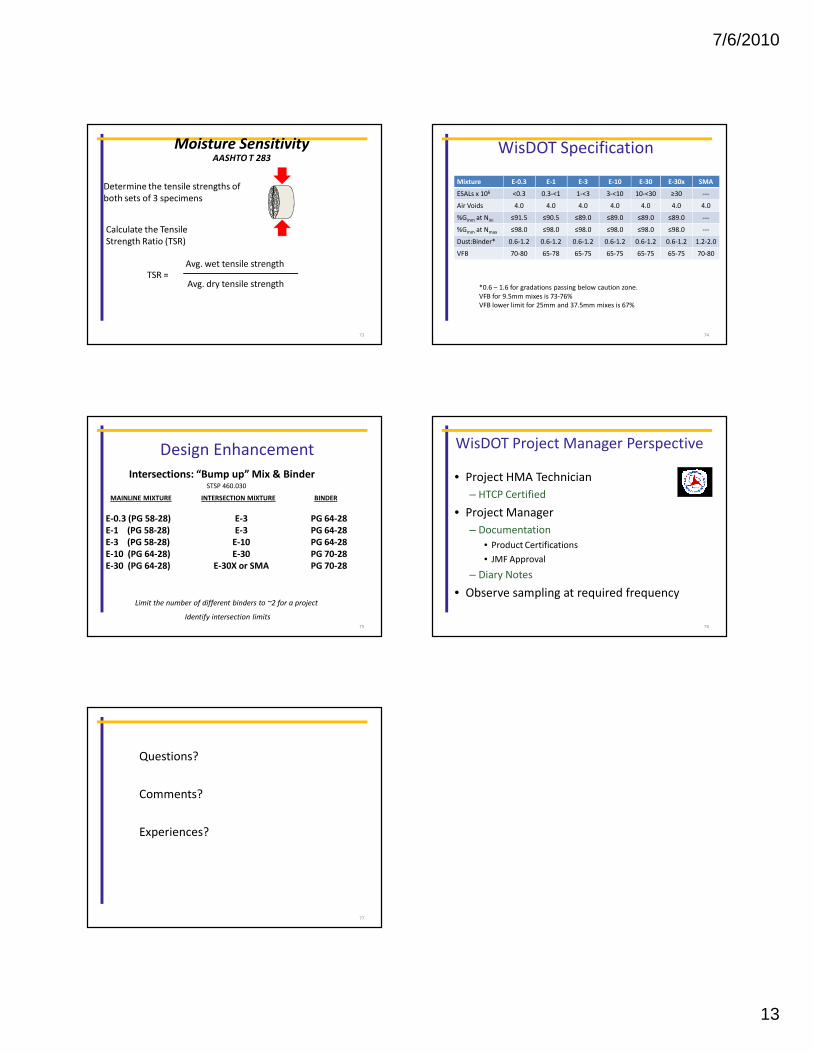
Calculate the Tensile
Strength Ratio (TSR)
Moisture SensitivityAASHTO T 283
Determine the tensile strengths of
both sets of 3 specimens
TSR =
Avg. wet tensile strength
Avg. dry tensile strength
73
WisDOT Specification
Mixture E-0.3 E-1 E-3 E-10 E-30 E-30x SMA
ESALs x 106 <0.3 0.3-<1 1-<3 3-<10 10-<30 ≥30 ---
Air Voids 4.0 4.0 4.0 4.0 4.0 4.0 4.0
%Gmm at Nini ≤91.5 ≤90.5 ≤89.0 ≤89.0 ≤89.0 ≤89.0 ---
%Gmm at Nmax ≤98.0 ≤98.0 ≤98.0 ≤98.0 ≤98.0 ≤98.0 ---
Dust:Binder* 0.6-1.2 0.6-1.2 0.6-1.2 0.6-1.2 0.6-1.2 0.6-1.2 1.2-2.0
VFB 70-80 65-78 65-75 65-75 65-75 65-75 70-80
*0.6 – 1.6 for gradations passing below caution zone.
VFB for 9.5mm mixes is 73-76%
VFB lower limit for 25mm and 37.5mm mixes is 67%
74
Design Enhancement
Intersections: “Bump up” Mix & Binder
MAINLINE MIXTURE INTERSECTION MIXTURE BINDER
E-0.3 (PG 58-28)
E-1 (PG 58-28)
E-3 (PG 58-28)
E-10 (PG 64-28)
E-30 (PG 64-28)
E-3
E-3
E-10
E-30
E-30X or SMA
PG 64-28
PG 64-28
PG 64-28
PG 70-28
PG 70-28
Limit the number of different binders to ~2 for a project
Identify intersection limits
STSP 460.030
75
WisDOT Project Manager Perspective
• Project HMA Technician
– HTCP Certified
• Project Manager
– Documentation
• Product Certifications
• JMF Approval
– Diary Notes
• Observe sampling at required frequency
76
Questions?
Comments?
Experiences?
77