Embed Size (px)
Citation preview

GEOTECHNICAL REPORT SR 160 (BLUE DIAMOND ROAD)
U.P. RAILROAD GRADE SEPARATION CLARK COUNTY
EA 72495 FEBRUARY 2004
MATERIALS DIVISION

STATE OF NEVADA
DEPARTMENT OF TRANSPORTATION
MATERIALS DIVISION
GEOTECHNICAL SECTION
GEOTECHNICAL REPORT
SR 160 (BLUE DIAMOND ROAD)
U. P. RAILROAD GRADE SEPARATION EA 72495
February 2004
CLARK COUNTY, NEVADA
Prepared by: ______________________________
Dana Boomhower, P.E. Senior Materials Engineer - Geotechnical
Reviewed by: ______________________________
Jeff Palmer, Ph.D., P.E. Principal Geotechnical Engineer
Approved by: ______________________________
Dean Weitzel, P.E. Chief Materials Engineer

TABLE OF CONTENTS
INTRODUCTION....................................................................................................................... 1 PROJECT DESCRIPTION ....................................................................................................... 2 GEOLOGIC CONDITIONS and SEISMICITY ..................................................................... 3 FIELD INVESTIGATION......................................................................................................... 4 LABORATORY ANALYSIS..................................................................................................... 4 DISCUSSION .............................................................................................................................. 5 RECOMMENDATIONS............................................................................................................ 6 REFERENCES.......................................................................................................................... 10
APPENDICES APPENDIX A..................................................................................................................Site Plan ......................................................................................... Borehole Location Sheet APPENDIX B ......................................................................................................Boring Log Key .............................................................................................................Boring Logs APPENDIX C .....................................Soil Particle Size Distribution Sheets (Gradation Curves) ...................................................................................Test Result Summary Sheets

INTRODUCTION General
This report has been prepared for the proposed grade separation located at SR 160 (Blue
Diamond Road), and the Union Pacific Railroad crossing in Clark County, Nevada. SR 160 runs
approximately east-west at this location, and is currently one lane wide in each direction. The
existing highway crosses the railroad tracks at grade. The proposed plan calls for construction of
a grade separation, consisting of three additional lanes in each direction, crossing over the tracks.
For a more detailed description, see the contract plans for this project. A site plan for the project
is presented in Appendix A.
Photo 1. SR 160 (Blue Diamond Road): Looking West toward UPRR at-grade Crossing Purpose and Scope
The purpose of this report is to present information regarding the subsurface soil conditions at
the proposed project site. This report provides geotechnical design recommendations for the
grade separation involved in this project, including, but not limited to retaining walls and new
1
bridge structures. The scope of this report consists primarily of geotechnical investigation,
analysis, and recommendations for both design and construction. The investigation included
gathering data from past field explorations and reports, in addition to information obtained from
field reconnaissance, subsurface explorations, soil sampling, and analysis of field and laboratory
testing data. This report includes boring logs and summaries of test results from the field
investigations and the laboratory testing regimen. These may be found in appendices B and C,
respectively.
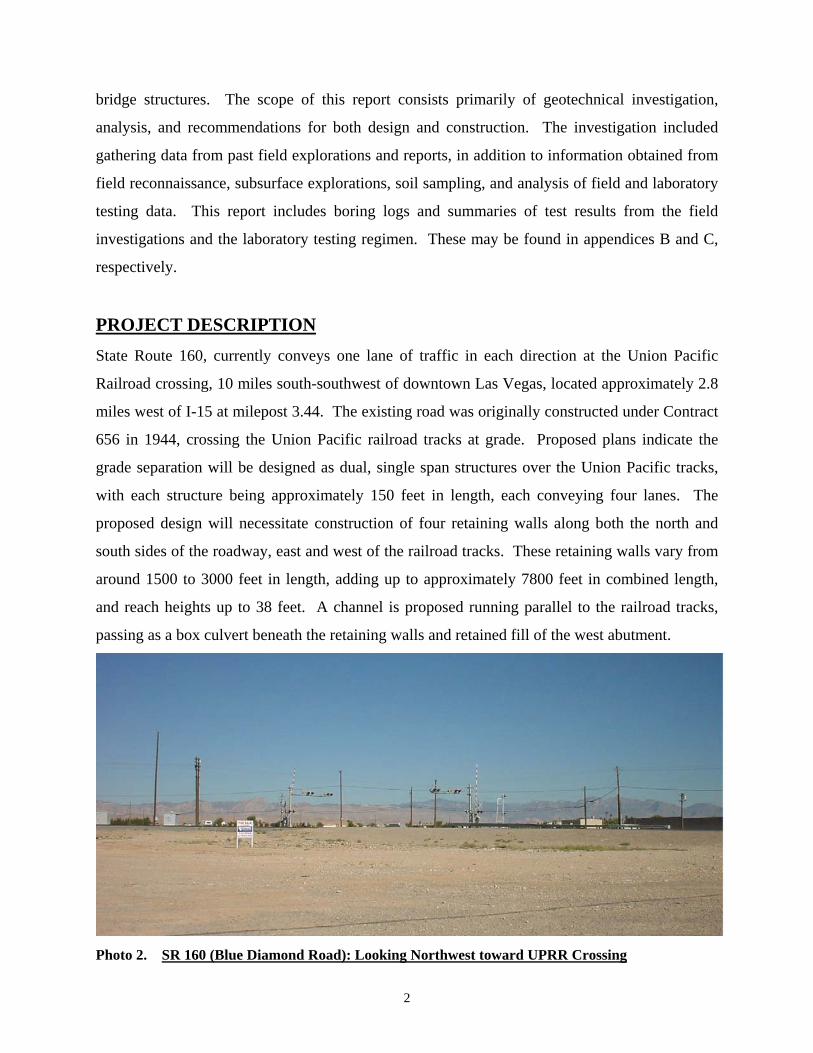
PROJECT DESCRIPTION State Route 160, currently conveys one lane of traffic in each direction at the Union Pacific
Railroad crossing, 10 miles south-southwest of downtown Las Vegas, located approximately 2.8
miles west of I-15 at milepost 3.44. The existing road was originally constructed under Contract
656 in 1944, crossing the Union Pacific railroad tracks at grade. Proposed plans indicate the
grade separation will be designed as dual, single span structures over the Union Pacific tracks,
with each structure being approximately 150 feet in length, each conveying four lanes. The
proposed design will necessitate construction of four retaining walls along both the north and
south sides of the roadway, east and west of the railroad tracks. These retaining walls vary from
around 1500 to 3000 feet in length, adding up to approximately 7800 feet in combined length,
and reach heights up to 38 feet. A channel is proposed running parallel to the railroad tracks,
passing as a box culvert beneath the retaining walls and retained fill of the west abutment.
Photo 2. SR 160 (Blue Diamond Road): Looking Northwest toward UPRR Crossing
2

GEOLOGIC CONDITIONS and SEISMICITY
The site is founded primarily in older alluvium of the Blue Diamond and Red Rock fans (Qoa).1
These deposits are pink to brown fine pebble to small cobble gravel, with subordinate pebble-
bearing sand. It is moderately to well consolidated to locally cemented due to petrocalcic
carbonate deposits (caliche). Clasts are predominately limestone and dolomite with subordinate
quartzite. This deposit has well-developed desert pavement, with surface clasts having slight to
moderate desert varnish. The site is secondarily founded in intermittently active alluvium (Qai),
and alluvium of active washes (Qa)1. These deposits are pink to pale-brown fine sand to pebble
to cobble gravel, and are unconsolidated to moderately consolidated to locally cemented due to
petrocalcic cementation. Clasts are predominately volcanic. Sand size sediment is mainly
limestone and dolomite with subordinate quartz and feldspar; detrital gypsum occurs locally, and
is an important component in these deposits. Large deposits of gypsum occur to the west-
northwest of the project site, and are mined commercially 8 miles away.2 No gypsum deposits
were found during the investigation. This area lies at an elevation of approximately 2475 feet3,
and has not subsided to any measurable extent between 1963 and 19874. The site slopes gently
downward <2% to the east,5 and groundwater exists at a depth of approximately 350 feet.6
There are numerous tectonic features surrounding the project site; among them are the Keystone
Thrust located 13 miles to the west, and the Las Vegas Valley Shear Zone which lies about 23
miles to the northeast. Nearby faults include; the Sloan Fault 4 miles to the south, the
Cottonwood Fault 13 miles to the west-southwest, and the Frenchman Mountain Fault 15 miles
to the northeast of the site.7 Of these faults, the Frenchman Mountain Fault is probably the most
capable of producing a large (magnitude 6 or 7) earthquake8. The soil type for this project is
Type II, as defined by AASHTO in Division IA – Seismic Design. The recommended
acceleration coefficient (A) is 0.15g.
3

FIELD INVESTIGATION The Nevada Department of Transportation (NDOT) Geotechnical Section conducted a
subsurface investigation at the proposed project site in May and June of 2000. Subsurface soil
conditions were explored by drilling seven boreholes (BD-1 through BD-7) to a maximum depth
of 96.2 feet. The approximate locations of the boreholes are shown on the Borehole Locations
sheet in Appendix A. Surface elevations were obtained for the borehole locations by surveying
from known elevation points. Drilling was accomplished utilizing a Mobile B-80 drill rig
equipped for soil sampling, using either bentonite drilling slurry for wet drilling, or eight inch
(8") hollow stem auger. The on-site soil conditions were not suitable for using any sampler other
than a Standard Penetration Test (SPT) sampler; therefore, all samples recovered were disturbed.
Soil samples and standard penetration resistance values (N-Values) were obtained utilizing the
SPT procedure as set forth in ASTM test number T 206. The uncorrected blow counts are shown
on the boring logs in Appendix B. In addition, bulk samples were taken from auger cuttings. All
soil samples were classified, both visually and using laboratory data, using the Unified Soil
Classification System (USCS) described in ASTM test number D2487.
LABORATORY ANALYSIS
Laboratory analyses were performed on the samples collected from the seven boreholes. The
testing program consisted of sieve analyses, Atterberg limits, and chemical analyses. Because of
the high densities of the granular soils on-site, and the lack of any undisturbed or relatively
undisturbed samples; no direct shear, triaxial shear, or consolidation tests were performed. The
results of the testing program show that the soils consist primarily of very dense silty and clayey
sands and gravels. Plasticity Indexes (PI) ranged from 3 to 11, with liquid limits between 21 and
31, indicating a variety of soil conditions. Further information is presented in the summaries of
test results in Appendix C.
4

DISCUSSION
Borings from the field investigation identified the soils to be primarily very dense sandy gravels
and gravelly sands, with occasional layers of silty and/or clayey sands and gravels with cobbles;
no gypsum was encountered. Some caliche was encountered during line sampling for the
proposed channel. No clearly defined subsurface stratification is apparent from this set of
borings; subsurface soil conditions vary in each borehole. All drive samples taken during the
field exploration showed the soils to be very dense, with field blow counts from 80 blows per
foot, to refusal (50 blows - no progress). The southern side of the alignment showed the soils to
be slightly more sandy than the northern side, which consisted of primarily gravel. Most of the
sands were found in the top 15 feet. These soils are best suited for spread footings; deep
foundations such as driven piles or drilled shafts are not recommended for this site due to high
soil densities and presence of cobbles.
Information found in the Soil Parameter tables is calculated using the following methods. The
at-rest earth pressure coefficient (K0) is derived from the empirical formula: K0 = 1- sin ϕ. he
static active earth pressure coefficient (Ka) is calculated using Coulombs analysis method. The
static passive earth pressure coefficient (Kp) is calculated using the Log Spiral analysis method.
The dynamic active earth pressure coefficient (Kae) is calculated using the Mononobe-Okabe
analysis method. The dynamic passive earth pressure coefficient (Kpe) is calculated using the
Mononobe-Okabe analysis method. The structure - soil interface angle (δ) is taken as 0.6 ϕ.
The Acceleration Coefficient (A), and Soil Profile Type are all obtained from AASHTO
Standard Specifications for Highway Bridges, Division 1-A, Section 3. The horizontal
Acceleration Coefficients (Kh) are obtained from AASHTO Standard Specifications for Highway
Bridges, Division 1-A, Section 6. The vertical Acceleration Coefficient (Kv) is assumed to be
zero.
5

RECOMMENDATIONS
Excavations and Earthwork
All excavation shall be performed in accordance with the NDOT Standard Specifications for
Road and Bridge Construction (SSRBC). The contractor shall be responsible for all necessary
shoring for any excavation. One of the primary geotechnical concerns for the construction of
this project is the presence of very dense gravel deposits with cobbles, throughout the entire
project area. All permanent slopes should be constructed to lie at a maximum of 2:1
(Horiz:Vert) slope. Estimates for construction excavation should be made based on using
temporary 1:1 (Horiz:Vert) slopes.
Scarify all subgrade areas to a depth of six inches (6”) and moisture condition to two to four
percent (2-4%) above optimum moisture. Compact all scarified areas to the specified relative
compaction.
Abutments
Spread footings are well suited to the dense, granular soils that exist throughout the project site,
and are recommended to support the bridge abutments. The native soil provides an allowable
bearing capacity (F.S.=3.0) for spread footings of eight kips per square foot (8 ksf), while
embankment fills will provide an allowable bearing capacity (F.S.=3.0) of four kips per square
foot (4 ksf). The bottoms of all spread footings founded in native soil should be a minimum of
four feet wide, and at least four feet below the existing grade. Applied loads in the range of the
allowable capacities given above should result in estimated total settlement of less than one inch
(1 in.), and differential settlement of less than one half inch (½ in.) in native soils. This
settlement should occur during construction, due to the granular nature of the native soils. The
coefficient of friction for sliding should be 0.40. The following soil parameters and earth
pressure coefficients in Table 1 may be used to design the abutment walls.
6

Abutment/Wall
Allowed to Displace
Abutment/Wall Restrained
φ3 = soil friction angle 34º 34º
γ3 = effective soil unit weight 120 pcf 120 pcf
δ3 = structure - soil interface angle 20.4º 20.4º
Kh = Horizontal Acceleration Coefficient 0.075 0.075
Kv = Vertical Acceleration Coefficient 0 0
K0 = At-Rest Earth Pressure Coefficient 0.441 0.441 Ka = Active Earth Pressure Coefficient (Coulomb) 0.255 0.255
Kp = Passive Earth Pressure Coefficient (Log Spiral) 7.11 7.11
Kae = Dynamic Active Earth Pressure Coefficient (Mononobe-Okabe) 0.315 0.445
Table 1. SOIL PARAMETERS for GRANULAR BACKFILL
Kpe = Dynamic Passive Earth Pressure Coefficient (Mononobe-Okabe) 7.46 6.44
M.S.E. Walls
Mechanically Stabilized Earth (MSE) Walls are proposed to be located in each quadrant formed
by State Route 160 (Blue Diamond Road), and the Union Pacific Railroad. Allowable soil
bearing capacities for the retaining walls are calculated based on the FHWA Soils and
Foundations Workshop Manual9. The allowable bearing capacity of the native soil is eight kips
per square foot (8 ksf). Using a factor of safety of 2.0, the ultimate bearing capacity of the native
soil is 16 kips per square foot (16 ksf). The coefficient of friction is 0.6. The strap lengths for
the MSE walls should be 85% of the wall height, and not less than eight feet. The top of the
leveling pads should be placed a minimum of three feet (3’) below finish grade. The external
(global) stability is the responsibility of NDOT and has been checked using procedures from the
FHWA Mechanically Stabilized Earth Wall Design and Construction Manual10. The internal
stability is the responsibility of the MSE wall supplier, and should be checked in accordance
with AASHTO Section 5.8.4. Soil parameters and earth pressure coefficients used to design
MSE walls may be found in Table 2.
7

Cantilever Walls
The footing for concrete cast-in-place walls should be a minimum of two feet (2’) wide, with the
top of footing placed a minimum of two feet (2’) below finish grade. Walls should be designed
for a maximum bearing pressure of six kips per square foot (6 ksf) for native soil, and four kips
per square foot (4 ksf) in fill. A coefficient of friction of 0.40 should be used for determining
resistance to sliding. Applied loads in the range of the allowable capacities given above should
result in estimated total settlement of less than one inch (1 in.), and differential settlement of less
than one half inch (½ in.) in native soils. This settlement should occur during construction, due
to the granular nature of the native soils. Settlement due to embankment loading should be
negligible. Soil parameters and earth pressure coefficients used to design cantilever walls may
be found in Table 1.
Borrow and Retained Earth MSE Backfill
φ2 = soil friction angle 32º 34º
γ2 = effective soil unit weight 120 pcf 120 pcf
δ2 = structure - soil interface angle 19.2º 20.4º
Kh = Horizontal Acceleration Coefficient 0.075 0.075
Kv = Vertical Acceleration Coefficient 0 0
K0 = At-Rest Earth Pressure Coefficient 0.470 0.441 Ka = Active Earth Pressure Coefficient (Coulomb) 0.276 0.255
Kp = Passive Earth Pressure Coefficient (Log Spiral) 6.14 7.11
Kae = Dynamic Active Earth Pressure Coefficient (Mononobe-Okabe) 0.354 0.315
Table 2. SOIL PARAMETERS for MSE Walls
Kpe = Dynamic Passive Earth Pressure Coefficient (Mononobe-Okabe) 6.21 7.46
CONCRETE CHANNELS
A rectangular concrete channel is proposed for this project. This channel runs parallel to the
railroad alignment. The allowable soil bearing capacity for the channel wall foundations is 4 ksf.
Estimated quantities for excavation should be made on the basis of using temporary 1:1
8

(Vert:Horiz) slopes. Soil parameters and earth pressure coefficients used to design concrete
channels may be found in Table 3.
φ1 = soil friction angle 35º
γ1 = effective soil unit weight 130 pcf δ1 = structure - soil interface angle 21º Kh = Horizontal Acceleration Coefficient 0.075
Kv = Vertical Acceleration Coefficient 0 K0 = At-Rest Earth Pressure Coefficient 0.426 Ka = Active Earth Pressure Coefficient
(Coulomb) 0.245
Kp = Passive Earth Pressure Coefficient (Log Spiral) 8.27
Kae = Dynamic Active Earth Pressure Coefficient (Mononobe-Okabe) 0.289
Kpe = Dynamic Passive Earth Pressure Coefficient (Mononobe-Okabe) 8.23
Table 3. SOIL PARAMETERS for NATIVE SOIL
9

REFERENCES 1. Las Vegas SW Quadrangle Geologic Map; Nevada Bureau of Mines and Geology, 1985, Map 3Bg.
2. Geology and Mineral Deposits of Clark County, Nevada, Bulletin 62, Nevada Bureau of
Mines and Geology, 1965. 3. Las Vegas SW Folio Tinted Relief Map; Nevada Bureau of Mines and Geology, 1974. 4. Nevada Bureau of Mines and Geology NBMG Open File Report 93-4, Plate 4,
Subsidence in Las Vegas Valley, 1980-91, 1993. 5. Las Vegas SW Folio Slope Map; Nevada Bureau of Mines and Geology, 1975. 6. Las Vegas SW Quadrangle Ground Water Map; Nevada Bureau of Mines and Geology,
1985, Map 3Bf. 7. Tectonic Map of Clark County, Nevada; Nevada Bureau of Mines, Bulletin 62, 1965;
Plate 5. 8. dePolo, Craig; from Las Vegas Review Journal; Sunday, April 11, 1999. 9. Soils and Foundations Workshop Manual, Figure 7-2; FHWA HI-88-009, National
Highway Institute, revised July 1993. 10. Mechanically Stabilized Earth Walls and Reinforced Soil Slopes Design and
Construction Manual, FHWA-SA-96-071, reprinted September 1998. 11. AASHTO Standard Specifications For Highway Bridges, sixteenth edition, 1996; with
interims through 1999. 12. Standard Specifications for Road and Bridge Construction, State of Nevada Department
of Transportation, 2001.
10

APPENDIX A


APPENDIX B

KEY TO BORING LOGS
PARTICLE SIZE LIMITS CLAY SILT SAND GRAVEL COBBLES BOULDERS
FINE MEDIUM COARSE FINE COARSE
.002 mm #200 #40 #10 #4 3/4 inch 3 inch 12 inch
USCS GROUP TYPICAL SOIL DESCRIPTION
GW Well graded gravels, gravel-sand mixtures, little or no fines GP Poorly graded gravels, gravel-sand mixtures, little or no fines GM Silty gravels, poorly graded gravel-sand-silt mixtures GC Clayey gravels, poorly graded gravel-sand-clay mixtures SW Well graded sands, gravelly sands, little or no fines SP Poorly graded sands, gravelly sands, little or no fines SM Silty sands, poorly graded sand-silt mixtures SC Clayey sands, poorly graded sand-clay mixtures ML Inorganic silts and very fine sands, rock flour, silty or clayey fine sands with slight plasticity CL Inorganic clays of low to medium plasticity, gravelly clays, sandy clays, silty clays, lean clays OL Organic silts and organic silt-clays of low plasticity MH Inorganic silts, micaceous or diatomaceous fine sandy or silty soils, elastic silts CH Inorganic clays of high plasticity, fat clays OH Organic clays of medium to high plasticity CS Claystone/Siltstone PT Peat and other highly organic soils MOISTURE CONDITION CRITERIA SOIL CEMENTATION CRITERIADescription Criteria Description CriteriaDry Absence of moisture, dusty, Weak Crumbles or breaks with handling or little dry to touch. finger pressure. Moist Damp, no visible free water. Moderate Crumbles or breaks with considerable Wet Visible free water, usually below finger pressure. groundwater table. Strong Won’t break or crumble w/finger pressure. Groundwater Elevation Symbols
STANDARD PENETRATION CLASSIFICATION* Blow counts on Calif. Modified
GRANULAR SOIL CLAYEY SOIL Sampler (NCMS) can be converted BLOWS/FT DENSITY BLOWS/FT CONSISTENCY to NSPT by: 0 - 4 VERY LOOSE 0 – 1 VERY SOFT (NCMS)(0.62) = NSPT 5 - 10 LOOSE 2 - 4 SOFT 11 - 30 MEDIUM DENSE 5 - 8 MEDIUM STIFF Blow counts from Automatic or 31 - 50 DENSE 9 - 15 STIFF Safety Hammer can be converted OVER 50 VERY DENSE 16 - 30 VERY STIFF to Standard SPT N60 by:
*Standard Penetration Test (N) 140 lb hammer 31 - 60 HARD (NAUTOMATIC)(1.30) =N60 30 inch free-fall on 2 inch O.D. x 1.4 inch I.D. sampler OVER 60 VERY HARD (NSAFETY)(1.17) =N60
TEST ABBREVIATIONS SAMPLER NOTATIONCD CONSOLIDATED DRAINED O ORGANIC CONTENT CMS CALIF. MODIFIED SAMPLERCH CHEMICAL (CORROSIVENESS) OC CONSOLIDATION CPT CONE PENETRATION
CM COMPACTION PI PLASTICITY INDEX CS CONTINUOUS SAMPLERCU CONSOLIDATED UNDRAINED RQD ROCK QUALITY DESIGNATION CSS CALIFORNIA SPLIT SPOON D DISPERSIVE SOILS RV R-VALUE P PUSHED (NOT DRIVEN) DS DIRECT SHEAR S SIEVE ANALYSIS PB PITCHER BARREL
E EXPANSIVE SOIL SL SHRINKAGE LIMIT RC ROCK COREG SPECIFIC GRAVITY U UNCONFINED COMPRESSION SH SHELBY TUBE
H HYDROMETER UU UNCONSOLIDATED UNDRAINED SPT STANDARD PENETRATION TEST HC HYDRO-COLLAPSE UW UNIT WEIGHT TP TEST PIT K PERMEABILITY W MOISTURE CONTENT
- I.D.= 2.421 inch SOIL COLOR DESIGNATIONS ARE FROM THE MUNSELL SOIL COLOR CHART. - I.D.=3.228 inch with tube; 3.50 inch w/o tube
EXAMPLE: (7.5 YR 5/3) BROWN - NXB I.D.= 1.875 inch - I.D.= 2.875 inch
LAST MODIFIED: October 11, 2006
50/3"
50/3.5"
WELL-GRADED GRAVEL with SILTY CLAY andSAND yellowish red (5 YR 5/6), very dense
WELL-GRADED GRAVEL with SILTY CLAY andSAND yellowish red (5 YR 5/6), very dense, withsome cemented fines
WELL-GRADED GRAVEL with SILTY CLAY andSAND light brown to pink (7.5 YR 6/4 to 7.5 YR7/4), very dense
SANDY GRAVEL with COBBLES dry, light brown(7.5 YR 6/4)
39
50/4"
(A) Refusal; Norecovery.
50/2.5"
(B) Very harddrilling to 6' @600 psi.
50/4"
30
50/4"
20/0.25"
50/4"
50/2.5"
50/2.5"
50/3"
50/2.5"
50/3.5"
SPT
SPT
SPT
SPT
SPT
SPT
SPT
SPT
GWGC
GWGC
50/4"
30.00
19.00
6.00
3.00
(H) No recovery.
End of Day 1drilling @ 23.2'
(G) Cuttingscontain rockchips.
(F) No recovery.
(E) Very harddrilling to 13'.
GWGC
50/4"
2.00
6.00
8.00
18.21
20/0.25"
H
G
F
E
D
C
B
A
3.00
23.21
81
13.25
8.33
7.29
3.33
2.02
28.00
23.00
18.00
13.00
28.33
ELEV. ft
0
SR 160 at UPRR Crossing
DRILLINGMETHOD
BD-1
DATE
DEPTH ft
SAFETY
SAMPLETYPE
72495
6 inchIncrements
GROUNDWATER LEVEL
5/2/00
BACKFILLED
SR 160 - PAHRUMP VALLEY ROAD
MATERIAL DESCRIPTION
SHEET 1 OF 3
6/15/00
STATIONOFFSETENGINEEREQUIPMENTOPERATOR
NO.
5/3/00
BLOW COUNT
"PE"183+4870.5' RightBOOMHOWERMOBILE B-80ALTAMIRANO
HAMMER DROP SYSTEM
GROUND ELEV.
E.A. #
BORING
LOCATION
JOB DESCRIPTION
END DATE
START DATE
PercentRecov'd
LAB TESTS REMARKS
DATE
ELEV.(ft)
DEPTH(ft)
Last1 foot
USCSGroup
Yeswet w/bentonite slurry
EXPLORATION LOG
2471.77 (ft)
5
10
15
20
25
2466.8
2461.8
2456.8
2451.8
2446.8
0
20
0
33
0
NV
_DO
T B
LUE
DM
ND
.GP
J N
V_D
OT.
GD
T 1
1/15
/06
75
5
10
15
20
25

(M) No recovery.
SPT
SPT
GPGC
SCSM
100/3.5"
SPT
36.00
SPT
More clay incuttings @ 46'.
(K) No recovery.
Very hard drilling@ 30'.
POORLY-GRADED GRAVEL with CLAY andSAND light reddish brown (5 YR 6/4), very dense
SILTY CLAYEY SAND with GRAVEL light reddishbrown to yellowish red (5 YR 6/4 to 5/6), verydense
60.00
SPT
50/2.5"
35
40
45
50
55
2436.8
2431.8
2426.8
2421.8
2416.8
0
0
0
74
50
58.00
48.00
43.00
38.00
33.00
82
43.17
M
50/2"
48
75/4"
50/2"
50/2.5"
50/2"
33.33 75/4"
39.29
L
K
J
I
58.17
48.21
50/2"
100/3.5"
DATE
wet w/bentonite slurry
EXPLORATION LOG
GROUNDWATER LEVEL72495
PercentRecov'd
SR 160 at UPRR Crossing
5/2/00
BD-1
Last1 foot
DEPTH ft
SAFETY
SAMPLETYPE
5/3/00
6 inchIncrements
DRILLINGMETHOD2471.77 (ft)
"PE"183+4870.5' RightBOOMHOWERMOBILE B-80ALTAMIRANO
HAMMER DROP SYSTEM
GROUND ELEV.
E.A. #
BORING
LOCATION
JOB DESCRIPTION
Yes
START DATE
USCSGroupLAB TESTS
BLOW COUNTREMARKS
DATE
ELEV.(ft)
DEPTH(ft)
BACKFILLED
END DATE
ELEV. ft
35
40
45
50
55
NV
_DO
T B
LUE
DM
ND
.GP
J N
V_D
OT.
GD
T 1
1/15
/06
SR 160 - PAHRUMP VALLEY ROAD
MATERIAL DESCRIPTION
SHEET 2 OF 3
6/15/00
STATIONOFFSETENGINEEREQUIPMENTOPERATOR
NO.

0
74.00
65
70
75
80
85
2406.8
2401.8
2396.8
2391.8
2386.8
0
SPT
SPT
SPT
SCSM
GPGC
50
65
70
75
80
85
(O) No recovery.
88.2088.17
78.17
68.13
88.00
O
68.00
P
78.00
POORLY-GRADED GRAVEL with CLAY andSAND pinkish gray (5 YR 7/2), very dense
Slight colorchange to moreyellowish @ 75'.
More clay incuttings @ 74'.
(N) No recovery.N
SILTY CLAYEY SAND with GRAVEL yellowishred (5 YR 5/6), very dense
50/2"
50/2"
50/1.5"
50/2"
50/2"
50/1.5"
B.O.H.
PercentRecov'd
SAMPLEUSCSGroup
Yeswet w/bentonite slurry
EXPLORATION LOG
DEPTH(ft)
72495
ELEV.(ft)
SR 160 at UPRR Crossing
DRILLINGMETHOD
BD-1
DATE
DEPTH ftGROUNDWATER LEVEL
END DATE "PE"183+4870.5' RightBOOMHOWERMOBILE B-80ALTAMIRANO
HAMMER DROP SYSTEM
GROUND ELEV.
E.A. #
BORING
Last1 foot
JOB DESCRIPTION
TYPE
START DATE
2471.77 (ft)
LAB TESTSBLOW COUNT
REMARKS
DATE
LOCATION
SAFETY
SHEET 3 OF 35/3/00
6 inchIncrements
ELEV. ft
5/2/00
BACKFILLED
MATERIAL DESCRIPTION
NV
_DO
T B
LUE
DM
ND
.GP
J N
V_D
OT.
GD
T 1
1/15
/06
6/15/00
STATIONOFFSETENGINEEREQUIPMENTOPERATOR
NO.
SR 160 - PAHRUMP VALLEY ROAD

B.O.H.50/1.5"
2.00
(G) No recovery.
(E) No recovery.
(C) Refusal; Norecovery.
11.00
13.50POORLY-GRADED GRAVEL
SILTY CLAYEY GRAVEL with SAND dry, lightyellowish brown (10 YR 6/4), very dense
POORLY-GRADED GRAVEL with CLAY andSAND dry, light yellowish brown (10 YR 6/4)
SILTY GRAVEL with SAND dry, light yellowishbrown (10 YR 6/4), very dense
SANDY GRAVEL with COBBLES dry, light brown(7.5 YR 6/4)
50/1.5"
50/2"
BULK
0
100
0
100
0100
100
SPT
3.75
SPT 50/2"
SPTBULK
BULK
GP
GCGM
GPGC
GM
15.10
BULK
50/0"
4.00
5.00
10.17
50/0"
G
F
E
D
CB
A
2.00
13.50
8.00
5.015.00
3.50
15.00
12.00
10.00
7.00
15.13
TYPE
2471.7
2466.7
2461.7
2456.7
2451.7
72495
PercentRecov'd
SR 160 at UPRR Crossing
DRILLINGMETHOD
BD-2
DATE
DEPTH ft
EXPLORATION LOG
SAMPLE
8" H.S.A.
5/4/00
6 inchIncrements
ELEV. ft
5/4/00
BACKFILLED
SR 160 - PAHRUMP VALLEY ROAD
MATERIAL DESCRIPTION
SHEET 1 OF 1
SAFETY
LAB TESTS
"PE"185+8452.5' RightBOOMHOWERMOBILE B-80ALTAMIRANO
HAMMER DROP SYSTEM
GROUND ELEV.
E.A. #
BORING
LOCATION
JOB DESCRIPTION
END DATE
GROUNDWATER LEVEL
2476.74 (ft)
NO.BLOW COUNT
REMARKS
DATE
ELEV.(ft)
DEPTH(ft)
Last1 foot
USCSGroup
Yes
START DATE
5
10
15
20
25
5/4/00
NV
_DO
T B
LUE
DM
ND
.GP
J N
V_D
OT.
GD
T 1
1/15
/06
5
10
15
20
25
STATIONOFFSETENGINEEREQUIPMENTOPERATOR

SANDY GRAVEL with COBBLES dry, light brown(7.5 YR 6/4)
I
Gravel is finer @7.5'.
(F) Probableslough.
More gravel @ 7'.
B.O.H.
2.00SILTY SAND with GRAVEL dry, reddish brown (5YR 5/3), very dense
10.50
50/3"
50/1"
50/2"
50/3"
50/3"
50/1"
50/2"
POORLY-GRADED SAND with SILT andGRAVEL yellowish red (5 YR 5/6), very dense,with some cemented fines
SPT
100
100
0
100
100
100
100100
Gravel bed @13'.
BULKH
BULK
SPT
BULK
SPTBULK
SPSM
SM
15.20BULK
50/3"3.003.25
5.17
G
E
D
C
BA
15.25
13.00
2.00
8.00
5.00
3.253.00
15.00
11.00
8.00
6.00
5.00
8.08
TYPE
2466.8
2461.8
2456.8
2451.8
2446.8
72495
PercentRecov'd
SR 160 at UPRR Crossing
DRILLINGMETHOD
BD-3
DATE
DEPTH ft
EXPLORATION LOG
SAMPLE
8" H.S.A.
6/26/00
6 inchIncrements
ELEV. ft
6/26/00
BACKFILLED
SR 160 - PAHRUMP VALLEY ROAD
MATERIAL DESCRIPTION
SHEET 1 OF 1
SAFETY
LAB TESTS
"PE"182+9546.0 LeftBOOMHOWERMOBILE B-80MARSHALL
HAMMER DROP SYSTEM
GROUND ELEV.
E.A. #
BORING
LOCATION
JOB DESCRIPTION
END DATE
GROUNDWATER LEVEL
2471.83 (ft)
NO.BLOW COUNT
REMARKS
DATE
ELEV.(ft)
DEPTH(ft)
Last1 foot
USCSGroup
Yes
START DATE
5
10
15
20
25
6/26/00
NV
_DO
T B
LUE
DM
ND
.GP
J N
V_D
OT.
GD
T 1
1/15
/06
5
10
15
20
25
STATIONOFFSETENGINEEREQUIPMENTOPERATOR

Clay in cuttings@ 17'.
Very little fines incuttings 15' to16'.
Soft zone from9.5 'to 11'.
600 psi downpressure @ 8.3'.
Hard drilling @4'.
(A) Samplerringing/bouncingduring driving;Refusal.
6.00
POORLY-GRADED GRAVEL with CLAY andSAND light reddish brown (5 YR 6/4), very dense
CLAYEY GRAVEL with SAND damp, reddishbrown (5 YR 5/3), very dense
POORLY-GRADED GRAVEL with SAND damp,reddish brown (5 YR 5/3), very dense
SILTY CLAYEY SAND with GRAVEL light reddishbrown (5 YR 6/4), some cobbles, very dense
SANDY GRAVEL with COBBLES dry, light brown(7.5 YR 6/4)
80
50/3"
50/3.5"
SPT
2471.0
2466.0
2461.0
2456.0
2451.0
67
0
100
0
0
0
SPT
400 psi downpressure @ 22'.
SPT
3.00
SPT
SPT
GC
GP
SCSM
26.00
16.50
20/0"
SPT
50/3"13.00
8.00
3.00
23.00
28.00
C
80
50/3"
50/3.5"
50/3"
50/3"
20/0"
F
18.00D
50/3"B
A
28.50
23.25
18.29
13.25
8.25
3.01
E
TYPE
6/27/00
72495
PercentRecov'd
SR 160 at UPRR Crossing
DRILLINGMETHOD
BD-4
DATE
DEPTH ft
EXPLORATION LOG
SAMPLE
wet w/bentonite slurry
6/27/00
6 inchIncrements
ELEV. ft
6/27/00
BACKFILLED
SR 160 - PAHRUMP VALLEY ROAD
MATERIAL DESCRIPTION
5
10
15
20
25
SAFETY
LAB TESTS
"PE"186+3962.0 LeftBOOMHOWERMOBILE B-80MARSHALL
HAMMER DROP SYSTEM
GROUND ELEV.
E.A. #
BORING
LOCATION
JOB DESCRIPTION
END DATE
GROUNDWATER LEVEL
2475.95 (ft)
STATIONOFFSETENGINEEREQUIPMENTOPERATOR
BLOW COUNTREMARKS
DATE
ELEV.(ft)
DEPTH(ft)
Last1 foot
USCSGroup
Yes
START DATE SHEET 1 OF 4
5
10
15
20
25
NV
_DO
T B
LUE
DM
ND
.GP
J N
V_D
OT.
GD
T 1
1/15
/06
NO.

0
50
0
2441.0
2436.0
2431.0
2426.0
2421.0
35
40
45
50
55
SPT
SPT
35
40
45
50
55
I
38.00
48.00
58.00
38.25
48.25
58.25 SPT
H
50/3"
50/3"
50/3"
50/3"
50/3"
50/3"
POORLY-GRADED GRAVEL with SILTand SANDlight reddish brown (5 YR 6/4), very dense
Clay in cuttingsfrom 30' to 33'.
Clay in cuttingsfrom 51' to 52'.
42.00
GPGC
GPGM
G
DATE
DATE
BD-4
DRILLINGMETHOD
SR 160 at UPRR Crossing
PercentRecov'd
72495 GROUNDWATER LEVEL
EXPLORATION LOG
wet w/bentonite slurryYes
USCSGroupLast
1 footELEV.
(ft)
SAMPLEREMARKS
BLOW COUNTLAB TESTS
2475.95 (ft)
START DATE
END DATE
JOB DESCRIPTION
LOCATION
BORING
E.A. #
GROUND ELEV.
HAMMER DROP SYSTEM
"PE"186+3962.0 LeftBOOMHOWERMOBILE B-80MARSHALL
DEPTH(ft)
NV
_DO
T B
LUE
DM
ND
.GP
J N
V_D
OT.
GD
T 1
1/15
/06
DEPTH ft
SR 160 - PAHRUMP VALLEY ROAD
TYPE
6/27/00
6 inchIncrements
ELEV. ft
BACKFILLED
MATERIAL DESCRIPTION
SHEET 2 OF 4
6/27/00
STATIONOFFSETENGINEEREQUIPMENTOPERATOR
NO.
SAFETY
6/27/00

0
80
2411.0
2406.0
2401.0
2396.0
2391.0
65
70
75
80
85
SPT
SPT
65
70
75
80
85
L
68.00
78.00
88.00
68.25
78.17
88.21
0
K
50/3"
50/2"
50/2.5"
50/3"
50/2"
50/2.5"
POORLY-GRADED GRAVEL with SILTand SANDlight reddish brown (5 YR 6/4), very dense
Hard drilling. 650psi downpressure from 72'to 74'.
Hard drilling from81' to 91'.
70.00
GPGM
SPTJ
DATE
BD-4
DRILLINGMETHOD
SR 160 at UPRR Crossing
PercentRecov'd
72495 GROUNDWATER LEVEL
EXPLORATION LOG
wet w/bentonite slurryYes
USCSGroupLast
1 foot
DEPTH ft
ELEV.(ft)
SAFETY
REMARKSBLOW COUNT
LAB TESTS
2475.95 (ft)
START DATE
END DATE
JOB DESCRIPTION
LOCATION
BORING
E.A. #
GROUND ELEV.
HAMMER DROP SYSTEM
"PE"186+3962.0 LeftBOOMHOWERMOBILE B-80MARSHALL
DEPTH(ft)
DATE
NV
_DO
T B
LUE
DM
ND
.GP
J N
V_D
OT.
GD
T 1
1/15
/06
NO.
STATIONOFFSETENGINEEREQUIPMENTOPERATOR
6/27/00
SHEET 3 OF 4
MATERIAL DESCRIPTION
SR 160 - PAHRUMP VALLEY ROAD
BACKFILLED
6/27/00
ELEV. ft
6 inchIncrements
6/27/00
TYPESAMPLE

95
100
105
110
115
096.0096.17 M 50/2"50/2"
B.O.H.
Minor clay lens@ 93'.
SPT
2381.0
2376.0
2371.0
2366.0
2361.0
95
100
105
110
115
96.20
LAB TESTS
GROUNDWATER LEVEL
EXPLORATION LOG
wet w/bentonite slurryYes
USCSGroupLast
1 footDEPTH
(ft)ELEV.
(ft)
DATE
PercentRecov'd
BLOW COUNT
SR 160 at UPRR Crossing
2475.95 (ft)
START DATE
END DATE
JOB DESCRIPTION
LOCATION
BORING
E.A. #
GROUND ELEV.
HAMMER DROP SYSTEM
"PE"186+3962.0 LeftBOOMHOWERMOBILE B-80MARSHALL
REMARKS
6/27/00
NO.
STATIONOFFSETENGINEEREQUIPMENTOPERATOR
6/27/00
SHEET 4 OF 4
MATERIAL DESCRIPTION
72495
BACKFILLED
NV
_DO
T B
LUE
DM
ND
.GP
J N
V_D
OT.
GD
T 1
1/15
/06
ELEV. ft
6 inchIncrements
6/27/00
TYPESAMPLE
SAFETY
DEPTH ft
DATE
BD-4
DRILLINGMETHOD
SR 160 - PAHRUMP VALLEY ROAD

50/0"
G
B.O.H.
POORLY-GRADED SAND with SILTY CLAY andGRAVEL reddish brown (5 YR 5/3), very dense
SILTY SAND with GRAVEL dry, light reddishbrown (5 YR 6/4), very dense
SILTY CLAYEY SAND with GRAVEL dry, withcobbles, reddish brown (5 YR 5/3), very dense
SANDY GRAVEL with COBBLES dry, light brown(7.5 YR 6/4)
50/1.5"
50/1.5"
50/1"
50/1.5"
50/1.5"
50/1.5"
50/1"
50/1"
50/0"
50/1.5"
I
50/1"SM
100
SPT
SPT
SPT
BULK
SPT
SPT
BULK
SPT
SPSC
F
SCSM
15.10
14.00
7.00
2.00
(E) Probableslough.
Very hard drilling@ 6'.
(D) Refusal; Norecovery.
(B) Probableslough.
BULK
H
1.00
3.00
5.00
E
D
C
B
A
15.12
12.12
10.0810.00
5.01 0
3.123.00
15.00
12.00
10.00
8.088.00
5.00
3.12
8.08
ELEV. ft
100
SR 160 at UPRR Crossing
DRILLINGMETHOD
BD-5
DATE
DEPTH ft
SAFETY
SAMPLETYPE
72495
6 inchIncrements
GROUNDWATER LEVEL
6/28/00
BACKFILLED
SR 160 - PAHRUMP VALLEY ROAD
MATERIAL DESCRIPTION
SHEET 1 OF 1
6/28/00
STATIONOFFSETENGINEEREQUIPMENTOPERATOR
NO.
6/28/00
BLOW COUNT
"PE"190+6349.0 LeftBOOMHOWERMOBILE B-80MARSHALL
HAMMER DROP SYSTEM
GROUND ELEV.
E.A. #
BORING
LOCATION
JOB DESCRIPTION
END DATE
START DATE
PercentRecov'd
LAB TESTS REMARKS
DATE
ELEV.(ft)
DEPTH(ft)
Last1 foot
USCSGroup
Yes8" H.S.A.
EXPLORATION LOG
2481.25 (ft)
5
10
15
20
25
2476.3
2471.3
2466.3
2461.3
2456.3
100
0
0
100
100
NV
_DO
T B
LUE
DM
ND
.GP
J N
V_D
OT.
GD
T 1
1/15
/06
100
5
10
15
20
25

50/1"
50/1"
B.O.H.
WELL-GRADED SAND with SILT and GRAVELdry, light reddish brown (5 YR 6/3), very dense
SILTY SAND with GRAVEL dry, light reddishbrown (5 YR 6/4), very dense
SILTY CLAYEY SAND with GRAVEL dry, withcobbles, reddish brown (5 YR 5/3), very dense
SANDY GRAVEL with COBBLES dry, light brown(7.5 YR 6/4)
50/2"
Gravel layer @11'.
50/2"
50/1"
50/4"
60
50/2"
50/1"
50/2"
50/1"
100
50/1"
SPT
0
100
100
100
SPT
SPT
BULK
SPT
H
BULK
SPT
SWSM
SM
SCSM
15.10
9.50
5.00
2.00
SPT
50/4"
3.58
5.00
10.17
G
F
E
D
C
B
A
15.17
3.00
13.000
8.08
5.335.00
3.58
15.00
13.00
11.00
10.00
8.00
13.08
6/28/00
NO. PercentRecov'd
SR 160 at UPRR Crossing
DRILLINGMETHOD
BD-6
DATE
DEPTH ft
SAFETY
GROUNDWATER LEVEL
TYPE
EXPLORATION LOG
6 inchIncrements
ELEV. ft
6/28/00
BACKFILLED
SR 160 - PAHRUMP VALLEY ROAD
MATERIAL DESCRIPTION
SHEET 1 OF 1
6/28/00
100
SAMPLELAB TESTS
"PE"188+0736.0 LeftBOOMHOWERMOBILE B-80MARSHALL
HAMMER DROP SYSTEM
GROUND ELEV.
E.A. #
BORING
LOCATION
JOB DESCRIPTION
END DATE
724952478.93 (ft)
BLOW COUNTREMARKS
DATE
ELEV.(ft)
DEPTH(ft)
Last1 foot
USCSGroup
Yes8" H.S.A.
START DATE
STATIONOFFSETENGINEEREQUIPMENTOPERATOR
5
10
15
20
25
5
10
15
20
25
2473.9
2468.9
2463.9
2458.9
2453.9
0
NV
_DO
T B
LUE
DM
ND
.GP
J N
V_D
OT.
GD
T 1
1/15
/06

50/.5"
2468.3
2463.3
2458.3
2453.3
2448.3
B.O.H.
POORLY-GRADED GRAVEL with SAND dry,reddish brown (5 YR 5/3), very dense
SILTY SAND with GRAVEL dry, with cobbles,light reddish brown (5 YR 6/3), very dense
SANDY GRAVEL with COBBLES dry, pale yellow(2.5 YR 8/2)
3.00
50/1"
14.00
50/2"
50/3"
50/1"
50/4"
50/1"
50/.5"
50/2"
50/3"
50/4"
BULK0
100
0
100
67
100
0 Hard drilling @2'.
SPTG
SPT
SPT
SPT
BULK
SPT
GP
SM
15.30SPT
2.5050/1"
7.50
9.54
5
10
15
20
25
F
E
D
C
B
A
15.33
2.58
12.00
4.50
7.67
4.754.50
2.58
15.00
12.00
11.00
9.50
H
12.08
TYPE
100
72495
PercentRecov'd
SR 160 at UPRR Crossing
DRILLINGMETHOD
BD-7
DATE
DEPTH ft
EXPLORATION LOG
SAMPLE
8" H.S.A.
6/28/00
6 inchIncrements
ELEV. ft
6/28/00
BACKFILLED
SR 160 - PAHRUMP VALLEY ROAD
MATERIAL DESCRIPTION
SHEET 1 OF 1
SAFETY
LAB TESTS
"PE"185+1862.0 LeftBOOMHOWERMOBILE B-80MARSHALL
HAMMER DROP SYSTEM
GROUND ELEV.
E.A. #
BORING
LOCATION
JOB DESCRIPTION
END DATE
GROUNDWATER LEVEL
2473.25 (ft)
NO.BLOW COUNT
REMARKS
DATE
ELEV.(ft)
DEPTH(ft)
Last1 foot
USCSGroup
Yes
START DATE
5
10
15
20
25
6/28/00
NV
_DO
T B
LUE
DM
ND
.GP
J N
V_D
OT.
GD
T 1
1/15
/06
STATIONOFFSETENGINEEREQUIPMENTOPERATOR

APPENDIX C

NEVADA DEPARTMENT OF
TRANSPORTATION
Well-graded gravel with silty clay and sand
Silty clayey sand with gravel
Poorly graded gravel with clay and sand
inches numbersize size
0.0 48.5 45.3 6.2 GW-GC
0.0 42.1 45.0 12.9 SC-SM
0.0 46.7 44.5 8.8 GP-GC
13/41/23/8
100.091.078.764.1
100.086.879.7
100.093.883.276.1
#4#10#16#40#50
#100#200
51.536.428.622.620.711.6
6.2
57.942.835.825.922.917.612.9
53.332.424.116.314.511.6
8.8
8.5399 5.1038 5.7992
1.3303 0.6774 1.7488
0.1300 0.1013
1.59 5.21
65.68 57.25
Location: Boring BD1, sample: b Depth: 0.9m Sample Number: b
Location: Boring BD1, sample: i Depth: 10.0m Sample Number: i
Location: Boring BD1, sample: j Depth: 11.6m Sample Number: j
Blue Diamond Interchange
72495
+3" % GRAVEL % SAND % SILT % CLAY USCS AASHTO PL LL
SIEVE PERCENT FINER SIEVE PERCENT FINER Material Description
GRAIN SIZE REMARKS:
D60
D30
D10
COEFFICIENTS
Cc
Cu
Client:
Project:
Project No.: Figure
PE
RC
EN
T F
INE
R
0
10
20
30
40
50
60
70
80
90
100
GRAIN SIZE - mm.
0.0010.010.1110100
6 in
.
3 in
.
2 in
.
1½
in.
1 in
.
¾ in
.
½ in
.
3/8
in.
#4
#1
0
#2
0
#3
0
#4
0
#6
0
#1
00
#1
40
#2
00
Particle Size Distribution Report

NEVADA DEPARTMENT OF
TRANSPORTATION
Poorly graded gravel with silty clay and sand
inches numbersize size
0.0 47.4 37.7 14.9 GM A-1-a 18 21
0.0 51.6 37.8 10.6 GP-GC 16 21
0.0 48.3 41.7 10.0 GP-GC 16 20
21.51
3/41/23/8
100.097.6
93.382.072.9
100.098.688.975.9
100.098.685.175.7
#4#10#16#40#50
#100#200
52.637.233.028.626.919.414.9
48.429.925.321.019.714.710.6
51.731.326.221.920.514.610.0
6.2388 6.5918 6.0563
0.6262 2.0186 1.8180
0.0753
7.25
80.46
Location: Boring BD2, sample: a Depth: 0.6m Sample Number: a
Location: Boring BD2, sample: b Depth: 1.2m Sample Number: b
Location: Boring BD2, sample: d Depth: 2.1m Sample Number: d
Blue Diamond Interchange
72495
+3" % GRAVEL % SAND % SILT % CLAY USCS AASHTO PL LL
SIEVE PERCENT FINER SIEVE PERCENT FINER Material Description
GRAIN SIZE REMARKS:
D60
D30
D10
COEFFICIENTS
Cc
Cu
Client:
Project:
Project No.: Figure
PE
RC
EN
T F
INE
R
0
10
20
30
40
50
60
70
80
90
100
GRAIN SIZE - mm.
0.0010.010.1110100
6 in
.
3 in
.
2 in
.
1½
in.
1 in
.
¾ in
.
½ in
.
3/8
in.
#4
#1
0
#2
0
#3
0
#4
0
#6
0
#1
00
#1
40
#2
00
Particle Size Distribution Report

NEVADA DEPARTMENT OF
TRANSPORTATION
Silty clayey gravel with sand
Silty sand with gravel
Silty sand with gravel
inches numbersize size
0.0 45.5 39.3 15.2 GC-GM A-1-a 19 24
0.0 19.9 52.0 28.1 SM
0.0 25.2 58.1 16.7 SM
13/41/23/8
100.094.883.374.9
100.090.187.4
100.090.789.0
#4#10#16#40#50
#100#200
54.539.333.828.426.619.615.2
80.167.361.152.749.838.128.1
74.854.144.434.531.823.716.7
5.8121 1.0598 2.6110
0.6269 0.0866 0.2520
Location: Boring BD2, sample: f Depth: 3.7m Sample Number: f
Location: Boring BD3, sample: b Depth: 0.91m Sample Number: b
Location: Boring BD3, sample: d Depth: 1.52m Sample Number: d
Blue Diamond Interchange
72495
+3" % GRAVEL % SAND % SILT % CLAY USCS AASHTO PL LL
SIEVE PERCENT FINER SIEVE PERCENT FINER Material Description
GRAIN SIZE REMARKS:
D60
D30
D10
COEFFICIENTS
Cc
Cu
Client:
Project:
Project No.: Figure
PE
RC
EN
T F
INE
R
0
10
20
30
40
50
60
70
80
90
100
GRAIN SIZE - mm.
0.0010.010.1110100
6 in
.
3 in
.
2 in
.
1½
in.
1 in
.
¾ in
.
½ in
.
3/8
in.
#4
#1
0
#2
0
#3
0
#4
0
#6
0
#1
00
#1
40
#2
00
Particle Size Distribution Report

NEVADA DEPARTMENT OF
TRANSPORTATION
Silty sand with gravel
Poorly graded sand with silt and gravel
Clayey gravel with sand
inches numbersize size
0.0 30.4 57.5 12.1 SM
0.0 25.6 63.8 10.6 SP-SM
0.0 46.2 32.2 21.6 GC
1.51
1/23/8
100.084.880.278.4
100.093.7
100.073.167.762.9
#4#10#16#40#50
#100#200
69.652.441.929.926.217.712.1
74.455.246.636.032.319.510.6
53.846.543.138.536.730.521.6
2.8572 2.5665 8.0315
0.4293 0.2590 0.1438
Location: Boring BD3, sample: f Depth: 2.44m Sample Number: f
Location: Boring BD3, sample: i Depth: 4.57m Sample Number: i
Location: Boring BD4, sample: d Depth: 5.49m Sample Number: d
Blue Diamond Interchange
72495
+3" % GRAVEL % SAND % SILT % CLAY USCS AASHTO PL LL
SIEVE PERCENT FINER SIEVE PERCENT FINER Material Description
GRAIN SIZE REMARKS:
D60
D30
D10
COEFFICIENTS
Cc
Cu
Client:
Project:
Project No.: Figure
PE
RC
EN
T F
INE
R
0
10
20
30
40
50
60
70
80
90
100
GRAIN SIZE - mm.
0.0010.010.1110100
6 in
.
3 in
.
2 in
.
1½
in.
1 in
.
¾ in
.
½ in
.
3/8
in.
#4
#1
0
#2
0
#3
0
#4
0
#6
0
#1
00
#1
40
#2
00
Particle Size Distribution Report

NEVADA DEPARTMENT OF
TRANSPORTATION
Poorly-graded gravel with clay and sand
Poorly graded gravel with silt and sand
Poorly graded gravel with silt and sand
inches numbersize size
0.0 50.7 39.4 9.9 GP-GC
0.0 48.9 39.2 11.9 GP-GM
0.0 54.1 34.1 11.8 GP-GM
1.51
3/41/23/8
100.085.072.863.9
100.082.668.1
100.080.4
64.158.3
#4#10#16#40#50
#100#200
49.335.429.322.320.314.1
9.9
51.134.628.924.222.516.611.9
45.931.626.921.920.316.311.8
8.2630 7.5216 10.3487
1.2626 1.3481 1.7346
0.0768
2.51
107.56
Location: Boring BD4, sample: f Depth: 8.53m Sample Number: f
Location: Boring BD4, sample: h Depth: 14.63m Sample Number: h
Location: Boring BD4, sample: l Depth: 26.83m Sample Number: l
Blue Diamond Interchange
72495
+3" % GRAVEL % SAND % SILT % CLAY USCS AASHTO PL LL
SIEVE PERCENT FINER SIEVE PERCENT FINER Material Description
GRAIN SIZE REMARKS:
D60
D30
D10
COEFFICIENTS
Cc
Cu
Client:
Project:
Project No.: Figure
PE
RC
EN
T F
INE
R
0
10
20
30
40
50
60
70
80
90
100
GRAIN SIZE - mm.
0.0010.010.1110100
6 in
.
3 in
.
2 in
.
1½
in.
1 in
.
¾ in
.
½ in
.
3/8
in.
#4
#1
0
#2
0
#3
0
#4
0
#6
0
#1
00
#1
40
#2
00
Particle Size Distribution Report

NEVADA DEPARTMENT OF
TRANSPORTATION
Silty, clayey sand with gravel
Silty sand with gravel
Poorly graded sand with silty clay and gravel
inches numbersize size
0.0 17.7 57.2 25.1 SC-SM 16 21
0.0 30.8 41.8 27.4 SM
0.0 25.0 64.6 10.4 SP-SC
13/41/23/8
100.098.592.0
100.092.584.079.3
100.093.592.6
#4#10#16#40#50
#100#200
82.368.860.649.946.636.225.1
69.258.753.447.445.337.327.4
75.051.542.031.728.317.010.4
1.1291 2.2471 2.8522
0.1019 0.0899 0.3507
Location: Boring BD5, sample: b Depth: 0.91m Sample Number: b
Location: Boring BD5, sample: e Depth: 2.44m Sample Number: e
Location: Boring BD5, sample: i Depth: 4.57m Sample Number: i
Blue Diamond Interchange
72495
+3" % GRAVEL % SAND % SILT % CLAY USCS AASHTO PL LL
SIEVE PERCENT FINER SIEVE PERCENT FINER Material Description
GRAIN SIZE REMARKS:
D60
D30
D10
COEFFICIENTS
Cc
Cu
Client:
Project:
Project No.: Figure
PE
RC
EN
T F
INE
R
0
10
20
30
40
50
60
70
80
90
100
GRAIN SIZE - mm.
0.0010.010.1110100
6 in
.
3 in
.
2 in
.
1½
in.
1 in
.
¾ in
.
½ in
.
3/8
in.
#4
#1
0
#2
0
#3
0
#4
0
#6
0
#1
00
#1
40
#2
00
Particle Size Distribution Report

NEVADA DEPARTMENT OF
TRANSPORTATION
Silty, clayey sand with gravel
Silty sand with gravel
Well-graded sand with silt and gravel
inches numbersize size
0.0 27.2 53.9 18.9 SC-SM 17 22
0.0 24.3 62.9 12.8 SM
0.0 34.1 60.7 5.2 SW-SM
13/41/23/8
100.088.784.8
100.096.392.186.9
100.096.589.1
#4#10#16#40#50
#100#200
72.860.755.849.947.132.418.9
75.759.750.838.033.320.812.8
65.943.334.625.422.211.3
5.2
1.8688 2.0273 3.9249
0.1347 0.2477 0.7670
0.1357
1.10
28.92
Location: Boring BD6, sample: a Depth: 0.91m Sample Number: a
Location: Boring BD6, sample: c Depth: 1.52m Sample Number: c
Location: Boring BD6, sample: e Depth: 3.05m Sample Number: e
Blue Diamond Interchange
72495
+3" % GRAVEL % SAND % SILT % CLAY USCS AASHTO PL LL
SIEVE PERCENT FINER SIEVE PERCENT FINER Material Description
GRAIN SIZE REMARKS:
D60
D30
D10
COEFFICIENTS
Cc
Cu
Client:
Project:
Project No.: Figure
PE
RC
EN
T F
INE
R
0
10
20
30
40
50
60
70
80
90
100
GRAIN SIZE - mm.
0.0010.010.1110100
6 in
.
3 in
.
2 in
.
1½
in.
1 in
.
¾ in
.
½ in
.
3/8
in.
#4
#1
0
#2
0
#3
0
#4
0
#6
0
#1
00
#1
40
#2
00
Particle Size Distribution Report

NEVADA DEPARTMENT OF
TRANSPORTATION
Silty sand with gravel
Silty sand with gravel
Poorly-graded gravel with sand
inches numbersize size
0.0 24.3 54.6 21.1 SM
0.0 22.5 64.9 12.6 SM
0.0 66.1 30.5 3.4 GP
1.51
3/41/23/8
100.090.689.3
100.095.7
100.077.5
53.547.6
#4#10#16#40#50
#100#200
75.761.355.749.647.133.121.1
77.552.342.432.829.519.912.6
33.921.216.711.3
9.75.73.4
1.7925 2.6837 16.2738
0.1284 0.3127 3.8071
0.3180
2.80
51.17
Location: Boring BD7, sample: c Depth: 1.37m Sample Number: c
Location: Boring BD7, sample: d Depth: 2.29m Sample Number: d
Location: Boring BD7, sample: h Depth: 4.57m Sample Number: h
Blue Diamond Interchange
72495
+3" % GRAVEL % SAND % SILT % CLAY USCS AASHTO PL LL
SIEVE PERCENT FINER SIEVE PERCENT FINER Material Description
GRAIN SIZE REMARKS:
D60
D30
D10
COEFFICIENTS
Cc
Cu
Client:
Project:
Project No.: Figure
PE
RC
EN
T F
INE
R
0
10
20
30
40
50
60
70
80
90
100
GRAIN SIZE - mm.
0.0010.010.1110100
6 in
.
3 in
.
2 in
.
1½
in.
1 in
.
¾ in
.
½ in
.
3/8
in.
#4
#1
0
#2
0
#3
0
#4
0
#6
0
#1
00
#1
40
#2
00
Particle Size Distribution Report

EA/Cont # 72495 S.R. 160 (Blue Diamond) @ U.P.R.R. Crossing
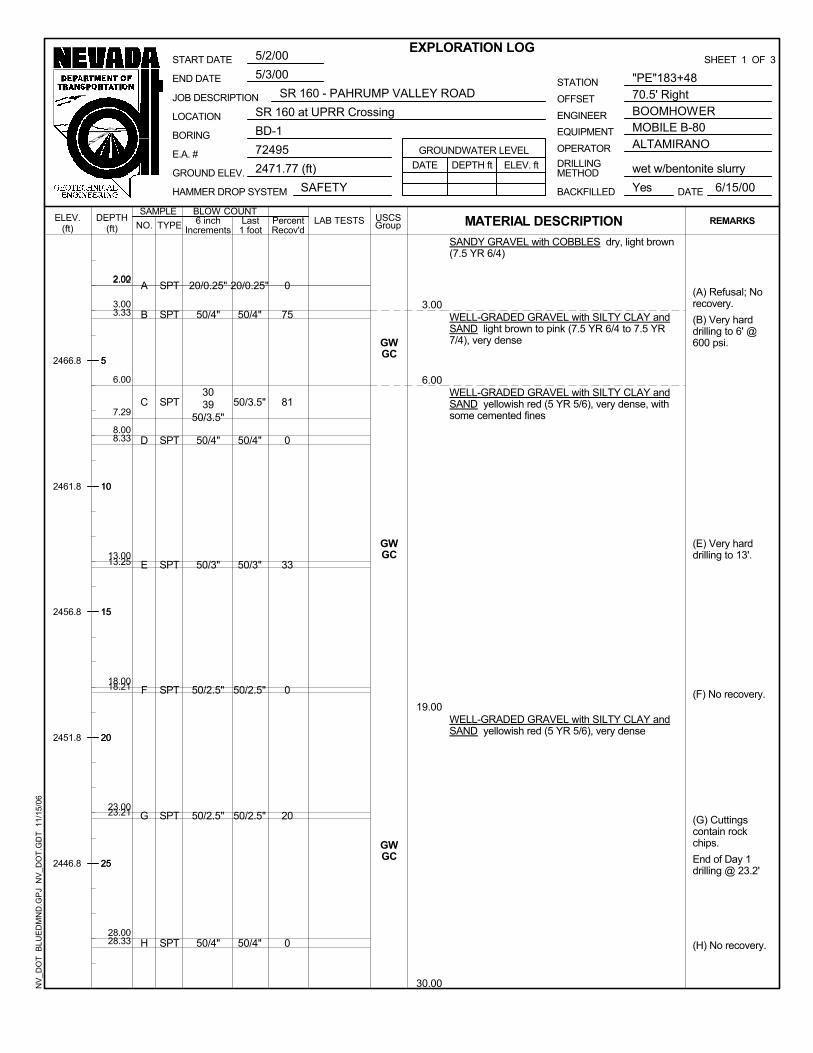
Boring No. BD1 Elevation (ft) 2471.77 Station "PE" 183+48 70.5' Rt.
SAMP- N DRY % SAMPLE LER BLOWS SOIL W% UW PASS LL PL PI TEST C C OTHERS
NO. TYPE per ft. GROUP pcf #200 % % % TYPE deg. psf deg. psf
A SPT
B SPT GW-GC 6.2
C SPT 31 20 11
D SPT
E SPT
F SPT
G SPT
H SPT
I SPT SC-SM 12.9
J SPT GP-GC 8.8
K SPT
L SPT
CMS = California Modified Sampler 2.375" ID U = Unconfined Compressive H = Hydrometer CM = CompactionSPT = Standard Penetration 1.375" ID UU = Unconsolidated Undrained S = Sieve E = Swell/Pressure on Expansive SoilsCS = Continuous Sample 3.25" ID CD = Consolidated Drained G = Specific Gravity SL = Shrinkage LimitRC = Rock Core CU = Consolidated Undrained PI = Plasticity Index UW= Unit WeightPB = Pitcher Barrel DS = Direct Shear LL = Liquid Limit W = Moisture ContentCSS = Calif. Split Spoon 2.375" ID = Friction PL = Plastic Limit K = PermeabilityCPT = Cone Penetration Test C = Cohesion NP = Non-Plastic O = Organic ContentTP = Test Pit N = No. of blows per ft, sampler OC = Consolidation D = DispersiveP = Pushed, not driven Ch = Chemical RQD = Rock Quality DesignationR = Refusal N = Field SPT N = (Ncss)(0.62) RV = R - Value X = X-Ray DefractionSh = Shelby Tube 2.875" ID MD = Moisture Density HCpot = Hydro-Collapse Potential
SUMMARY OF RESULTSN.D.O.T. GEOTECHNICAL SECTION
SAMPLE STRENGTH TEST
Job Description
DEPTH(ft)
Peak Residual
2.0 - 3.0
3.0 - 3.3
6.0 - 7.4
8.0 - 8.3
13.0 - 13.3
18.0 - 18.2
23.0 - 23.2
28.0 - 28.3
33.0 - 33.3
38.0 - 39.3
43.0 - 43.2
48.0 - 48.2

EA/Cont # 72495 S.R. 160 (Blue Diamond) @ U.P.R.R. Crossing
Boring No. BD1 Elevation (ft) 2471.77 Station "PE" 183+48 70.5' Rt.
SAMP- N DRY % SAMPLE LER BLOWS SOIL W% UW PASS LL PL PI TEST C C OTHERS
NO. TYPE per ft. GROUP pcf #200 % % % TYPE deg. psf deg. psf
M SPT
N SPT
O SPT
P SPT
CMS = California Modified Sampler 2.375" ID U = Unconfined Compressive H = Hydrometer CM = CompactionSPT = Standard Penetration 1.375" ID UU = Unconsolidated Undrained S = Sieve E = Swell/Pressure on Expansive SoilsCS = Continuous Sample 3.25" ID CD = Consolidated Drained G = Specific Gravity SL = Shrinkage LimitRC = Rock Core CU = Consolidated Undrained PI = Plasticity Index UW= Unit WeightPB = Pitcher Barrel DS = Direct Shear LL = Liquid Limit W = Moisture ContentCSS = Calif. Split Spoon 2.375" ID = Friction PL = Plastic Limit K = PermeabilityCPT = Cone Penetration Test C = Cohesion NP = Non-Plastic O = Organic ContentTP = Test Pit N = No. of blows per ft, sampler OC = Consolidation D = DispersiveP = Pushed, not driven Ch = Chemical RQD = Rock Quality DesignationR = Refusal N = Field SPT N = (Ncss)(0.62) RV = R - Value X = X-Ray Defraction
Sh = Shelby Tube 2.875" ID MD = Moisture Density HCpot = Hydro-Collapse Potential
SUMMARY OF RESULTSN.D.O.T. GEOTECHNICAL SECTION
SAMPLE STRENGTH TEST
Job Description
DEPTH(ft)
Peak Residual
58.0 - 58.2
68.0 - 68.1
78.0 - 78.2
88.0 - 88.2

EA/Cont # 72495 S.R. 160 (Blue Diamond) @ U.P.R.R. Crossing
Boring No. BD2 Elevation (ft) 2476.74 Station "PE" 185+84 52.5' Rt.
SAMP- N DRY % SAMPLE LER BLOWS SOIL W% UW PASS LL PL PI TEST C C OTHERS
NO. TYPE per ft. GROUP pcf #200 % % % TYPE deg. psf deg. psf
A bulk GM 14.9 21 18 3
B bulk GP-GC 10.6 21 16 5
C SPT
D bulk GP-GC 10.0 20 16 4
E SPT
F bulk GC-GM 15.2 24 19 5
G SPT
CMS = California Modified Sampler 2.375" ID U = Unconfined Compressive H = Hydrometer CM = CompactionSPT = Standard Penetration 1.375" ID UU = Unconsolidated Undrained S = Sieve E = Swell/Pressure on Expansive SoilsCS = Continuous Sample 3.25" ID CD = Consolidated Drained G = Specific Gravity SL = Shrinkage LimitRC = Rock Core CU = Consolidated Undrained PI = Plasticity Index UW= Unit WeightPB = Pitcher Barrel DS = Direct Shear LL = Liquid Limit W = Moisture ContentCSS = Calif. Split Spoon 2.375" ID = Friction PL = Plastic Limit K = PermeabilityCPT = Cone Penetration Test C = Cohesion NP = Non-Plastic O = Organic ContentTP = Test Pit N = No. of blows per ft, sampler OC = Consolidation D = DispersiveP = Pushed, not driven Ch = Chemical RQD = Rock Quality DesignationR = Refusal N = Field SPT N = (Ncss)(0.62) RV = R - Value X = X-Ray DefractionSh = Shelby Tube 2.875" ID MD = Moisture Density HCpot = Hydro-Collapse Potential
15.0 - 15.1
10.0 - 10.2
12.0 - 13.5 Ch
5.0 - 5.0
7.0 - 8.0 G = 2.473 (+#4) 2.638 (-#4)
Residual
2.0 - 3.5 Ch, Apparent Gravity = 2.56
4.0 - 5.0 Ch
DEPTH(ft)
Peak
SUMMARY OF RESULTSN.D.O.T. GEOTECHNICAL SECTION
Job Description
SAMPLE STRENGTH TEST

SUMMARY OF RESULTSN.D.O.T. GEOTECHNICAL SECTION
EA/Cont # 72495 Job Description S.R. 160 (Blue Diamond) @ U.P.R.R. Crossing
Boring No. BD3 Elevation (ft) 2471.83 Station "PE" 182+95 46.0' Lt.
SAMPLE SAMP- N DRY % STRENGTH TEST SAMPLE DEPTH LER BLOWS SOIL W% UW PASS LL PL PI TEST C C OTHERS
NO. (ft) TYPE per ft. GROUP pcf #200 % % % TYPE deg. psf deg. psf Peak Residual
A 0.0 - 3.0 bulk
B 3.0 - 3.3 SPT SM 28.1
C 3.3 - 5.0 bulk
D 5.0 - 5.2 SPT SM 16.7
E 6.0 - 8.0 bulk
F 8.0 - 8.2 SPT SM 12.1
G 10.0 - 10.1 SPT
H 11.0 - 13.0 bulk
I 15.0 - 15.3 SPT SP-SM 10.6
CMS = California Modified Sampler 2.375" ID U = Unconfined Compressive H = Hydrometer CM = CompactionSPT = Standard Penetration 1.375" ID UU = Unconsolidated Undrained S = Sieve E = Swell/Pressure on Expansive SoilsCS = Continuous Sample 3.25" ID CD = Consolidated Drained G = Specific Gravity SL = Shrinkage LimitRC = Rock Core CU = Consolidated Undrained PI = Plasticity Index UW= Unit WeightPB = Pitcher Barrel DS = Direct Shear LL = Liquid Limit W = Moisture ContentCSS = Calif. Split Spoon 2.375" ID = Friction PL = Plastic Limit K = PermeabilityCPT = Cone Penetration Test C = Cohesion NP = Non-Plastic O = Organic ContentTP = Test Pit N = No. of blows per ft, sampler OC = Consolidation D = DispersiveP = Pushed, not driven Ch = Chemical RQD = Rock Quality DesignationR = Refusal N = Field SPT N = (Ncss)(0.62) RV = R - Value X = X-Ray DefractionSh = Shelby Tube 2.875" ID MD = Moisture Density HCpot = Hydro-Collapse Potential

SUMMARY OF RESULTSN.D.O.T. GEOTECHNICAL SECTION
EA/Cont # 72495 Job Description S.R. 160 (Blue Diamond) @ U.P.R.R. Crossing
Boring No. BD4 Elevation (ft) 2475.95 Station "PE" 186+39 62.0' Lt.
SAMPLE SAMP- N DRY % STRENGTH TEST SAMPLE DEPTH LER BLOWS SOIL W% UW PASS LL PL PI TEST C C OTHERS
NO. (ft) TYPE per ft. GROUP pcf #200 % % % TYPE deg. psf deg. psf Peak Residual
A 3.0 - 3.0 SPT
B 8.0 - 8.3 SPT
C 13.0 - 13.2 SPT
D 18.0 - 18.3 SPT GC 21.6
R 23.0 - 23.3 SPT
F 28.0 - 28.5 SPT GP-GC 9.9
G 38.0 - 38.3 SPT
H 48.0 - 48.3 SPT GP-GM 11.9
I 58.0 - 58.3 SPT
J 68.0 - 68.3 SPT
K 78.0 - 78.2 SPT
L 88.0 - 88.2 SPT GP-GM 11.9
CMS = California Modified Sampler 2.375" ID U = Unconfined Compressive H = Hydrometer CM = CompactionSPT = Standard Penetration 1.375" ID UU = Unconsolidated Undrained S = Sieve E = Swell/Pressure on Expansive SoilsCS = Continuous Sample 3.25" ID CD = Consolidated Drained G = Specific Gravity SL = Shrinkage LimitRC = Rock Core CU = Consolidated Undrained PI = Plasticity Index UW= Unit WeightPB = Pitcher Barrel DS = Direct Shear LL = Liquid Limit W = Moisture ContentCSS = Calif. Split Spoon 2.375" ID = Friction PL = Plastic Limit K = PermeabilityCPT = Cone Penetration Test C = Cohesion NP = Non-Plastic O = Organic ContentTP = Test Pit N = No. of blows per ft, sampler OC = Consolidation D = DispersiveP = Pushed, not driven Ch = Chemical RQD = Rock Quality DesignationR = Refusal N = Field SPT N = (Ncss)(0.62) RV = R - Value X = X-Ray DefractionSh = Shelby Tube 2.875" ID MD = Moisture Density HCpot = Hydro-Collapse Potential

SUMMARY OF RESULTSN.D.O.T. GEOTECHNICAL SECTION
EA/Cont # 72495 Job Description S.R. 160 (Blue Diamond) @ U.P.R.R. Crossing
Boring No. BD4 Elevation (ft) 2475.95 Station "PE" 186+39 62.0' Lt.
SAMPLE SAMP- N DRY % STRENGTH TEST SAMPLE DEPTH LER BLOWS SOIL W% UW PASS LL PL PI TEST C C OTHERS
NO. (ft) TYPE per ft. GROUP pcf #200 % % % TYPE deg. psf deg. psf Peak Residual
M 96.0 - 96.2 SPT
CMS = California Modified Sampler 2.375" ID U = Unconfined Compressive H = Hydrometer CM = CompactionSPT = Standard Penetration 1.375" ID UU = Unconsolidated Undrained S = Sieve E = Swell/Pressure on Expansive SoilsCS = Continuous Sample 3.25" ID CD = Consolidated Drained G = Specific Gravity SL = Shrinkage LimitRC = Rock Core CU = Consolidated Undrained PI = Plasticity Index UW= Unit WeightPB = Pitcher Barrel DS = Direct Shear LL = Liquid Limit W = Moisture ContentCSS = Calif. Split Spoon 2.375" ID = Friction PL = Plastic Limit K = PermeabilityCPT = Cone Penetration Test C = Cohesion NP = Non-Plastic O = Organic ContentTP = Test Pit N = No. of blows per ft, sampler OC = Consolidation D = DispersiveP = Pushed, not driven Ch = Chemical RQD = Rock Quality DesignationR = Refusal N = Field SPT N = (Ncss)(0.62) RV = R - Value X = X-Ray Defraction
Sh = Shelby Tube 2.875" ID MD = Moisture Density HCpot = Hydro-Collapse Potential

SUMMARY OF RESULTSN.D.O.T. GEOTECHNICAL SECTION
EA/Cont # 72495 Job Description S.R. 160 (Blue Diamond) @ U.P.R.R. Crossing
Boring No. BD5 Elevation (ft) 2481.25 Station "PE" 190+63 49.0' Lt.
SAMPLE SAMP- N DRY % STRENGTH TEST SAMPLE DEPTH LER BLOWS SOIL W% UW PASS LL PL PI TEST C C OTHERS
NO. (ft) TYPE per ft. GROUP pcf #200 % % % TYPE deg. psf deg. psf Peak Residual
A 1.0 - 3.0 bulk
B 9.0 - 3.1 SPT SC-SM 25.1 21 16 5
C 3.1 - 5.0 bulk
D 5.0 - 5.0 SPT
E 8.0 - 8.1 SPT SM 27.4
F 8.1 - 10.0 bulk
G 10.0 - 10.1 SPT
H 12.0 - 12.1 SPT
I 15.0 - 15.1 bulk SP-SC 10.4
CMS = California Modified Sampler 2.375" ID U = Unconfined Compressive H = Hydrometer CM = CompactionSPT = Standard Penetration 1.375" ID UU = Unconsolidated Undrained S = Sieve E = Swell/Pressure on Expansive SoilsCS = Continuous Sample 3.25" ID CD = Consolidated Drained G = Specific Gravity SL = Shrinkage LimitRC = Rock Core CU = Consolidated Undrained PI = Plasticity Index UW= Unit WeightPB = Pitcher Barrel DS = Direct Shear LL = Liquid Limit W = Moisture ContentCSS = Calif. Split Spoon 2.375" ID = Friction PL = Plastic Limit K = PermeabilityCPT = Cone Penetration Test C = Cohesion NP = Non-Plastic O = Organic ContentTP = Test Pit N = No. of blows per ft, sampler OC = Consolidation D = DispersiveP = Pushed, not driven Ch = Chemical RQD = Rock Quality DesignationR = Refusal N = Field SPT N = (Ncss)(0.62) RV = R - Value X = X-Ray DefractionSh = Shelby Tube 2.875" ID MD = Moisture Density HCpot = Hydro-Collapse Potential

SUMMARY OF RESULTSN.D.O.T. GEOTECHNICAL SECTION
EA/Cont # 72495 Job Description S.R. 160 (Blue Diamond) @ U.P.R.R. Crossing
Boring No. BD6 Elevation (ft) 2478.93 Station "PE" 188+07 36.0' Lt.
SAMPLE SAMP- N DRY % STRENGTH TEST SAMPLE DEPTH LER BLOWS SOIL W% UW PASS LL PL PI TEST C C OTHERS
NO. (ft) TYPE per ft. GROUP pcf #200 % % % TYPE deg. psf deg. psf Peak Residual
A 3.0 - 3.6 SPT SC-SM 18.9 22 17 5
B 3.6 - 5.0 bulk
C 5.0 - 5.3 SPT SM 12.9
D 8.0 - 8.1 SPT
E 10.0 - 10.2 SPT SW-SM 5.2
F 11.0 - 13.0 bulk
G 13.0 - 13.1 SPT
H 15.0 - 15.2 SPT
CMS = California Modified Sampler 2.375" ID U = Unconfined Compressive H = Hydrometer CM = CompactionSPT = Standard Penetration 1.375" ID UU = Unconsolidated Undrained S = Sieve E = Swell/Pressure on Expansive SoilsCS = Continuous Sample 3.25" ID CD = Consolidated Drained G = Specific Gravity SL = Shrinkage LimitRC = Rock Core CU = Consolidated Undrained PI = Plasticity Index UW= Unit WeightPB = Pitcher Barrel DS = Direct Shear LL = Liquid Limit W = Moisture ContentCSS = Calif. Split Spoon 2.375" ID = Friction PL = Plastic Limit K = PermeabilityCPT = Cone Penetration Test C = Cohesion NP = Non-Plastic O = Organic ContentTP = Test Pit N = No. of blows per ft, sampler OC = Consolidation D = DispersiveP = Pushed, not driven Ch = Chemical RQD = Rock Quality DesignationR = Refusal N = Field SPT N = (Ncss)(0.62) RV = R - Value X = X-Ray DefractionSh = Shelby Tube 2.875" ID MD = Moisture Density HCpot = Hydro-Collapse Potential

SUMMARY OF RESULTSN.D.O.T. GEOTECHNICAL SECTION
EA/Cont # 72495 Job Description S.R. 160 (Blue Diamond) @ U.P.R.R. Crossing
Boring No. BD7 Elevation (ft) 2473.25 Station "PE" 185+18 62.0' Lt.
SAMPLE SAMP- N DRY % STRENGTH TEST SAMPLE DEPTH LER BLOWS SOIL W% UW PASS LL PL PI TEST C C OTHERS
NO. (ft) TYPE per ft. GROUP pcf #200 % % % TYPE deg. psf deg. psf Peak Residual
A 2.5 - 2.6 SPT
B 2.6 - 4.5 bulk
C 4.5 - 4.7 SPT SM 21.1
D 7.5 - 7.7 SPT SM 12.6
E 9.5 - 9.6 SPT
F 11.0 - 12.0 bulk
G 12.0 - 12.1 SPT
H 15.0 - 15.3 SPT GP 3.4
CMS = California Modified Sampler 2.375" ID U = Unconfined Compressive H = Hydrometer CM = CompactionSPT = Standard Penetration 1.375" ID UU = Unconsolidated Undrained S = Sieve E = Swell/Pressure on Expansive SoilsCS = Continuous Sample 3.25" ID CD = Consolidated Drained G = Specific Gravity SL = Shrinkage LimitRC = Rock Core CU = Consolidated Undrained PI = Plasticity Index UW= Unit WeightPB = Pitcher Barrel DS = Direct Shear LL = Liquid Limit W = Moisture ContentCSS = Calif. Split Spoon 2.375" ID = Friction PL = Plastic Limit K = PermeabilityCPT = Cone Penetration Test C = Cohesion NP = Non-Plastic O = Organic ContentTP = Test Pit N = No. of blows per ft, sampler OC = Consolidation D = DispersiveP = Pushed, not driven Ch = Chemical RQD = Rock Quality DesignationR = Refusal N = Field SPT N = (Ncss)(0.62) RV = R - Value X = X-Ray DefractionSh = Shelby Tube 2.875" ID MD = Moisture Density HCpot = Hydro-Collapse Potential