Embed Size (px)
Citation preview

1 1
© 2003 B
rooks/Cole P
ublishing / Thom
son Learning™
Figure 2.12 The metallic bond forms when atoms give up their valence electrons, which then form an electron sea. The positively charged atom cores are bonded by mutual attraction to the negatively charged electrons

2 2
© 2003 B
rooks/Cole P
ublishing / Thom
son Learning™
Figure 2.13 When voltage is applied to a metal, the electrons in the electron sea can easily move and carry a current

3 3
© 2003 B
rooks/Cole P
ublishing / Thom
son Learning™
Figure 2.14 Covalent bonding requires that electrons be shared between atoms in such a way that each atom has its outer sp orbital filled. In silicon, with a valence of four, four covalent bonds must be formed
4 4
© 2003 Brooks/Cole Publishing / Thomson Learning™
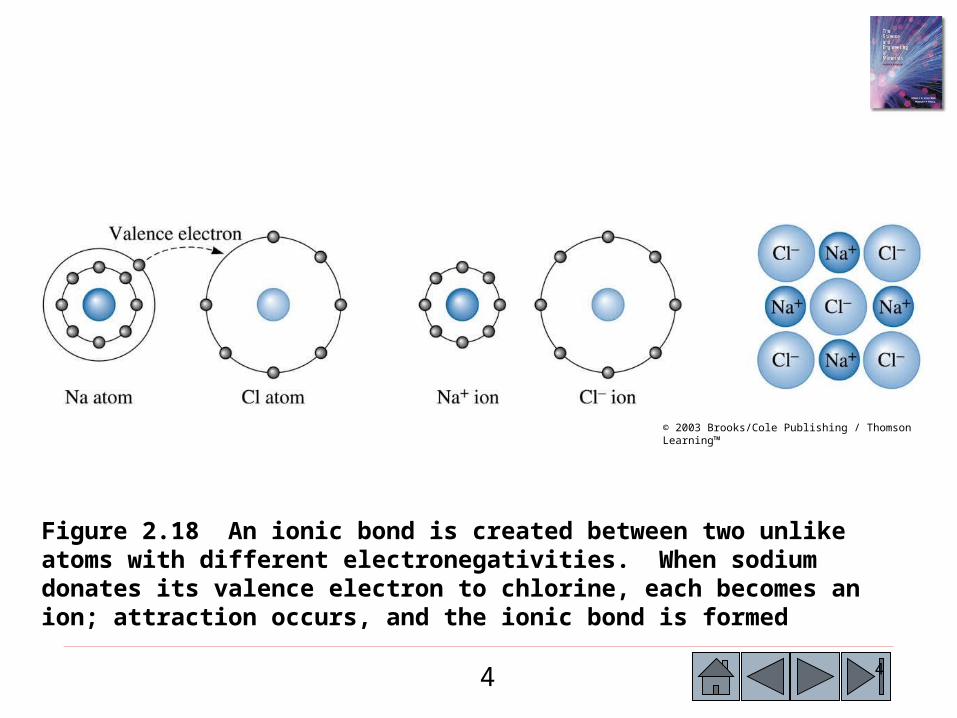
Figure 2.18 An ionic bond is created between two unlike atoms with different electronegativities. When sodium donates its valence electron to chlorine, each becomes an ion; attraction occurs, and the ionic bond is formed

5 5
© 2003 Brooks/Cole Publishing / Thomson Learning™
Figure 2.19 When voltage is applied to an ionic material, entire ions must move to cause a current to flow. Ion movement is slow and the electrical conductivity is poor (for Example 2-8)

6 6
© 2003 Brooks/Cole Publishing / Thomson Learning™ Figure 2.20 Illustration of London forces, a type of a
van der Waals force, between atoms

7 7
© 2003 Brooks/Cole Publishing / Thomson Learning™
Figure 2.23 Atoms or ions are separated by and equilibrium spacing that corresponds to the minimum inter-atomic energy for a pair of atoms or ions (or when zero force is acting to repel or attract the atoms or ions)

8(c) 2003 Brooks/Cole Publishing / Thomson Learning™
Figure 3.11 The fourteen types of Bravais lattices grouped in seven crystal systems. The actual unit cell for a hexagonal system is shown in Figures 3.12 and 3.16.

9 9
(c) 2003 Brooks/C
ole Publishing / Thom
son Learning
Figure 4.1 Point defects: (a) vacancy, (b) interstitial atom, (c) small substitutional atom, (d) large substitutional atom, (e) Frenkel defect, (f) Schottky defect. All of these defects disrupt the perfect arrangement of the surrounding atoms.

10 10
(c) 2003 Brooks/C
ole Publishing / Thom
son Learning
Figure 4.4 the perfect crystal (a) is cut and sheared one atom spacing, (b) and (c). The line along which shearing occurs is a screw dislocation. A Burgers vector b is required to close a loop of equal atom spacings around the screw dislocation.
11 11
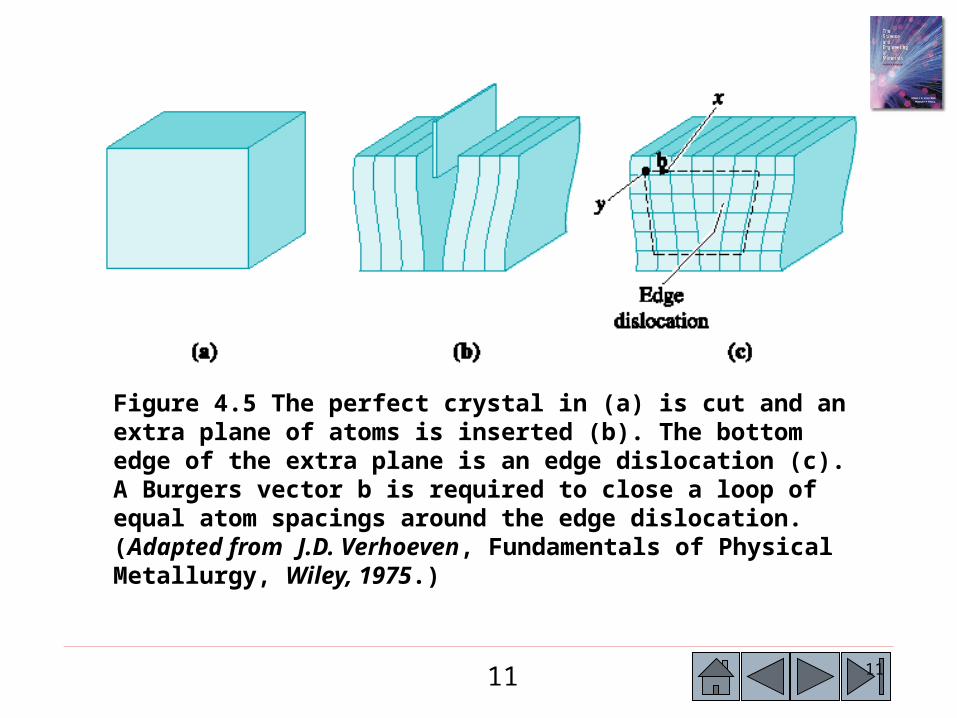
Figure 4.5 The perfect crystal in (a) is cut and an extra plane of atoms is inserted (b). The bottom edge of the extra plane is an edge dislocation (c). A Burgers vector b is required to close a loop of equal atom spacings around the edge dislocation. (Adapted from J.D. Verhoeven, Fundamentals of Physical Metallurgy, Wiley, 1975.)
12 12
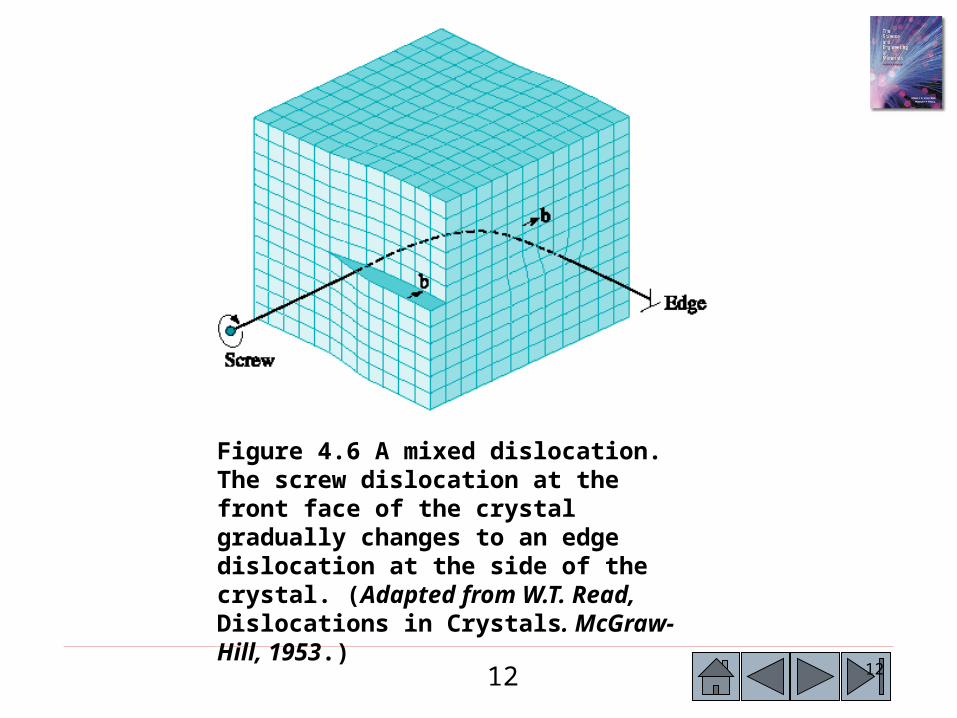
Figure 4.6 A mixed dislocation. The screw dislocation at the front face of the crystal gradually changes to an edge dislocation at the side of the crystal. (Adapted from W.T. Read, Dislocations in Crystals. McGraw-Hill, 1953.)
13 13
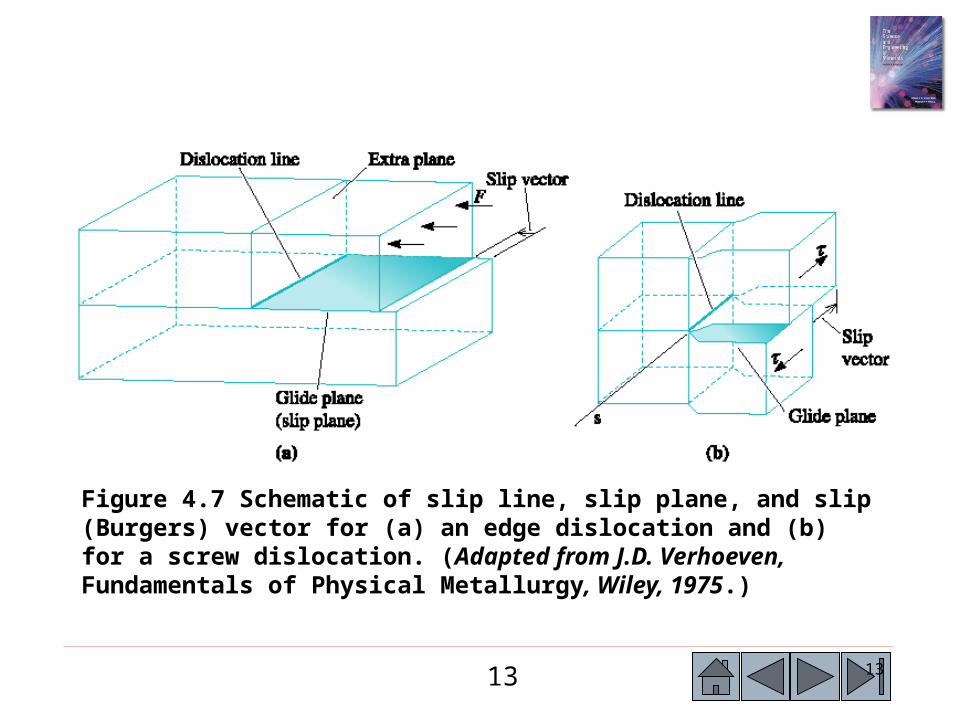
Figure 4.7 Schematic of slip line, slip plane, and slip (Burgers) vector for (a) an edge dislocation and (b) for a screw dislocation. (Adapted from J.D. Verhoeven, Fundamentals of Physical Metallurgy, Wiley, 1975.)

14 14
Figure 4.8 (a) When a shear stress is applied to the dislocation in (a), the atoms are displaced, causing the dislocation to move one Burgers vector in the slip direction (b). Continued movement of the dislocation eventually creates a step (c), and the crystal is deformed. (Adapted from A.G. Guy, Essentials of Materials Science, McGraw-Hill, 1976.) (b) Motion of caterpillar is analogous to the motion of a dislocation.

1515
©2003 Brooks/Cole, a division of Thomson Learning, Inc. Thomson Learning™ is a trademark used herein under license.
Figure 9.4 (a) Liquid copper and liquid nickel are completely soluble in each other. (b) Solid copper-nickel alloys display complete solid solubility, with copper and nickel atoms occupying random lattice sites. (c) In copper-zinc alloys containing more than 30% Zn, a second phase forms because of the limited solubility of zinc in copper.

16 16
Figure 4.12 Optical image of etch pits in silicon carbide (SiC). The etch pits correspond to intersection points of pure edge dislocations with Burgers vector a/3 and the dislocation line direction along [0001] (perpendicular to the etched surface). Lines of etch pits represent low angle grain boundaries (Courtesy of Dr. Marek Skowronski, Carnegie Mellon University.)
2011

17 17
Figure 4.13 Electron photomicrographs of dislocations in Ti3Al: (a) Dislocation pileups (x26,500). (b) Micrograph at x 100 showing slip lines and grain boundaries in AI. (c) Schematic of slip bands development.
(c) 2003 Brooks/C
ole Publishing / Thom
son L
earning
(c) 2003 Brooks/C
ole Publishing / Thom
son L
earning
(c)2003 Brooks/Cole, a division of Thomson Learning, Inc. Thomson Learning™ is a trademark used herein under license.

18 18
Figure 4.16 (a) The atoms near the boundaries of the three grains do not have an equilibrium spacing or arrangement. (b) Grains and grain boundaries in a stainless steel sample. (Courtesy Dr. A. Deardo.)
19 19
(c) 2003 Brooks/C
ole Publishing / Thom
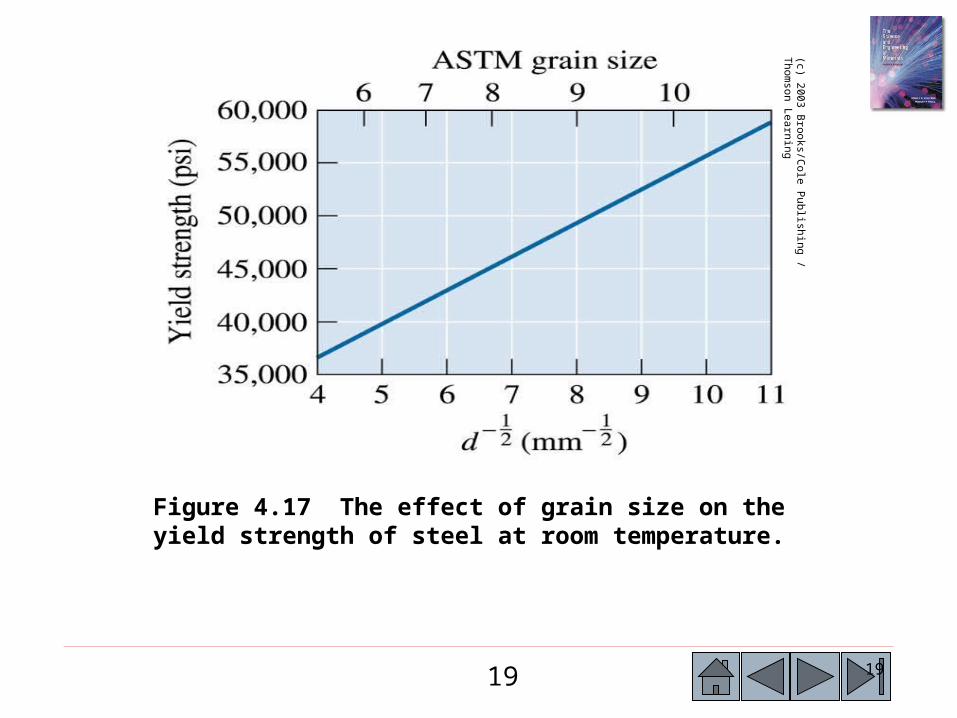
son Learning
Figure 4.17 The effect of grain size on the yield strength of steel at room temperature.

20 20
Suppose we count 16 grains per square inch in a photomicrograph taken at magnification 250. What is the ASTM grain size number?
Example 4.14 SOLUTION
If we count 16 grains per square inch at magnification 250, then at magnification 100 we must have:
N = (250/100)2 (16) = 100 grains/in.2 = 2n-1
Log 100 = (n – 1) log 2
2 = (n – 1)(0.301)
n = 7.64
Example 4.14 Calculation of ASTM Grain Size Number
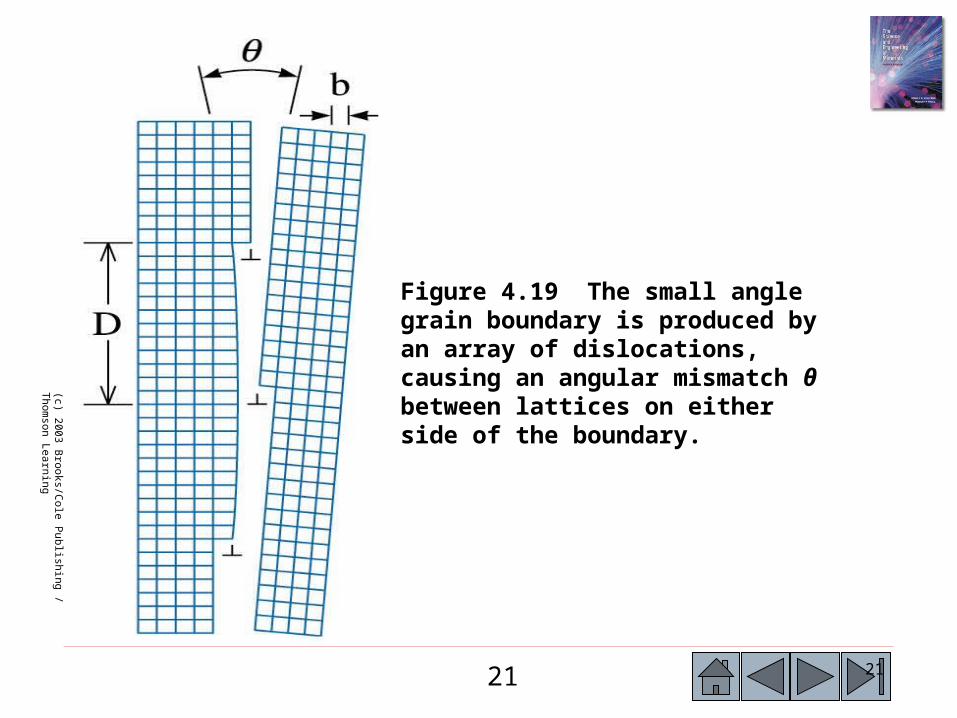
21 21
(c) 2003 Brooks/C
ole Publishing / Thom
son Learning
Figure 4.19 The small angle grain boundary is produced by an array of dislocations, causing an angular mismatch θ between lattices on either side of the boundary.

22 22
(c) 2003 Brooks/C
ole Publishing / Thom
son Learning
Figure 4.20 Application of a stress to the perfect crystal (a) may cause a displacement of the atoms, (b) causing the formation of a twin. Note that the crystal has deformed as a result of twinning.

23 23
(c) 2003 Brooks/C
ole Publishing / Thom
son Learning
Figure 4.20 (c) A micrograph of twins within a grain of brass (x250).

24 24
Figure 4.24 The microstructure of BMT ceramics obtained by compaction and sintering of BMT powders. (Courtesy of H. Shirey.)

2525
©2003 Brooks/Cole, a division of Thomson Learning, Inc. Thomson Learning™ is a trademark used herein under license.
Figure 9.7 Mg0 and Ni0 have similar crystal structures, ionic radii, and valences; thus the two ceramic materials can form solid solutions.

2626
©20
03 B
rook
s/C
ole,
a d
ivis
ion
of T
hom
son
Lea
rnin
g, I
nc.
Tho
mso
n L
earn
ing ™
is a
trad
emar
k us
ed h
erei
n un
der
lice
nse.
Figure 9.8 The effects of several alloying elements on the yield strength of copper. Nickel and zinc atoms are about the same size as copper atoms, but beryllium and tin atoms are much different from copper atoms. Increasing both atomic size difference and amount of alloying element increases solid-solution strengthening.

2727
©2003 Brooks/Cole, a division of Thomson Learning, Inc. Thomson Learning™ is a trademark used herein under license.
Figure 9.9 The effect of additions of zinc to copper on the properties of the solid-solution-strengthened alloy. The increase in % elongation with increasing zinc content is not typical of solid-solution strengthening.
28 28
Dispersion strengthening - Increasing the strength of a material by forming more than one phase.
Matrix - The continuous solid phase in a complex microstructure.
Precipitate - A solid phase that forms from the original matrix phase when the solubility limit is exceeded.
Eutectic - A three-phase invariant reaction in which one liquid phase solidifies to produce two solid phases.
Section 10.1 Principles and Examples of Dispersion Strengthening

29 29
Figure 10.1 Considerations for effective dispersion strengthening: (a) The precipitate phase should be hard and discontinuous.
(c)2003 Brooks/Cole, a division of Thomson Learning, Inc. Thomson Learning™ is a trademark used herein under license.

30 30
Figure 10.1 Considerations for effective dispersion strengthening: (b) The dispersed phase particles should be small and numerous.
(c)2003 Brooks/Cole, a division of Thomson Learning, Inc. Thomson Learning™ is a trademark used herein under license.

31 31
Figure 10.1 Considerations for effective dispersion strengthening: (c) The dispersed phase particles should be round rather than needlelike.
(c)2003 Brooks/Cole, a division of Thomson Learning, Inc. Thomson Learning™ is a trademark used herein under license.
32 32
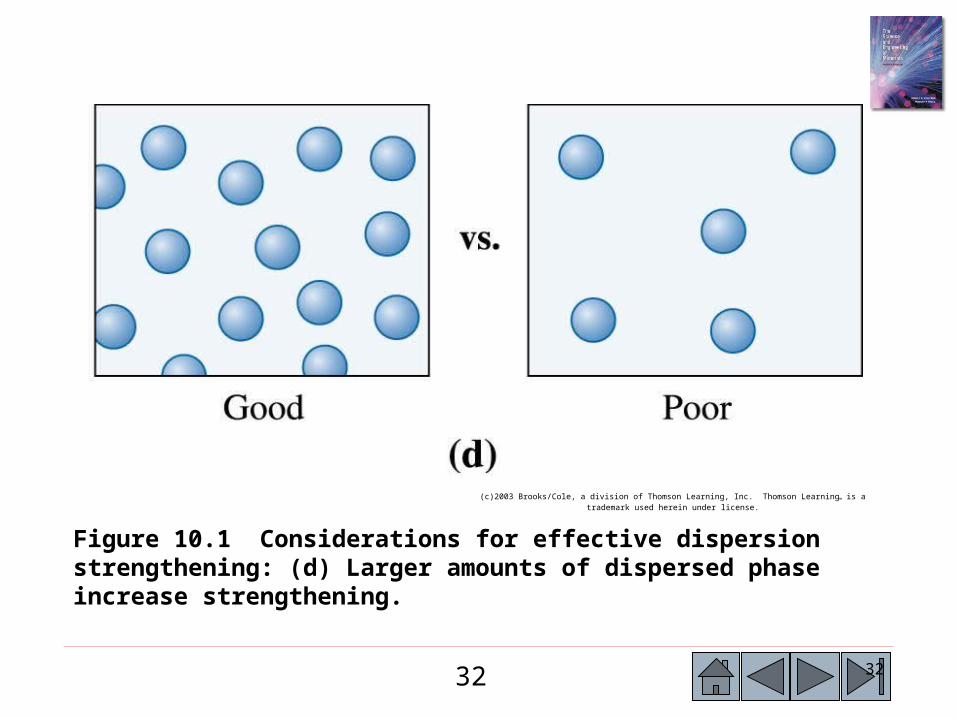
Figure 10.1 Considerations for effective dispersion strengthening: (d) Larger amounts of dispersed phase increase strengthening.
(c)2003 Brooks/Cole, a division of Thomson Learning, Inc. Thomson Learning™ is a trademark used herein under license.
33 33
Intermetallic compound - A compound formed of two or more metals that has its own unique composition, structure, and properties.
Stoichiometric intermetallic compound - A phase formed by the combination of two components into a compound having a structure and properties different from either component.
Nonstoichiometric intermetallic compound - A phase formed by the combination of two components into a compound having a structure and properties different from either component.
Ordered crystal structure - Solid solutions in which the different atoms occupy specific, rather than random, sites in the crystal structure.
Section 10.2 Intermetallic Compounds
3434
Phase - Any portion including the whole of a system, which is physically homogeneous within it and bounded by a surface so that it is mechanically separable from any other portions.
Gibbs phase rule - Describes the number of degrees of freedom, or the number of variables that must be fixed to specify the temperature and composition of a phase (2 + C = F + P, where pressure and temperature can change, 1 + C = F + P, where pressure or temperature is constant).
P-T diagram - A diagram describing thermodynamic stability of phases under different temperature and pressure conditions (same as a unary phase diagram).
Section 9.1 Phases and the Phase Diagram

3535
©2003 Brooks/Cole, a division of Thomson Learning, Inc. Thomson Learning™ is a trademark used herein under license.
Figure 9.1 Illustration of phases and solubility: (a) The three forms of water – gas, liquid, and solid – are each a phase. (b) Water and alcohol have unlimited solubility. (c) Salt and water have limited solubility. (d) Oil and water have virtually no solubility.

3636
Binary phase diagram - A phase diagram for a system with two components.
Ternary phase diagram - A phase diagram for a system with three components.
Isomorphous phase diagram - A phase diagram in which components display unlimited solid solubility.
Liquidus temperature - The temperature at which the first solid begins to form during solidification.
Solidus temperature - The temperature below which all liquid has completely solidified.
Section 9.5 Isomorphous Phase Diagrams

3737
Figure 9.10 (a) The equilibrium phase diagrams for the Cu-Ni and NiO-MgO systems. (b) The liquidus and solidus temperatures are shown for a Cu-40% Ni alloy. (c) and (d) Systems with solid solution maxima and minima. (Source: Adapted from Introduction to Phase Equilibria, by C.G. Bergeron, and S.H. Risbud. Copyright © 1984 American Ceramic Society. Adapted by permission.)

3838
From the phase diagram for the NiO-MgO binary system [Figure 9.10(b)], describe a composition that can melt at 2600oC but will not melt when placed into service at 2300oC.
Example 9.5 NiO-MgO Isomorphous System
Figure 9.10 (b) The liquidus and solidus temperatures are shown for a Cu-40% Ni alloy.

3939
©20
03 B
rook
s/C
ole,
a d
ivis
ion
of T
hom
son
Lea
rnin
g, I
nc.
Tho
mso
n L
earn
ing ™
is a
trad
emar
k us
ed h
erei
n un
der
lice
nse.
Figure 9.5 The solubility of zinc in copper. The solid line represents the solubility limit; when excess zinc is added, the solubility limit is exceeded and two phases coexist.

4040
©20
03 B
rook
s/C
ole,
a d
ivis
ion
of T
hom
son
Lea
rnin
g, I
nc.
Tho
mso
n L
earn
ing ™
is a
trad
emar
k us
ed h
erei
n un
der
lice
nse.
Figure 9.2 Schematic unary phase diagram for magnesium, showing the melting and boiling temperatures at one atmosphere pressure.

4141
©20
03 B
rook
s/C
ole,
a d
ivis
ion
of T
hom
son
Lea
rnin
g, I
nc.
Tho
mso
n L
earn
ing ™
is a
trad
emar
k us
ed h
erei
n un
der
lice
nse.
Figure 9.15 The mechanical properties of copper-nickel alloys. Copper is strengthened by up to 60% Ni and nickel is strengthened by up to 40% Cu.

4242
©20
03 B
rook
s/C
ole,
a d
ivis
ion
of T
hom
son
Lea
rnin
g, I
nc.
Tho
mso
n L
earn
ing ™
is a
trad
emar
k us
ed h
erei
n un
der
lice
nse.
Figure 9.16 The change in structure of a Cu-40% Ni alloy during equilibrium solidification. The nickel and copper atoms must diffuse during cooling in order to satisfy the phase program and produce a uniform equilibrium structure.

43 43
(c)2003 Brooks/Cole, a division of Thomson Learning, Inc. Thomson Learning™ is a trademark used herein under license.
Figure 10.8 the lead-tin equilibrium phase diagram.

44 44
(c)2
003
Bro
oks/
Col
e, a
div
isio
n of
Tho
mso
n L
earn
ing,
Inc
. T
hom
son
Lea
rnin
g ™ is
a tr
adem
ark
used
her
ein
unde
r li
cens
e.
Figure 10.9 Solidification and microstructure of a Pb-2% Sn alloy. The alloy is a single-phase solid solution.
45 45
(c)2003 Brooks/Cole, a division of Thomson Learning, Inc. Thomson Learning™ is a trademark used herein under license.
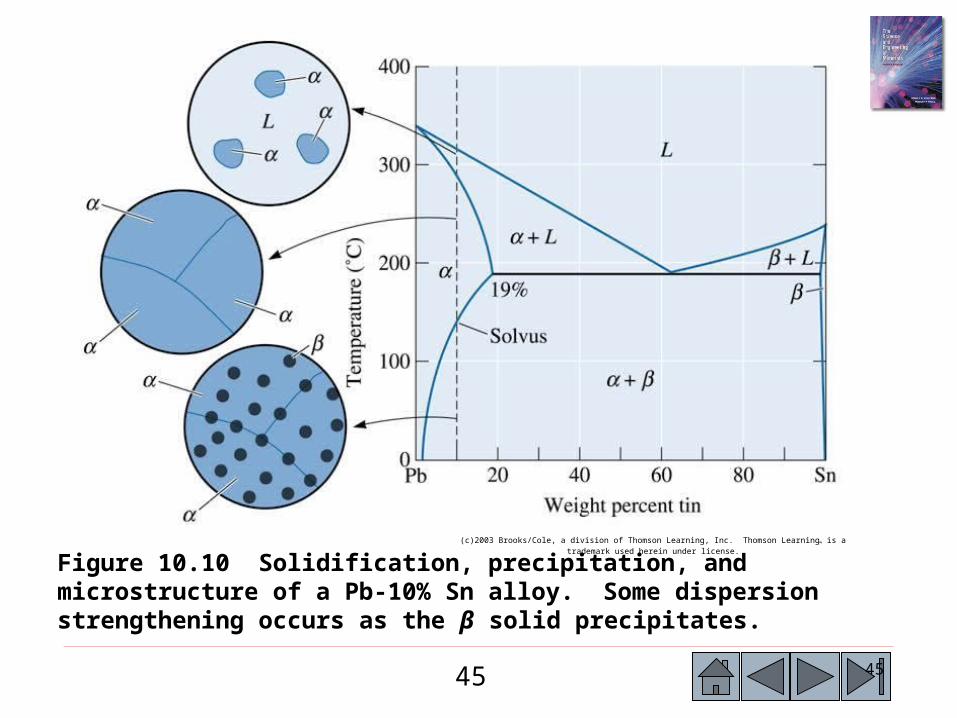
Figure 10.10 Solidification, precipitation, and microstructure of a Pb-10% Sn alloy. Some dispersion strengthening occurs as the β solid precipitates.

46 46
(c)2
003
Bro
oks/
Col
e, a
div
isio
n of
Tho
mso
n L
earn
ing,
Inc
. T
hom
son
Lea
rnin
g ™ is
a tr
adem
ark
used
her
ein
unde
r li
cens
e.
Figure 10.7 A hypothetical phase diagram (for Example 10.2)
47 47
©20
03 B
rook
s/C
ole,
a d
ivis
ion
of T
hom
son
Lea
rnin
g, I
nc.
Tho
mso
n L
earn
ing ™
is a
trad
emar
k us
ed h
erei
n un
der
lice
nse.
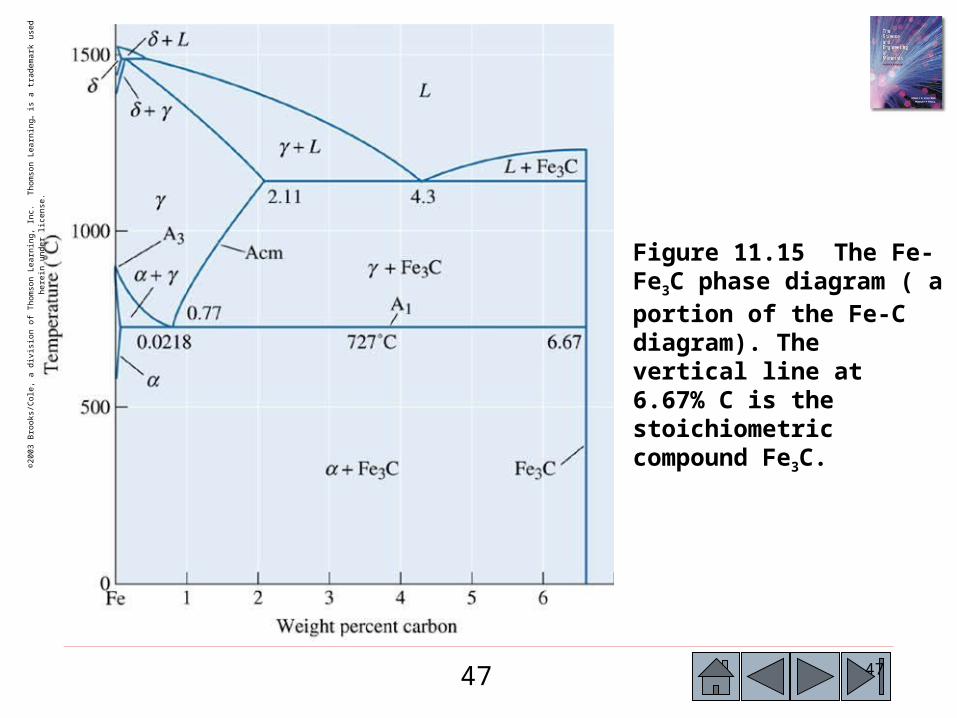
Figure 11.15 The Fe-Fe3C phase diagram ( a portion of the Fe-C diagram). The vertical line at 6.67% C is the stoichiometric compound Fe3C.

48 48
(c)2003 Brooks/Cole, a division of Thomson Learning, Inc. Thomson Learning™ is a trademark used herein under license.
Figure 10.6 The five most important three-phase reactions in binary phase diagrams.


![[Ashcroft & Mermin]Solid State Physics Solution](https://img.pdfslide.us/doc/110x75/55344d125503469d708b4a7d/ashcroft-merminsolid-state-physics-solution.jpg)