Embed Size (px)
Citation preview
3/1/2010
1
Alessandro Anzalone, Ph.D.
Hillsborough Community College, Brandon Campus
1. Introduction2. Background and Fundamental Concepts3. Bills of Material4. The MRP “Explosion”5. Other MRP Issues6. Potential MRP Challenges7. Enterprise Resource Planning (ERP)8. Business Environment Issues9. References

3/1/2010
2
The fundamental concept behind material requirements planning (MRP) is really quite simple. As an analogy, suppose you have been assigned by your family to plan the meals this week. Probably the first thing you would do is to fill out a menu. To continue, suppose that for dinner
i h h l d l i di h N h ? Y ld tonight you have planned lasagna as a main dish. Now what? You would start to answer the question by counting how many people you need to serve, thereby figuring out how much lasagna to make. Logically, you would then need to find out what ingredients are used to make the lasagna, and then find the process steps to prepare the ingredients. Both of these are typically found on the recipe. Once you know the ingredients, you need to figure how much of each do you need for the amount of lasagna you plan to make. Then you would typically find out how much you need to buy given that you may already have some of the how much you need to buy, given that you may already have some of the ingredients on hand. You also need to figure timing. If, for example, it takes 90 minutes to bake the lasagna, 1 hour to prepare the ingredients, and 2 hours to shop for the necessary ingredients, you would need to start the process at least 4.5 hours prior to the scheduled meal time.
The process described above is precisely how basic MRP works. The major difference is in the terminology and the structured formality associated with MRP. The following are the associated MRP terms with the examples above:
The menu calling for the lasagna—called the master schedule The list of ingredients — called the bill of materials The process steps to make the lasagna—called the process routing The total amount needed of any ingredient—called the gross
requirement The amount needed to buy, after subtracting inventory—called the net
requirements The time it takes to perform all the steps—called the lead time The time it takes to perform all the steps called the lead time The time to start the buying process offset for lead time—called the
planned order release.

3/1/2010
3
The fundamental concepts inherent with MRP have been known for many years before those concepts were effectively used. Prior to MRP use, most companies used variations of the reorder point system, where inventory was allowed to shrink to a certain critical reorder quantity, at
hi h i d d l i h i d d i h which time a standard replenishment quantity was ordered—in other words, the basic reorder point model commonly used for independent inventory.
The major reason MRP was not used was the very significant quantity of calculations required. It was not until the availability of relatively powerful, reliable, and cost-effective computers that an MRP system really became viable.
The Problem with Reorder Points
The reorder points described above are typically found with independent demand inventory. Independent demand inventory is inventory whose d d i i d d f i l i l d i i Th i l demand is independent of internal operational decisions. The typical dependency is only on external customer demand. Independent demand inventory is therefore typically the finished goods of the operation or customer demand for spare parts used to service a product. Dependent demand inventory, on the other hand, is inventory whose demand is based on internal decisions—usually how much of a product we choose to make and when we choose to make it. This may or may not equal the external customer demand for the product.

3/1/2010
4
To return to the earlier analogy, suppose we recognize the need to feed six people with our lasagna dinner, with each person expected to eat about 0.4 kg of lasagna. That would call for 2.4 kg to be made. Dinner time is at 6:00 pm, meaning we should start the preparations at 1:30 pm Our d i i h i k k ( lik l f ) d b decision, however, is to make 4 kg (we like leftovers), and because we would like to do something else in the afternoon, we will start the preparation at 8:00 am and just plan on reheating the meal at the proper time. The 2.4 kg represents the independent demand for our meal, but the demand for timing and quantity of lasagna noodles (dependent demand) is based on the need to make 4 kg with the process starting at 8:00 am, because that was our internal decision.
Reorder points do not work well in most dependent demand situations because of order quantities and lead times. If the replenishment quantity is ordered from an outside supplier, the lead time is often quoted by the supplier. The issue is different if the replenishment
i i b i d d i h ’ i h quantity is being produced in the company’s operation, however. Calculating or estimating lead time can be a somewhat complex issue for most operations. The elapsed time comes from several sources, including:
Purchasing lead time (raw material delivery lead time) — the time it takes a supplier to deliver the part, if it is purchased from an outside source.
Move time—the time it takes to move a job from one operation to Move time the time it takes to move a job from one operation to another.
Setup time—the time to set up the equipment to perform a defined job.
3/1/2010
5
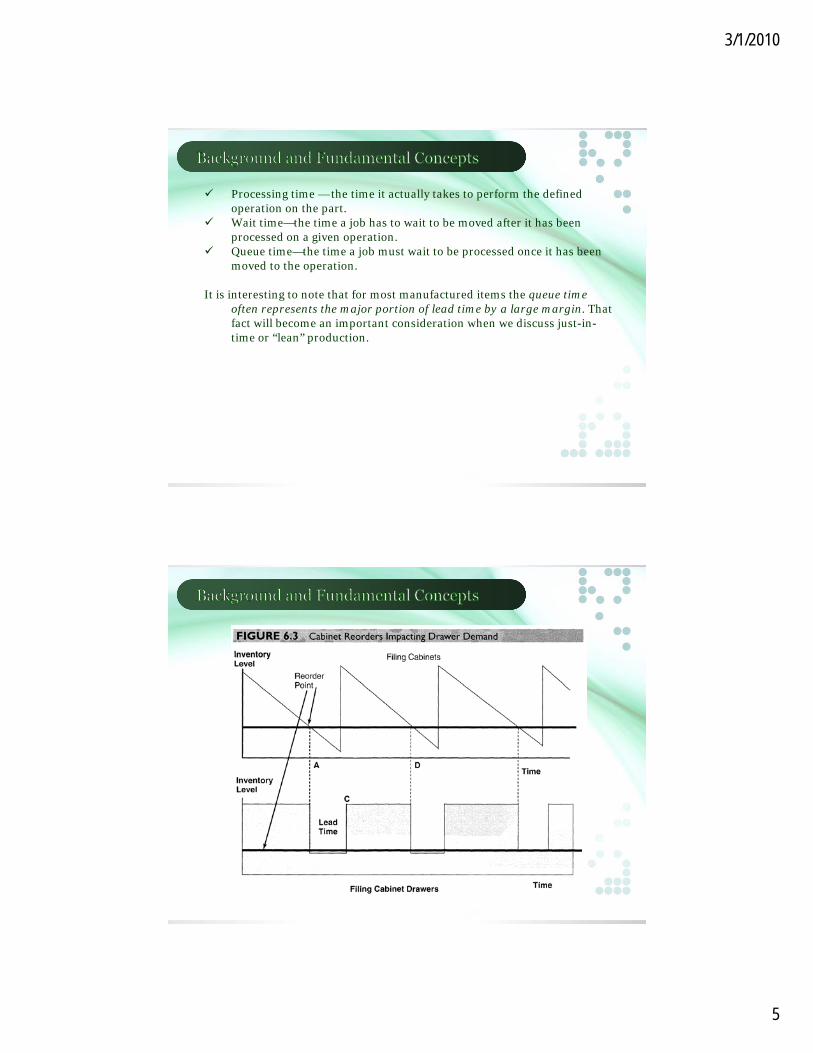
Processing time — the time it actually takes to perform the defined operation on the part.
Wait time—the time a job has to wait to be moved after it has been processed on a given operation.
Q i h i j b i b d i h b Queue time—the time a job must wait to be processed once it has been moved to the operation.
It is interesting to note that for most manufactured items the queue time often represents the major portion of lead time by a large margin. That fact will become an important consideration when we discuss just-in-time or “lean” production.

3/1/2010
6
The problem with this “lumpy” demand for the dependent demand inventory items comes primarily from batch lot sizes, and the reason it is not desirable is clear from the previous figure. All the material in stock of the drawers (shown in the diagram as the shaded area under the drawer
i li ) i l diffi l i quantity line) represents inventory — costly, difficult to store inventory. This pattern is repeated for other dependent components (for example, raw steel, locks, handles, etc.).
The MRP solution comes from a simple premise: If we can project requirements, then with knowledge of the starting inventory we should be able to predict or calculate when the reorder point for the finished cabinets will take place. Knowing that, we should be able to keep the inventory of the drawers low until just before we need them to build the inventory of the drawers low until just before we need them to build the next batch of finished cabinets. That situation is shown in the following figure.

3/1/2010
7
At this point it will be helpful to examine the structure and use of the bills of material in more detail. They are also sometimes called a product structure since that is what they indicate, much as the recipe list in our lasagna example.
We can start with a very simple example, a skateboard. The skateboard has a very simple bill of materials, especially if we assume we purchase the wheels ready for mounting on the axles.
This bill of materials is classified as three levels deep. The first level, designated by the final product, is often called level zero. The next level, with the board and wheel assemblies, is called level one, and the level with the axle and wheels is level two This shows the relationship with the axle and wheels is level two. This shows the relationship graphically, but in most systems this data is stored as a list, with the various levels indented (called an indented bill of materials). In our example, the indented bill would be:

3/1/2010
8
The product or subassembly that uses a given component is often called a parent. In this example, the wheel assembly is the parent of the wheels and axle. The skateboard itself is the parent of the board and the two wheel assemblies. Also note that there is a multiplicative relationship. I h fi i h d k b d h f h l Th bill f i l In the finished skateboard there are four wheels. The bill of materials shows two wheels for each wheel assembly and two wheel assemblies for each finished skateboard, making a total of four wheels.
With the MPS (the menu), the bills of material (the recipe), and existing inventory, there is almost enough information to calculate the planned orders for the components. Some additional information is needed, often found on a data file called the item master. Along with other
f l i f i h i i ll ill i i f i useful information, the item master typically will contain information on the lead times and lot sizes. There is almost always exactly one item master file for each component used in the facility.
The calculation that takes all this information and computes planned orders for the components is often called an explosion, because as the calculation starts at the parent level it “fans out” into lower levels of the bill of materials, looking like an explosion of calculations.

3/1/2010
9
The basic MRP record appears as follows. Notice that although variations exist, a common approach is to show requirements in weekly “buckets.” The explanation of each row is:
G i h l d d i f h i Gross requirements represent the total needed quantity for the item on a week-by-week basis—they are the quantity to be used during the period. At the top level of the bill of materials the gross requirements usually represent the primary input for generating most component requirements. If the item being planned is one level below the product planned in the master schedule, the gross requirements for that item are primarily the MPS values for the product planned by a master schedule.

3/1/2010
10
Scheduled receipts represent orders that have already been committed, either as a production order or a purchasing order. They are important because they represent actual commitment of resources from the firm. The quantity and timing are, as the name indicated, what you are
h d l d i d d b il bl h b i i f scheduled to receive, and assumed to be available at the beginning of the period. Because these do represent firm commitments, generally they cannot be freely moved by the computer logic. If the logic does show they should be moved or changed in quantity, generally the system will generate an exception message suggesting the move. The general “rule of thumb” is to not let a computer commit the resources of the firm without human review.
Projected available represents the inventory available of the component at Projected available represents the inventory available of the component at the end of the weekly bucket.
Net requirements are the amount needed for the week after the gross requirements have been netted against available inventory and/or scheduled receipts.
Pl d d l h i f i h Planned order releases are the quantity of net requirements that are planned to be ordered or released at the beginning of the period, taking into account lot sizes and offsetting for lead times. Planned order releases are usually calculated by the computer, and the computer logic is free to move them or change quantity based on the programmed rules (such as lot size). Unlike scheduled receipts, they do not represent actual resource commitments from the firm, merely when you plan to release an order based on the information available at the present time. The planned order releases represent the primary output of MRP as The planned order releases represent the primary output of MRP, as they represent what must be purchased or produced in both quantity and timing. They therefore represent primary input into detailed capacity planning, the purchasing system, and the production activity control systems that schedule and control the actual production of the orders.

3/1/2010
11
Using this information, let us proceed with filling out the MRP record. We always start at the top of the bill of materials — in this case, assembly X. Since assembly X is used in another product, the demand that becomes the gross requirements for X most likely comes directly from the MPS
l f h dvalues of the parent product.

3/1/2010
12

3/1/2010
13
With this information, we are ready to generate the record for part A. Notice on the bill of materials that part A is used to build part X, and that there are two part As required to make one part X. The first thing we need to look for is the gross requirements for part A. Note that part A is not sold
h Th l i f A f h d to the customer. The only requirement for part A comes from the need to build X. For that reason we look for when we plan to build X and the quantity needed to build X, not when we sell X or how many we sell. The timing and the quantity of the gross requirements for A comes, therefore, from when we plan to build X, which is found in the planned order release row of the item X record. This then represents a fundamental principle of MRP:
The gross requirements for any component come directly from the The gross requirements for any component come directly from the planned order releases of the parent component.

3/1/2010
14

3/1/2010
15

3/1/2010
16
Common Lot Sizing Rules
While there are several lot sizing rules that have been developed, some thatare seldom are beyond the scope of this book. The more common rules are:
Lot for lot. This rule was described earlier in the example. It basically says you order the exact quantity needed to meet the net requirements for the period being evaluated
Fixed quantity. As the name implies, this rule says you order the same quantity each time you order. The most common reasons would be that the quantity results from an economic analysis showing that quantity is the lowest total cost to produce or procure or that there is some standard packaging used and therefore all orders need to be in multiples standard packaging used and therefore all orders need to be in multiples of that package quantity. If the quantity comes from the economic analysis case, often the fixed lot size represents the minimum quantity that must be ordered, while in the packaging case the quantity implies that any requirement above the stated lot size must be ordered in integer multiples of the stated lot size.
Least unit cost. This method tries to evaluate ordering several periods’ worth of requirements in order to possibly take advantage of a quantity discount for the item. Perhaps the easiest way to illustrate is with an example. An item has an order cost of $50 per order, a base
i f $ h b i di i f $ i i price of $300 each, but a quantity discount price of $270 per item is offered if the quantity purchased is 500 or more units. There is an inventory carrying cost of $1 per item for every period the item is held in inventory. The per period requirements for the item over the next six periods are given as:

3/1/2010
17
Based on the information above, the following table shows the least unitcost analysis:
Least Period Cost. This method is very closely related to the least unit cost method, but evaluates on the basis of cost per period rather than cost per unit. Taking the data from the least unit cost example above, we can see how this calculation works:

3/1/2010
18
Generation of Data
The calculation of all this data for all the products in a dynamic manufacturing environment is almost always an issue. There are two b i h i h i ibasic approaches, with variations:
Regeneration. This process involves taking all the necessary data (MPS, inventory data, bill of materials [BOMs], item master data) and doing the calculations completely. This method takes a very large amount of computation time, but since the output is usually printed and typically not stored on the computer, it does save on computer memory. This method was the original method used by many companies when computer memories were small and purchasing additional memory was computer memories were small and purchasing additional memory was very expensive. Many modern systems do not use regeneration unless policies emanating from the business environment dictate its use. It does tend to take a fairly long time in many environments and the dynamic nature of most operations imply that the data starts to become old and irrelevant almost as soon as it is generated, especially since many companies will only regenerate about once a week.
Generation of Data
Net Change. This process means that all data (inventory, order completion, customer orders, etc.) are input into the computer and process as soon
h Thi k li l i d b i l as they occur. This takes very little time to do, but requires a very large amount of computer memory, as all the information is kept online and in real-time.
Batch. This approach really combines the two approaches. It keeps most of the information online for immediate access, but does not immediately update changes. Instead, data changes are kept in a subfile and periodically all the information is used to update the records. The time between batch updates is dictated by the facility and many systems between batch updates is dictated by the facility, and many systems today use batch updates so effectively that there is little substantial difference between batch and net change to the user. It does make a great deal of difference in the computer memory demand, however.

3/1/2010
19
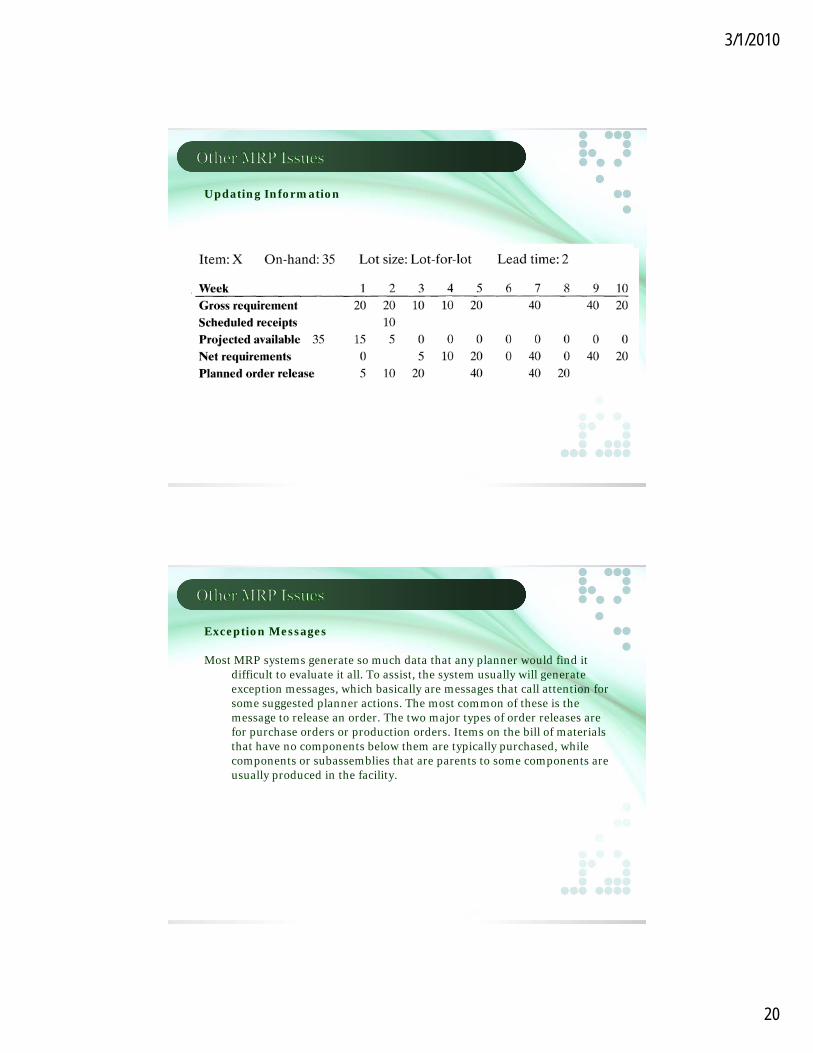
Updating Information
As time passes and production activity occurs, the records should be updated in order to ensure correct information is being used for decision
ki A l l l k i h d f i X i making. As an example, let us look again at the record for item X in our example above:
Updating Information
3/1/2010
20
Updating Information
Exception Messages
Most MRP systems generate so much data that any planner would find it difficult to evaluate it all. To assist, the system usually will generate
i hi h b i ll h ll i f exception messages, which basically are messages that call attention for some suggested planner actions. The most common of these is the message to release an order. The two major types of order releases are for purchase orders or production orders. Items on the bill of materials that have no components below them are typically purchased, while components or subassemblies that are parents to some components are usually produced in the facility.

3/1/2010
21
Exception Messages
Other Sources of Demand
Service parts. Even if an item is generally considered as a dependent demand item, sometimes it can also experience demand from i d d A l l k bi l i C i l h independent sources. As an example, look at a bicycle tire. Certainly the major demand for bicycle tires is to make bicycles, but it is also possible to buy just a tire as a replacement for an older bicycle. Many items that typically have dependent demand also have independent or service demand. Such demand should be recognized and accommodated in the MRP record. Let’s take our item B from the example.
3/1/2010
22
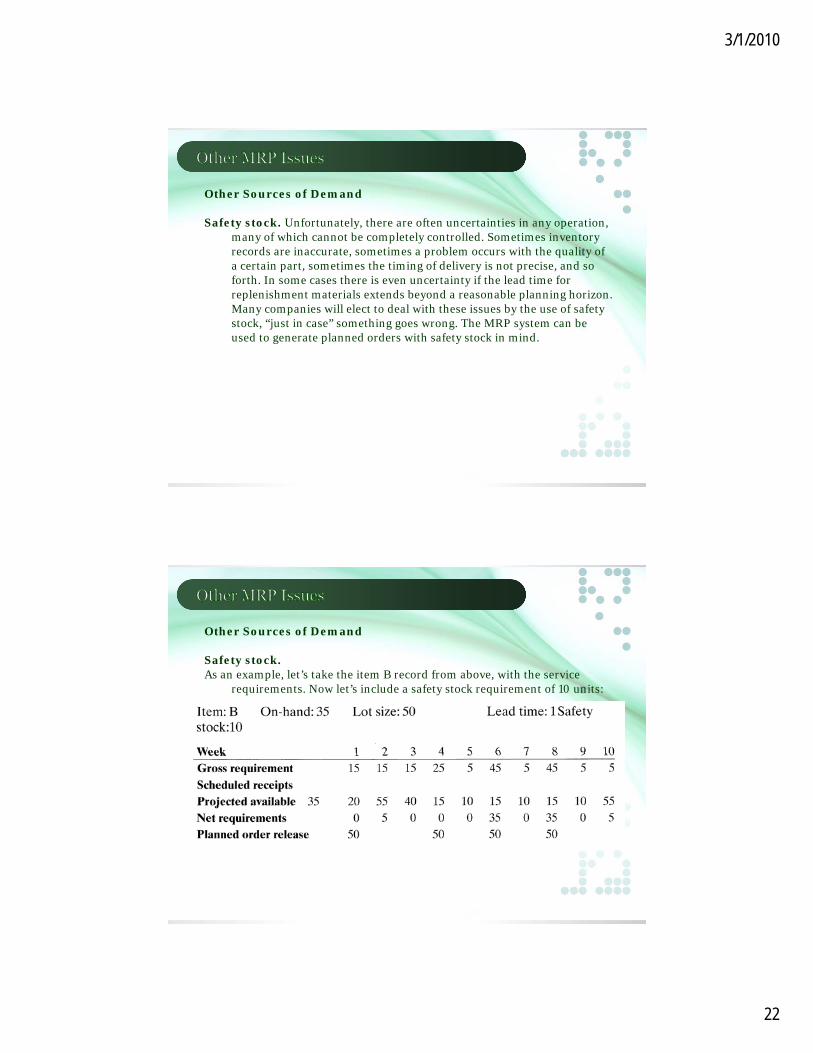
Other Sources of Demand
Safety stock. Unfortunately, there are often uncertainties in any operation, many of which cannot be completely controlled. Sometimes inventory
d i i bl i h h li f records are inaccurate, sometimes a problem occurs with the quality of a certain part, sometimes the timing of delivery is not precise, and so forth. In some cases there is even uncertainty if the lead time for replenishment materials extends beyond a reasonable planning horizon. Many companies will elect to deal with these issues by the use of safety stock, “just in case” something goes wrong. The MRP system can be used to generate planned orders with safety stock in mind.
Other Sources of Demand
Safety stock. As an example, let’s take the item B record from above, with the service
i N l ’ i l d f k i f irequirements. Now let’s include a safety stock requirement of 10 units:

3/1/2010
23
Other Sources of Demand
Quality yield. Some processes are just not able to produce 100% quality for an entire batch. When a yield problem is known, the system can once
i b d d h i i L i again be used to accommodate the situation. Let us again return to our example. Suppose the process used to make component D has a yield of 90%, meaning that historically on average only 90% of the parts made on the process have an acceptable level of quality. Let’s look at the original record and the new record with the yield built in:
Other Sources of Demand
Engineering design changes. The fact that MRP is a “forward-looking” scheduling approach makes it ideal for dealing with design changes in h d U i h j d il bl b l fi il the product. Using the projected available balance figure, we can easily
see when the inventory will be very low, or even equal to zero, allowing us to time a design change with a minimal impact on making existing inventory obsolete. To allow the system to plan the new inventory requirement, then, all that need be done is to build the new part number into the BOM with an effective date and allow the system to plan its need.

3/1/2010
24
Other Sources of Demand
Pegging. From time to time there are unforeseen problems with a lower-level item in the bill of materials. For example, in our case what h if h li f C i f h h d f happens if the supplier for part C informs us that the order for 300 units in week 1 will be a week late? How will that affect our production and, more importantly, our customer orders? To obtain that information, we use a concept called pegging, which essentially allows the system to work its way back up the bill of materials and determine which parent assemblies or even which customer orders will be impacted by the late purchase order. In this way customers can be notified or contingency plans activated long before the late order becomes a potential crisis Replanning based on using pegging data is becomes a potential crisis. Replanning based on using pegging data is often called bottom-up replanning.
Other Sources of Demand
Firm planned orders. Changes in customer orders tend to be frequent in many operations, and since the change usually occurs in the top level of h bill f i l h ill ll the bill of materials, any change will generally generate numerous
changes in all the lower levels. Such a condition is sometimes referred to as “system nervousness,” because a little change at the top causes all the records to “shudder” in response. This condition makes planning a relatively stable environment very difficult. To prevent this from being too disruptive, the concept of the firm planned order is sometimes used. The firm planned order is used by the planner to tell the system that the planned order is to be fixed, thereby taking it out of control of the computer If the system detects that the order should be moved or computer. If the system detects that the order should be moved or changed in quantity it will not be allowed to do so automatically. Instead, the system will generate an exception message to the planner that it would like to move the order, but now it is in the discretion of the planner whether it is wise to do so or not.

3/1/2010
25
Other Sources of Demand
Allocation. In some cases there is a need to “save” some inventory aside for a special use. As an example, suppose a service technician calls the
l d h d l i h h i k f h planner and says they need to replenish their stock of a component that is used for service as well as production. Certainly this demand could be included as a service order, but if it is a “one-time” situation, it could be handled by allocation. This essentially means putting the components aside and saving them, making them unavailable for production. There are two ways to handle this. One is called a “hard allocation.” where the parts are physically removed from storage, and the inventory records are changed to reflect the withdrawal. The parts are then saved in another location until the technician can claim them The other method another location until the technician can claim them. The other method is “soft allocation.” In this method a field on the MRP record is filled in to show the part usage.Soft allocation is generally preferred, in that the real situation is shown in the record for all to see. With hard allocation, people will sometimes know the components really exist, and can get confused as to what really is available for other uses.
Other Sources of Demand
Low-level coding. Sometimes an item appears on the bill of materials multiple times, such as in our early example when item C appears twice. I h h i ill diff l l i h In some cases, however, the item will appear at a different level in the bill of materials. In our earlier case, both times item C appeared it was on level 2 of the bill. Suppose, however, that item D also needed an item C for production, as shown in the figure.
In this case item C would appear on both level 2 and level 3. Since MRP tends to make its calculation level by level, it would tend to compute need for C at level 2 and then need to again calculate when it got to level 3. To prevent that problem, items appearing multiple times on a bill of materials will generally be assigned the lowest level code on which they appear. In that way all the item Cs will be calculated together, on level 3.

3/1/2010
26
Other Sources of Demand
Planning horizon. One major issue that must be addressed is the planning horizon, or how far into the future to develop the MRP plans. The
ll li i h d di f h l i l d i answer generally lies with an understanding of the cumulative lead time of the product in question, as was discussed in the chapter on master scheduling. Using our product X as an example, let’s look at the cumulative lead times as we work our way down the bill of materials. There are three “paths” from top to bottom. One is X to A to C. The second is from X to B to C, and the third is from X to B to D. Adding the lead time for each path, we see the X-A-C path is 7 weeks (2 + 3 + 2), the X-B-C path is 5 weeks, and the X-B-D path is also 5 weeks. The longest cumulative lead time is 7 weeks meaning that is the minimal longest cumulative lead time is 7 weeks, meaning that is the minimal time horizon we need to plan for the future component procurement.
Data accuracy. As can be easily seen from the examples developed in this chapter, MRP is extremely data dependent. It uses several databases, including: Inventory count and location I d Item master records Purchasing records Bill of materials Master schedules
To the extent that any of these databases have inaccurate data or poor timing of data input, the planning system will reflect the poor data with poor planning numbers.
User knowledge. Education and training of users is very important. People who do not understand what the system does or do not understand how to use the planning numbers effectively have little chance to make it work effectively.

3/1/2010
27
Overloaded MPS. Most of the planning numbers start from the master schedule. It is of critical importance. therefore, that the master schedule be effectively developed and maintained. One of the most common problems that adversely impacts using MRP effectively is to overload h MPS F i i i l f ili i d the MPS. From time to time in almost any facility certain unexpected
problems (equipment breakdowns, absenteeism, late supplier deliveries, etc.) can cause a failure to meet all planned production in the master schedule. When this occurs, many well-meaning managers will merely push the past-due schedule into the current time period without any regard to the impact on both capacity and material usage. Such practices will eventually lead to unworkable and unrealistic schedules and ultimately turn people into skeptics with respect to the MRP planning numbersplanning numbers.
Top management commitment. Proper operation of an MRP system requires a substantial level of discipline in the organization, and in some cases a drastic change in the “corporate culture” and priority of performance measures within the organization. This is very difficult to
li h i i i i h h i l d hi f accomplish in most organizations without the active leadership of a strong top manager. The top manager must understand what the system will do for and to the organization, and they must take an active, committed role to make the organizational modifications necessary to support the use of such a system effectively.

3/1/2010
28
Capacity insensitivity. The basic MRP explosion generates planned order releases with the underlying assumption that those orders will have adequate capacity of the right type to be produced or purchased. For that reason modern systems must utilize capacity planning in
j i i h MRP S f hi i li h d i h h conjunction with MRP. Some of this is accomplished with the development of the sales and operation plan, but that plan is typically at too high a level for detailed production orders. Two other levels of capacity are generally used. The first, often called “rough-cut,” is generated from MPS data, while detailed capacity plans are generated from the MRP planned order releases.
The “push” nature of MRP. MRP represents a “push” system, meaning that orders are released according to the plan and “pushed” to the appropriate work area. The assumption is that if the plan is correct, the specific material in the designated quantity will be needed. In spite of h ibl k i d l i h l h li i h f the possible care taken in developing the plan, the reality is that often
orders are pushed to a work center before they are really needed, and sometimes not needed at all. This is because of the volatile nature of many operation environments. Some problems that can occur to cause this include:
Changes in customer orders, including timing and quantity Work center problems, such as machine breakdown Poor work standards implying the actual work on existing work in Poor work standards, implying the actual work on existing work in
the work center may take longer than planned Supplier delivery problems in which a component needed for
production is not available

3/1/2010
29
Since the output from MRP basically represents the major activity of the production facility, these numbers can in fact be used as the basis for planning most of the firm’s overall activity, including marketing, finance, engineering, and human resource needs. That has led to the d l f h i d hi i d h development of very comprehensive and sophisticated systems over the last several years. First came the generation of “closed loop” MRP, which later evolved into what was called MRP II (sometimes called manufacturing resource planning). MRP II dealt with the issue of capacity insensitivity of the basic MRP calculations by allowing capacity and resource calculations to modify the MRP plans. Lately those systems have continued to evolve into what is typically called “ERP,” which stands for enterprise resource planning
The basic premise behind ERP is that the production plans of the company derive from or in turn drive the decisions of virtually every other part of the company. In other words, the implication is that no functional area in a company can or should operate in isolation. Virtually all functions i h ( h ld b ) li k d h i h ll i in the company arc (or should be) linked together in the overall pursuit of maximizing service to the customer and achieving the financial and other strategic goals of the company. Given this fairly obvious premise, the “heart” of the planning system (MRP) can be used as the basis for developing highly integrated software that can literally be used to run the entire business. Not only are these systems integrated, but they generally use a common database, making the key data used to make company decisions available to all key functions equally. Given the growth in power flexibility functionality and ease of use of modern growth in power, flexibility, functionality, and ease of use of modern computer systems, this evolution in software linkage and integration was a logical “next step” in planning and control.

3/1/2010
30
As these systems developed and became more integrated and “seamless” in their approach to supplying functional information, the name enterprise resource planning (ERP) was given to them. This name attempted to reflect that they had expanded in their use well beyond production
l i d l d i f ld b d h i planning and control and in fact could be used to manage the entire enterprise in a functionally integrated manner. Some examples include:
Sales and Marketing, for example, provide input into future sales and can use the system for both order promising and order tracking. Distribution is also included.
Engineering can make plans for product and process changes based on production schedules and marketing plans as well as the availability of production schedules and marketing plans as well as the availability of key people with key skills.
Finance and Accounting can project cash flows and the need for investments or loans and can also track production and other costs in a more timely and effective manner. ERP also includes accounting systems such as payables and receivables.
Human Resources can project the need for people, including timing, skill levels, and quantity. They can also use the information to determine training requirements and schedules.
T h d ll h i f i d d Top management can have ready access to all the information needed to make key operating and strategic decisions.
Suppliers and Distributors can become an integral part of the planning system, making the concept of “supply chain management” more of a reality than just a conceptual point of view.
Operations, of course, can make effective plans for scheduling of work and for effective utilization of capacity and other resources Ready and for effective utilization of capacity and other resources. Ready access to all relevant planning information makes this possible.

3/1/2010
31
A modern ERP system brings great power and value to those companies that implement them successfully. Unfortunately, with the integrative nature of the systems making the successful implementation potentially very difficult, many companies have failed to achieve a truly successful
i l i d i i ll b h h ’ i d system implementation, and it is usually not because they haven’t tried hard. It takes a skillful and knowledgeable group of people to successfully build (implement) such a complex system, and also takes a similar level of skill and knowledge to manage and maintain it on an ongoing basis.
While the concepts of MRP can work in virtually any environment, the data requirements and formality of the system make it impractical for some environments. Among the most obvious is the service environment, where the “bill of materials” (if such a thing exists for many services) is
d d i h i h so dependent on customer requirements that in the most extreme cases a company may find itself designing a new bill of materials for each customer. That is a condition in which it would obviously be inappropriate to run such a formal and complex system. The same can often be said for many make-to-order (MTO) and engineer-to-order (ETO) environments because of the very large variety of end items and final product designs.

3/1/2010
32
The make-to-stock (MTS) environment is clearly a good example of a well-defined structure that would lend itself well to an MRP setting. If, however, ever, there is a relative degree of stability in demand and design of the final product, then there may be simpler methods
il bl h ill d b h h l i d f h available that will reduce both the complexity and cost of the system. The assemble-to-order (ATO) environment, however, is virtually the perfect environment for an MRP system to work well. In addition, any environment where there are environmental complexities tend to reinforce the value of MRP. Such complexities include complexities of design (lots of engineering changes or new products), complexity of demand (high variability in demand, for example), or high complexity in other environmental issues (product quality, supplier delivery, equipment availability etc ) In general an MRP system is a “forward-equipment availability, etc.). In general, an MRP system is a forward-looking” system that allows planning as opposed to reaction. The more the environment is characterized by instability, the more MRP can provide serious benefits over other systems and can often make the costs of implementing and running such a formal, structured system worthwhile.
Modern ERP systems, since they represent analysis and resource planning for virtually all aspects of the business, represent another opportunity to help the business. Specifically, their “forward-looking” nature allows managers to input data to evaluate the impacts of various scenarios on h b i h l Thi i i ll d “ h if” l i d the business as a whole. This is sometimes called “what if” analysis, and
can prove to be very insightful and valuable in making intelligent business decisions.

3/1/2010
33

3/1/2010
34
1. Stephen N. Chapman, The Fundamentals of Production Planning and Control, Prentice Hall, 2006, ISBN-13: 978-0130176158.
2. http://www.bpic.co.uk/erp3.gif3. http://www.crcinfotech.com/images/erp.jpg4. http://www.openpro.com/gifs/opmodules_enterprise.jpg5. http://www.1888pressrelease.com/imagespr/imgs/129470/white_board_screen_1.jpg