Embed Size (px)
Citation preview
2/23/2015
1
Material Requirements Planning (MRP)
and ERP 14
1
Outline► Global Company Profile:
Wheeled Coach
► Dependent Demand
► Dependent Inventory Model Requirements
► MRP Structure
► MRP Management
2
2/23/2015
2
Outline - Continued
► Lot-Sizing Techniques
► Extensions of MRP
► MRP In Services
► Enterprise Resource Planning (ERP)
3
Learning ObjectivesWhen you complete this chapter you should be able to:
1. Develop a product structure
2. Build a gross requirements plan
3. Build a net requirements plan
4. Determine lot sizes for lot-for-lot, EOQ, and POQ
4
2/23/2015
3
When you complete this chapter you should be able to:
Learning Objectives
5. Describe MRP II
6. Describe closed-loop MRP
7. Describe ERP
5
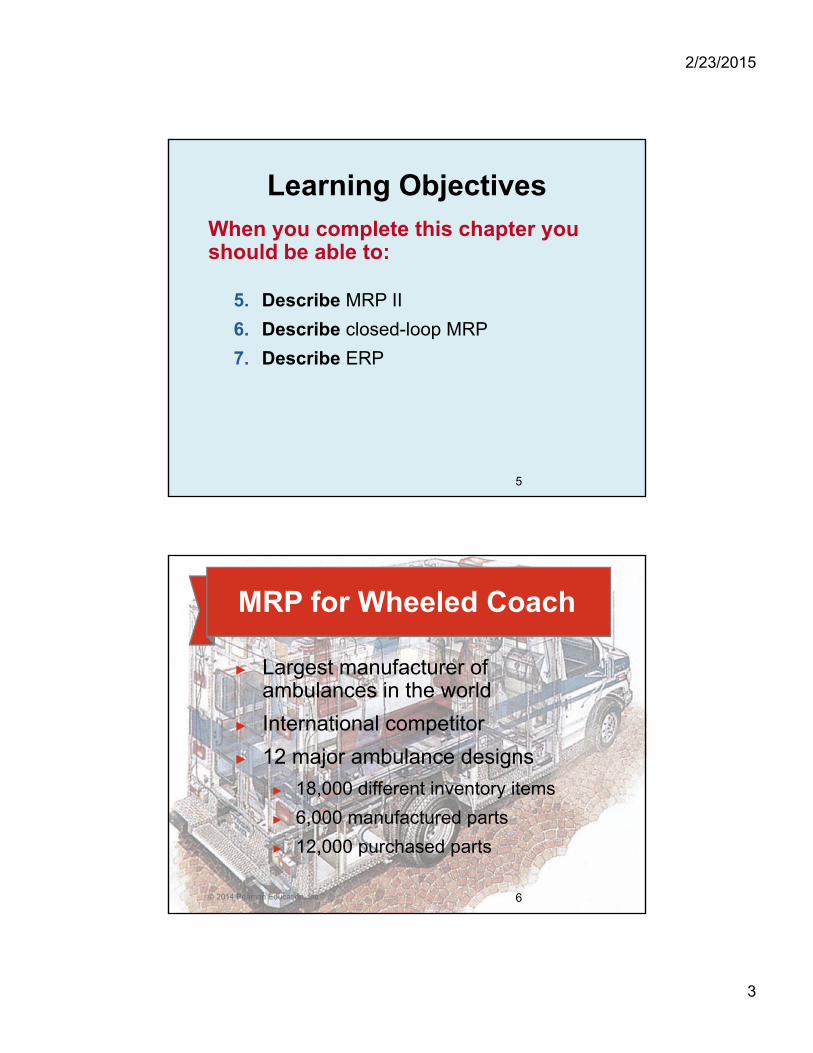
MRP for Wheeled Coach
► Largest manufacturer of ambulances in the world
► International competitor
► 12 major ambulance designs
► 18,000 different inventory items
► 6,000 manufactured parts
► 12,000 purchased parts
© 2014 Pearson Education, Inc. 6
2/23/2015
4
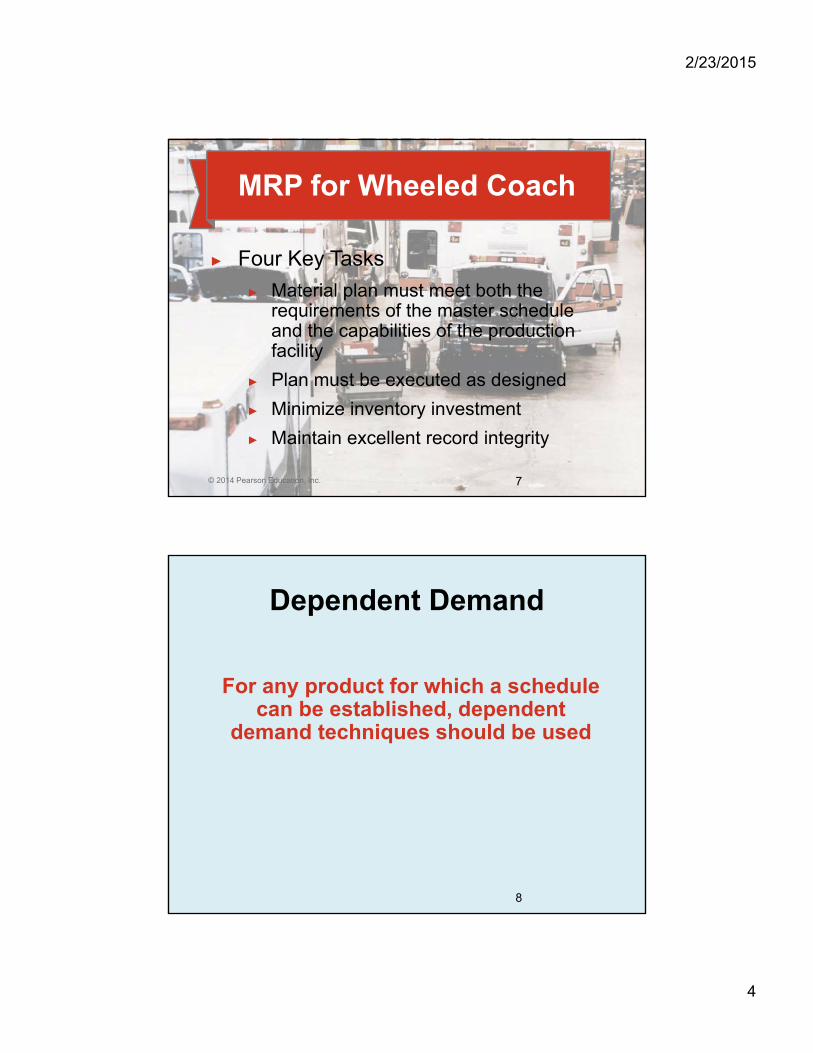
MRP for Wheeled Coach
► Four Key Tasks
► Material plan must meet both the requirements of the master schedule and the capabilities of the production facility
► Plan must be executed as designed
► Minimize inventory investment
► Maintain excellent record integrity
© 2014 Pearson Education, Inc. 7
Dependent Demand
For any product for which a schedule can be established, dependent
demand techniques should be used
8
2/23/2015
5
Dependent Demand
Benefits of MRP
1. Better response to customer orders
2. Faster response to market changes
3. Improved utilization of facilities and labor
4. Reduced inventory levels
9
Dependent Demand
▶ The demand for one item is related to the demand for another item
▶ Given a quantity for the end item, the demand for all parts and components can be calculated
▶ In general, used whenever a schedule can be established for an item
▶ MRP is the common technique
10
2/23/2015
6
Dependent Inventory Model Requirements
Effective use of dependent demand inventory models requires the following
1. Master production schedule
2. Specifications or bill of material
3. Inventory availability
4. Purchase orders outstanding
5. Lead times
11
Master Production Schedule (MPS)
▶ Specifies what is to be made and when
▶ Must be in accordance with the aggregate production plan
▶ Inputs from financial plans, customer demand, engineering, supplier performance
▶ As the process moves from planning to execution, each step must be tested for feasibility
▶ The MPS is the result of the production planning process
12
2/23/2015
7
Master Production Schedule (MPS)
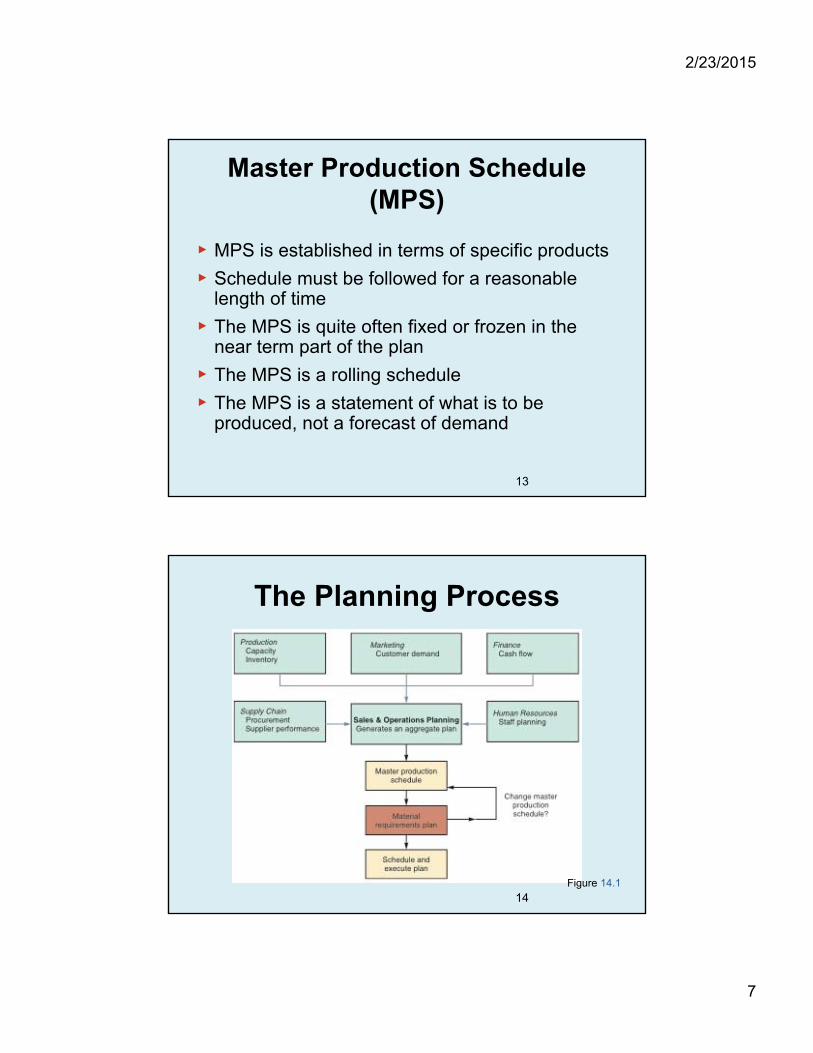
▶ MPS is established in terms of specific products
▶ Schedule must be followed for a reasonable length of time
▶ The MPS is quite often fixed or frozen in the near term part of the plan
▶ The MPS is a rolling schedule
▶ The MPS is a statement of what is to be produced, not a forecast of demand
13
Figure 14.1
The Planning Process
14
2/23/2015
8
Figure 14.1
The Planning Process
Master production schedule
Sales & Operations Planning
Generates an aggregate plan
Supply ChainProcurementSupplier
performance
Human ResourcesStaff planning
ProductionCapacityInventory
MarketingCustomer
demand
FinanceCash flow
15
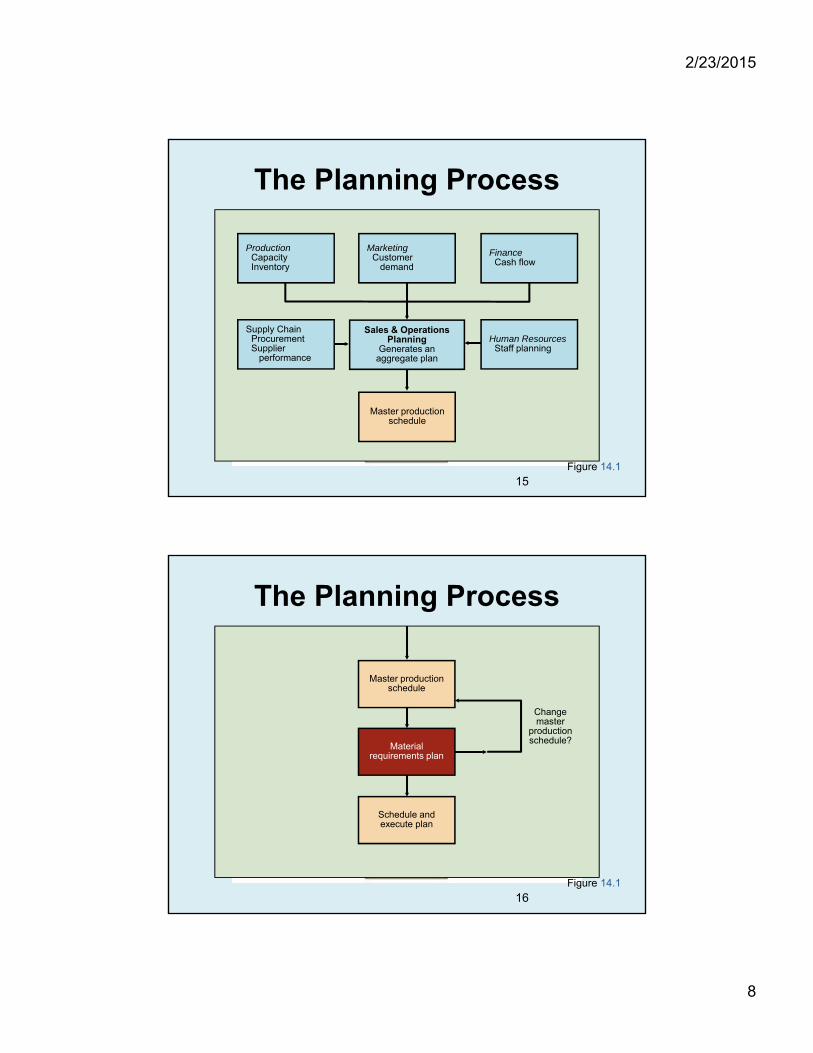
Figure 14.1
The Planning Process
Schedule and execute plan
Change master
production schedule?
Material requirements plan
Master production schedule
16
2/23/2015
9
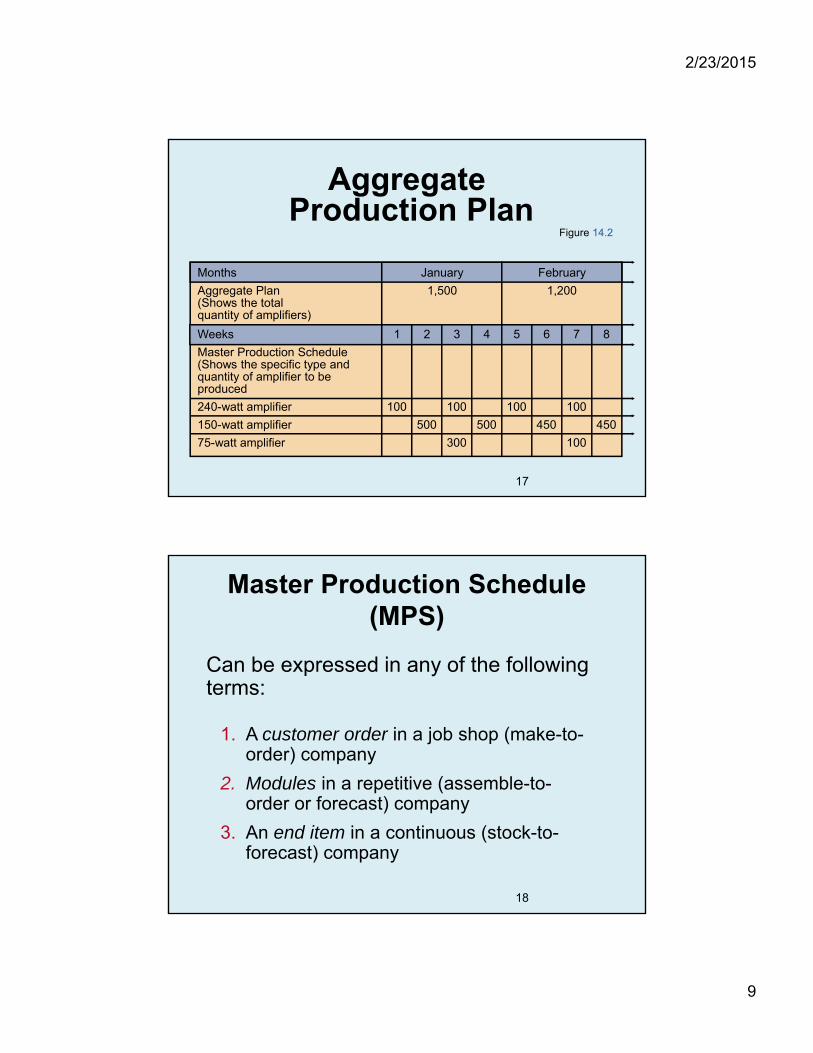
AggregateProduction Plan
Months January February
Aggregate Plan 1,500 1,200(Shows the totalquantity of amplifiers)
Weeks 1 2 3 4 5 6 7 8
Master Production Schedule(Shows the specific type andquantity of amplifier to beproduced
240-watt amplifier 100 100 100 100
150-watt amplifier 500 500 450 450
75-watt amplifier 300 100
Figure 14.2
17
Master Production Schedule (MPS)
Can be expressed in any of the following terms:
1. A customer order in a job shop (make-to-order) company
2. Modules in a repetitive (assemble-to-order or forecast) company
3. An end item in a continuous (stock-to-forecast) company
18
2/23/2015
10
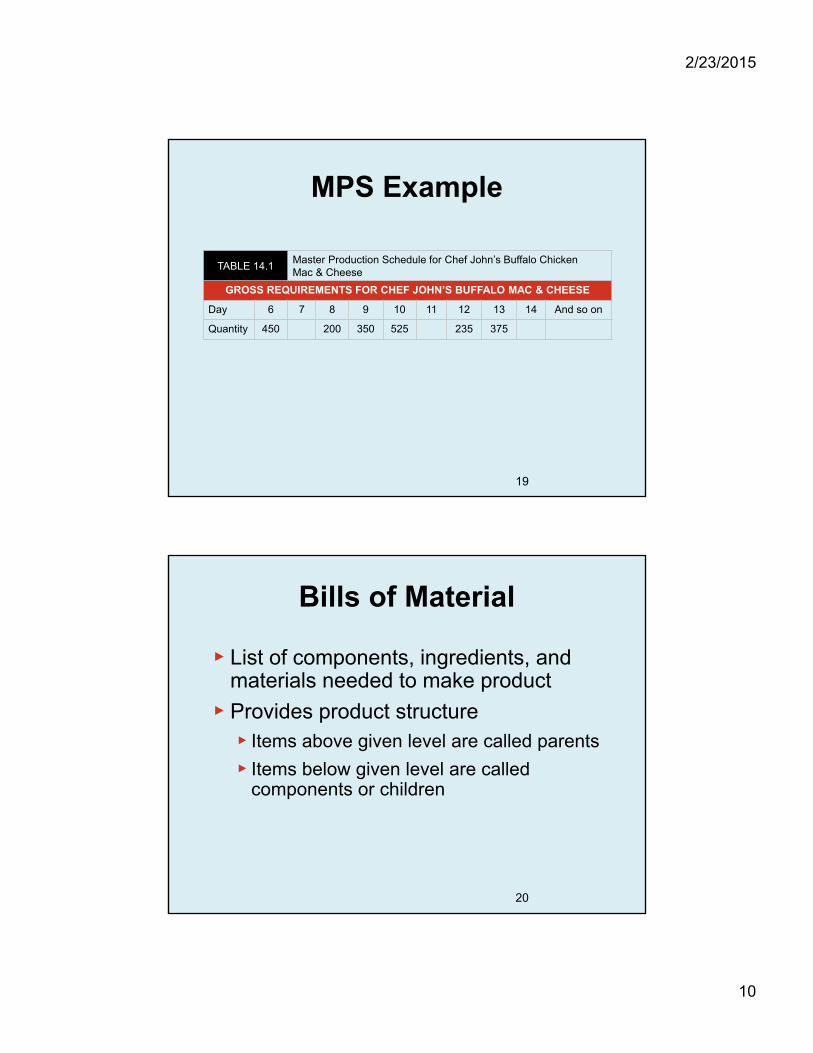
MPS Example
TABLE 14.1Master Production Schedule for Chef John’s Buffalo Chicken Mac & Cheese
GROSS REQUIREMENTS FOR CHEF JOHN’S BUFFALO MAC & CHEESE
Day 6 7 8 9 10 11 12 13 14 And so on
Quantity 450 200 350 525 235 375
19
Bills of Material
▶ List of components, ingredients, and materials needed to make product
▶ Provides product structure▶ Items above given level are called parents
▶ Items below given level are called components or children
20
2/23/2015
11
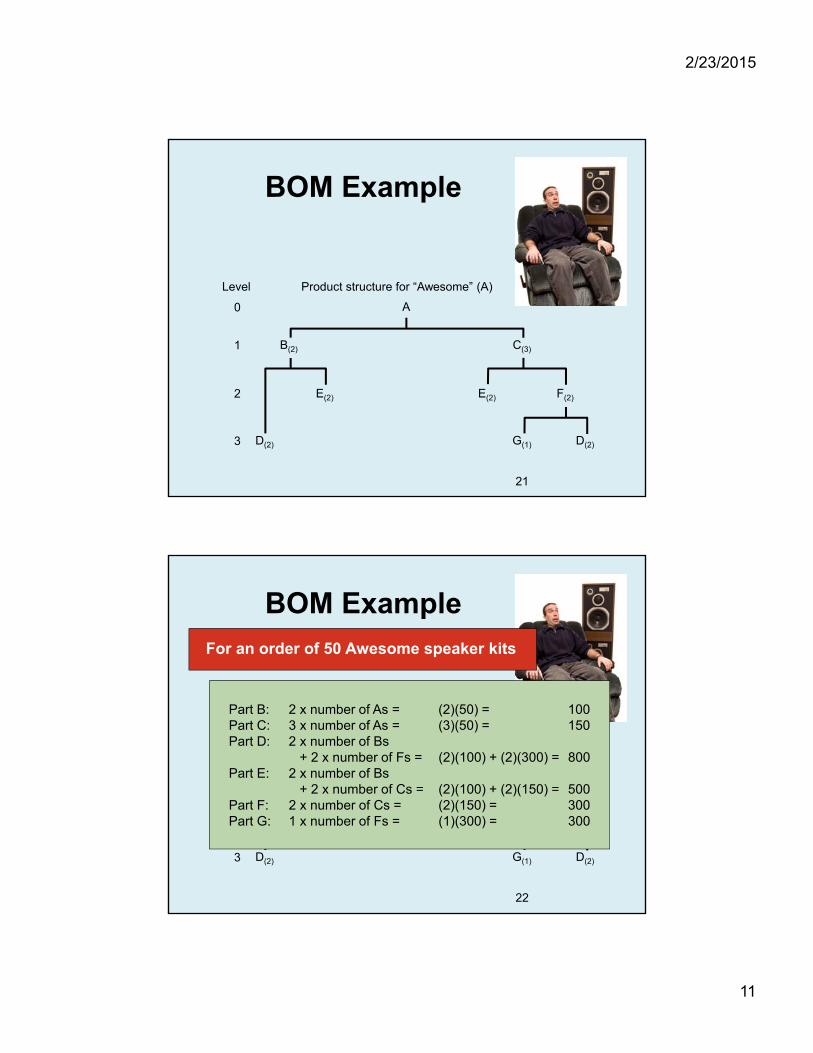
BOM Example
B(2) C(3)1
E(2)E(2) F(2)2
D(2) D(2)G(1)3
Product structure for “Awesome” (A)
A
Level
0
21
BOM Example
B(2) C(3)1
E(2)E(2) F(2)2
D(2) D(2)G(1)3
Product structure for “Awesome” (A)
A
Level
0Part B: 2 x number of As = (2)(50) = 100Part C: 3 x number of As = (3)(50) = 150Part D: 2 x number of Bs
+ 2 x number of Fs = (2)(100) + (2)(300) = 800Part E: 2 x number of Bs
+ 2 x number of Cs = (2)(100) + (2)(150) = 500Part F: 2 x number of Cs = (2)(150) = 300Part G: 1 x number of Fs = (1)(300) = 300
For an order of 50 Awesome speaker kits
22
2/23/2015
12
Bills of Material
▶ Modular Bills▶Modules are not final products but
components that can be assembled into multiple end items
▶Can significantly simplify planning and scheduling
23
Bills of Material
▶ Planning Bills ▶ Also called “pseudo” or super bills
▶Created to assign an artificial parent to the BOM
▶Used to group subassemblies to reduce the number of items planned and scheduled
▶Used to create standard “kits” for production
24
2/23/2015
13
Bills of Material
▶ Phantom Bills▶Describe subassemblies that exist only
temporarily▶ Are part of another assembly and never go
into inventory
▶ Low-Level Coding▶ Item is coded at the lowest level at which it
occurs▶ BOMs are processed one level at a time
25
Accurate Inventory Records
▶ Accurate inventory records are absolutely required for MRP (or any dependent demand system) to operate correctly
▶ Generally MRP systems require more than 99% accuracy
26
2/23/2015
14
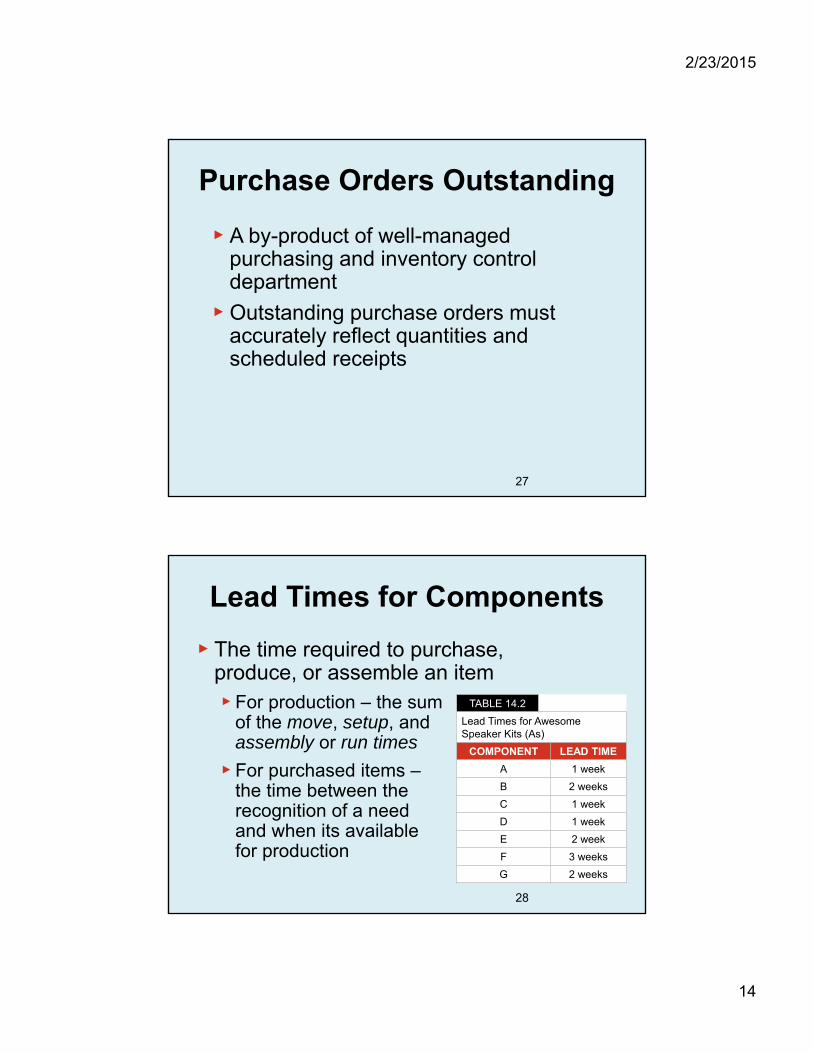
Purchase Orders Outstanding
▶ A by-product of well-managed purchasing and inventory control department
▶ Outstanding purchase orders must accurately reflect quantities and scheduled receipts
27
Lead Times for Components
▶ The time required to purchase, produce, or assemble an item▶ For production – the sum
of the move, setup, and assembly or run times
▶ For purchased items –the time between the recognition of a need and when its available for production
TABLE 14.2
Lead Times for Awesome Speaker Kits (As)
COMPONENT LEAD TIME
A 1 week
B 2 weeks
C 1 week
D 1 week
E 2 week
F 3 weeks
G 2 weeks
28
2/23/2015
15
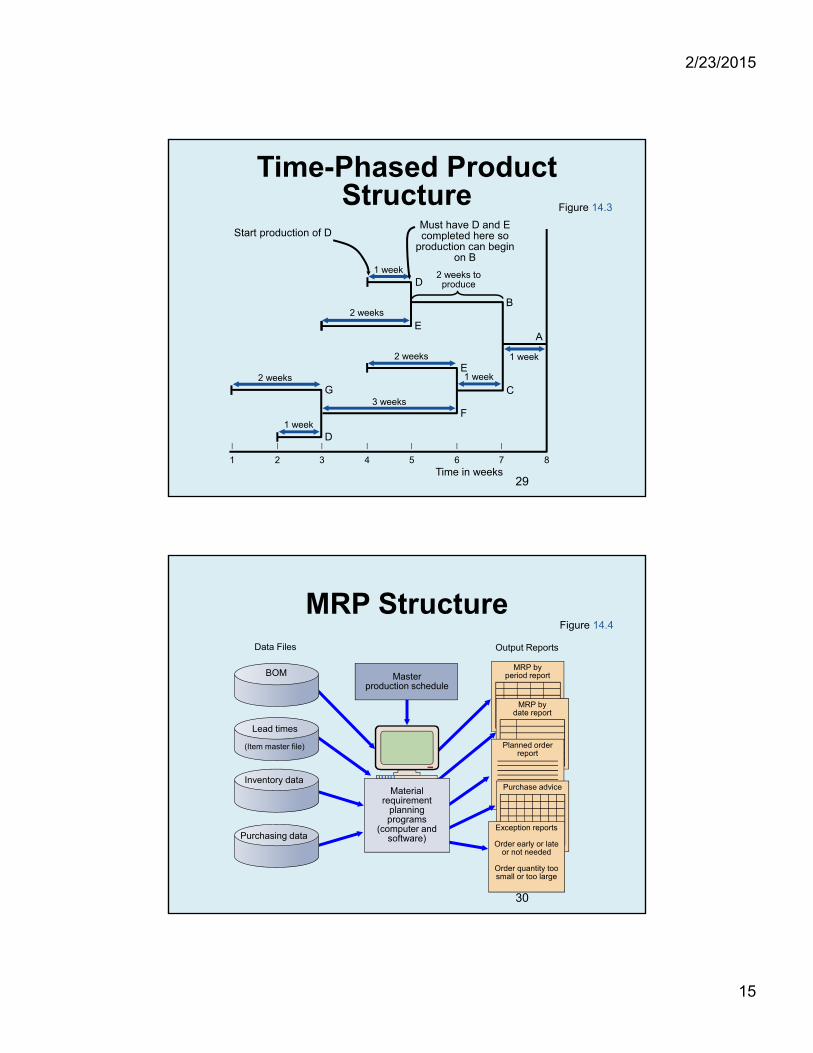
Time-Phased Product Structure
| | | | | | | |
1 2 3 4 5 6 7 8Time in weeks
F
2 weeks
3 weeks
1 week
A
2 weeks
1 weekD
E
2 weeks
D
G
1 week
Start production of DMust have D and E completed here so
production can begin on B
Figure 14.3
1 week
2 weeks to produce
B
C
E
29
MRP StructureFigure 14.4
Output Reports
MRP by period report
MRP by date report
Planned order report
Purchase advice
Exception reports
Order early or late or not needed
Order quantity too small or too large
Data Files
Purchasing data
BOM
Lead times
(Item master file)
Inventory data
Masterproduction schedule
Material requirement
planning programs
(computer and software)
30
2/23/2015
16
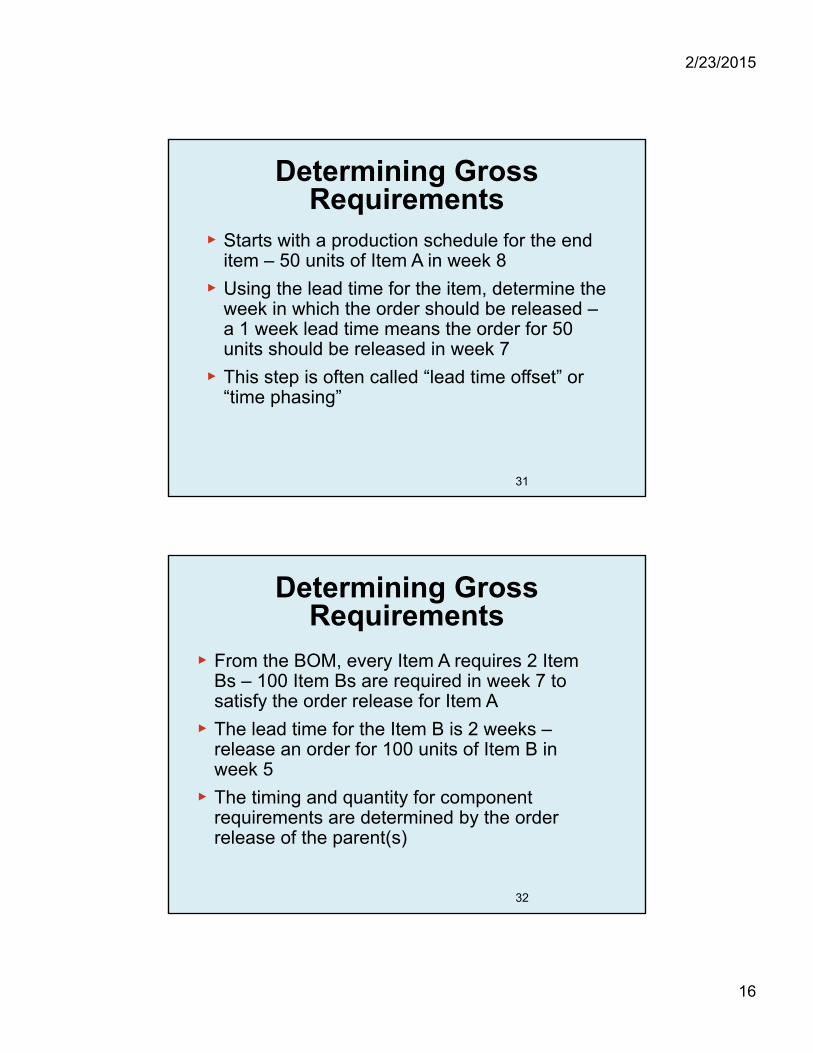
Determining Gross Requirements
▶ Starts with a production schedule for the end item – 50 units of Item A in week 8
▶ Using the lead time for the item, determine the week in which the order should be released –a 1 week lead time means the order for 50 units should be released in week 7
▶ This step is often called “lead time offset” or “time phasing”
31
Determining Gross Requirements
▶ From the BOM, every Item A requires 2 Item Bs – 100 Item Bs are required in week 7 to satisfy the order release for Item A
▶ The lead time for the Item B is 2 weeks –release an order for 100 units of Item B in week 5
▶ The timing and quantity for component requirements are determined by the order release of the parent(s)
32
2/23/2015
17
Determining Gross Requirements
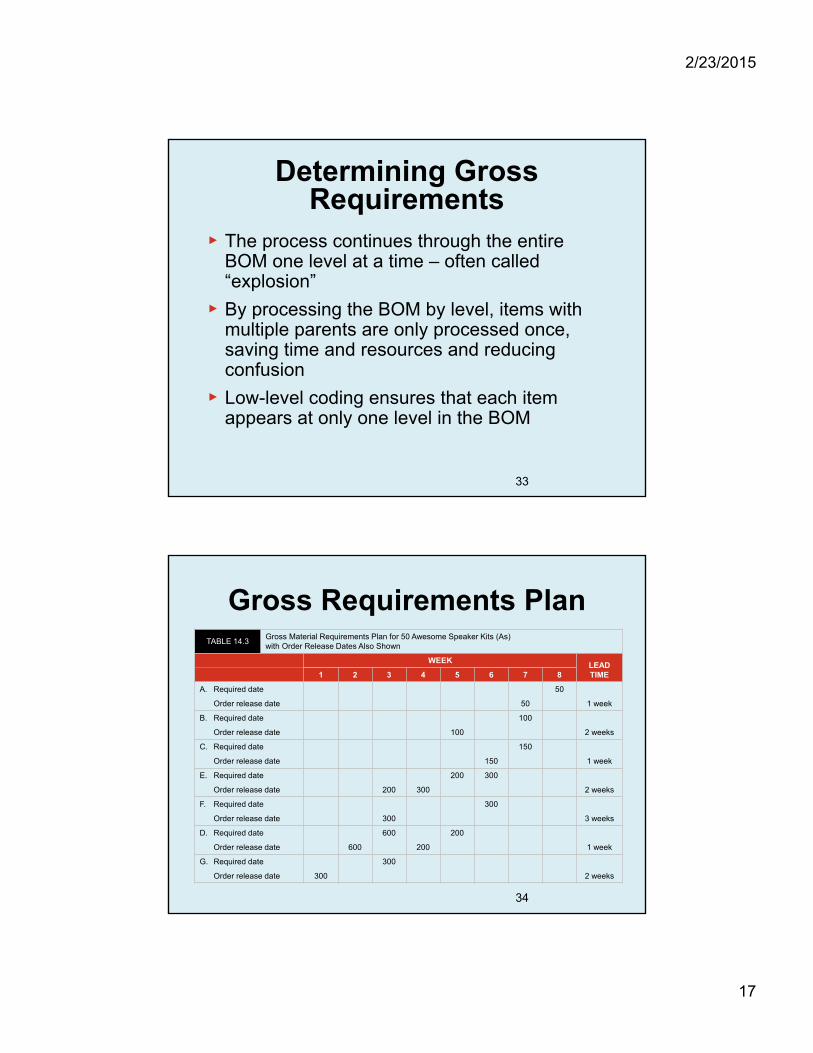
▶ The process continues through the entire BOM one level at a time – often called “explosion”
▶ By processing the BOM by level, items with multiple parents are only processed once, saving time and resources and reducing confusion
▶ Low-level coding ensures that each item appears at only one level in the BOM
33
Gross Requirements PlanTABLE 14.3
Gross Material Requirements Plan for 50 Awesome Speaker Kits (As) with Order Release Dates Also Shown
WEEKLEAD TIME1 2 3 4 5 6 7 8
A. Required date 50
1 weekOrder release date 50
B. Required date 100
2 weeksOrder release date 100
C. Required date 150
1 weekOrder release date 150
E. Required date 200 300
2 weeksOrder release date 200 300
F. Required date 300
3 weeksOrder release date 300
D. Required date 600 200
1 weekOrder release date 600 200
G. Required date 300
2 weeksOrder release date 300
34
2/23/2015
18
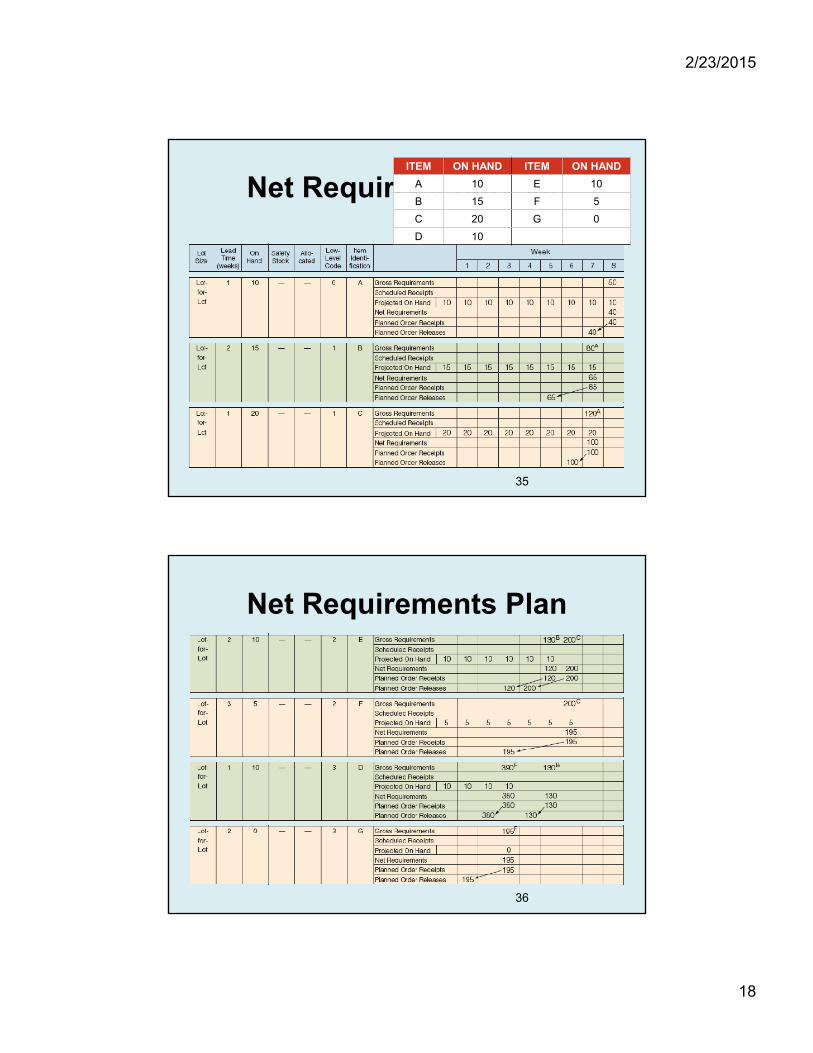
Net Requirements PlanITEM ON HAND ITEM ON HAND
A 10 E 10
B 15 F 5
C 20 G 0
D 10
35
Net Requirements Plan
36
2/23/2015
19
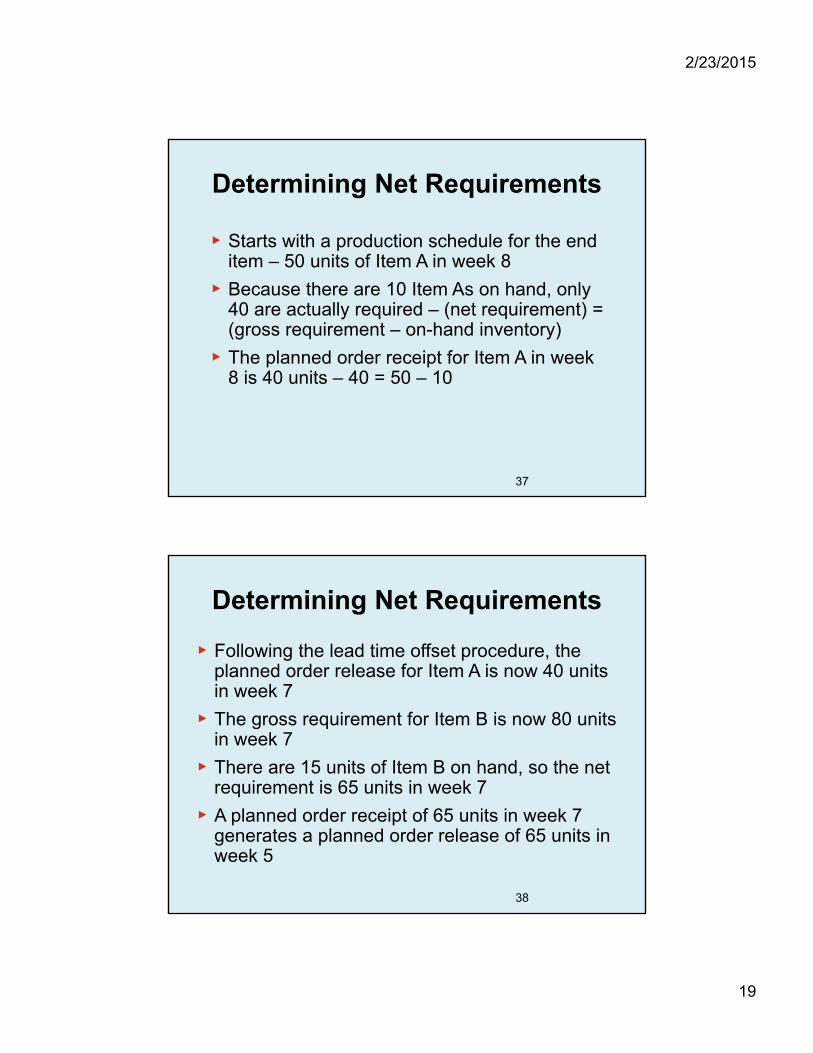
Determining Net Requirements
▶ Starts with a production schedule for the end item – 50 units of Item A in week 8
▶ Because there are 10 Item As on hand, only 40 are actually required – (net requirement) = (gross requirement – on-hand inventory)
▶ The planned order receipt for Item A in week 8 is 40 units – 40 = 50 – 10
37
Determining Net Requirements
▶ Following the lead time offset procedure, the planned order release for Item A is now 40 units in week 7
▶ The gross requirement for Item B is now 80 units in week 7
▶ There are 15 units of Item B on hand, so the net requirement is 65 units in week 7
▶ A planned order receipt of 65 units in week 7 generates a planned order release of 65 units in week 5
38
2/23/2015
20
Determining Net Requirements
▶ A planned order receipt of 65 units in week 7 generates a planned order release of 65 units in week 5
▶ The on-hand inventory record for Item B is updated to reflect the use of the 15 items in inventory and shows no on-hand inventory in week 8
▶ This is referred to as the Gross-to-Net calculation and is the third basic function of the MRP process
39
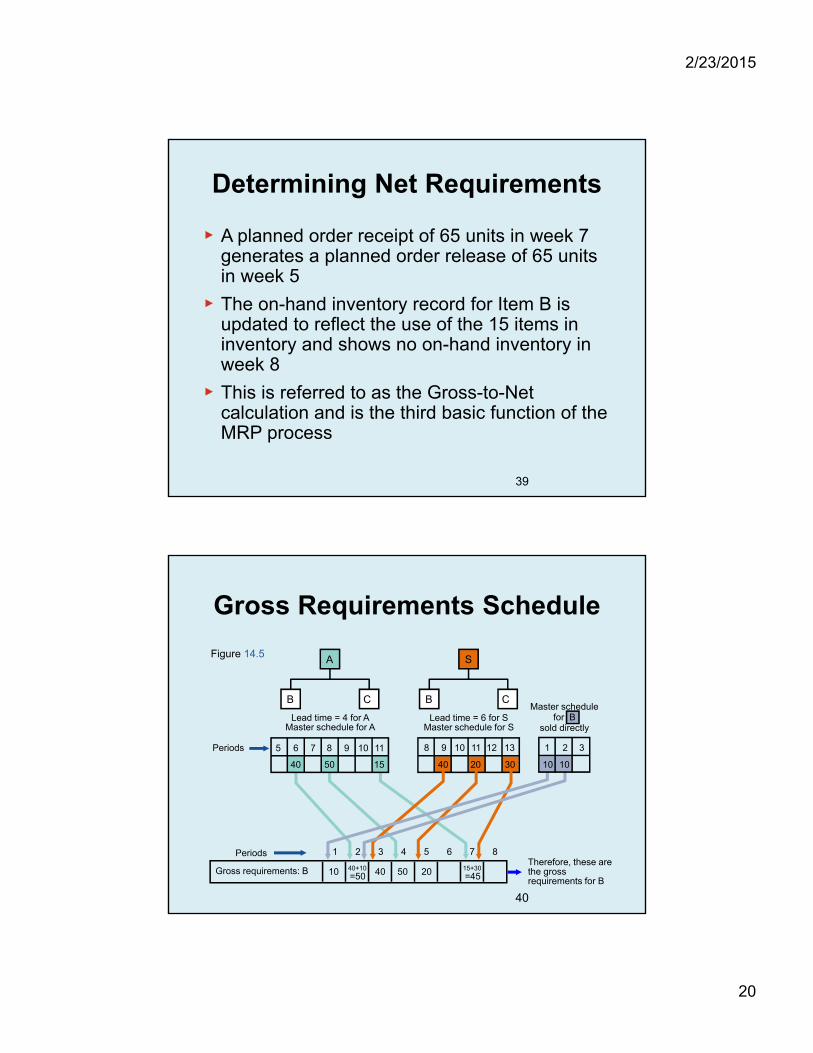
S
B C
302040
12 138 9 10 11
Lead time = 6 for SMaster schedule for S
Gross Requirements Schedule
Figure 14.5
1010
1 2 3
Master schedulefor B
sold directly
Periods
Therefore, these are the gross requirements for B
Gross requirements: B 10 40 50 2040+10 15+30=50 =45
1 2 3 4 5 6 7 8Periods
A
B C
Lead time = 4 for AMaster schedule for A
5 6 7 8 9 10 11
40 1550
40
2/23/2015
21
Net Requirements Plan
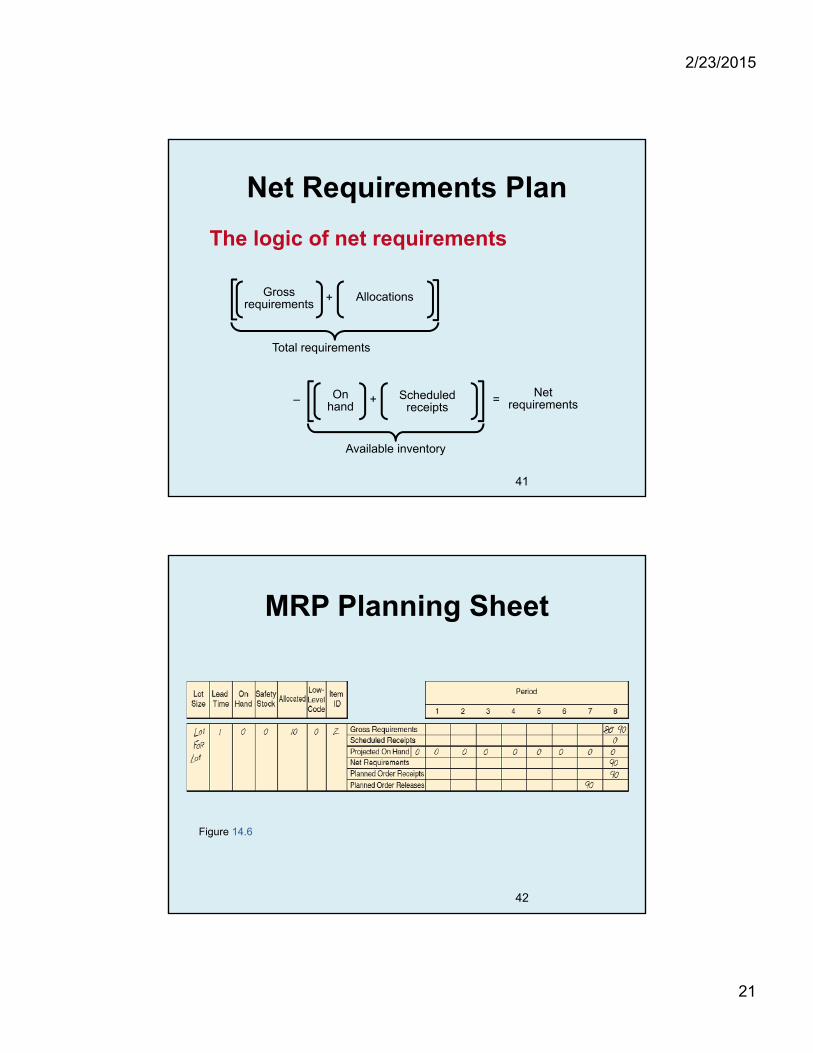
The logic of net requirements
Available inventory
Net requirements
On hand
Scheduled receipts
+– =
Total requirements
Gross requirements
Allocations+
41
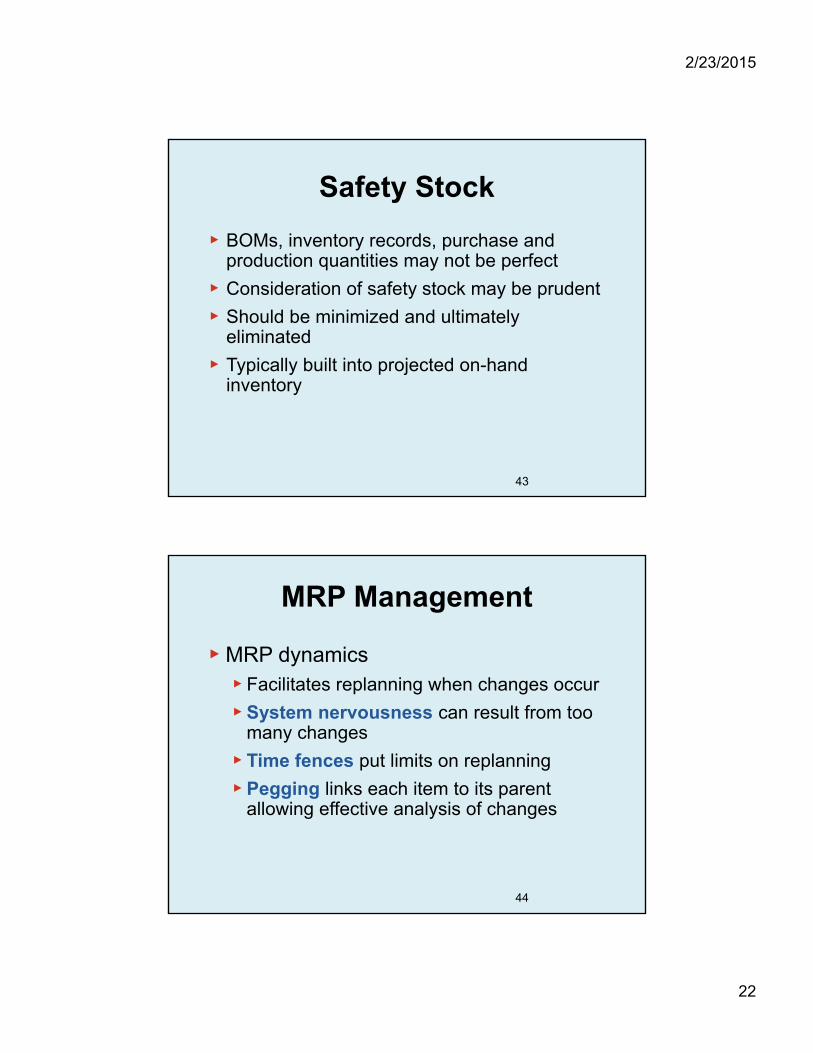
MRP Planning Sheet
Figure 14.6
42
2/23/2015
22
Safety Stock
▶ BOMs, inventory records, purchase and production quantities may not be perfect
▶ Consideration of safety stock may be prudent
▶ Should be minimized and ultimately eliminated
▶ Typically built into projected on-hand inventory
43
MRP Management
▶ MRP dynamics▶ Facilitates replanning when changes occur
▶ System nervousness can result from too many changes
▶ Time fences put limits on replanning
▶ Pegging links each item to its parent allowing effective analysis of changes
44
2/23/2015
23
MRP Management
▶ MRP limitations▶MRP does not do detailed scheduling–it
plans
▶Works best in product-focused, repetitive environments
▶Requires fixed lead time and infinite size time buckets
45
Lot-Sizing Techniques
▶ Lot-for-lot techniques order just what is required for production based on net requirements▶ May not always be feasible
▶ If setup costs are high, lot-for-lot can be expensive
▶ Economic order quantity (EOQ)▶ EOQ expects a known constant demand and
MRP systems often deal with unknown and variable demand
46
2/23/2015
24
Lot-Sizing Techniques
▶ Periodic order quantity (POQ) orders quantity needed for a predetermined time period▶ Interval = EOQ / average demand per period
▶Order quantity set to cover the interval
▶Order quantity calculated when order is released
▶No extra inventory
47
Lot-Sizing Techniques
▶ Dynamic lot sizing techniques▶ Balance lot size and setup costs
▶ Part period balancing (least total cost)
▶ Least unit cost
▶ Least period cost (Silver-Meal)
▶ Dynamic programming approach▶Wagner-Whitin
48
2/23/2015
25
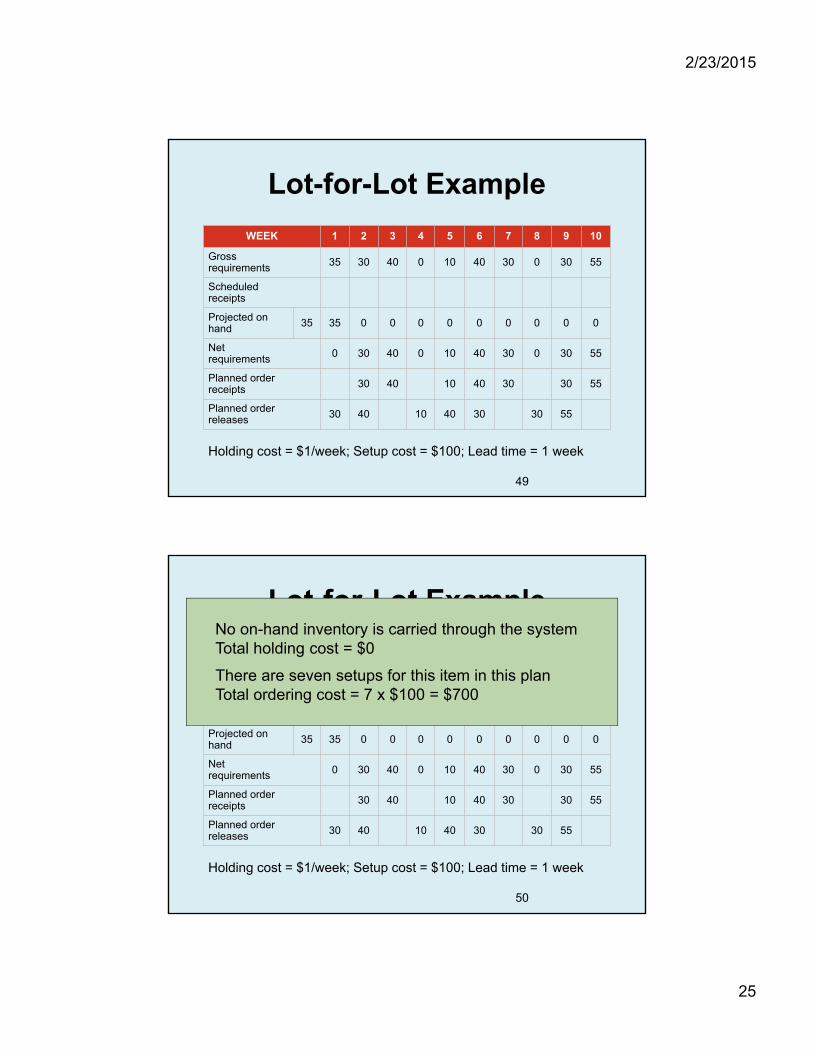
Lot-for-Lot Example
WEEK 1 2 3 4 5 6 7 8 9 10
Gross requirements 35 30 40 0 10 40 30 0 30 55
Scheduled receipts
Projected on hand 35 35 0 0 0 0 0 0 0 0 0
Net requirements 0 30 40 0 10 40 30 0 30 55
Planned order receipts 30 40 10 40 30 30 55
Planned order releases 30 40 10 40 30 30 55
Holding cost = $1/week; Setup cost = $100; Lead time = 1 week
49
Lot-for-Lot Example
WEEK 1 2 3 4 5 6 7 8 9 10
Gross requirements 35 30 40 0 10 40 30 0 30 55
Scheduled receipts
Projected on hand 35 35 0 0 0 0 0 0 0 0 0
Net requirements 0 30 40 0 10 40 30 0 30 55
Planned order receipts 30 40 10 40 30 30 55
Planned order releases 30 40 10 40 30 30 55
Holding cost = $1/week; Setup cost = $100; Lead time = 1 week
No on-hand inventory is carried through the systemTotal holding cost = $0
There are seven setups for this item in this planTotal ordering cost = 7 x $100 = $700
50
2/23/2015
26
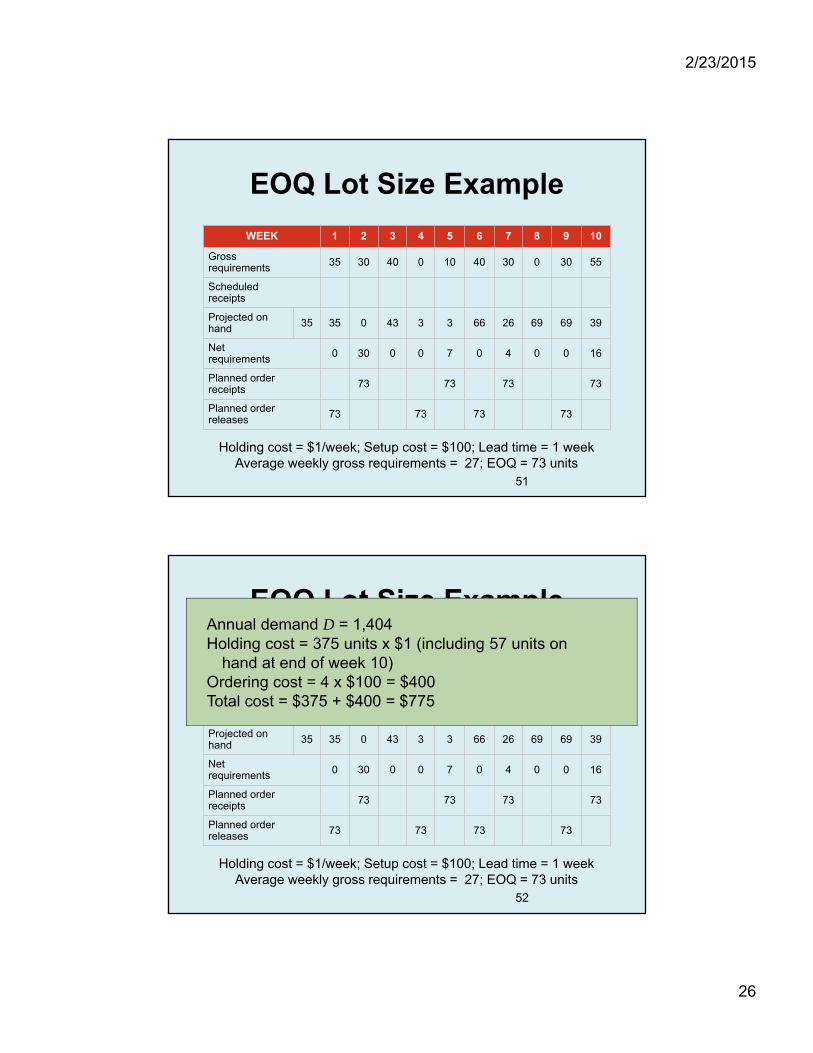
EOQ Lot Size Example
WEEK 1 2 3 4 5 6 7 8 9 10
Gross requirements 35 30 40 0 10 40 30 0 30 55
Scheduled receipts
Projected on hand 35 35 0 43 3 3 66 26 69 69 39
Net requirements 0 30 0 0 7 0 4 0 0 16
Planned order receipts 73 73 73 73
Planned order releases 73 73 73 73
Holding cost = $1/week; Setup cost = $100; Lead time = 1 weekAverage weekly gross requirements = 27; EOQ = 73 units
51
EOQ Lot Size Example
WEEK 1 2 3 4 5 6 7 8 9 10
Gross requirements 35 30 40 0 10 40 30 0 30 55
Scheduled receipts
Projected on hand 35 35 0 43 3 3 66 26 69 69 39
Net requirements 0 30 0 0 7 0 4 0 0 16
Planned order receipts 73 73 73 73
Planned order releases 73 73 73 73
Annual demand D = 1,404Holding cost = 375 units x $1 (including 57 units on
hand at end of week 10)Ordering cost = 4 x $100 = $400Total cost = $375 + $400 = $775
Holding cost = $1/week; Setup cost = $100; Lead time = 1 weekAverage weekly gross requirements = 27; EOQ = 73 units
52
2/23/2015
27
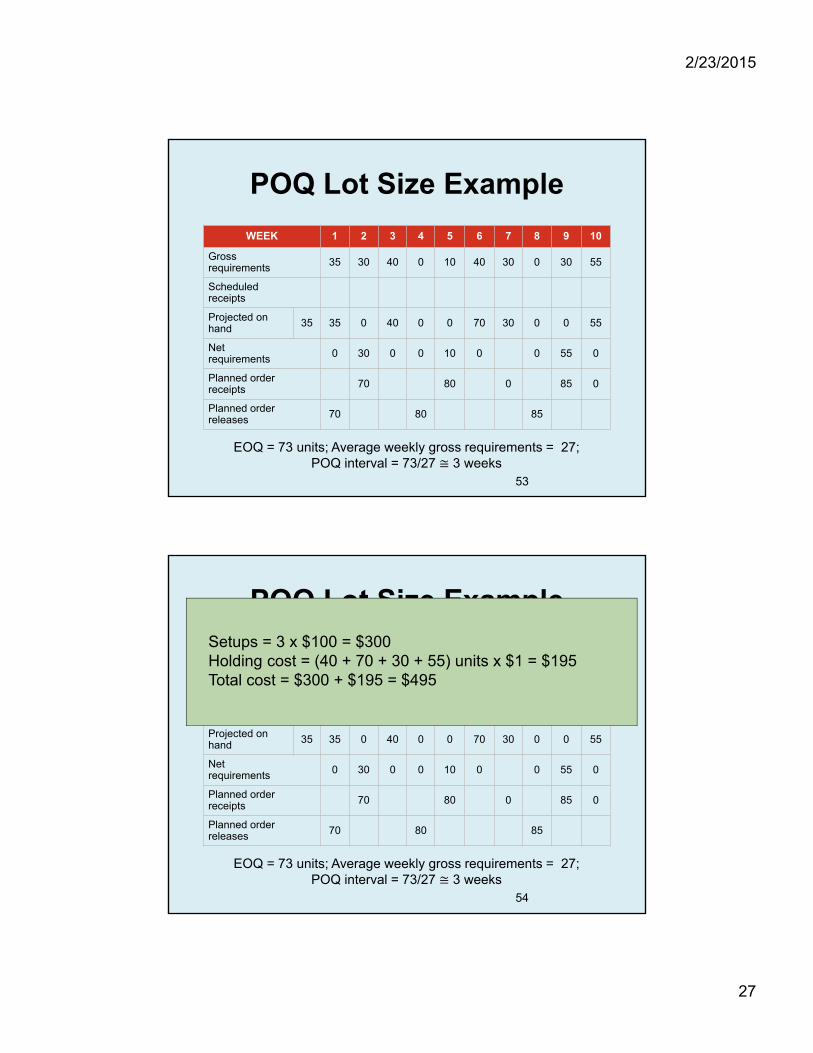
POQ Lot Size Example
WEEK 1 2 3 4 5 6 7 8 9 10
Gross requirements 35 30 40 0 10 40 30 0 30 55
Scheduled receipts
Projected on hand 35 35 0 40 0 0 70 30 0 0 55
Net requirements 0 30 0 0 10 0 0 55 0
Planned order receipts 70 80 0 85 0
Planned order releases 70 80 85
EOQ = 73 units; Average weekly gross requirements = 27; POQ interval = 73/27 ≅ 3 weeks
53
POQ Lot Size Example
WEEK 1 2 3 4 5 6 7 8 9 10
Gross requirements 35 30 40 0 10 40 30 0 30 55
Scheduled receipts
Projected on hand 35 35 0 40 0 0 70 30 0 0 55
Net requirements 0 30 0 0 10 0 0 55 0
Planned order receipts 70 80 0 85 0
Planned order releases 70 80 85
Setups = 3 x $100 = $300Holding cost = (40 + 70 + 30 + 55) units x $1 = $195Total cost = $300 + $195 = $495
EOQ = 73 units; Average weekly gross requirements = 27; POQ interval = 73/27 ≅ 3 weeks
54
2/23/2015
28
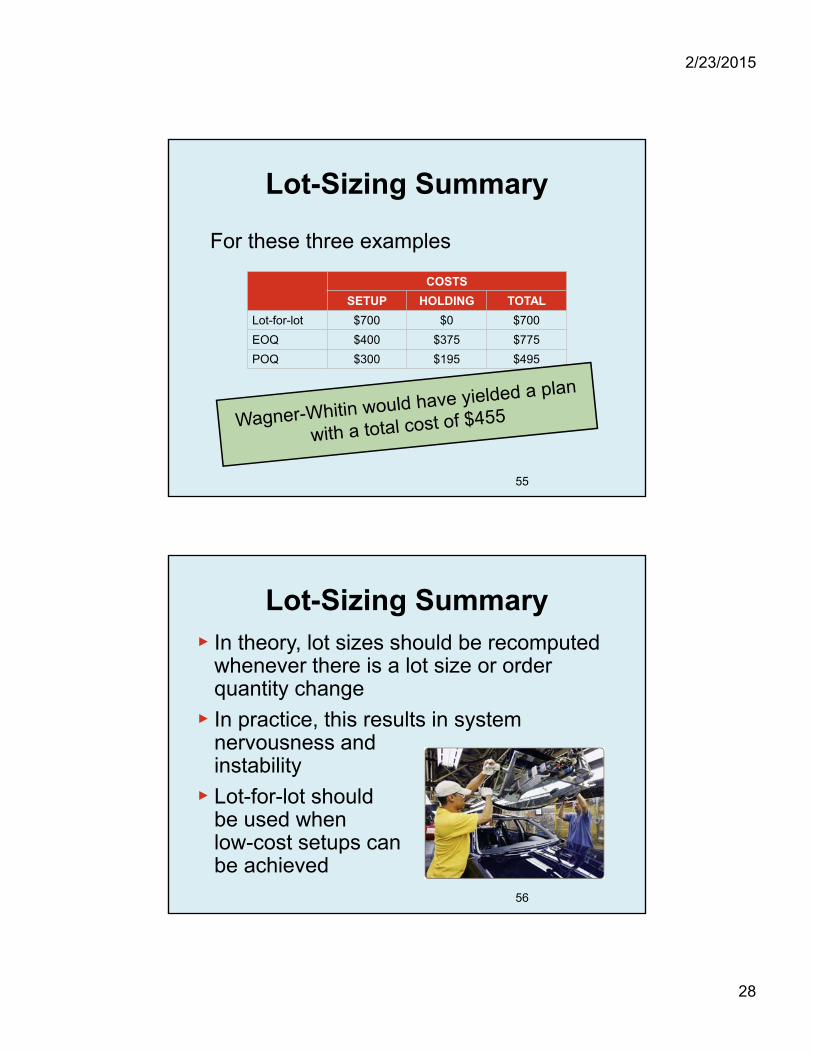
Lot-Sizing Summary
For these three examples
COSTS
SETUP HOLDING TOTAL
Lot-for-lot $700 $0 $700
EOQ $400 $375 $775
POQ $300 $195 $495
55
Lot-Sizing Summary▶ In theory, lot sizes should be recomputed
whenever there is a lot size or order quantity change
▶ In practice, this results in system nervousness and instability
▶ Lot-for-lot should be used when low-cost setups can be achieved
56
2/23/2015
29
Lot-Sizing Summary
▶ Lot sizes can be modified to allow for scrap, process constraints, and purchase lots
▶ Use lot-sizing with care as it can cause considerable distortion of requirements at lower levels of the BOM
▶ When setup costs are significant and demand is reasonably smooth, POQ or EOQ should give reasonable results
57
Extensions of MRP
▶ MRP II
▶ Closed-Loop MRP
▶ Capacity Planning
58
2/23/2015
30
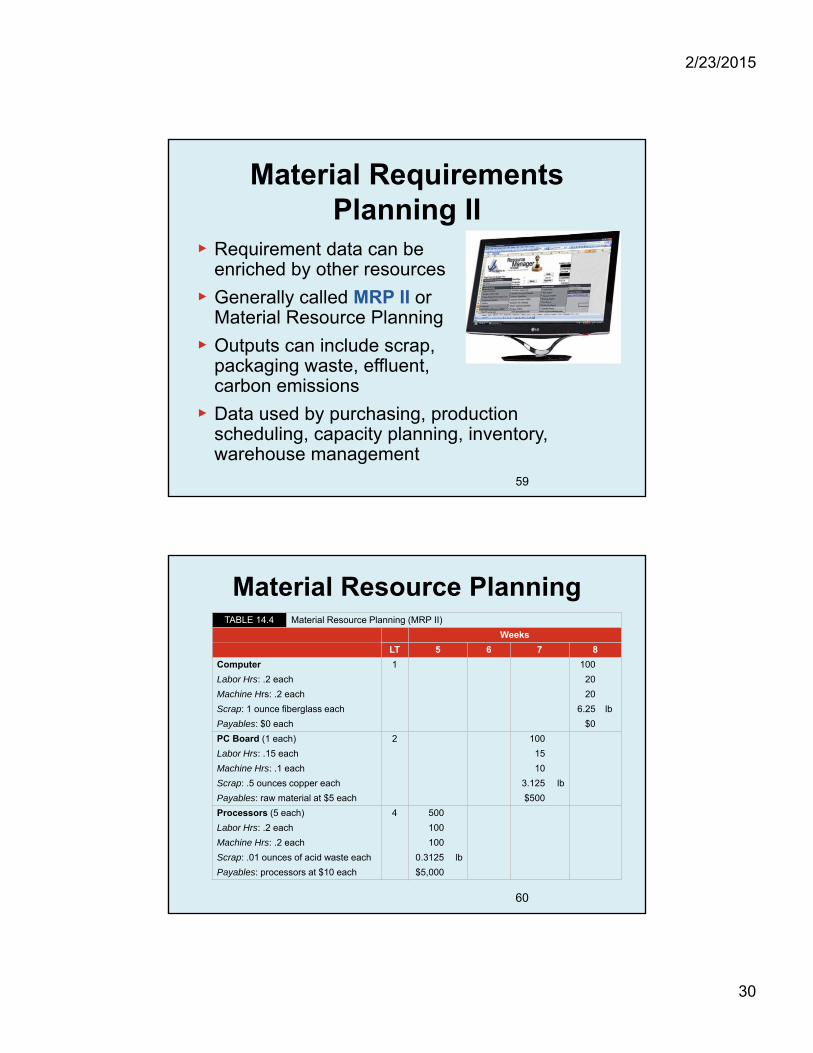
Material Requirements Planning II
▶ Requirement data can be enriched by other resources
▶ Generally called MRP II or Material Resource Planning
▶ Outputs can include scrap, packaging waste, effluent, carbon emissions
▶ Data used by purchasing, production scheduling, capacity planning, inventory, warehouse management
59
Material Resource PlanningTABLE 14.4 Material Resource Planning (MRP II)
Weeks
LT 5 6 7 8
Computer 1 100
Labor Hrs: .2 each 20
Machine Hrs: .2 each 20
Scrap: 1 ounce fiberglass each 6.25 lb
Payables: $0 each $0
PC Board (1 each) 2 100
Labor Hrs: .15 each 15
Machine Hrs: .1 each 10
Scrap: .5 ounces copper each 3.125 lb
Payables: raw material at $5 each $500
Processors (5 each) 4 500
Labor Hrs: .2 each 100
Machine Hrs: .2 each 100
Scrap: .01 ounces of acid waste each 0.3125 lb
Payables: processors at $10 each $5,000
60
2/23/2015
31
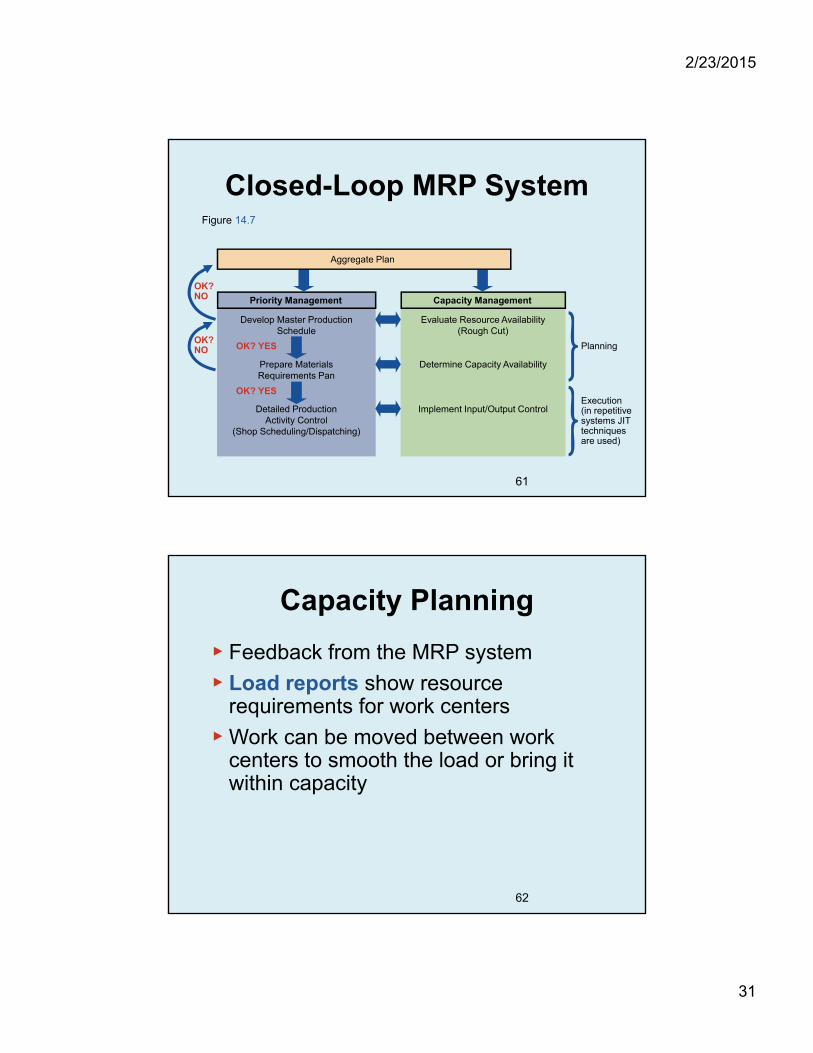
Closed-Loop MRP SystemFigure 14.7
Priority Management
Develop Master ProductionSchedule
Prepare MaterialsRequirements Pan
Detailed ProductionActivity Control
(Shop Scheduling/Dispatching)
Capacity Management
Evaluate Resource Availability(Rough Cut)
Determine Capacity Availability
Implement Input/Output Control
Aggregate Plan
OK?NO
OK?NO OK? YES
OK? YES
Planning
Execution(in repetitive systems JIT techniques are used)
61
Capacity Planning
▶ Feedback from the MRP system
▶ Load reports show resource requirements for work centers
▶ Work can be moved between work centers to smooth the load or bring it within capacity
62
2/23/2015
32
Smoothing Tactics1. Overlapping
► Sends part of the work to following operations before the entire lot is complete
► Reduces lead time
2. Operations splitting► Sends the lot to two different machines for the same
operation
► Shorter throughput time but increased setup costs
3. Order or lot splitting► Breaking up the order into smaller lots and running
part earlier (or later) in the schedule
63
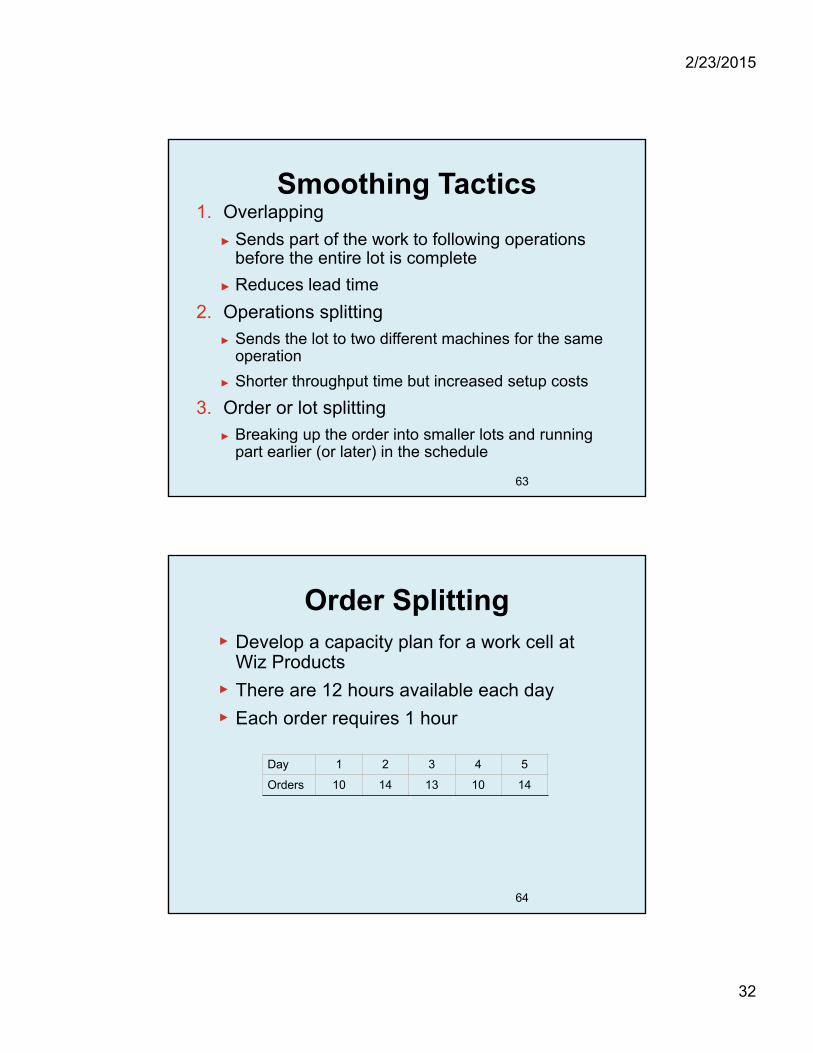
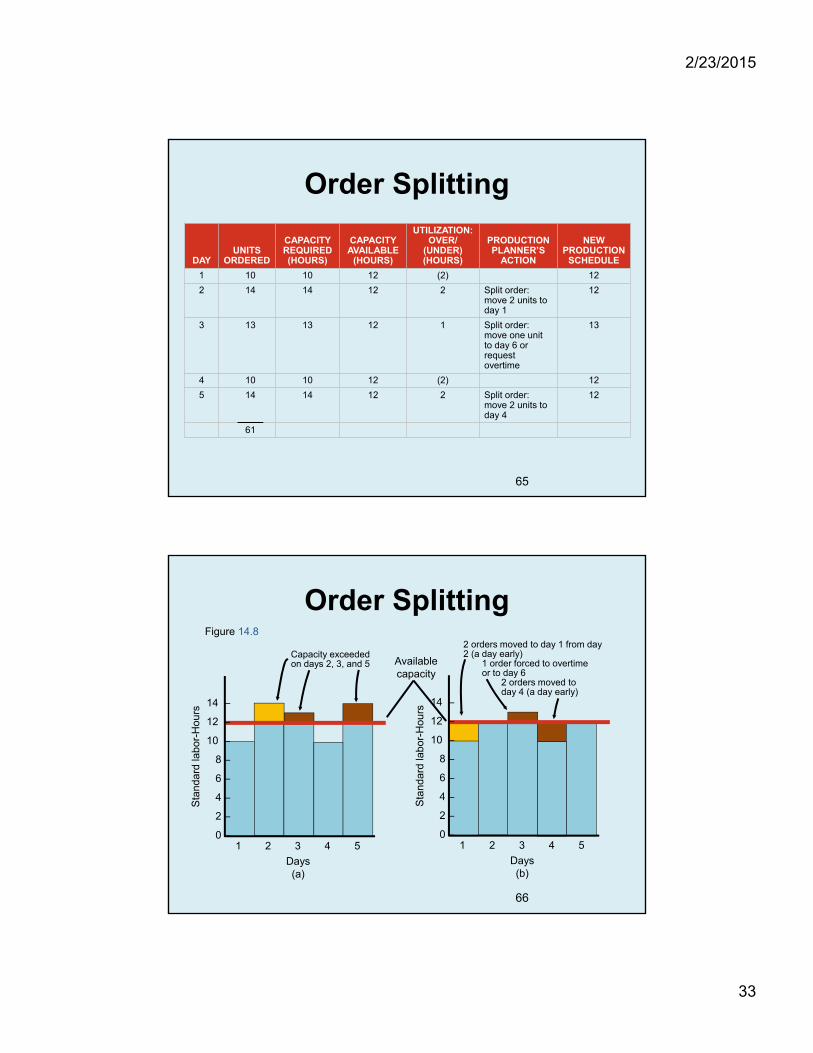
Order Splitting▶ Develop a capacity plan for a work cell at
Wiz Products
▶ There are 12 hours available each day
▶ Each order requires 1 hour
Day 1 2 3 4 5
Orders 10 14 13 10 14
64
2/23/2015
33
Order Splitting
DAYUNITS
ORDERED
CAPACITY REQUIRED (HOURS)
CAPACITY AVAILABLE
(HOURS)
UTILIZATION: OVER/
(UNDER) (HOURS)
PRODUCTION PLANNER’S
ACTION
NEW PRODUCTION
SCHEDULE
1 10 10 12 (2) 12
2 14 14 12 2 Split order: move 2 units to day 1
12
3 13 13 12 1 Split order: move one unit to day 6 or request overtime
13
4 10 10 12 (2) 12
5 14 14 12 2 Split order: move 2 units to day 4
12
61
65
Order SplittingFigure 14.8
Available capacity
Capacity exceeded on days 2, 3, and 5
2 orders moved to day 1 from day 2 (a day early)
1 order forced to overtimeor to day 6
2 orders moved to day 4 (a day early)
14 –
12 –
10 –
8 –
6 –
4 –
2 –
0 –1 2 3 4 5
Days(b)
Sta
ndar
d la
bor-
Hou
rs
14 –
12 –
10 –
8 –
6 –
4 –
2 –
0 –1 2 3 4 5
Days(a)
Sta
ndar
d la
bor-
Hou
rs
66
2/23/2015
34
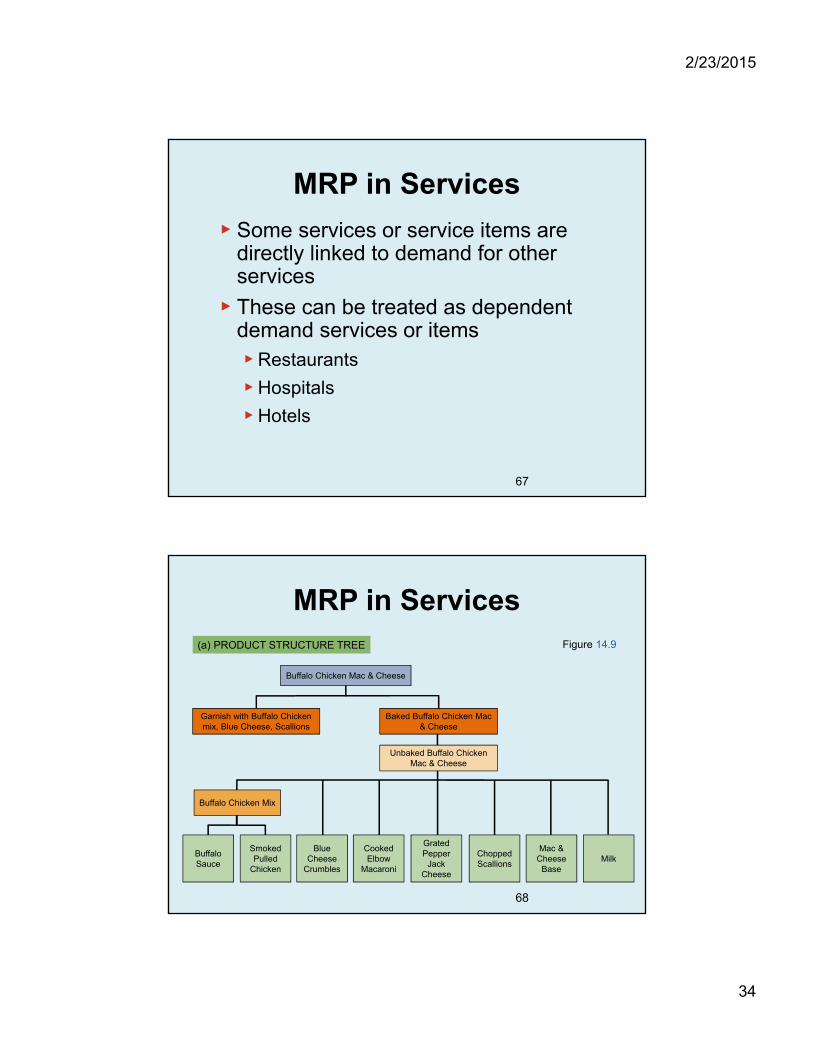
MRP in Services
▶ Some services or service items are directly linked to demand for other services
▶ These can be treated as dependent demand services or items▶Restaurants
▶Hospitals
▶Hotels
67
Buffalo Chicken Mix
Buffalo Sauce
Smoked Pulled
Chicken
Blue Cheese
Crumbles
Cooked Elbow
Macaroni
Grated Pepper
Jack Cheese
Chopped Scallions
Mac & Cheese
BaseMilk
Unbaked Buffalo Chicken Mac & Cheese
MRP in Services(a) PRODUCT STRUCTURE TREE Figure 14.9
Garnish with Buffalo Chicken mix, Blue Cheese, Scallions
Baked Buffalo Chicken Mac & Cheese
Buffalo Chicken Mac & Cheese
68
2/23/2015
35
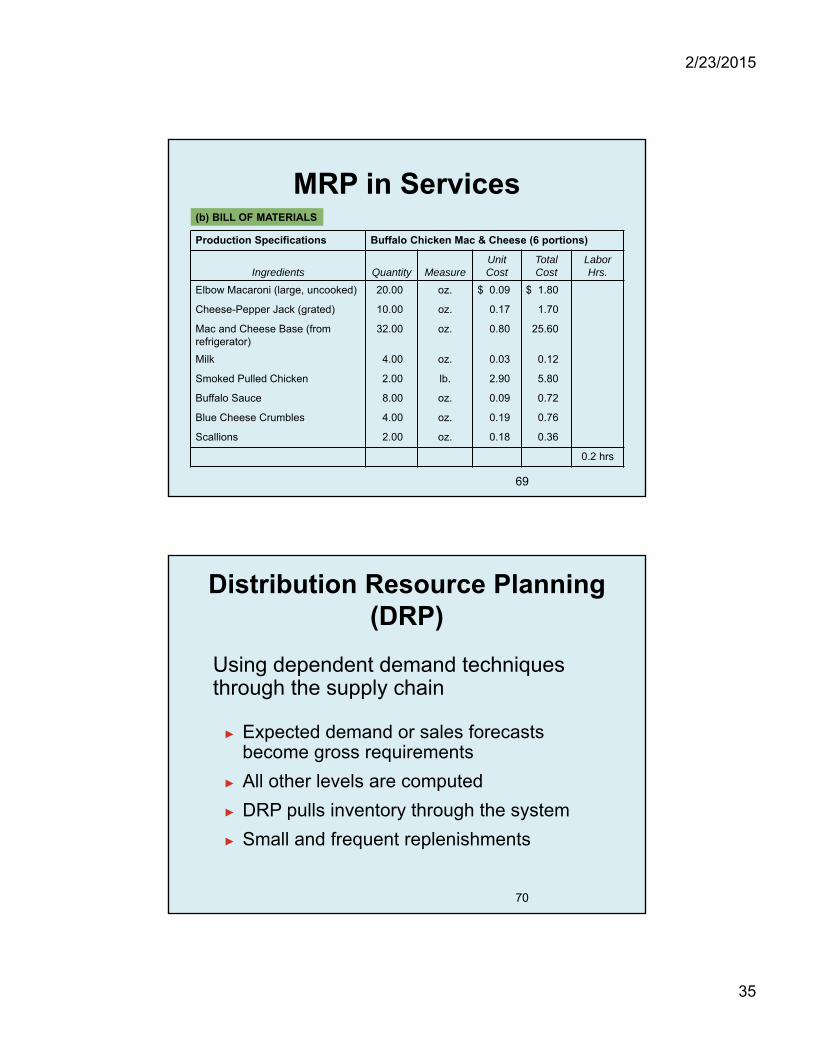
MRP in Services(b) BILL OF MATERIALS
Production Specifications Buffalo Chicken Mac & Cheese (6 portions)
Ingredients Quantity MeasureUnit Cost
Total Cost
Labor Hrs.
Elbow Macaroni (large, uncooked) 20.00 oz. $ 0.09 $ 1.80
Cheese-Pepper Jack (grated) 10.00 oz. 0.17 1.70
Mac and Cheese Base (from refrigerator)
32.00 oz. 0.80 25.60
Milk 4.00 oz. 0.03 0.12
Smoked Pulled Chicken 2.00 lb. 2.90 5.80
Buffalo Sauce 8.00 oz. 0.09 0.72
Blue Cheese Crumbles 4.00 oz. 0.19 0.76
Scallions 2.00 oz. 0.18 0.36
0.2 hrs
69
Distribution Resource Planning (DRP)
Using dependent demand techniques through the supply chain
► Expected demand or sales forecasts become gross requirements
► All other levels are computed
► DRP pulls inventory through the system
► Small and frequent replenishments
70
2/23/2015
36
Enterprise Resource Planning (ERP)
▶ An extension of the MRP system to tie in customers and suppliers1. Allows automation and integration of many
business processes
2. Shares common data bases and business practices
3. Produces information in real time
▶ Coordinates business from supplier evaluation to customer invoicing
71
Enterprise Resource Planning (ERP)
▶ ERP modules include▶ Basic MRP
▶ Finance
▶Human resources
▶ Supply chain management (SCM)
▶Customer relationship management (CRM)
▶ Sustainability
72
2/23/2015
37
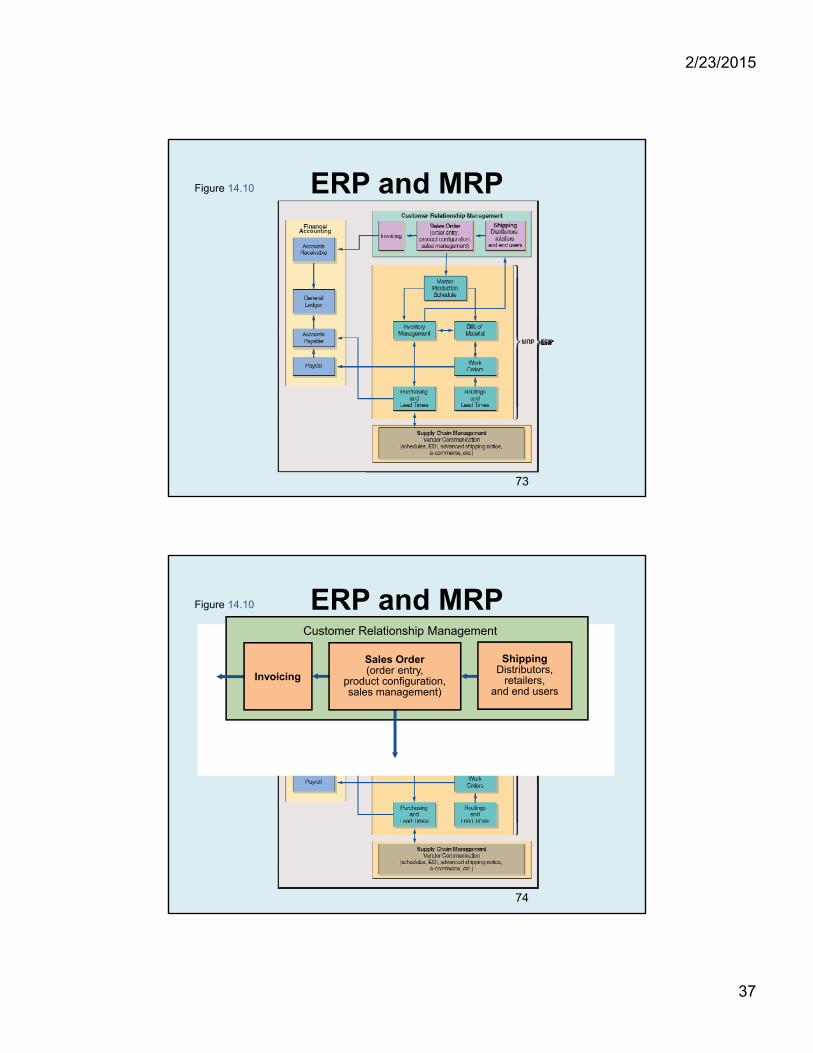
ERP and MRPFigure 14.10
73
ERP and MRPFigure 14.10
Customer Relationship Management
Invoicing
ShippingDistributors,
retailers,and end users
Sales Order(order entry,
product configuration,sales management)
74
2/23/2015
38
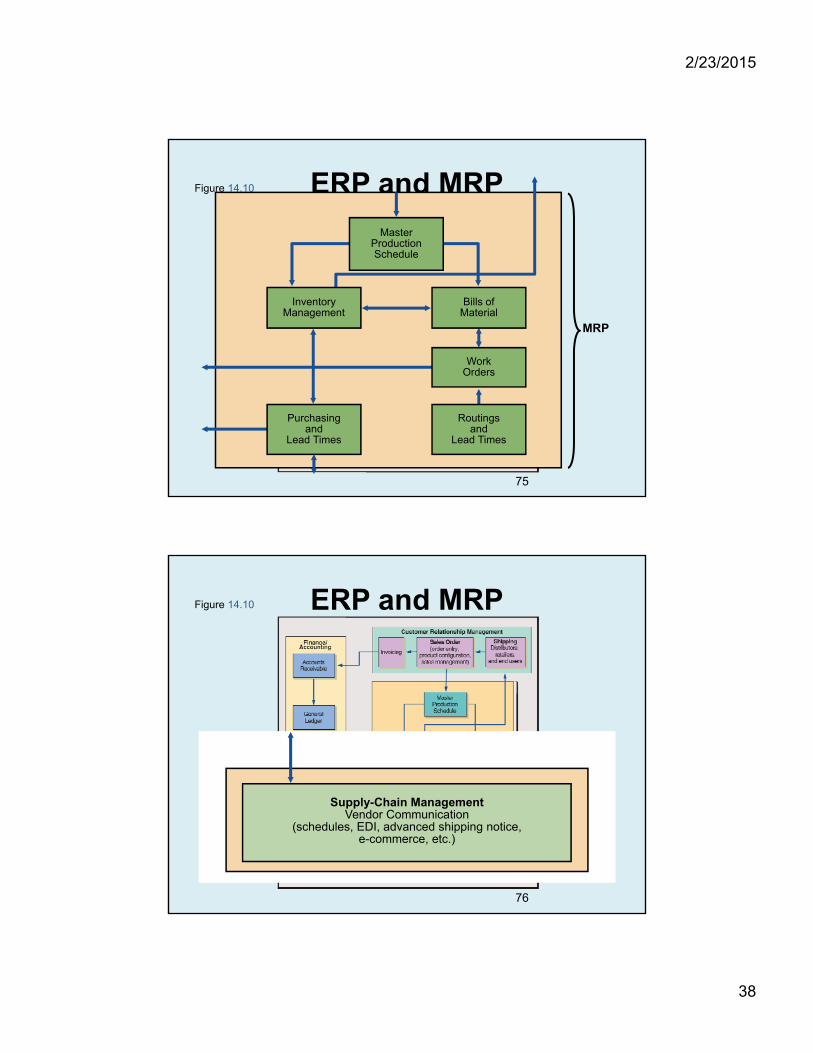
ERP and MRPFigure 14.10
Table 13.6
Bills of Material
Work Orders
Purchasingand
Lead Times
Routingsand
Lead Times
Master Production Schedule
Inventory Management
MRP
75
ERP and MRPFigure 14.10
Supply-Chain ManagementVendor Communication
(schedules, EDI, advanced shipping notice,e-commerce, etc.)
76
2/23/2015
39
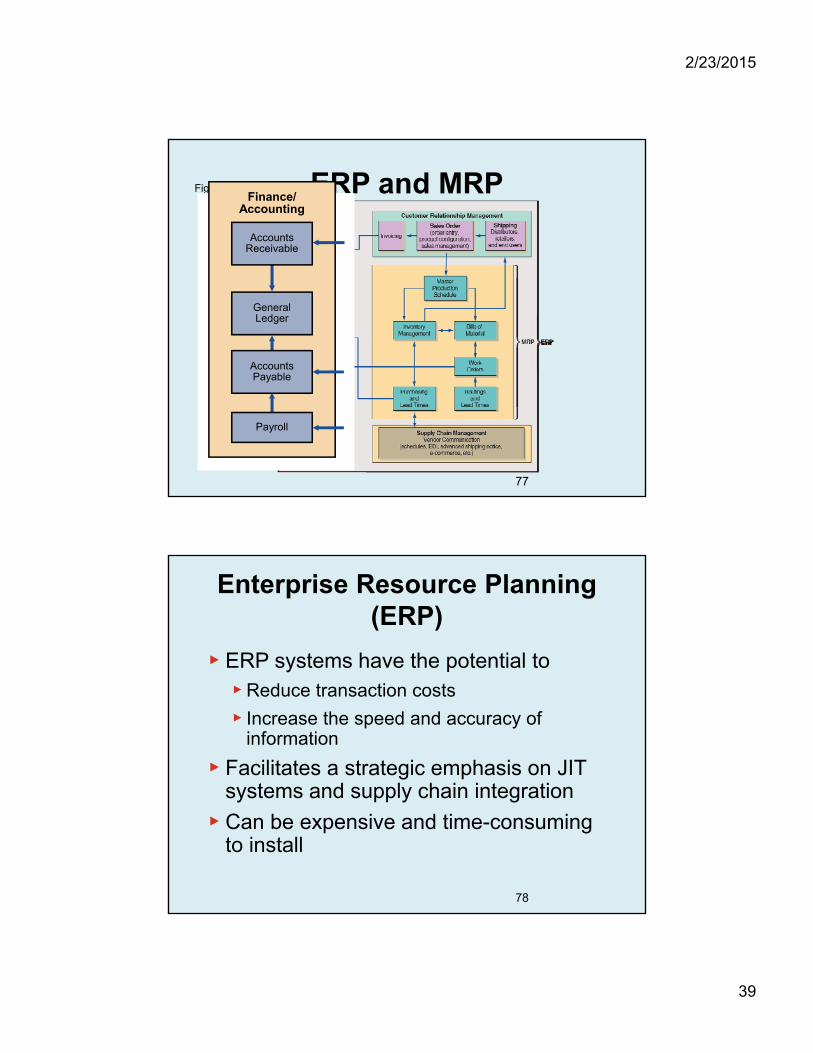
ERP and MRPFigure 14.10
Table 13.6
Finance/Accounting
General Ledger
Accounts Receivable
Payroll
Accounts Payable
77
Enterprise Resource Planning (ERP)
▶ ERP systems have the potential to▶Reduce transaction costs
▶ Increase the speed and accuracy of information
▶ Facilitates a strategic emphasis on JIT systems and supply chain integration
▶ Can be expensive and time-consuming to install
78
2/23/2015
40
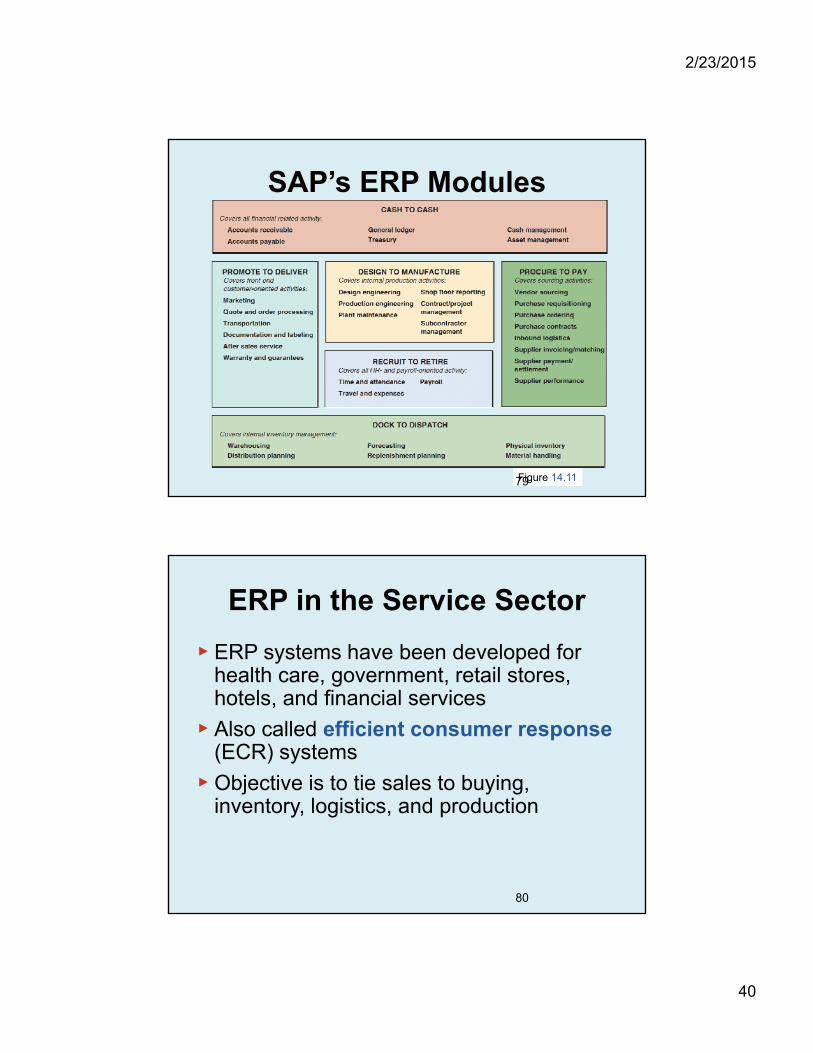
SAP’s ERP Modules
Figure 14.1179
ERP in the Service Sector
▶ ERP systems have been developed for health care, government, retail stores, hotels, and financial services
▶ Also called efficient consumer response (ECR) systems
▶ Objective is to tie sales to buying, inventory, logistics, and production
80