Embed Size (px)
Citation preview
183
14
INJURY BIOMECHANICS RESEARCH Proceedings of the Thirtieth International Workshop
Material Characterization of Ligaments Using Non-contact Strain Measurement and Digitization
D. Bose, P. Sanghavi, J. R. Kerrigan, N. J. Madeley, K. S. Bhalla, and J. R. Crandall
This paper has not been screened for accuracy nor refereed by any body of scientific peers and should not be referenced in the open literature.
ABSTRACT
Area and strain measurement pose special problems in experiments designed to characterize the constitutive response of ligamentous tissue. Contact area measurements tools yield inaccurate results because the specimen is easily deformed. In this study, a 3D non-contact optical digitizer that relies on the principle of structured lighting is used to develop geometric models of all the ligaments of the knee joint, from which accurate calculations of cross-sectional area can be made. Similarly, it is important that the strain measurement technique used does not disturb the strain state of the specimen. Furthermore, full-field strain measurements are necessary because ligamentous tissue is inhomogeneous and local strain measurements can be misleading. Thus, this study demonstrates the application of a full-field 3D non-contact strain measurement system that relies on principles of photogrammetry and pattern recognition to compute the surface strain distribution on the Medial Collateral Ligament (MCL) of the human knee joint.
INTRODUCTION
esigning experiments for material characterization of knee ligaments poses several problems and has therefore been a subject of much debate. Two issues, in particular, are the
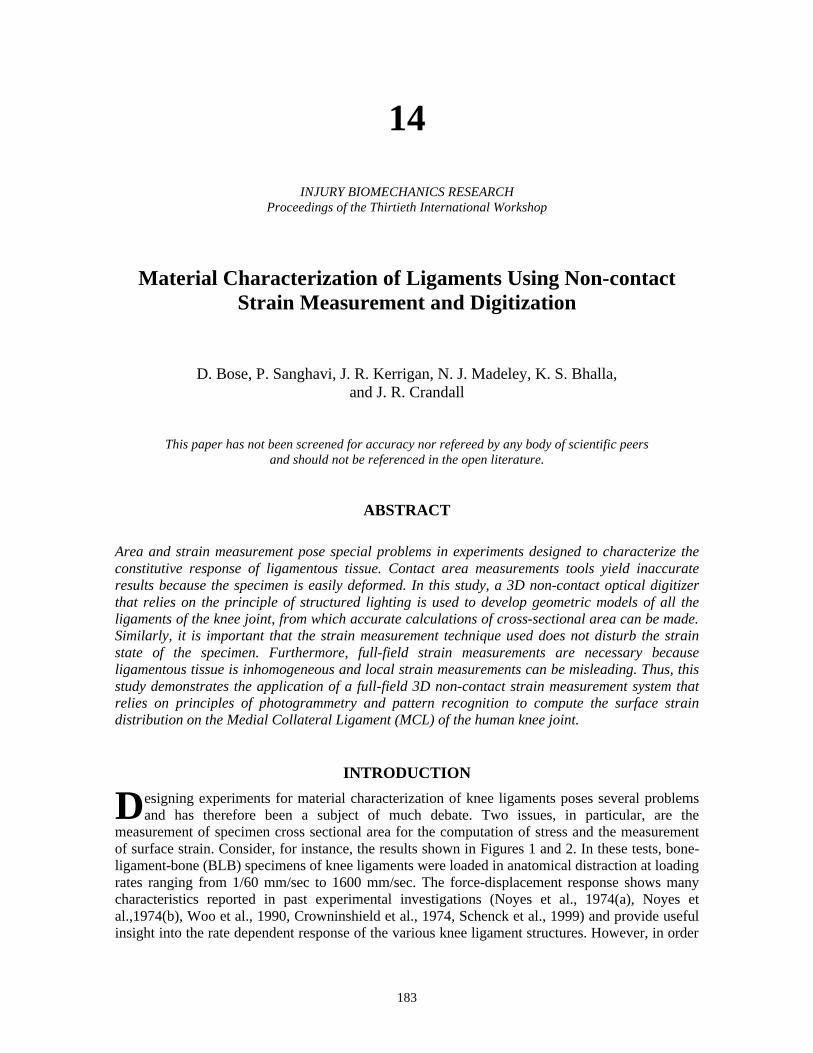
measurement of specimen cross sectional area for the computation of stress and the measurement of surface strain. Consider, for instance, the results shown in Figures 1 and 2. In these tests, bone-ligament-bone (BLB) specimens of knee ligaments were loaded in anatomical distraction at loading rates ranging from 1/60 mm/sec to 1600 mm/sec. The force-displacement response shows many characteristics reported in past experimental investigations (Noyes et al., 1974(a), Noyes et al.,1974(b), Woo et al., 1990, Crowninshield et al., 1974, Schenck et al., 1999) and provide useful insight into the rate dependent response of the various knee ligament structures. However, in order
D
Injury Biomechanics Research
184
to develop a constitutive model, the stress-strain response of the tissue is required. Thus, methodologies capable of measuring ligament cross-sectional area and surface strain distribution are necessary.
Traditional area measurement methods, such as using calipers and projection techniques, cannot be used because the ligament is easily deformed by contact, and these approximations do not account for the complex cross-sectional ligament geometry. In this study, an optical non-contact digitizer is used to build high resolution solid models of the ligament surface from which cross-sectional geometry and area are easily obtained.
Similarly, conventional strain measurement techniques, such as using extensometers, disturb the strain state in the ligament and result in point measurements that do not account for the vastly varying strain distribution resulting from material in-homogeneity. This study addresses these issues by making full-field measurements using a 3D non-contact strain measurement system.
In the following sections, the non-contact area and strain measurement systems are described first. This is followed by a review of the literature for ligament strain and area measurement techniques and an application of the non-contact methods.
0
50
100
150
200
250
300
0 2 4 6 8 10Actuator Displacement (mm)
Lig
amen
t L
oad
(N
)
1/60 mm/s160 mm/s1600 mm/s
Figure 1: Force-displacement response of the LCL of the human knee joint at varying strain rates
0
20
40
60
80
100
120
140
160
0 2 4 6 8 10 12Actuator Displacement (mm)
Liga
men
t Lo
ad (
N)
aPCLLCLpACL
0
100
200
300
400
500
600
700
800
0 2 4 6 8 10 12Actuator Displacement (mm)
Liga
men
t Lo
ad (
N)
MCL
Figure 2: Force-displacement response for the LCL, antero-lateral bundle of the PCL (aPCL), postero-lateral
bundle of the ACL (pACL) (left) and MCL (right) at quasi-static loading (1/60 mm/sec)
Material characterization of ligaments using non-contact strain measurement and digitization
185
NON-CONTACT DIGITIZATION AND STRAIN MEASUREMENT
In this study, non contact optical methods have been used for ligament area and strain measurement. A three dimensional non-contact surface digitization system (ATOSTM: Advanced TOpometric Sensor) was used to digitize the ligament surface and obtain cross-sectional geometry. The principle of structured lighting is used to obtain explicit information about the object. The system has been widely used for digitization of non-biological objects for use in CAD and rapid prototyping (Capture 3d, 2002).
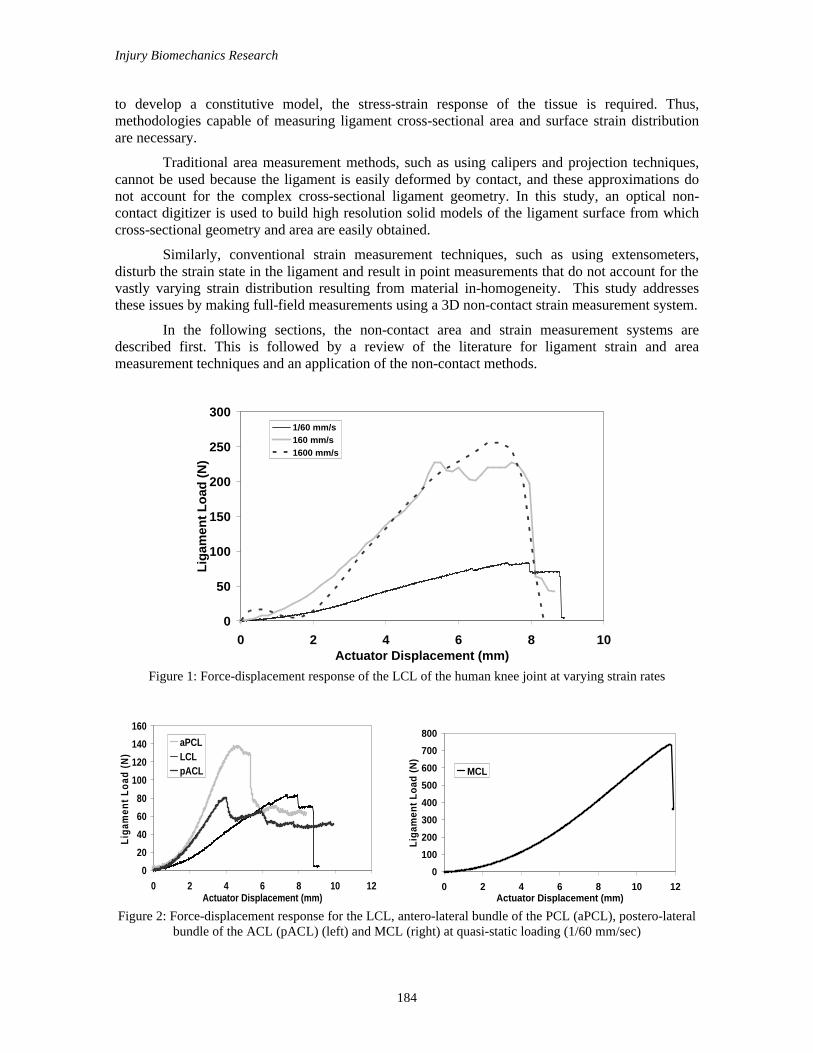
A 3D measurement volume is first calibrated using calibration templates. Then a series of phase shifted fringe patterns are projected on the ligament and imaged using two CCD (Charged Coupled Devices) cameras to yield spatial coordinates of the surface. The specimen is then rotated and imaged again. Reference markers on the ligaments are used to ensure overlap between successive measurements. The schematic of the set-up is shown in Figure 3. The system yields detailed point cloud data, which can be processed to develop a solid model of the ligament. The measurement volume of the system ranges from 45 X 36 X 20 mm3 to 200 X 160 X 150 mm3. The resolution of point spacing in the digitized model ranges from 0.03 mm to 0.15 mm.
Fixture for ligament testing
Area of the specimen viewed by the cameras
Reference Markers
Bone Cups
Rotation direction
CCD Cameras
Computer
Projector
Figure 3: Schematic showing the non contact digitization system, consisting of 2 CCD cameras, a projection
unit and a computer for data acquisition
For strain measurement, a 3D photogrammetric device (ARAMISTM) was used for non-contact surface strain measurement (Tyson et al., 2002). A random speckle pattern is painted on the surface of the ligament. The ligament is sequentially imaged with increasing strain by two CCD cameras and pattern recognition is used to track the speckle pattern (facets) from image to image. 3D photogrammetry is used to calculate the displacement field from facet deformation, which is differentiated to obtain the surface strain field. The set-up for strain measurement is similar to the digitization system shown in Figure 3, except there is no need for a projection unit. The system is capable of using cameras with different lenses (17mm, 23mm and 50mm) which permit measurement volumes ranging from 10 X 8 X 4 mm3 to 350 X 280 X 140 mm. In the experiments described here, a 100mm X 80mm X 80mm measurement volume (50 mm camera lens), was used.
Injury Biomechanics Research
186
The CCD cameras used have a resolution of 768 X 572 pixels, and the frame grabber is suited for static tests only. Strains of at least 0.5% need to be generated in order to get accurate strain
AREA MEASUREMENT OF KNEE LIGAMENT BUNDLES
Traditional measurement tools, such as calipers, cannot be used to make accurate width measurements on ligaments since they deform the tissue, underestimate the dimensions and yield inconsistent results (Lee et al., 1988, Allard et al, 1979). This problem is partially solved by the use of pressure-limited micrometers, which makes the measurements repeatable. However, in order to make these measurements comparable across several studies, it is important that researchers standardize the contact pressure (Butler et al., 1985).
Ideally, the area measurement technique should not disturb the surface of the specimen. Non-contact projection methods, such as laser micrometers, provide such a procedure. Repeated measurements using laser micrometers have been used to estimate cross sectional area and shape (Lee et al., 1988, Iaconis et al., 1987). While such measurements take considerably longer time than other methods, they provide significantly improved accuracy. However, since projection methods rely on a series of width measurements to approximate area, they do not account for surface concavity. Digitizing the surface of the ligament using non-contact techniques, as described in this paper, accounts for these drawbacks.
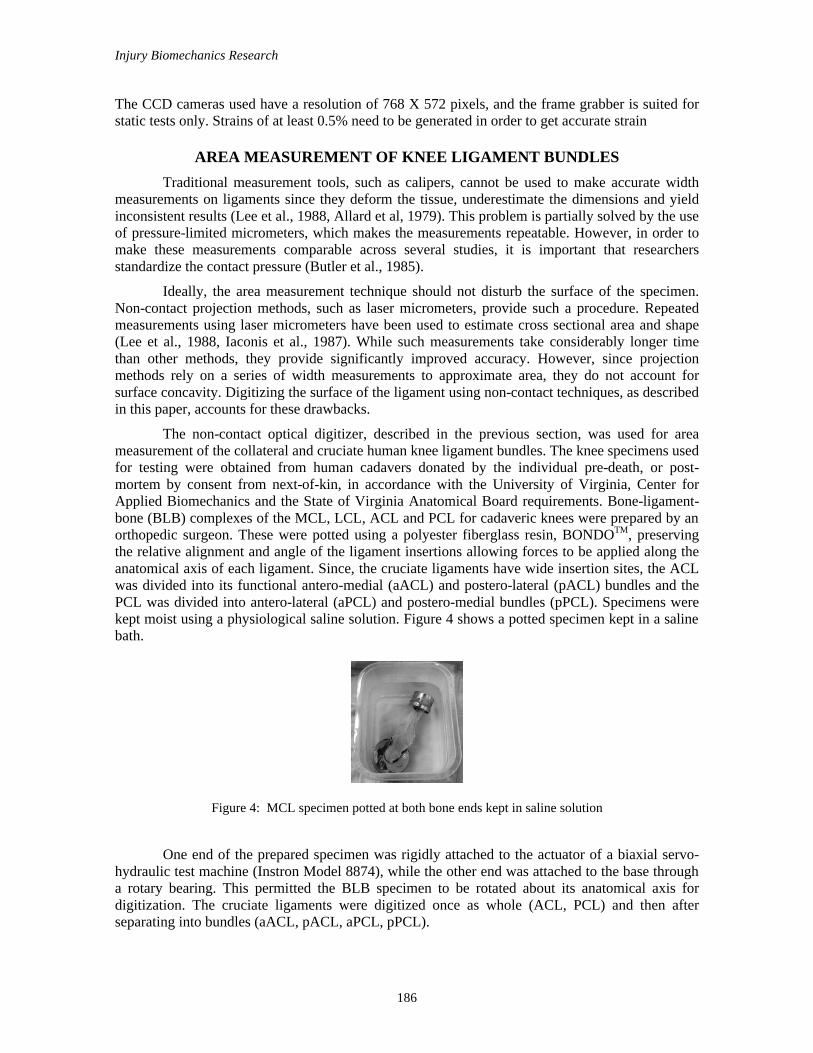
The non-contact optical digitizer, described in the previous section, was used for area measurement of the collateral and cruciate human knee ligament bundles. The knee specimens used for testing were obtained from human cadavers donated by the individual pre-death, or post-mortem by consent from next-of-kin, in accordance with the University of Virginia, Center for Applied Biomechanics and the State of Virginia Anatomical Board requirements. Bone-ligament-bone (BLB) complexes of the MCL, LCL, ACL and PCL for cadaveric knees were prepared by an orthopedic surgeon. These were potted using a polyester fiberglass resin, BONDOTM, preserving the relative alignment and angle of the ligament insertions allowing forces to be applied along the anatomical axis of each ligament. Since, the cruciate ligaments have wide insertion sites, the ACL was divided into its functional antero-medial (aACL) and postero-lateral (pACL) bundles and the PCL was divided into antero-lateral (aPCL) and postero-medial bundles (pPCL). Specimens were kept moist using a physiological saline solution. Figure 4 shows a potted specimen kept in a saline bath.
Figure 4: MCL specimen potted at both bone ends kept in saline solution
One end of the prepared specimen was rigidly attached to the actuator of a biaxial servo-
hydraulic test machine (Instron Model 8874), while the other end was attached to the base through a rotary bearing. This permitted the BLB specimen to be rotated about its anatomical axis for digitization. The cruciate ligaments were digitized once as whole (ACL, PCL) and then after separating into bundles (aACL, pACL, aPCL, pPCL).
Material characterization of ligaments using non-contact strain measurement and digitization
187
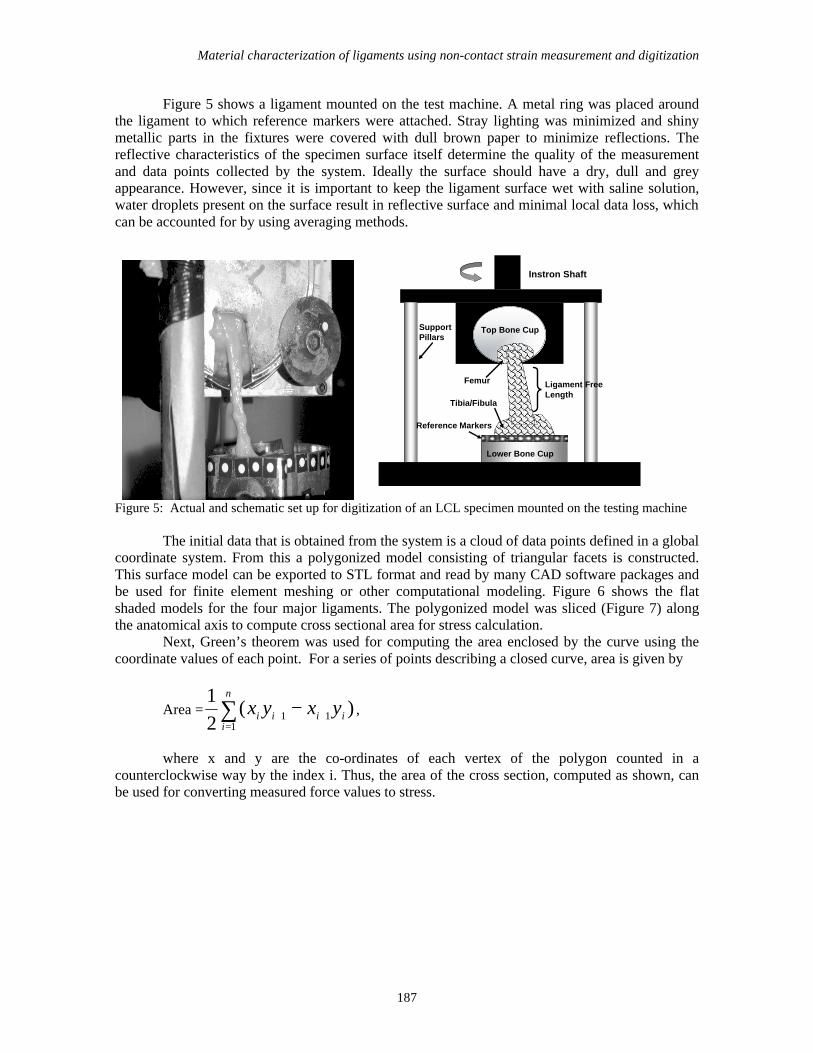
Figure 5 shows a ligament mounted on the test machine. A metal ring was placed around the ligament to which reference markers were attached. Stray lighting was minimized and shiny metallic parts in the fixtures were covered with dull brown paper to minimize reflections. The reflective characteristics of the specimen surface itself determine the quality of the measurement and data points collected by the system. Ideally the surface should have a dry, dull and grey appearance. However, since it is important to keep the ligament surface wet with saline solution, water droplets present on the surface result in reflective surface and minimal local data loss, which can be accounted for by using averaging methods.
Instron Shaft
Top Bone Cup
Femur Ligament Free Length
Tibia/Fibula
Lower Bone Cup
Reference Markers
Support Pillars
Figure 5: Actual and schematic set up for digitization of an LCL specimen mounted on the testing machine
The initial data that is obtained from the system is a cloud of data points defined in a global
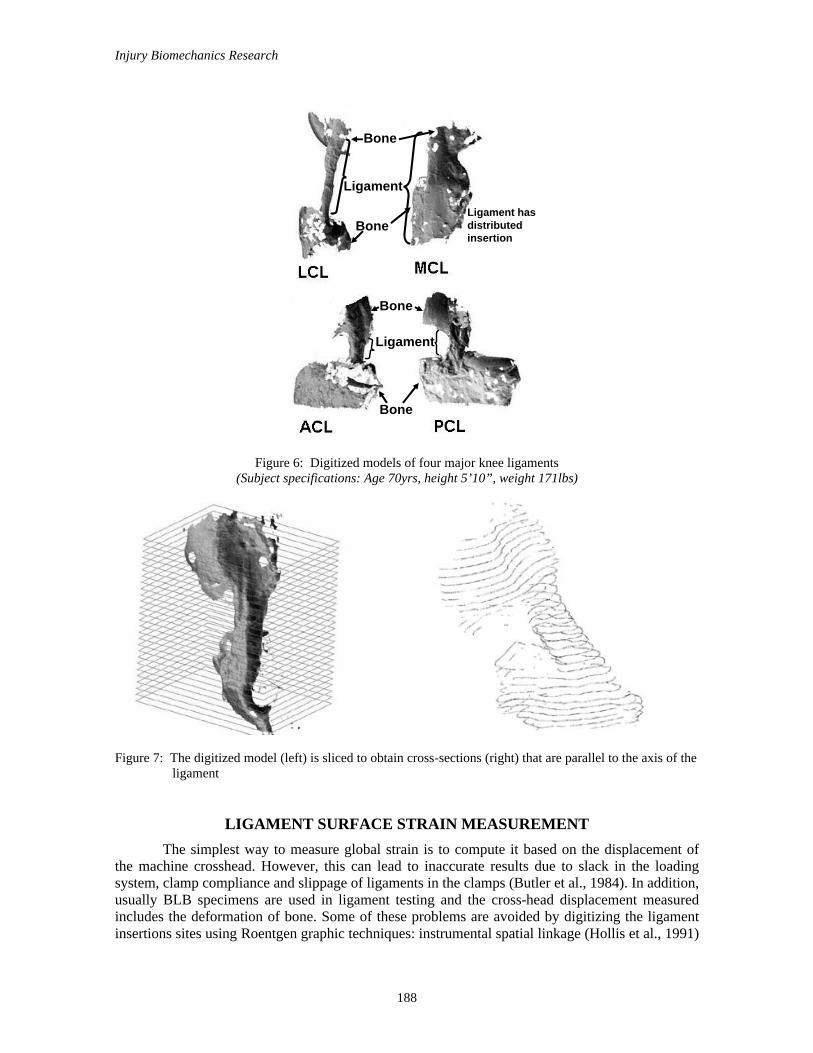
coordinate system. From this a polygonized model consisting of triangular facets is constructed. This surface model can be exported to STL format and read by many CAD software packages and be used for finite element meshing or other computational modeling. Figure 6 shows the flat shaded models for the four major ligaments. The polygonized model was sliced (Figure 7) along the anatomical axis to compute cross sectional area for stress calculation.
Next, Green’s theorem was used for computing the area enclosed by the curve using the coordinate values of each point. For a series of points describing a closed curve, area is given by
Area = ∑=
++ −n
iiiii yxyx
111 )(
21
,
where x and y are the co-ordinates of each vertex of the polygon counted in a
counterclockwise way by the index i. Thus, the area of the cross section, computed as shown, can be used for converting measured force values to stress.
Injury Biomechanics Research
188
Bone
Ligament
Bone
Ligament
Ligament has distributed insertion
Bone
Bone
Figure 6: Digitized models of four major knee ligaments
(Subject specifications: Age 70yrs, height 5’10”, weight 171lbs)
Figure 7: The digitized model (left) is sliced to obtain cross-sections (right) that are parallel to the axis of the ligament
LIGAMENT SURFACE STRAIN MEASUREMENT
The simplest way to measure global strain is to compute it based on the displacement of the machine crosshead. However, this can lead to inaccurate results due to slack in the loading system, clamp compliance and slippage of ligaments in the clamps (Butler et al., 1984). In addition, usually BLB specimens are used in ligament testing and the cross-head displacement measured includes the deformation of bone. Some of these problems are avoided by digitizing the ligament insertions sites using Roentgen graphic techniques: instrumental spatial linkage (Hollis et al., 1991)
Material characterization of ligaments using non-contact strain measurement and digitization
189
or calipers (Wang et al., 1973). However, assigning a single averaged value of strain in the ligament ignores the inhomogeneous strain distributions that develop across the surface of the ligament. Local strain measurements using traditional strain gages and extensometers are not accurate because they can affect the strain field due to the relatively low stiffness of ligamentous tissue. However, accurate measurements have been obtained by using liquid metal strain gauges (Bach et al., 1997, Kennedy et al., 1977, Edwards et al., 1970), Hall-effect strain transducers (Arms et al., 1983, Arms et al., 1984, Renstrom et al, 1986, Wang et al., 1973) and differential variable reluctance transducers (DVRT) (Yamamoto et al., 1998). However, these methods only provide strain measurements at a limited number of points and do not measure the full field surface strain distribution.
Most of the problems addressed above can be avoided by using non-contact strain measurement techniques. The video dimensional analyzer was originally described by Yin et al. (1972) and used by Woo et al. (1982), for measurement of ligament strain. This method uses a video image of the specimen and tracks reference lines drawn on the ligament surface. Motion analysis studies have been done on such video recording of testing using small contrast markers (Weiss et al., 1992). Two dimensional motion analysis has been extended to three dimensional strain measurements using Direct Linear transformation from multiple two dimensional views (Shapiro et al., 1978). Other optical methods have included experiments based on photo-elasticity; the results of which were compared with DVRT measurements, and found to produce valid and accurate data of the strain distribution in ligaments (Yamamoto et al., 1998).
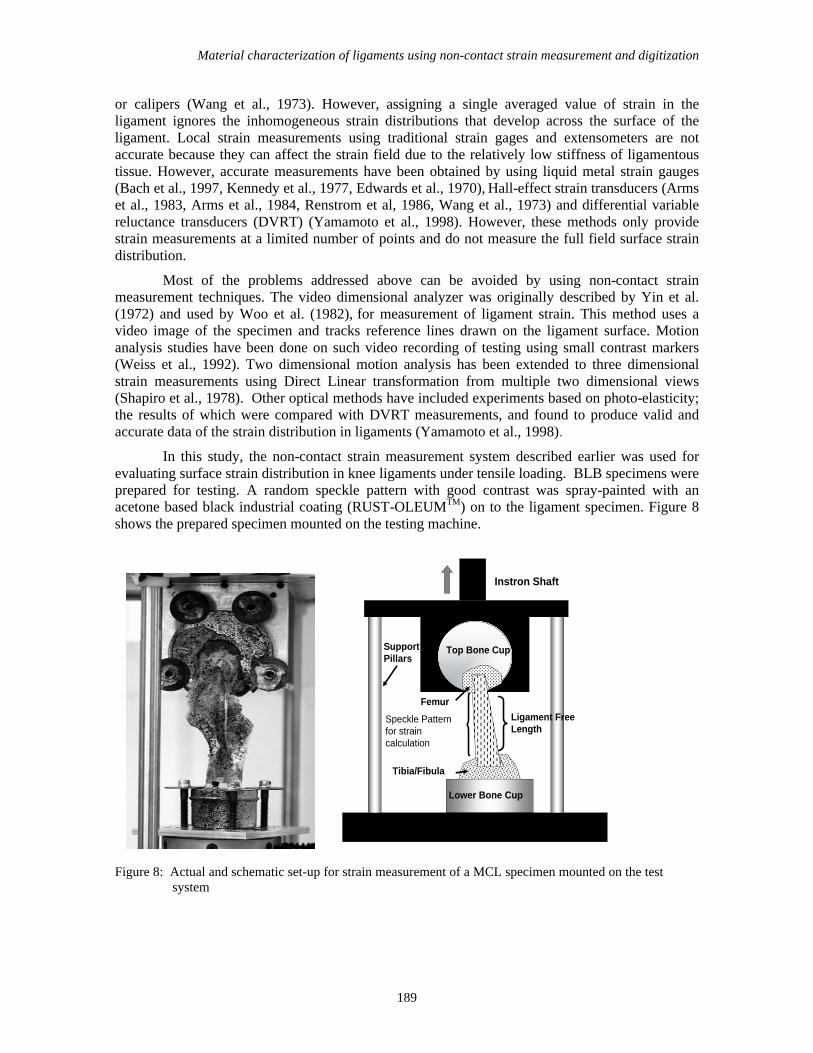
In this study, the non-contact strain measurement system described earlier was used for evaluating surface strain distribution in knee ligaments under tensile loading. BLB specimens were prepared for testing. A random speckle pattern with good contrast was spray-painted with an acetone based black industrial coating (RUST-OLEUMTM) on to the ligament specimen. Figure 8 shows the prepared specimen mounted on the testing machine.
Instron Shaft
Top Bone Cup
Femur
Ligament Free Length
Tibia/Fibula
Lower Bone Cup
Support Pillars
Speckle Pattern for strain calculation
Figure 8: Actual and schematic set-up for strain measurement of a MCL specimen mounted on the test
system
Injury Biomechanics Research
190
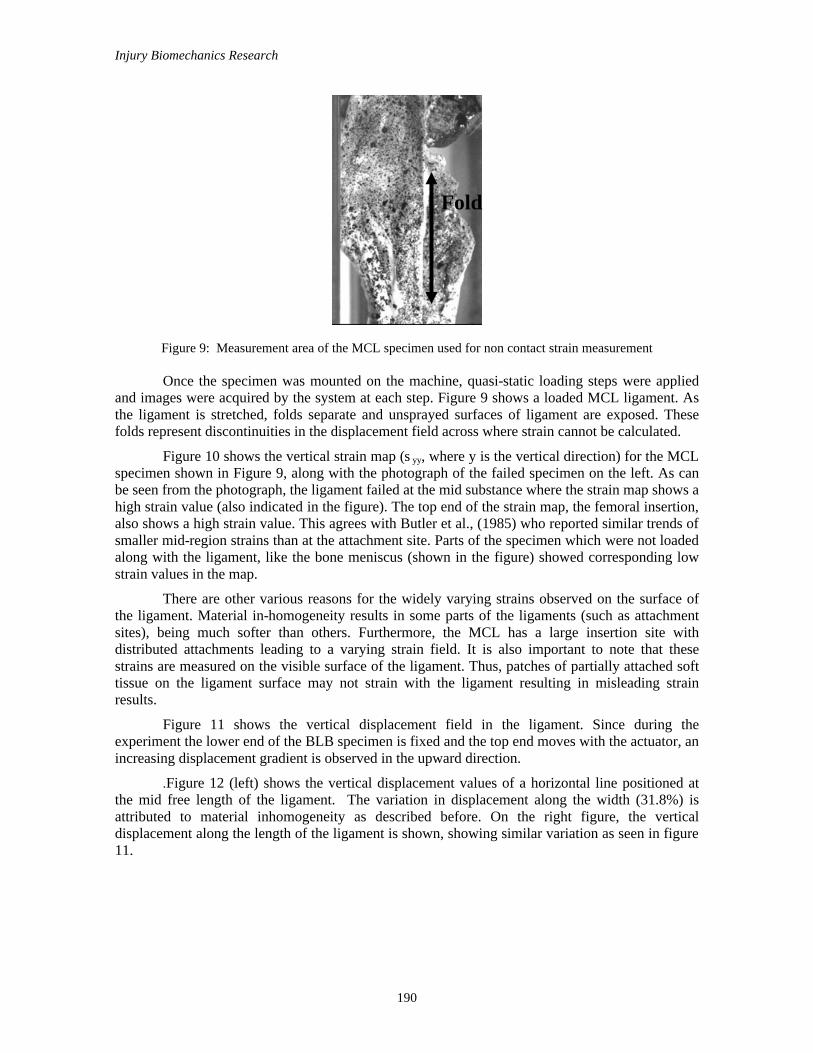
Figure 9: Measurement area of the MCL specimen used for non contact strain measurement
Once the specimen was mounted on the machine, quasi-static loading steps were applied and images were acquired by the system at each step. Figure 9 shows a loaded MCL ligament. As the ligament is stretched, folds separate and unsprayed surfaces of ligament are exposed. These folds represent discontinuities in the displacement field across where strain cannot be calculated.
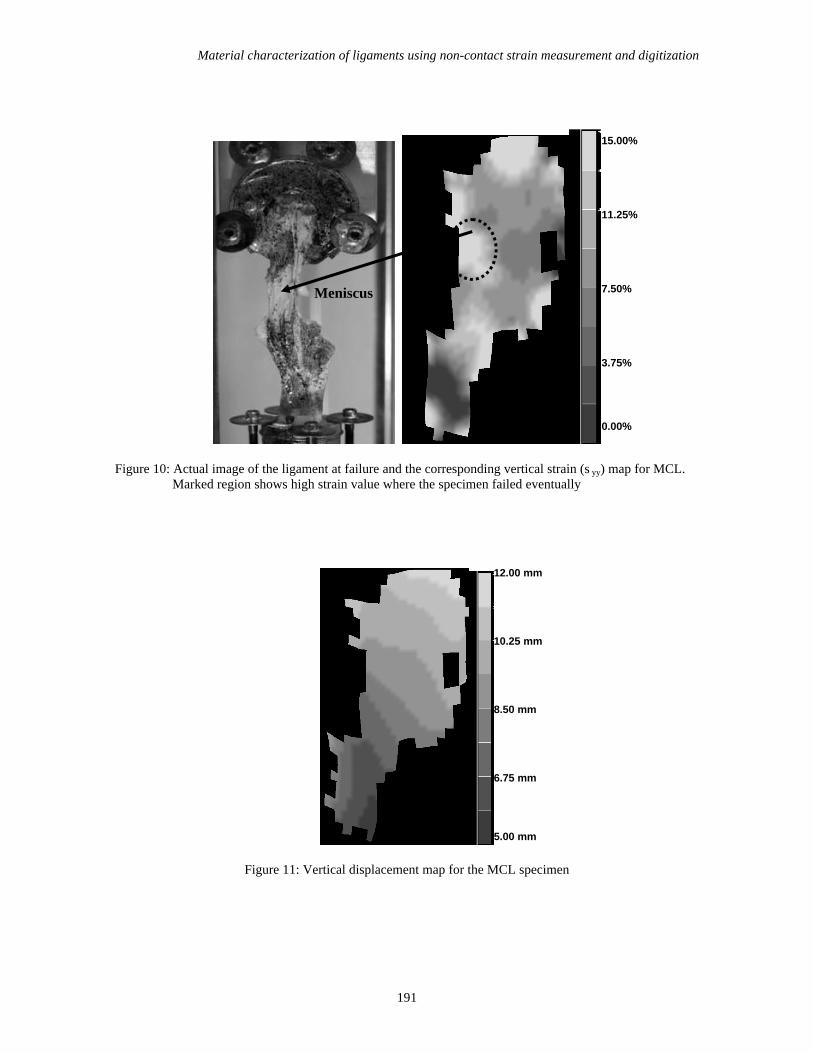
Figure 10 shows the vertical strain map (s yy, where y is the vertical direction) for the MCL specimen shown in Figure 9, along with the photograph of the failed specimen on the left. As can be seen from the photograph, the ligament failed at the mid substance where the strain map shows a high strain value (also indicated in the figure). The top end of the strain map, the femoral insertion, also shows a high strain value. This agrees with Butler et al., (1985) who reported similar trends of smaller mid-region strains than at the attachment site. Parts of the specimen which were not loaded along with the ligament, like the bone meniscus (shown in the figure) showed corresponding low strain values in the map.
There are other various reasons for the widely varying strains observed on the surface of the ligament. Material in-homogeneity results in some parts of the ligaments (such as attachment sites), being much softer than others. Furthermore, the MCL has a large insertion site with distributed attachments leading to a varying strain field. It is also important to note that these strains are measured on the visible surface of the ligament. Thus, patches of partially attached soft tissue on the ligament surface may not strain with the ligament resulting in misleading strain results.
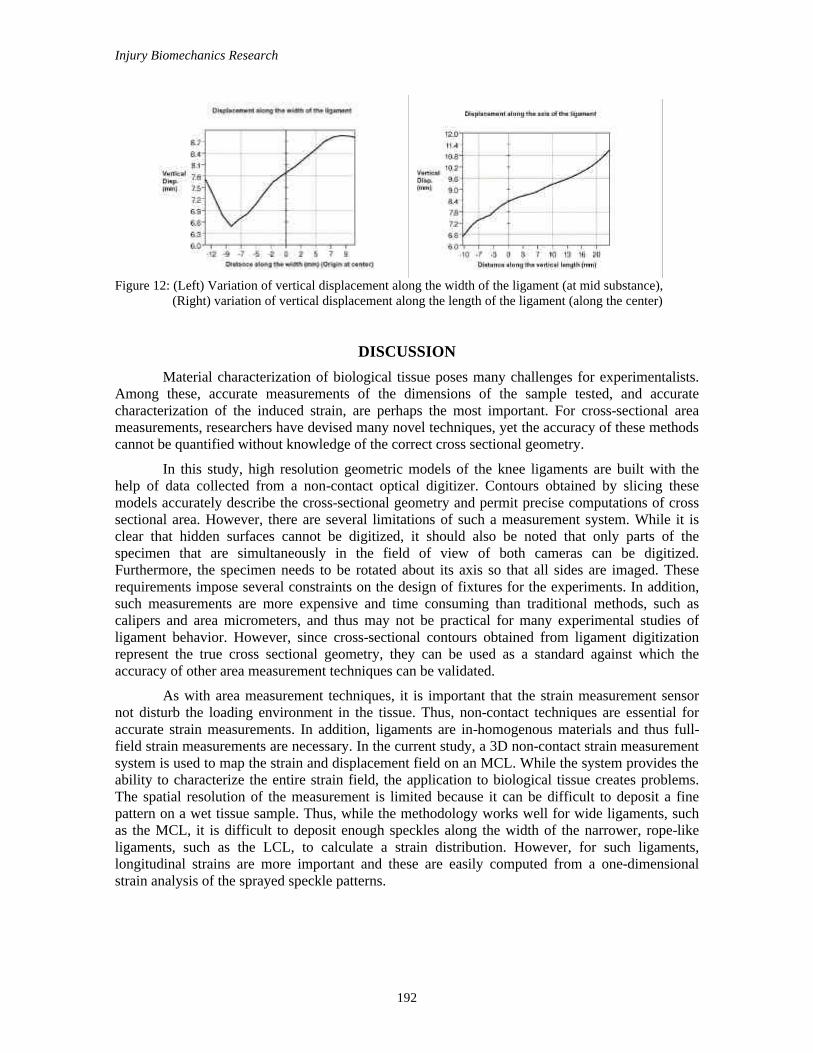
Figure 11 shows the vertical displacement field in the ligament. Since during the experiment the lower end of the BLB specimen is fixed and the top end moves with the actuator, an increasing displacement gradient is observed in the upward direction.
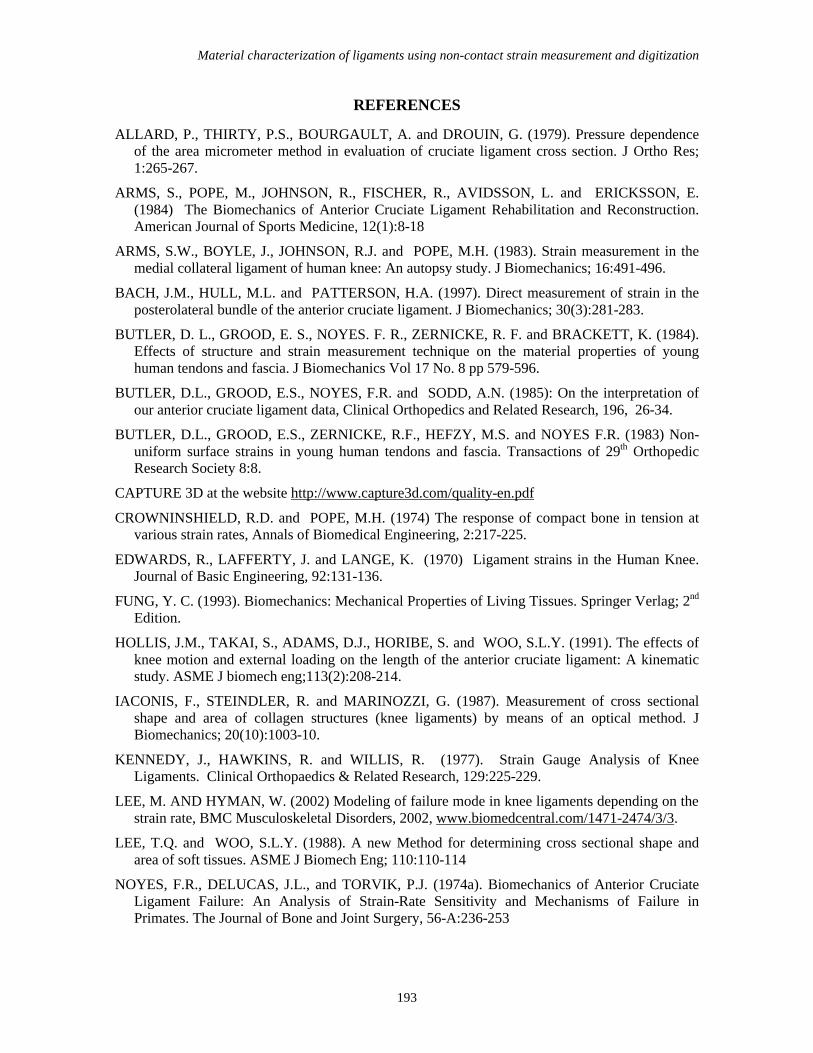
.Figure 12 (left) shows the vertical displacement values of a horizontal line positioned at the mid free length of the ligament. The variation in displacement along the width (31.8%) is attributed to material inhomogeneity as described before. On the right figure, the vertical displacement along the length of the ligament is shown, showing similar variation as seen in figure 11.
Fold
Material characterization of ligaments using non-contact strain measurement and digitization
191
Figure 10: Actual image of the ligament at failure and the corresponding vertical strain (s yy) map for MCL. Marked region shows high strain value where the specimen failed eventually
Figure 11: Vertical displacement map for the MCL specimen
12.00 mm
10.25 mm
8.50 mm
6.75 mm
5.00 mm
Meniscus
15.00%
11.25%
7.50%
3.75%
0.00%
Injury Biomechanics Research
192
Figure 12: (Left) Variation of vertical displacement along the width of the ligament (at mid substance),
(Right) variation of vertical displacement along the length of the ligament (along the center)
DISCUSSION
Material characterization of biological tissue poses many challenges for experimentalists. Among these, accurate measurements of the dimensions of the sample tested, and accurate characterization of the induced strain, are perhaps the most important. For cross-sectional area measurements, researchers have devised many novel techniques, yet the accuracy of these methods cannot be quantified without knowledge of the correct cross sectional geometry.
In this study, high resolution geometric models of the knee ligaments are built with the help of data collected from a non-contact optical digitizer. Contours obtained by slicing these models accurately describe the cross-sectional geometry and permit precise computations of cross sectional area. However, there are several limitations of such a measurement system. While it is clear that hidden surfaces cannot be digitized, it should also be noted that only parts of the specimen that are simultaneously in the field of view of both cameras can be digitized. Furthermore, the specimen needs to be rotated about its axis so that all sides are imaged. These requirements impose several constraints on the design of fixtures for the experiments. In addition, such measurements are more expensive and time consuming than traditional methods, such as calipers and area micrometers, and thus may not be practical for many experimental studies of ligament behavior. However, since cross-sectional contours obtained from ligament digitization represent the true cross sectional geometry, they can be used as a standard against which the accuracy of other area measurement techniques can be validated.
As with area measurement techniques, it is important that the strain measurement sensor not disturb the loading environment in the tissue. Thus, non-contact techniques are essential for accurate strain measurements. In addition, ligaments are in-homogenous materials and thus full-field strain measurements are necessary. In the current study, a 3D non-contact strain measurement system is used to map the strain and displacement field on an MCL. While the system provides the ability to characterize the entire strain field, the application to biological tissue creates problems. The spatial resolution of the measurement is limited because it can be difficult to deposit a fine pattern on a wet tissue sample. Thus, while the methodology works well for wide ligaments, such as the MCL, it is difficult to deposit enough speckles along the width of the narrower, rope-like ligaments, such as the LCL, to calculate a strain distribution. However, for such ligaments, longitudinal strains are more important and these are easily computed from a one-dimensional strain analysis of the sprayed speckle patterns.
Material characterization of ligaments using non-contact strain measurement and digitization
193
REFERENCES
ALLARD, P., THIRTY, P.S., BOURGAULT, A. and DROUIN, G. (1979). Pressure dependence of the area micrometer method in evaluation of cruciate ligament cross section. J Ortho Res; 1:265-267.
ARMS, S., POPE, M., JOHNSON, R., FISCHER, R., AVIDSSON, L. and ERICKSSON, E. (1984) The Biomechanics of Anterior Cruciate Ligament Rehabilitation and Reconstruction. American Journal of Sports Medicine, 12(1):8-18
ARMS, S.W., BOYLE, J., JOHNSON, R.J. and POPE, M.H. (1983). Strain measurement in the medial collateral ligament of human knee: An autopsy study. J Biomechanics; 16:491-496.
BACH, J.M., HULL, M.L. and PATTERSON, H.A. (1997). Direct measurement of strain in the posterolateral bundle of the anterior cruciate ligament. J Biomechanics; 30(3):281-283.
BUTLER, D. L., GROOD, E. S., NOYES. F. R., ZERNICKE, R. F. and BRACKETT, K. (1984). Effects of structure and strain measurement technique on the material properties of young human tendons and fascia. J Biomechanics Vol 17 No. 8 pp 579-596.
BUTLER, D.L., GROOD, E.S., NOYES, F.R. and SODD, A.N. (1985): On the interpretation of our anterior cruciate ligament data, Clinical Orthopedics and Related Research, 196, 26-34.
BUTLER, D.L., GROOD, E.S., ZERNICKE, R.F., HEFZY, M.S. and NOYES F.R. (1983) Non-uniform surface strains in young human tendons and fascia. Transactions of 29th Orthopedic Research Society 8:8.
CAPTURE 3D at the website http://www.capture3d.com/quality-en.pdf
CROWNINSHIELD, R.D. and POPE, M.H. (1974) The response of compact bone in tension at various strain rates, Annals of Biomedical Engineering, 2:217-225.
EDWARDS, R., LAFFERTY, J. and LANGE, K. (1970) Ligament strains in the Human Knee. Journal of Basic Engineering, 92:131-136.
FUNG, Y. C. (1993). Biomechanics: Mechanical Properties of Living Tissues. Springer Verlag; 2nd Edition.
HOLLIS, J.M., TAKAI, S., ADAMS, D.J., HORIBE, S. and WOO, S.L.Y. (1991). The effects of knee motion and external loading on the length of the anterior cruciate ligament: A kinematic study. ASME J biomech eng;113(2):208-214.
IACONIS, F., STEINDLER, R. and MARINOZZI, G. (1987). Measurement of cross sectional shape and area of collagen structures (knee ligaments) by means of an optical method. J Biomechanics; 20(10):1003-10.
KENNEDY, J., HAWKINS, R. and WILLIS, R. (1977). Strain Gauge Analysis of Knee Ligaments. Clinical Orthopaedics & Related Research, 129:225-229.
LEE, M. AND HYMAN, W. (2002) Modeling of failure mode in knee ligaments depending on the strain rate, BMC Musculoskeletal Disorders, 2002, www.biomedcentral.com/1471-2474/3/3.
LEE, T.Q. and WOO, S.L.Y. (1988). A new Method for determining cross sectional shape and area of soft tissues. ASME J Biomech Eng; 110:110-114
NOYES, F.R., DELUCAS, J.L., and TORVIK, P.J. (1974a). Biomechanics of Anterior Cruciate Ligament Failure: An Analysis of Strain-Rate Sensitivity and Mechanisms of Failure in Primates. The Journal of Bone and Joint Surgery, 56-A:236-253
Injury Biomechanics Research
194
NOYES, F.R., TORVIK, P.J., HYDE, W.B.M. and DELUCAS, J.L. (1974b). Biomechanics of Ligament Faiure II. An Analysis of Immobilization, Exercise and Reconditioning Effects in Primate. The Journal of Bone and Joint Surgery, 56-A:1406-1418.
RENSTROM, P., ARMS, S., STANWYCK, T., JOHNSON, R. and POPE, M. (1986) Strain Within the Anterior Cruciate Ligament During Hamstring and Quadriceps Activity. American Journal of Sports Medicine-14(1):83-87.
SCHENCK, R.C., KOVACH, I.S., AGARWAL, A., BRUMMETT, R. and WARD, R.A. (1999) Cruciate injury patterins in knee hyperextension: A cadaveric model. Arthroscopy, 15:489-495.
SHAPIRO, R. (1978). Direct linear transformation method for 3-D cinematography. Research Quarterly 1978;49:197-205
TYSON, J. and SCHMIDT, T. (2002), Advanced Photogrammetry for Robust Deformation and Strain measurement, Trillion Quality Systems, GOM mbH.
WANG, C.J., WALKER, P.S. and WOLF, B. (1973). The effects of flexion and rotation on the length of the ligaments of the knee. J Biomechanics;6:587-596
WEISS, J.A., FRANCE, E.P., BAGLEY, A.M. and BLOMSTROM, G. (1992). Measurement of 2-D strain in ligaments under uniaxial tension. Trans 38th Meeting Orthop Res Soc;17(2):662.
WOO, S.L.Y. (1982). Mechanical Properties of Tendons and Ligaments I. Quasi-static and viscoelastic properties. Biorheology 19:385-396.
WOO, S.L.Y., PETERSON, R.H., OHLAND, K.J., SITES, T.J. and DANTO, M.I. (1990). The effects of strain rate on the properties of the medial collateral ligament in skeletally immature and mature rabbits: A biomechanical and histological study. Journal of Orthopedic Research, 8:712-721.
YAMAMOTO, K., HIROKAWA, S. and KAWADA, T. (1998). Strain distribution in the ligament using photoelasticity. A direct application to the human ACL. Medical Engineering & Physics J. Vol. 20.
YIN, F.C., TOMPKINS, W.R., PETERSON, K.L. and INTEGLIETTA, M. A. (1972) Video dimension analyzer. IEEE Trans Biomed Eng; 19:376-381.
Material characterization of ligaments using non-contact strain measurement and digitization
195
DISCUSSION PAPER: Material Characterization of Ligaments Using Non-contact
Strain Measurement and Digitization PRESENTER: Kavi Bhalla, University of Virginia QUESTION: John Garner, MacInnis Engineering
One thing on the ligament strain testing I wanted to ask is if you did any measurement of an initial strain distribution?
ANSWER: Do you mean the strain change from the in-vivo state to the relaxed unloaded state?
Q: Yeah, because there is a lot of strain present in a relaxed knee, and it’s a very non-uniform strain. So if you start out with an assumption that it’s zero everywhere–
A: We haven’t measured in-vivo strain. But that’s a very interesting question and I would be very interested in actually doing that. Thank you.
Q: Guy Nusholtz, Daimler/Chrysler
How are you getting the stress state across the surface? I understand you’re making area measurements and you’re getting force, but you don’t know what stress is on which filament.
A: We’re not. We don’t know what the stress is at each point. All I’m trying to do to convert the force measurement and do a stress measurement at a certain cross section.
Q: So, it’s an average stress.
A: Yes, It’s an average stress.
Q: Okay. So you’ve got the strain map, but you don’t have the full stress map.
A: Right.
Q: Okay. Thank you. Q: Dave Meaney from U. Penn I thought it was an interesting paper. I had two quick questions. First relates to noise in the
measurement technique, and I assume that the contour images that you had are principle strains that were calculated?
A: Those were strains along the longitudinal axis.
Q: Oh, longitudinal axis. Okay. With the speckle pattern and the spacing between individual speckles, is there a recommended distance above which you used to calculate?
A: There is a recommended distance, but that is related with the resolution of the cameras that we’re using. Our system used images consisting of 640 x 480 pixels, subdivided into facets consisting of a collection of pixels. Each facet needs to have at least enough pixels to discern a pattern. So yes, there is a scaling that goes with it. If you had a very high-resolution camera, we could, theoretically, apply a very fine speckle pattern and accurately measure local strain distributions.
Q: Okay. And then, the second question is the out-of-plane displacement? Do you have plans on possibly taking that into account in your analysis?

Injury Biomechanics Research
196
A: We do measure out-of plane displacement of the surface and we do see significant out-of-plane movement. But I don’t know what to tell you about how to account for it in strain analysis at this point in time. But yes, we do measure it.
Q: Okay.
A: Thank you.