Embed Size (px)
Citation preview

Materi 2Materi 2(Chapter 2)(Chapter 2)
ntroduction to ntroduction to Quantitative Quantitative
AnalysisAnalysis
II
Learning ObjectivesLearning Objectives
Students will be able to:
1. Describe the quantitative analysis (QA) approach.
2. Understand the application of QA in a real situation.
3. Describe the use of modeling in QA.
4. Use computers and spreadsheet models to perform QA.
5. Discuss possible problems in using quantitative analysis.
6. Perform a break-even analysis.
Chapter OutlineChapter Outline
2.1 Introduction2.2 What Is Quantitative Analysis
(QA)?2.3 The QA Approach2.4 How to Develop a QA Model2.5 The Role of Computers and
Spreadsheet Models in the QA Approach
2.6 Possible Problems in the QA Approach
2.7 Implementation - Not Just the Final Step
IntroductionIntroduction
Mathematical tools have been used for thousands of years.
QA can be applied to a wide variety of problems.
One must understand the specific applicability of the technique, its limitations, and its assumptions.

Examples of Examples of Quantitative AnalysesQuantitative Analyses
Taco Bell saved over $150 million using forecasting and scheduling QA models.
NBC increased revenues by over $200 million by using QA to develop better sales plans.
Continental Airlines saved over $40 million using QA models to quickly recover from weather and other disruptions.
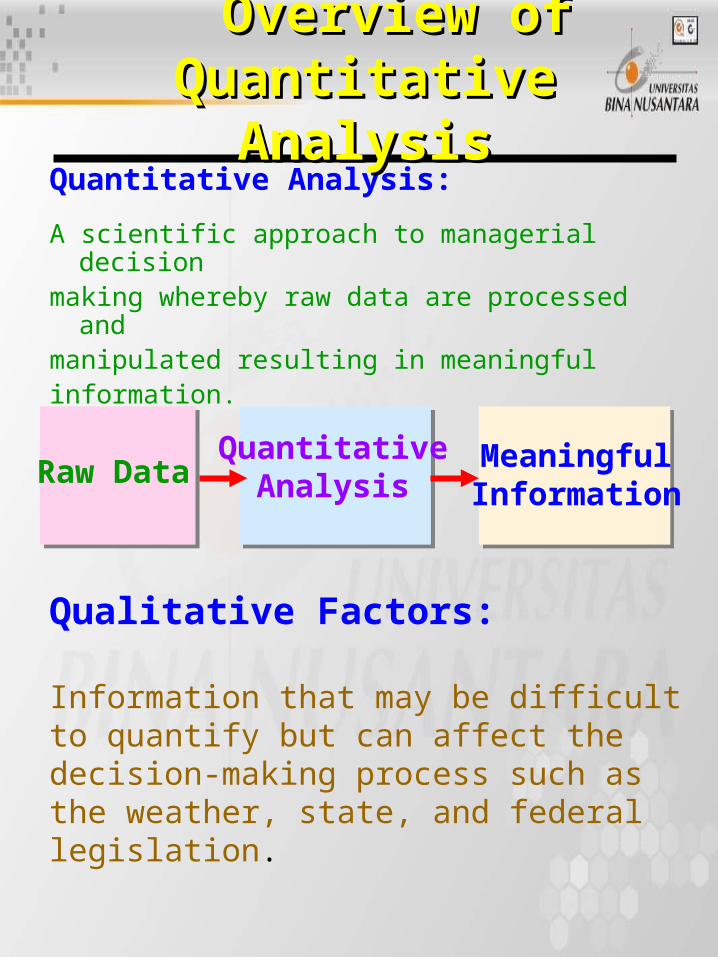
Quantitative Analysis:
A scientific approach to managerial decisionmaking whereby raw data are processed
and manipulated resulting in meaningfulinformation.
Raw DataQuantitative
AnalysisMeaningfulInformation
Overview of Overview of Quantitative AnalysisQuantitative Analysis
Qualitative Factors:
Information that may be difficult to quantify but can affect the decision-making process such as the weather, state, and federal legislation.

The QA Approach: The QA Approach: Fig 1.1Fig 1.1
Define the problem
Develop a model
Acquire input data
Develop a solution
Test the solution
Analyze the results
Implement the results
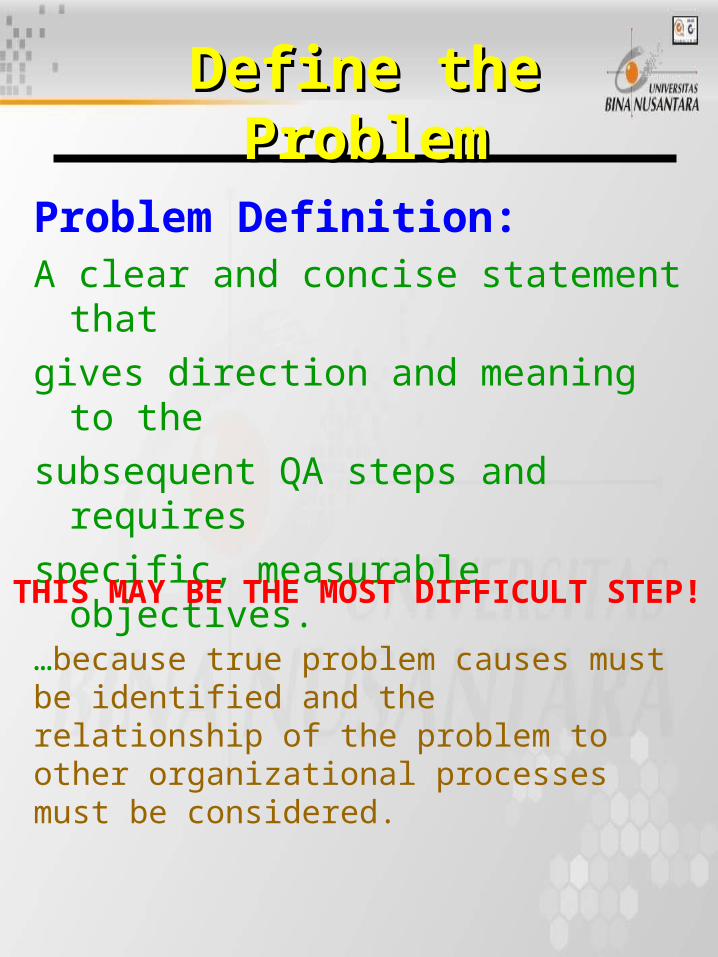
Define the ProblemDefine the Problem
Problem Definition:A clear and concise statement
thatgives direction and meaning to
thesubsequent QA steps and requiresspecific, measurable objectives.
THIS MAY BE THE MOST DIFFICULT STEP!
…because true problem causes must be identified and the relationship of the problem to other organizational processes must be considered.

Develop the ModelDevelop the Model
Quantitative Analysis Model:A realistic, solvable, and understandable
mathematical statement showing the relationship
between variables.
sales
reve
nu
es
y = mx + b
Models contain both controllable (decision variables) and uncontrollable variables and parameters. Typically, parameters are known quantities (salary of sales force) while variables are unknown (sales quantity).
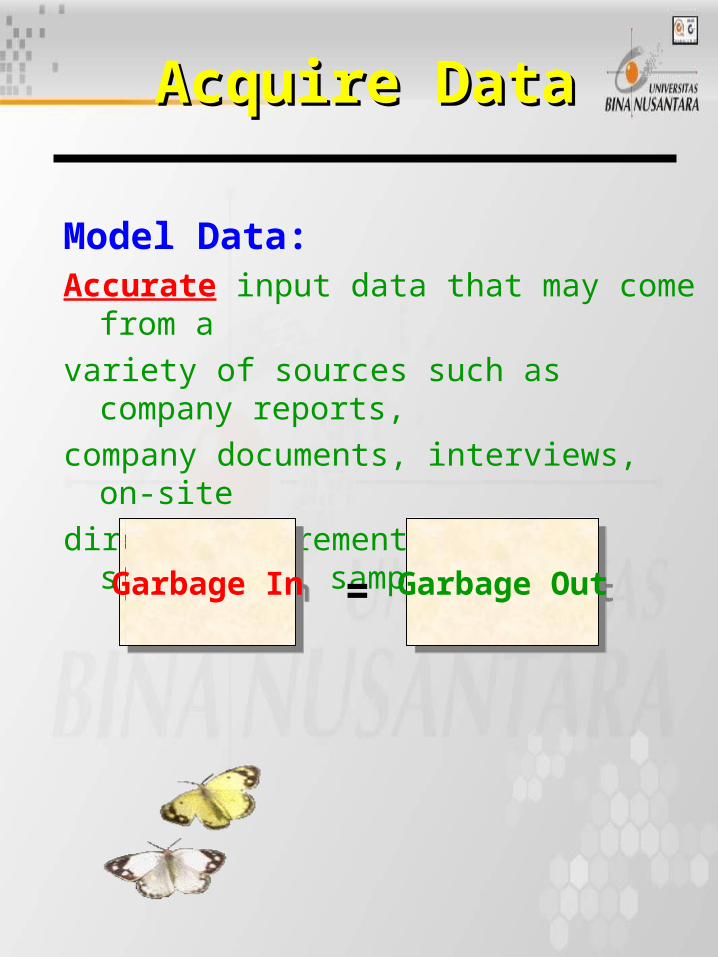
Acquire DataAcquire Data
Model Data:Accurate input data that may come
from avariety of sources such as company
reports,company documents, interviews, on-
sitedirect measurement, or statistical
sampling.Garbage InGarbage In Garbage OutGarbage Out=
Develop a SolutionDevelop a Solution
Model Solution: The best model solution is found by
manipulating the model variables until a practical and implemental solution is obtained.
Manipulation can be done by solving the equation(s), trying various approaches (trial and error), trying all possible variables (complete enumeration), and/or implementing an algorithm (repeating a series of steps).

Test the SolutionTest the Solution
Model Testing:
The collection of data from a different source to validate the accuracy and completeness and sensibility of both the model and model input data ~ consistency of results is key!

Analyze the ResultsAnalyze the Results
Results Analysis:Understanding actions implied by the
solution and their implications, as well
as conducting a sensitivity analysis (a
change to input values or the model) to
evaluate the impact of a change in
model parameters.
Sensitivity analyses allow the “what-
ifs” to be answered.

Implement the ResultsImplement the Results
Results Implementation:
The incorporation of the solution
into the company and the monitoring of
the results.
Modeling in the Real Modeling in the Real WorldWorld
Real World Models can be: Complex, expensive, and difficult to sell.
BUT…Real world models are used in the real
world by real organizations to solve
real problems!
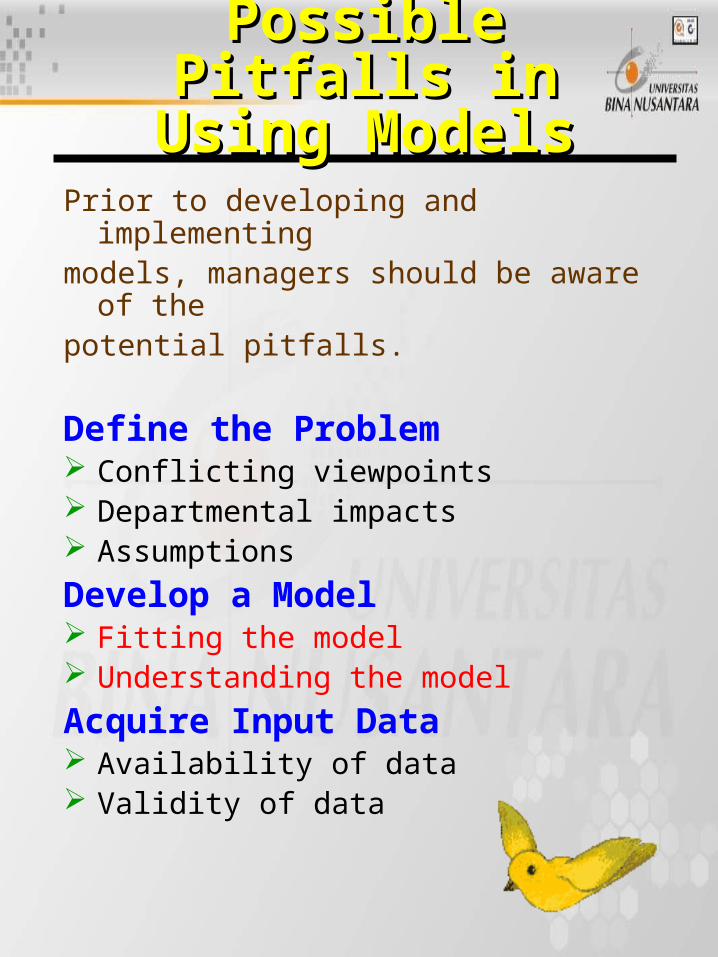
Possible Pitfalls in Possible Pitfalls in Using ModelsUsing Models
Prior to developing and implementingmodels, managers should be aware of
thepotential pitfalls.
Define the Problem Conflicting viewpoints Departmental impacts Assumptions
Develop a Model Fitting the model Understanding the model
Acquire Input Data Availability of data Validity of data

Possible Pitfalls Possible Pitfalls (Continued)(Continued)
Develop a Solution Complex mathematics Solutions become quickly
outdated
Test the Solution Identifying appropriate test
proceduresAnalyze the Results Holding all other conditions
constant Identifying cause and effectImplement the Solution Selling the solution to others

Bagels R Us QA Model Bagels R Us QA Model ExampleExample
Profits = Revenue - Expenses
Profits = $1Q - $100 - $.5Q
Assume you are the new owner of Bagels R Us and you want to develop a mathematical model for yourdaily profits and breakeven point. Your fixed overhead is $100 per day and your variable costs are 0.50 per bagel (these are GREAT bagels). You charge $1 per bagel.
(Price per Unit) (Number Sold)
- Fixed Cost - (Variable Cost/Unit) (Number Sold)
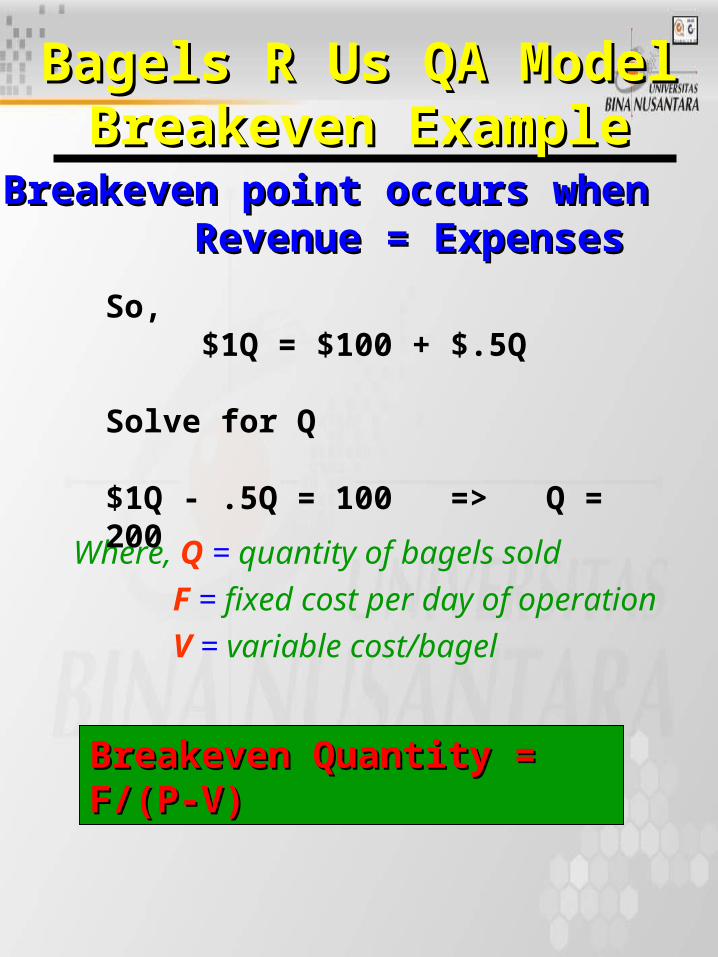
Bagels R Us QA Model Bagels R Us QA Model Breakeven ExampleBreakeven Example
Breakeven point occurs when Breakeven point occurs when Revenue = ExpensesRevenue = Expenses
Where, Q = quantity of bagels sold
F = fixed cost per day of operation
V = variable cost/bagel
So, $1Q = $100 + $.5Q
Solve for Q
$1Q - .5Q = 100 => Q = 200
Breakeven Quantity = F/(P-V)Breakeven Quantity = F/(P-V)
ConclusionsConclusions
Models can help managers:
Gain deeper insight into the nature of business relationships.
Find better ways to assess values in such relationships; and
See a way of reducing, or at least understanding, uncertainty that surrounds business plans and actions.
Conclusions Conclusions (continued)(continued)
Models: Are less expensive and disruptive than
experimenting with real world systems, but may be expensive to develop and test.
Allow “What ifWhat if” questions to be asked. Are built for management problems and
encourage input, but may be misunderstood due to the mathematical complexity.
Enforce consistency in approach. Require specific constraints and goals, but
tend to downplay qualitative information. Help communicate problem solutions to
others, but may oversimplify assumptions and variables.

Models: The Up SideModels: The Up Side
Models: accurately represent reality. help a decision maker
understand the problem. save time and money in problem
solving and decision making. help communicate problems and
solutions to others. provide the only way to solve
large or complex problems in a timely fashion.
Models: The Down SideModels: The Down Side
Models: may be expensive and time-
consuming to develop and test. are often misused and
misunderstood (and feared) because of their mathematical complexity.
tend to downplay the role and value of nonquantifiable information.
often have assumptions that oversimplify the variables of the real world.

QM for WindowsQM for Windows

QM for WindowsQM for Windows

Excel QMExcel QM

Excel QM’s Main Excel QM’s Main Menu of ModelsMenu of Models

Excel QM’s Main Menu of Excel QM’s Main Menu of Models continuedModels continued
The highlighted area shows forecasting models
The EndThe End