Embed Size (px)
Citation preview
1
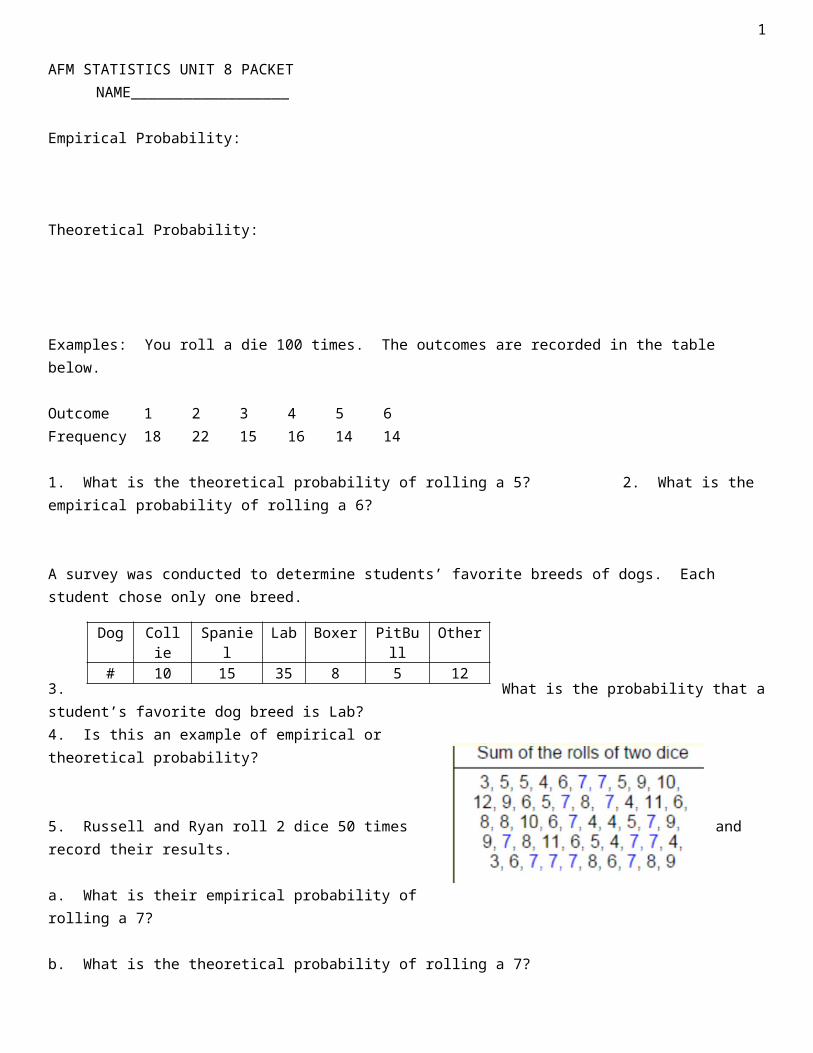
AFM STATISTICS UNIT 8 PACKET NAME__________________
Empirical Probability:
Theoretical Probability:
Examples: You roll a die 100 times. The outcomes are recorded in the table below.
Outcome 1 2 3 4 5 6Frequency 18 22 15 16 14 14
1. What is the theoretical probability of rolling a 5? 2. What is the empirical probability of rolling a 6?
A survey was conducted to determine students’ favorite breeds of dogs. Each student chose only one breed.
3. What is the probability that a student’s favorite dog breed is Lab?4. Is this an example of empirical or theoretical probability?
5. Russell and Ryan roll 2 dice 50 times and record their results.
a. What is their empirical probability of rolling a 7?
b. What is the theoretical probability of rolling a 7?
c. How do a) and b) compare?
6. Geologists say that the probability of a major earthquake occurring in the San Francisco Bay area in the next 30 years is about 90%. Is this empirical or theoretical probability?
Dog Collie Spaniel Lab Boxer PitBull Other# 10 15 35 8 5 12
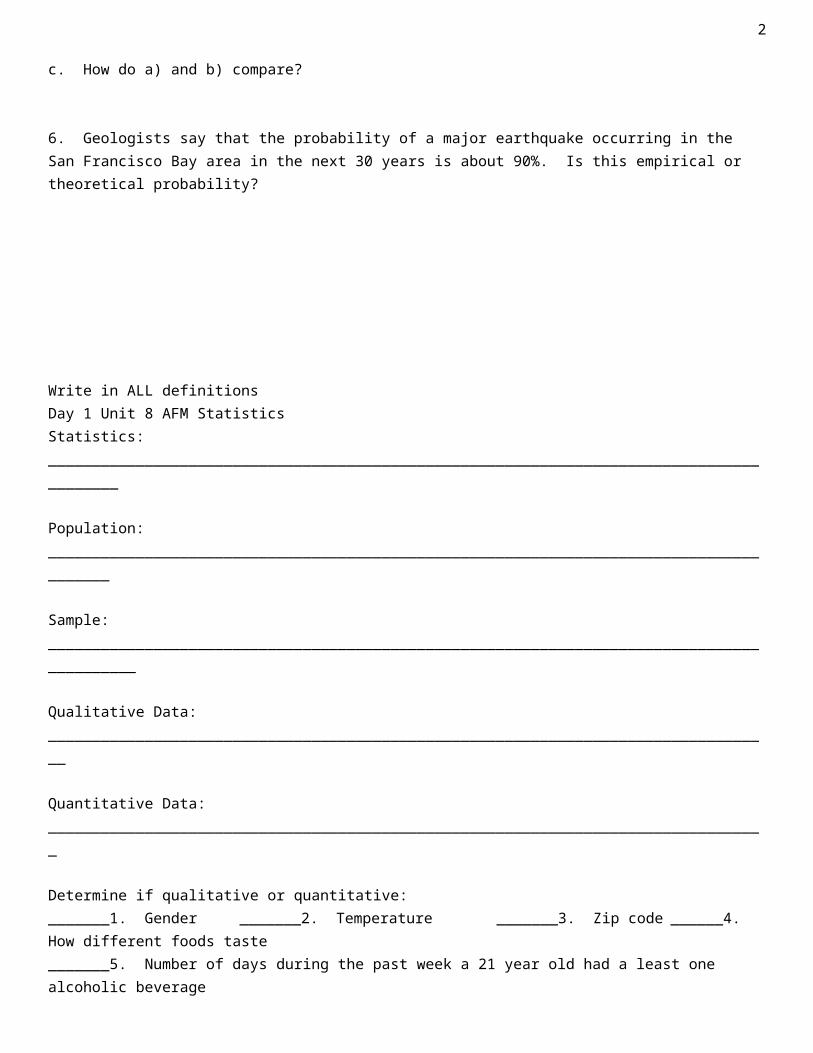
2
Write in ALL definitions Day 1 Unit 8 AFM StatisticsStatistics: _________________________________________________________________________________________
Population: ________________________________________________________________________________________
Sample: ___________________________________________________________________________________________
Qualitative Data: ___________________________________________________________________________________
Quantitative Data: __________________________________________________________________________________
Determine if qualitative or quantitative:_______1. Gender _______2. Temperature _______3. Zip code ______4. How different foods taste_______5. Number of days during the past week a 21 year old had a least one alcoholic beverage
Discrete variable: ___________________________________________________________________________________
Continuous variable: ________________________________________________________________________________
Determine if discrete or continuous:________6. Number of heads after 5 flips of a coin _______7. # of cars at McDonald’s drive through between 12-1________8. Distance a 2007 Toyota Prius can travel in city driving conditions with a full tank of gas________9. Weight of a newborn ________10. Time to complete a task _______11. Number of accidents on Hwy 64
Types of Gathering DataI. Survey: collections of information about items in a population or sample
II. Observational Study: ______________________________________________________________________________Investigators observe subjects and measure variables of interest without assigning treatments to the subjects.
III. Experimental Study: ______________________________________________________________________________
IV. Simulations: The use of a mathematical model to recreate a situation, often repeatedly, so that the likelihood of various outcomes can be more accurately estimated.
Identify each as one of the four from above.
_____________a. On average, suppose a baseball player hits a home run once in every 10 times at bat, and suppose he gets exactly two "at bats" in every game. Estimate the likelihood that the player will hit 2 home runs in a single game.
_____________b. Forty volunteers suffering from insomnia were divided into two groups. The first group was assigned to a special no-desserts diet while the other continued desserts as usual. Half of the people in these groups were randomly assigned to an exercise program, while the others did not exercise. Those who ate no desserts and engaged in exercise showed the most improvement.
_____________c. In 2001, a report in the Journal of the American Cancer Institute indicated that women who work nights have a 60% greater risk of developing breast cancer. Researchers based these findings on the work histories of 763 women with breast cancer and 741 women without the disease.
3
_____________d. Scientists at a major pharmaceutical firm investigated the effectiveness of an herbal compound to treat the common cold. They exposed each subject to a cold virus, and then gave him or her either the herbal compound or a sugar solution known to have no effect. Several days later, they assessed the patient’s condition, using a cold severity scale of 0 to 5.
Types of Sampling Design (methods used to choose the sample from the population)
I. Simple Random Sample: ___________________________________________________________________________
II. Stratified Random Sample: _________________________________________________________________________
III. Cluster Sample: _________________________________________________________________________________
IV. Convenience Sample: _____________________________________________________________________________
Identify the sampling design with the above choices.
___________1. Suppose we were to take 100 APEX students – put each students’ name in a hat. Then randomly select 100 names from the hat.
___________2. Suppose were to take ALL APEX students and divide them by grade level. Put their names in a hat and randomly select 25 names from each grade.
____________3. Suppose we were to take all classrooms during 2nd period and randomly select students in 10 of those classrooms.
____________4. Surveys left on tables at restaurants
____________5. Stand at the main entrance of Apex High School and stop friendly-looking students to survey.
____________6. The Educational Testing Service (ETS) needed a sample of colleges. ETS first divided all colleges into groups of similar types (small public, small private, etc.) Then they randomly selected 3 colleges from each group.
____________7. A county commissioner wants to survey people in her district to determine their opinions on a particular law up for adoption. She decides to randomly select blocks in her district and then survey all who live on those blocks.
_____________8. The names of 70 contestants are written on 70 cards. The cards are placed in a bag, and three names are picked from the bag.
_____________9. To avoid working late, the quality control manager inspects the last 10 items produced that day.
Bias: _____________________________________________________________________________________________
4
AFM Unit 8 Day 1 HW Introduction to Statistics Worksheet
III. Determine whether the study depicts an observation study, experimental study, simulation or survey.1. Researchers wanted to know if there is a link between proximity to high-tension wires and the rate of leukemia in children.
To conduct the study, researchers compared the incidence rate of leukemia for children who lived within ½ mile of high-tension wires to the incidence rate of leukemia for children who did not live within ½ mile of high-tension wires.
2. Rats with cancer are divided into two groups. One group receives 5 milligrams (mg) of a medication that is thought to fight cancer, and the other receives 10 mg. After 2 years, the spread of the cancer is measured.
3. Rolling a pair of dice to determine the chance of getting a five or a two.
4. Seventh-grade students are randomly divided into two groups. One group is taught math using traditional techniques; the other is taught math using a reform method. After 1 year, each group is given an achievement test to compare proficiency.
5. Using a coin to estimate the percent of families that have one boy when there is three children.
6. A poll is conducted in which 500 people are asked whom they plan to vote for in the upcoming election. 7. A survey is conducted asking 400 people, “Do you prefer Coke or Pepsi?”
8. While shopping, 200 people are asked to perform a taste test in which they drink form two randomly placed, unmarked cups. They are then asked which drink they prefer.
9. Conservation agents netted 250 large-mouth bass in a lake and determined how many were carrying parasites.
IV. Determine the sample design.
10. To determine customer opinion of its boarding policy, Southwest Airlines randomly selects 60 flights during a certain week and surveys all passengers on the flights.
11. In an effort to identify if an advertising campaign has been effective, a marketing firm conducts a nationwide poll by randomly selecting individuals from a list of known users of the product.
12. A farmer divides his orchard into 50 subsections, randomly selects 4, and samples all the trees within the 4 subsections to approximate the yield of his orchard.
13. To determine his DSL Internet connection speed, Shawn divides up the day into four parts: morning midday, evening, and late night. He then measures his Internet connection speed at 5 randomly selected times during each part of the day.
14. A large medical professional organization with membership consisting of doctors, nurses, and other medical employees wanted to know how its members felt about HMOs (health maintenance organizations). Name the type of sampling plan they used in each of the following scenarios: a. They randomly selected 500 members from each of the lists of all doctors, all nurses, and all other employees and
surveyed those 1500 members.
b. They randomly selected ten cities from all cities in which its members lived, and then surveyed all members is those cities.
15. A political scientist surveys 400 voters randomly selected from the list of all registered voters in a community. The purpose is to estimate the proportion of registered voters who will vote in an upcoming election.
I. Classify the variable as qualitative or quantitative.1. Number of siblings2. Grams of carbohydrates in a doughnut3. Number on a football player’s jersey4. Number of un-popped kernels in a bag of ACT
microwave popcorn5. Assessed value of a house6. Phone number7. Student ID number
II. Determine whether the quantitative variable is discrete or continuous.8. Runs scored in a season by Albert Pujols9. Volume of water lost each day through a leaky faucet.10. Length (in minutes) of a country song11. Number of sequoia trees in a randomly selected acre of Yosemite National Park12. Temperature on a randomly selected day in Memphis, Tennessee13. Internet connection speed in kilobytes per second14. Points scored in an NCAA basketball game15. Air pressure in pounds per square inch in an automobile tire
5
Day 2 Unit 8 AFM Statistics 15.1 The Frequency DistributionFrequency: ______________________________________________________________
Frequency Distribution: ______________________________________________________________________________
Relative Frequency Distribution: _______________________________________________________________________
Example 1: A television network has asked 25 viewers to evaluate a new police drama. The possible evaluations are (E)xcellent, (A)bove average, a(V)erage, (B)elow average, (P)oor. After the show, the 25 evaluations were as follows:
A,V,V,B,P,E,A,E,V,V,A,E,P,B,V,V,A,A,A,E,B,V,A,B,V.Construct a frequency table and a relative frequency Bar Graph: table for this list of evaluations. Draw a bar graph of the frequency distribution of TV
viewers’ responses from #1.
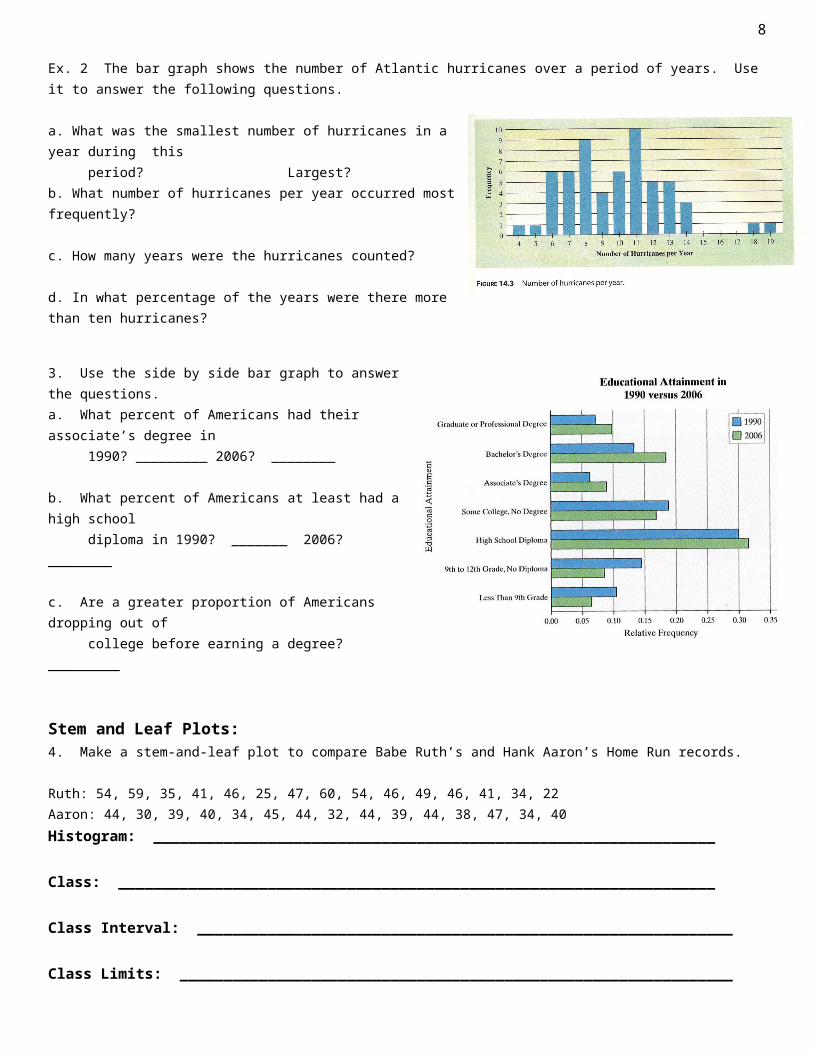
Ex. 2 The bar graph shows the number of Atlantic hurricanes over a period of years. Use it to answer the following questions.
a. What was the smallest number of hurricanes in a year during this period? Largest?b. What number of hurricanes per year occurred most frequently?
c. How many years were the hurricanes counted?
d. In what percentage of the years were there more than ten hurricanes?
3. Use the side by side bar graph to answer the questions.a. What percent of Americans had their associate’s degree in 1990? _________ 2006? ________
b. What percent of Americans at least had a high school diploma in 1990? _______ 2006? ________
c. Are a greater proportion of Americans dropping out of college before earning a degree? _________
Stem and Leaf Plots:4. Make a stem-and-leaf plot to compare Babe Ruth’s and Hank Aaron’s Home Run records.
Ruth: 54, 59, 35, 41, 46, 25, 47, 60, 54, 46, 49, 46, 41, 34, 22Aaron: 44, 30, 39, 40, 34, 45, 44, 32, 44, 39, 44, 38, 47, 34, 40
6
Histogram: ________________________________________________________________
Class: ____________________________________________________________________
Class Interval: _____________________________________________________________
Class Limits: _______________________________________________________________
Class Marks: _______________________________________________________________
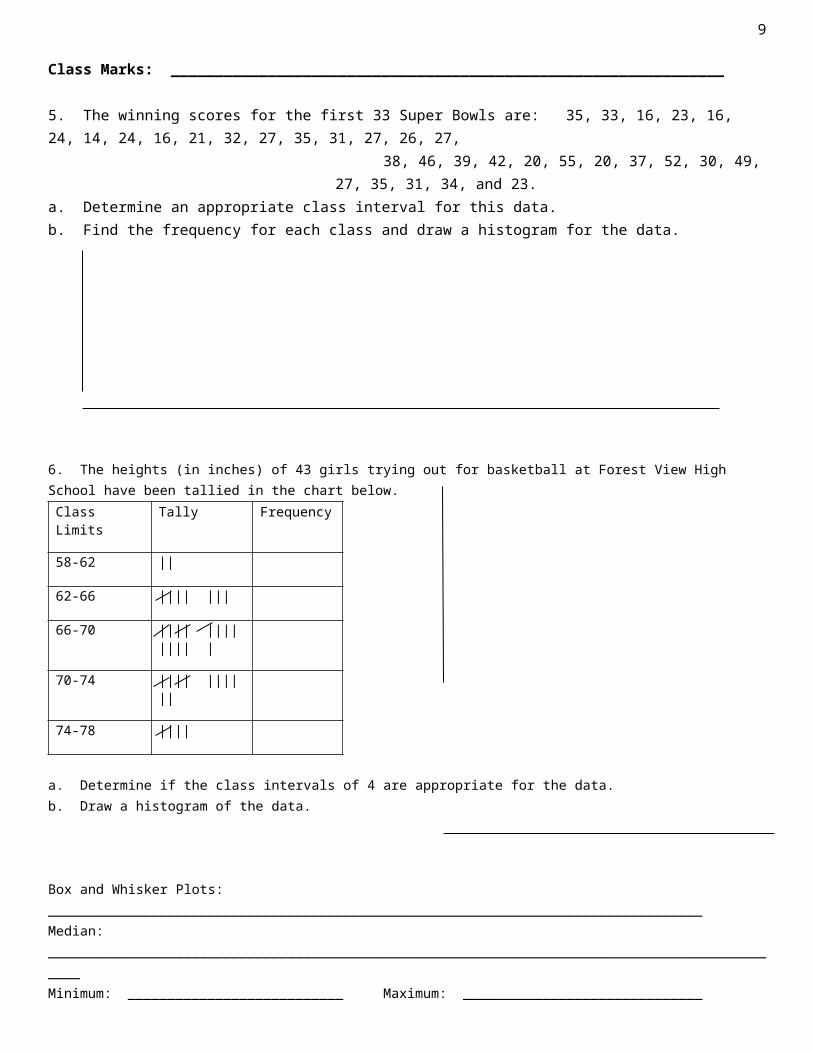
5. The winning scores for the first 33 Super Bowls are: 35, 33, 16, 23, 16, 24, 14, 24, 16, 21, 32, 27, 35, 31, 27, 26, 27, 38, 46, 39, 42, 20, 55, 20, 37, 52, 30, 49, 27, 35, 31, 34, and 23.
a. Determine an appropriate class interval for this data.b. Find the frequency for each class and draw a histogram for the data.
6. The heights (in inches) of 43 girls trying out for basketball at Forest View High School have been tallied in the chart below.Class Limits Tally Frequency
58-62 ||
62-66 |||| |||
66-70 |||| |||| |||| |
70-74 |||| |||| ||
74-78 ||||
a. Determine if the class intervals of 4 are appropriate for the data.b. Draw a histogram of the data.
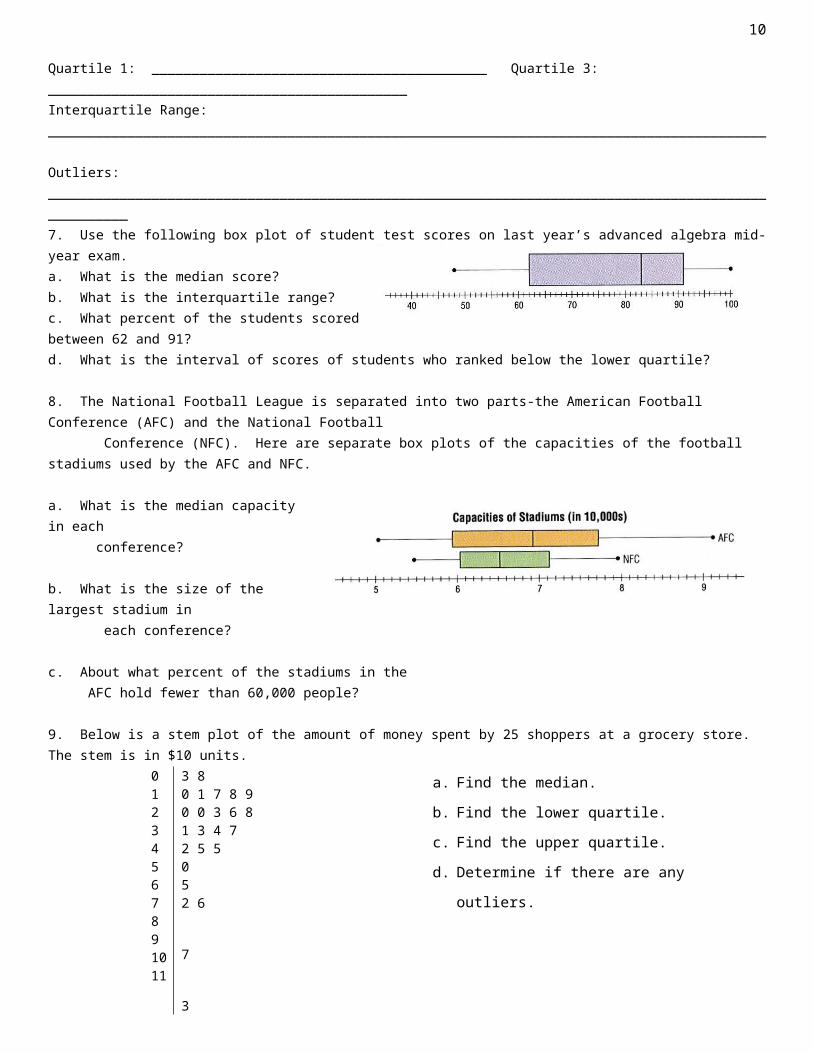
Box and Whisker Plots: __________________________________________________________________________________Median: ______________________________________________________________________________________________Minimum: ___________________________ Maximum: ______________________________Quartile 1: __________________________________________ Quartile 3: _____________________________________________Interquartile Range: __________________________________________________________________________________________
Outliers: ____________________________________________________________________________________________________
7
7. Use the following box plot of student test scores on last year’s advanced algebra mid-year exam.a. What is the median score?b. What is the interquartile range?c. What percent of the students scored between 62 and 91?d. What is the interval of scores of students who ranked below the lower quartile?
8. The National Football League is separated into two parts-the American Football Conference (AFC) and the National Football Conference (NFC). Here are separate box plots of the capacities of the football stadiums used by the AFC and NFC.
a. What is the median capacity in each conference?
b. What is the size of the largest stadium in each conference?
c. About what percent of the stadiums in the AFC hold fewer than 60,000 people?
9. Below is a stem plot of the amount of money spent by 25 shoppers at a grocery store. The stem is in $10 units.01234567891011
3 80 1 7 8 90 0 3 6 81 3 4 72 5 5052 6
7
3
10. Steps in the Calculator 1. Enter the data in L12. Stat > Calc 1: 1-Var Stats (enter twice) scroll down to see values you need:n = the number of valuesminX = the smallest value Q1 = first quartileMed = medianQ3 = third quartilemaxX = the largest value
a. Find the median.
b. Find the lower quartile.
c. Find the upper quartile.
d. Determine if there are any outliers.
e. Construct a box and whiskers plot.
8
AFM Unit 8 Day 2 HW Worksheet
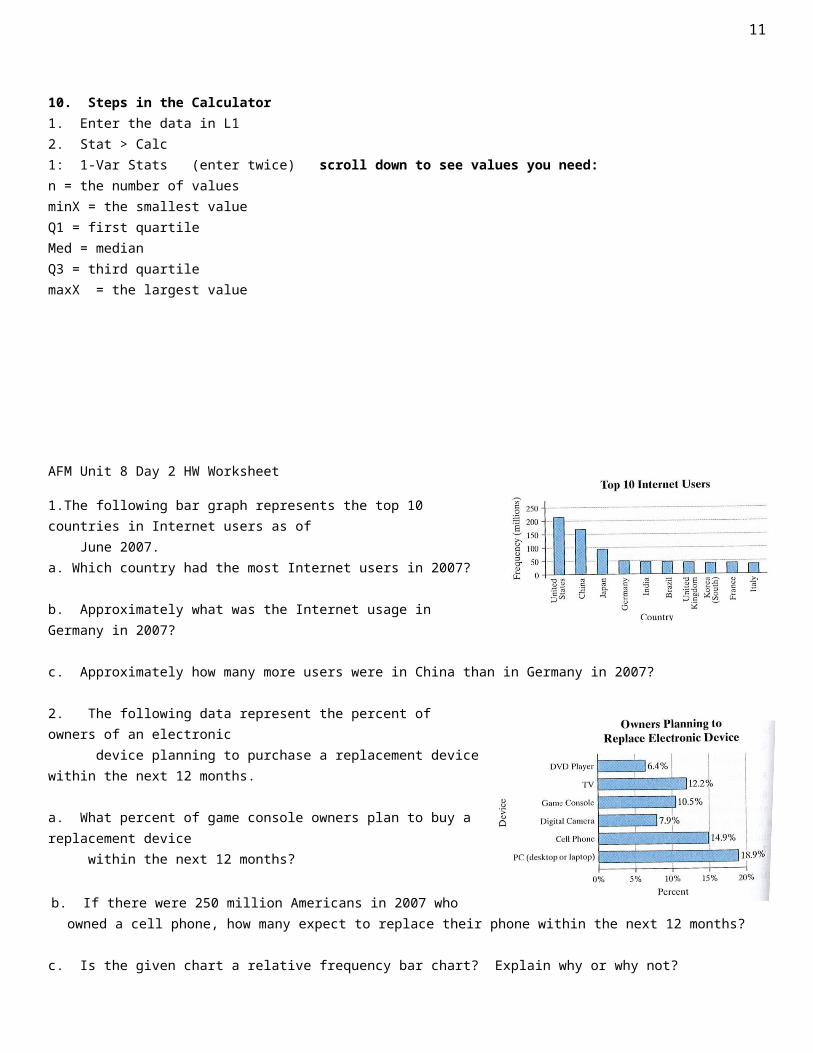
1.The following bar graph represents the top 10 countries in Internet users as of June 2007.a. Which country had the most Internet users in 2007?
b. Approximately what was the Internet usage in Germany in 2007?
c. Approximately how many more users were in China than in Germany in 2007?
2. The following data represent the percent of owners of an electronic device planning to purchase a replacement device within the next 12 months.
a. What percent of game console owners plan to buy a replacement device within the next 12 months?
b. If there were 250 million Americans in 2007 who owned a cell phone, how
many expect to replace their phone within the next 12 months?
c. Is the given chart a relative frequency bar chart? Explain why or why not?
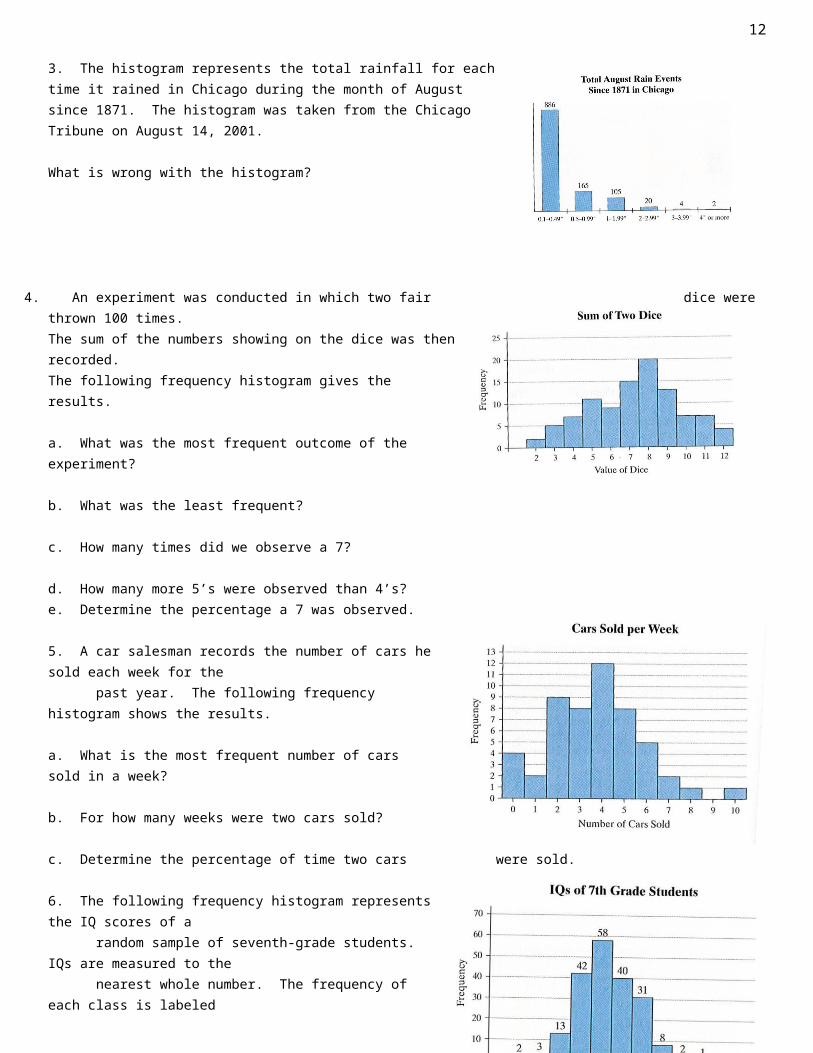
3. The histogram represents the total rainfall for each time it rained in Chicago during the month of August since 1871. The histogram was taken from the Chicago Tribune on August 14, 2001.
What is wrong with the histogram?
4. An experiment was conducted in which two fair dice were thrown 100 times. The sum of the numbers showing on the dice was then recorded. The following frequency histogram gives the results.
a. What was the most frequent outcome of the experiment?
b. What was the least frequent?
c. How many times did we observe a 7?
d. How many more 5’s were observed than 4’s?e. Determine the percentage a 7 was observed.
5. A car salesman records the number of cars he sold each week for the past year. The following frequency histogram shows the results.
a. What is the most frequent number of cars sold in a week?
b. For how many weeks were two cars sold?
c. Determine the percentage of time two cars were sold.
9
6. The following frequency histogram represents the IQ scores of a random sample of seventh-grade students. IQs are measured to the nearest whole number. The frequency of each class is labeled above each rectangle.
a. How many students were sampled?
b. Determine the class width.
c. Which class has the highest frequency?
d. Which class has the lowest frequency?
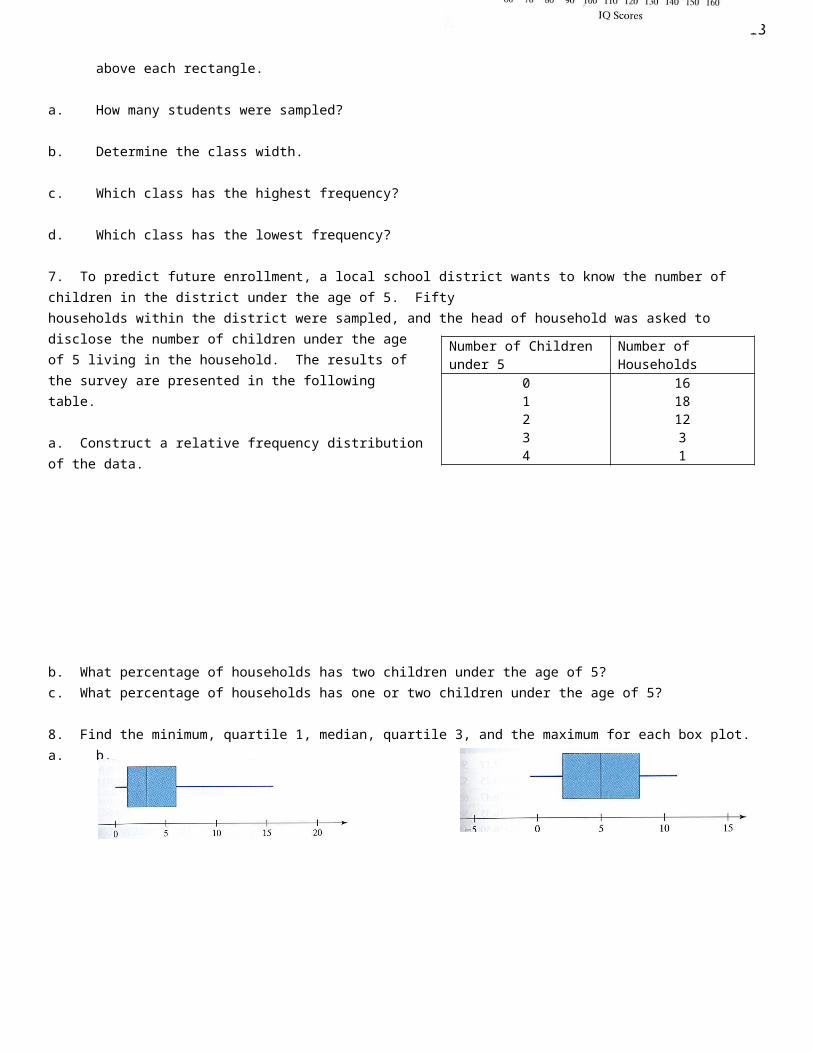
7. To predict future enrollment, a local school district wants to know the number of children in the district under the age of 5. Fifty households within the district were sampled, and the head of household was asked to disclose the number of children under the age of 5 living in the household. The results of the survey are presented in the following table.
a. Construct a relative frequency distribution of the data.
b. What percentage of households has two children under the age of 5?c. What percentage of households has one or two children under the age of 5?
8. Find the minimum, quartile 1, median, quartile 3, and the maximum for each box plot.a. b.
Number of Children under 5 Number of Households01234
16181231
10
Min______ Q1 ______ Median ______ Q3 ______ Max ______
Min______ Q1 ______ Median ______ Q3 ______ Max ______
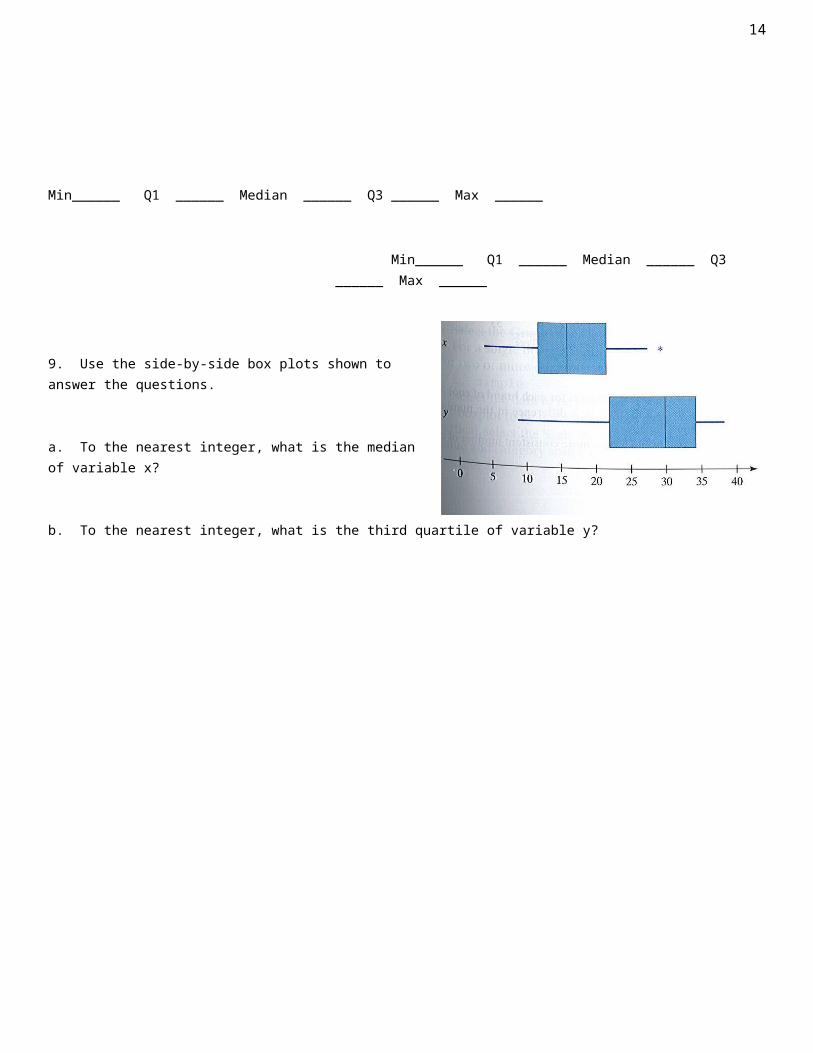
9. Use the side-by-side box plots shown to answer the questions.
a. To the nearest integer, what is the median of variable x?
b. To the nearest integer, what is the third quartile of variable y?
11
AFM Unit 8 Day 3 notes 15.3 Measures of Variability and Mean
Measures of Central Tendency
Mean: __________________________________ Median: __________________________________________
Mode: __________________________________ Range: ___________________________________________What strikes you as the most distinctive difference among the distributions of exam scores in the different classes?
1. _______________________ 2. _________________________ 3. ____________________
Deviation: ________________________________________________________________________________
Variance: _________________________________________________________________________________
Standard Deviation: ________________________________________________________________________
Population Standard Deviation versus Sample Standard Deviation
Population: Divide by ‘n’ is used when the sample is the population
Sample: Divide by ‘n-1’ is used for a sample because it gives a better estimate of the population mean
“n” = _____________________
4. Find the mean and standard deviation for the following data: {3,5,6,7,9,11,22}. Use the table on the right.
ClClClClClClClClClClClClClClClClClClClClClClClClClClClClClClClClClClClClClClClClClClClClCl
Value Mean Deviation from mean
Square of deviation from mean
σx=√ 1n∑i=1
n
(X i−X )2
Sx=√ 1n−1∑i=1
n
(X i−X )2
12
USING CALC: Stat > Calc 1: 1-Var Stats Symbol for mean: ___________ Sx = sample standard deviation calculated using (n-1)
σx = population standard deviation calculated using “n”
5. Use the following scores of a mathematics class on the midyear exam.
a. Find the mean.
b. Find the range.
c. Find the standard deviation.
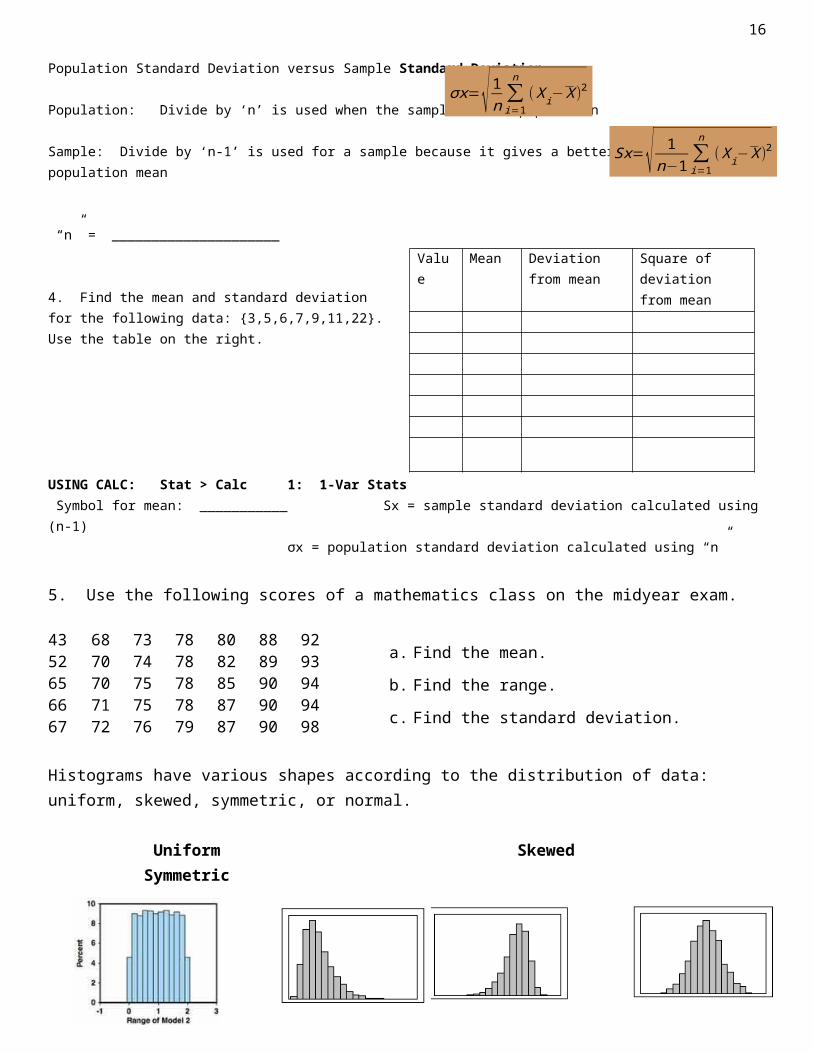
Histograms have various shapes according to the distribution of data: uniform, skewed, symmetric, or normal.
Uniform Skewed Symmetric
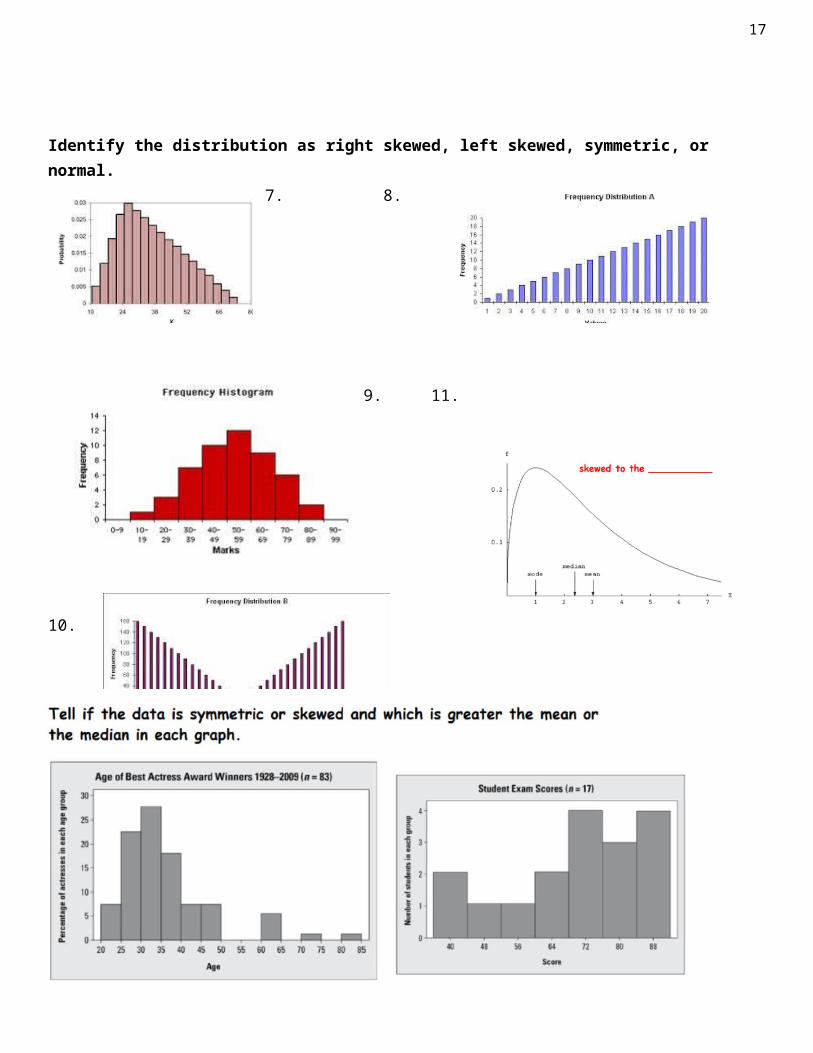
Identify the distribution as right skewed, left skewed, symmetric, or normal.7. 8.
9. 11.
10.
43 68 73 78 80 88 9252 70 74 78 82 89 9365 70 75 78 85 90 9466 71 75 78 87 90 9467 72 76 79 87 90 98
13
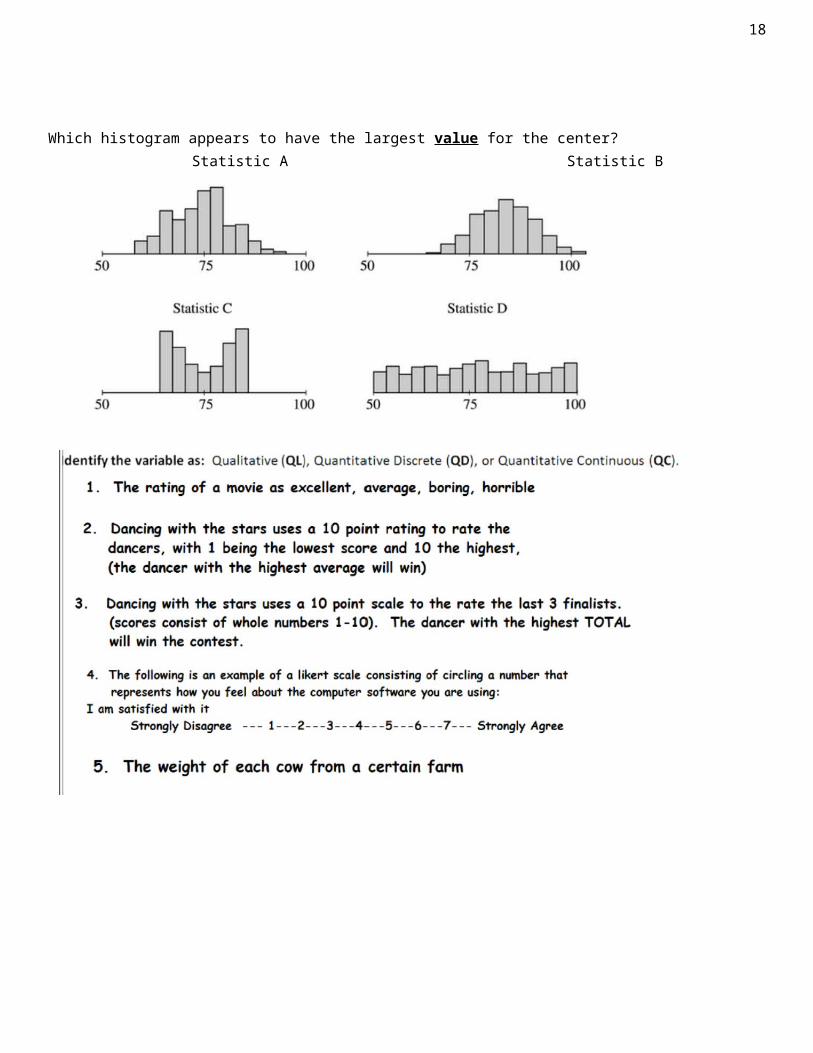
Which histogram appears to have the largest value for the center?Statistic A Statistic B
14
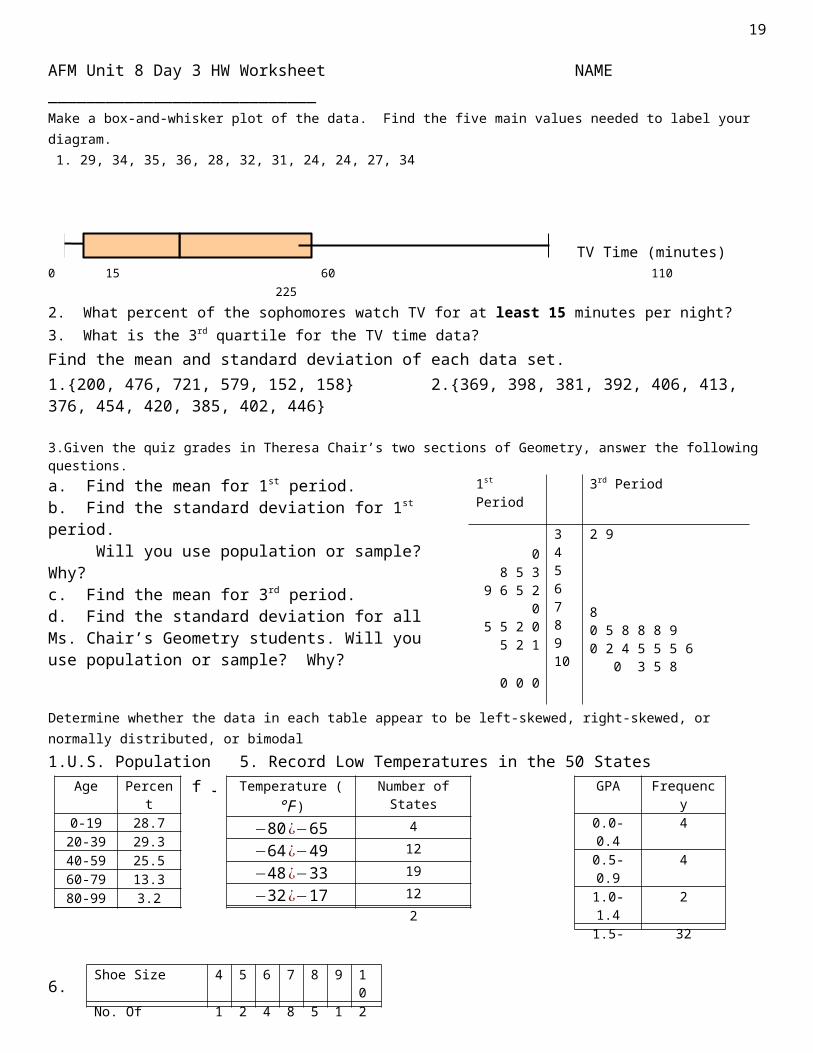
AFM Unit 8 Day 3 HW Worksheet NAME ____________________________Make a box-and-whisker plot of the data. Find the five main values needed to label your diagram. 1. 29, 34, 35, 36, 28, 32, 31, 24, 24, 27, 34
TV Time (minutes)0 15 60 110 225
2. What percent of the sophomores watch TV for at least 15 minutes per night?3. What is the 3rd quartile for the TV time data?Find the mean and standard deviation of each data set.1.{200, 476, 721, 579, 152, 158} 2.{369, 398, 381, 392, 406, 413, 376, 454, 420, 385, 402, 446}
3.Given the quiz grades in Theresa Chair’s two sections of Geometry, answer the following questions.a. Find the mean for 1st period.b. Find the standard deviation for 1st period. Will you use population or sample? Why?c. Find the mean for 3rd period.d. Find the standard deviation for all Ms. Chair’s Geometry students. Will you use population or sample? Why?
Determine whether the data in each table appear to be left-skewed, right-skewed, or normally distributed, or bimodal 1.U.S. Population 5. Record Low Temperatures in the 50 States 6. GPAs of Jr at Apex
6.
7.Time Spent in a Museum 8. Average Age of High School Principals 9.
10.
11. 12.
Age Percent0-19 28.720-39 29.340-59 25.560-79 13.380-99 3.2100+ 0.0
Temperature (℉ ) Number of States−80¿−65 4−64¿−49 12−48¿−33 19−32¿−17 12−16¿−1 2
0¿15 1
GPA Frequency0.0-0.4 40.5-0.9 41.0-1.4 21.5-1.9 322.0-2.4 962.5-2.9 913.0-3.4 1103.5-4.0 75Shoe Size 4 5 6 7 8 9 10
No. Of students 1 2 4 8 5 1 2
Minutes Frequency0-25 2726-50 4651-75 8975-100 57100+ 24
Age in Years
Number
31-35 336-40 841-45 1546-50 3251-55 4056-60 3860+ 4
1st Period 3rd Period
08 5 3
9 6 5 2 05 5 2 0
5 2 1
0 0 0
345678910
2 9
80 5 8 8 8 90 2 4 5 5 5 6
0 3 5 8
15
Day 4 AFM Unit 8 15.4 The Normal DistributionNormal Distribution: The distribution of data along a bell-shaped, symmetric curve that reaches its maximum
height at the mean.
Properties of Normal Curve: ____________ of the distribution is within 1 standard deviation of the mean.____________ of the distribution is within 2 standard deviations of the mean.____________ of the distribution is within 3 standard deviations of the mean.
Standard Normal Distribution: the normal distribution having a mean of 0 and a standard deviation of 1. The total area under the curve (and above the x-axis) is 1.
z-score = __________________________________________________________ formula: z = __________
Draw a “normalized” distribution with mean = 0 and μ=1.
1. Suppose the scores of 500 college freshmen taking Psychology 101 are normally distributed. The mean score is 60 out of 100, and the standard deviation is 10. Sketch a normal curve that represents the frequency scores.
Estimate how many grades will fall between each of the following intervals:a. 50 – 70 b. 40 – 80 c. 30 – 90
*d. 55 – 65 *e. 45 – 75
f. P(grade < 72) g. P(grade > 85) h. P(73 < grade < 83)
16
2. Find the upper and lower limits of the interval about the mean in which 72% of the values of a set of normally distributed data can be found if the mean is 124 and the standard deviation is 16.
3. In a normal distribution, about what percent of the data:a. fall within 2.2 standard deviations of the mean? b. do not fall within 2.2 standard deviations of the mean?
4. A day is selected at random at a post office whose daily letter-handling rate is normally distributed. The mean number of letters per day is 10,000 and the standard deviation is 350. What is the probability that the post office hand les between 9000 and 11,000 letters per day?
5. In a certain large school district, the set of all standardized mathematics scores is normally distributed with mean x=540and standard deviation of 64. What is the probability that a student chosen at random scores between 580 and 620 on that test?
6. Suppose 300 values in a set of data were normally distributed.a. How many values are within one standard deviation of the mean?
b. How many values are two standard deviations of the mean?
c. How many values fall in the interval between the mean and one standard deviation above the mean?
17
AFM Unit 8 Day 4 HW p. 835 1,2,4-31 1. Describe the shape of a normal distribution. 2. Explain in your own words what a normal distribution is.
4. Sketch a normal curve with a mean of 75 and a standard dev. of 10. Label the points that would be 1,2, and 3 standard deviations from the mean.
5. Sketch a normal curve with a mean of 75 and a standard dev. of 5. Label the points that would be 1,2, and 3 standard deviations from the mean.
____________6. Compare the graphs in #4, #5. Which curve displays less variability?Suppose 200 values in a set of data are normally distributed. ___________7. How many values are within one standard deviation of the mean?___________8. How many values are within two standard deviations of the mean? ___________9. How many values fall in the interval between the mean and one standard deviation above the mean? ___________10. How many values are between 2 and 3 standard deviations less than the mean?
A set of 500 values is normally distributed with a mean of 24 and a standard deviation of 2. ____________11. What percent of the data is in the interval 22-26? ____________12. What percent of the data is in the interval 20.5 - 27.5? ____________13. Find the range about the mean that includes 95% of the data. ____________14. Find the range about the mean that includes 50% of the data.
A set of data is normally distributed with a mean of 140 and a stand. dev. of 20. Assume values are selected at random. ____________15. What percent of the data is in the interval 120-160? ____________16. What percent of the data is between 130 to 150? ____________17. Find the probability that a value from the data lies in the interval 110-170. ____________18. Find the probability that a value from the data is less than 100. ____________19. Find the probability that a value from the data is greater than 160. ____________20. Find the probability that a value from the data lies in the interval 110-200.
The volumes of the liquid content of soft drink cans are normally distributed. The mean volume is 355 mL with a standard deviation of 2 mL. ____________23. What percent of the cans contain between 353 mL and 357 mL? ____________24. What percent of the cans contain between 353 mL and 355 mL? ____________25. What percent of the cans contain more than 351 mL? ____________26. Out of 1000 cans, how many will contain between 349 mL and 363 mL?
The lifetimes of a certain type of car tire are normally distributed. The mean lifetime is 40,000 miles, and the standard deviation is 5000 miles. Answer each of the following questions for a sample of 10,000 of these tires.
____________27. How many tires will last between 35,000 miles and 45,000 miles? ____________28. How many tires will last between 30,000 and 40,000 miles? ____________29. How many tires will last less than 40,000 miles? ____________30. How many tires will last more than 50,000 miles? ____________31. How many tires will last less than 25,000 miles?
18
NORMAL DISTRIBUTION- WORKSHEET #21. Twelve students were given a AFM quiz and the times (in minutes) they took to complete the quiz are shown: 8,12,15,16,14,10,10,11,13,15,9,11. Find the range, mean , mode, median, Q1, Q3, IQR and the standard deviation.For a value to be an outlier it must be greater than ____ but less than _____.
2. Eight students were asked how many hours it took them to write a research paper. The times (in hours) are shown: 6, 10, 3, 5, 7, 8, 2, 7.Find the range, mean , and standard deviation.
3. To qualify to attend a fire academy, an applicant must take a written exam. If the mean of all the test scores is 80 and the standard deviation is 5, find the probability that a randomly selected applicant scores between 75 and 95. Assume that the test scores are normally distributed.
4. The average time it takes an emergency service to respond to calls in certain municipality is 13 minutes. If the standard deviation is 3 minutes, find the probability that for a randomly selected call, the service takes less than 10 minutes. Assume the times are normally distributed.
5. If the measure of systolic blood pressure is normally distributed with a mean of 120 and a standard deviation of 10, find the probability that a randomly selected person will have a systolic blood pressure below 140. Assume systolic blood pressure is normally distributed.
6. If an automobile gets an average of 25 miles per gallon on a trip and the standard deviation is 2 miles per gallon, find the probability that on randomly selected trip, the automobile will get between 21 and 29 miles per gallon. Assume that the variable is normally distributed.
7. If adult Americans spent on average of $60 per year for books and the standard deviation of the variable is $5, find the probability that a randomly selected adult spent between $50 and $65 last year on books. Assume the variable is normally distributed.
CLASS EXAMPLES:1. A company producing stereos find they have a mean life of 7 years and a standard deviation of 1.2 years. What guarantee should the company make so they will only have to exchange fewer than 10% of all stereos sold?
4.
2. A teacher marks some exams and finds the mean is 54% and the standard deviation is 8%. The teacher then adjusts the marks by raising the mean to 60% and the standard deviation to 9%. The z-scores are kept constant. If a student scored a 76%, what would their new mark be?
3.
19
Normal Distribution Worksheet1. A set of 1000 values has a normal distribution. The mean of the data is 120, and the standard deviation is 20.
a. How many values are in one standard deviation from the mean?b. What percent of data is in the range 110 to 130?c. What percent of the data is in the range 90 to 110?d. Find the range about the mean that includes 90% of the data?e. Find the range about the mean that includes 70% of the data?f. Find the probability that a value selected at random from the data will be within the limits 100 and 150?g. Find the probability that a value selected at random from the data will be greater than 140?h. Find the point below which 90% of the data lie?
2. X is a normally distributed variable with mean μ = 30 and standard deviation σ = 4. Find a) P(x < 40) b) P(x > 21) c) P(30 < x < 35)
3. A radar unit is used to measure speeds of cars on a motorway. The speeds are normally distributed with a mean of 90 km/hr and a standard deviation of 10 km/hr. What is the probability that a car picked at random is travelling at more than 100 km/hr?
4. For a certain type of computers, the length of time between charges of the battery is normally distributed with a mean of 50 hours and a standard deviation of 15 hours. John owns one of these computers and wants to know the probability that the length of time will be between 50 and 70 hours.
5. Entry to a certain University is determined by a national test. The scores on this test are normally distributed with a mean of 500 and a standard deviation of 100. Tom wants to be admitted to this university and he knows that he must score better than at least 70% of the students who took the test. Tom takes the test and scores 585. Will he be admitted to this university?
6. The length of similar components produced by a company are approximated by a normal distribution model with a mean of 5 cm and a standard deviation of 0.02 cm. If a component is chosen at random: a) What is the probability that the length of this component is between 4.98 and 5.02 cm?
b) What is the probability that the length of this component is between 4.96 and 5.04 cm?
7. The length of life of an instrument produced by a machine has a normal distribution with a mean of 12 months and standard deviation of 2 months. Find the probability that an instrument produced by this machine will last: a) less than 7 months. b) between 7 and 12 months.
8. The time taken to assemble a car in a certain plant is a random variable having a normal distribution with a mean of 20 hours and a standard deviation of 2 hours. What is the probability that a car can be assembled at this plant in a period of time: a) less than 19.5 hours? b) between 20 and 22 hours?
9. A large group of students took a test in Physics and the final grades have a mean of 70 and a standard deviation of 10. If we can approximate the distribution of these grades by a normal distribution, what percent of the students: a) scored higher than 80? b) should pass the test (grades≥60)? c) should fail the test (grades<60)?
10. The annual salaries of employees in a large company are approximately normally distributed with a mean of $50,000 and a standard deviation of $20,000.
a) What percent of people earn less than $40,000?
b) What percent of people earn between $45,000 and $65,000?
c) What percent of people earn more than $70,000?
11. In a city, it is estimated that the maximum temperature in June is normally distributed with a mean of 23° and a standard deviation of 5°. Calculate the number of days in this month in which it is expected to reach a maximum of between 21° and 27°. 12. The mean weight of 500 college students is 70 kg and the standard deviation is 3 kg. Assuming that the weight is normally distributed, determine how many students weigh: a) Between 60 kg and 75 kg. b) More than 80 kg. c) Less than 64 kg.
20
AFM Statistics ReviewI. Finding mean and standard deviation.
1. The following data represents the muzzle velocity (in meters per second) of rounds fired from a 155-mm gun.a. Find the mean. b. Would you use sample or population standard deviation? c. Find the standard deviation.
2. The following data represents the amount of snowfall (in inches received at Mammoth Mountain in the Sierra Mountains from the 1996-1997 ski season to the 2005-2006 ski season.
a. Find the mean.b. Would you use sample or population standard deviation?c. Find the standard deviation.
3. The following test grades are for the only Pre-calculus course in the school.
a. Find the mean.b. Would you use sample or population standard deviation?c. Find the standard deviation.
II. Normal distribution.4. The lives of refrigerators are normally distributed with a mean of 14 years and a standard deviation of 2.5 years.a. What percent of refrigerators last within 1 standard deviation of the mean?
b. What percent of refrigerators last between 15-20 years?
c. What percent of refrigerators last less than 12 years?
d. What percent of refrigerators last more than 18 years?
e. Find the age of refrigerators that 80% of refrigerators last.
5. The lengths of human pregnancies are normally distributed with a mean of 266 days and a standard deviation of 16 days.a. What percent of pregnancies last within 2 standard deviations of the mean?
b. What percent of pregnancies last between 245-295 days? c. What percent of pregnancies last less than 255 days?
d. What percent of pregnancies last more than 300 days? e. Find the days that 90% of pregnancies last.
III. Determine if qualitative, quantitative discrete, or quantitative continuous.1. Brand name of a pair of running shoes 2. Number of siblings 3. Weight in carats of an uncut diamond
IV. Determine whether each study depicts an observational study, experimental study, or simulation.1. A parent group randomly examines 25 randomly selected PG-13 movies and 25 randomly selected PG movies and records
the number of curse words that occur in each. They then compare the number of curse words between the two movie ratings.2. A sample of 504 patients in early stages of Alzheimer’s disease is divided into two groups. One group receives an
experimental drug; the other group receives a placebo. The advance of the disease in the patients from the two groups is tracked at 1-month intervals over the next year.
3. To check to see if a pair of dice is loaded, you roll them 100 times and record your results.V. Determine the type of sampling used.
1. On election day, a pollster from Fox News positions herself outside a polling place near her home. She then asks the first 50 voters leaving the facility to complete a survey.
2. An internet service provider randomly selects 15 residential blocks from a large city. It then surveys every household in these 15 blocks to determine the number that would use a high-speed internet service if it were made available.
3. Thirty-five sophomores, 22 juniors, and 35 seniors are randomly selected to participate in a study from 574 sophomores, 462 juniors, and 532 seniors at a certain high school.
4. A quality-control engineer wants to be sure that bolts coming off an assembly line are within prescribed tolerances. The quality-control engineer randomly picks blots off of the assembly line to test.
399 542 347 381 400
289 358 439 602 661
678910
1 7 8 2 4 5 7 8 8 9 90 2 3 4 5 5 6 8 90 0 1 2 3 3 0
21
Statistics Test Review Sheet
I. The table shows the resulting scores of the final exam in AFM for 90 Students at Apex High School.
Scores 53-61 61-69 69-77 77-85 85-93 93-101
Frequency 3 7 11 38 19 12
1. Find the class limits for the row with frequency 192. Find the class interval3. Make a histogram of the data
II. The data shows the average temperatures In January for several cities in the mid- South49.1 50.8 42.9 44 44.2 51.4 45.7 39.9 50.8 46.7 52.4 50.4
4. Find the mean, median and the mode5. Find the values of Q1,Q2,Q3,range, interquartile range and the outliers.6. Sketch a Box-and –Whisker plot.
III. A family goes grocery shopping every week. In a month the cost of the groceries are : $72.42 $91.5 $58.99 $69.02
7. Find the mean.8. Find the standard deviation. (which are you going to use: population or sample?)
IV. Refer to the circle graph which shows who paid for the research and development done in the U. S. in 1988. If the total amount of research funded was about $126,115 million:
9. About how much was funded by the Federal government?10. About how much was funded by industry?V. Use the histogram to answer the following:
11. Describe the shape of the distribution.
12. Which is higher the mean or the median?
13. About what percentage of the scores are greater
than or equal to 15 and less than 18?0
1
2
3
4
5
6
7
8
9
0 1 2 3 4 5 6 7 8 9 10 11 12 13 14 15 16 17 18 19 20 21
Score
Frequency
22
VI. In a group of 230 tests , the scores are normally distributed with a mean grade average of 76 and a standard deviation of 10.
14. Sketch a normal curve representing the data. Label the points that would be 1, 2 and 3 standard deviations from the mean.
15. How many students score above 96?16. How many students score below 66?17. How many students score within one standard deviation of the mean?18. What percent of the data is in the interval 71 – 101?19. What percent of the data is in the interval 61 – 94?20. Find the probability that the data is less than 93?21. Find the interval about the mean that includes 86% of the data?22. Find the limit below which 78.8 % of the data lies.23. How many of the students would lie in the interval 69-84?24. How many of the students would lie in the interval 86-96?
VII. More Normal Distribution practice.25. In order to qualify for a position, an applicant must score 85 or above on a skills test. If the test scores
are normally distributed with a mean of 80 and a standard deviation of 3, find the probability that a randomly selected applicant will qualify for the position.
26 If a brisk walk at 4 miles per hour burns an average of 300 calories per hour, find the probability that a person will burn between 260 and 290 calories if the person walks briskly for one hour. Assume the standard deviation is 19 and the variable is normally distributed.
27. The average count for snow per year that a city receives is 40 inches. The standard deviation is 9 inches. Find the probability that next year the city will get less than 53 inches. Assume the variable is normally distributed.
28. If the average systolic blood pressure is 120 and the standard deviation is 10, find the probability that a randomly selected person will have a blood pressure less than 108. Assume the variable is normally distributed.
29. A survey found that on average adults watch 2.5 hours of television per day. The standard deviation is 0.5 hours. If 500 adults were randomly surveyed, find the number adults that watch between 2.2 and 2.8 hours per day. Assume the variable is normally distributed.
30. An exam which is normally distributed has a mean of 200 and a standard deviation of 20. Find the percent of adults that will score above 236.
31. The average height for adult females is 64 inches. A female has a height of 66.5 inches and is taller than 97.72% of other females. What is the standard deviation?
23
Spring 2015 Class work and HW guide (this may change)
11-May M
Theoretical vs empirical probability and Sampling Techniques and Misuses Pages 1,2,3 Page 4
12-May T
15.1 The Frequency Distribution with Bar Graphs and Histogram, Pages 5,6,7 Pages 8.9
13-May W
15.2 Measures of Central Tendency: Stem and Leaf Plot and (Cumulative) Frequency Pages 10,11,12 page 13
14-May Th
15.3 Measures of Variability with Box and Whisker Plots
QUIZ 1 15.1, and 15.2
Start Normal Distrib. P. 14 p. 20
15-May F
15.4 Normal Distribution and Describing Distribution Pages 14,15 page 16
18-May M More 15.4; Review Pages 17,18 Online quiz; p. 1919-
May TGroup Quiz
p.21 Finish packet20-
May WTest
Problem Set 5 (or 4)