Embed Size (px)
Citation preview
Master’s Thesis
Quality improvement in a large-scale IT project:
A case study
Giselle Martin
Master’s Thesis
Degree Programme in Information
Systems Management
2015
Abstract
Author(s) Giselle Martin
Degree programme Degree Programme in Information Systems Management Report/thesis title Quality improvement in a large-scale IT project: A case study
Number of pages and appendix pages 60 + 6
The purpose of this study is to investigate the effects of applying The Improvement Model Framework to two objectives:
(1) Increase the monthly numbers of windows 7 deployments and (2) Improve end user satisfaction levels of the deployment experience.
This case study uses an embedded single-case design approach and focuses on multi-ple units of analysis. The monthly targets span a period of 19 months with a total count of 19, 417 deployments occurring within the scope of this study. In addition, 844 closed surveys were received across the same time period. Data analysis was conducted from the findings of the data collection in the form of a run-sequence plot chart, displaying data in a time sequence. Identification of non-random patterns was used to determine how the changes in the process influenced emerging patterns. The findings in this thesis resulted from the evidence of non-random patterns, hence, successfully supporting the statement that the changes implemented in the course of this study had a direct result to quality improvement in the project. The target of reaching 2000 deployments per month was achieved along with a clear shift above the median in the customer satisfaction rate in the overall deployment experience. By putting the focus on managing the interaction between the service providers and stakeholders with the utilization of a gatekeeper and allocating tasks to local champions, creating accountability, the overarching business goals were aligned and allowed for a balanced and progressive move forward. In addition, by implementing a centralized resource directory, both the concerns of the business and technical risks posed by the service providers were presented in a collabo-rative manner. Using consistent documentation within a standard location allowed for members in the weekly sessions to rescope the IT requirements originally put forth to fit into the specific environments in question. Keywords: quality improvement, process improvement, risk, Windows 7, deployment, case study
Table of contents
1 Introduction .................................................................................................................................... 1
1.1 Background ........................................................................................................................... 3
1.1.1 Key drivers ................................................................................................................ 3
1.1.2 Challenges ................................................................................................................ 5
1.1.2.1 Risks .................................................................................................................... 6
1.1.2.2 Mitigating risks ..................................................................................................... 9
1.2 Purpose ............................................................................................................................... 11
1.3 Objectives ........................................................................................................................... 12
1.4 Research Questions ........................................................................................................... 12
1.5 Scope .................................................................................................................................. 12
1.6 Case overview .................................................................................................................... 13
1.7 Key terms and definitions ................................................................................................... 14
2 Evolution of quality improvement ................................................................................................. 15
2.1 Beginnings of quality ........................................................................................................... 15
2.2 Industrial age ...................................................................................................................... 15
2.3 Early 20th Century ............................................................................................................... 16
2.4 World War II ........................................................................................................................ 16
2.5 The move to management .................................................................................................. 16
3 Review of quality improvement methodologies ........................................................................... 18
3.1 Total Quality Management (TQM) ...................................................................................... 19
3.2 Continuous Process Improvement (CQI & TQM) ............................................................... 20
3.3 Six Sigma ............................................................................................................................ 21
3.4 Lean .................................................................................................................................... 22
3.5 Lean Six Sigma ................................................................................................................... 23
3.6 Deming’s System of Profound Knowledge (SoPK) ............................................................ 24
3.7 The Improvement Model Framework (IMF) ........................................................................ 27
3.7.1 PDSA form - template............................................................................................. 29
3.8 SoPK & IMF as a scientific tool for study ............................................................................ 30
3.8.1 Seven propositions supporting SoPK ..................................................................... 31
3.8.1.3 Testing and learning cycles ............................................................................... 31
3.8.1.4 Conceptualistic proposition ............................................................................... 31
3.8.1.5 Psychology and logic......................................................................................... 32
3.8.1.6 Justification and discovery ................................................................................ 32
3.8.1.7 Operational definitions....................................................................................... 32
3.8.1.8 Shewhart’s theory of cause systems ................................................................. 32
3.8.1.9 Systems theory .................................................................................................. 33

4 Research design .......................................................................................................................... 34
4.1 Embedded single case design – mixed methods approach ............................................... 34
4.2 Data collection .................................................................................................................... 35
4.2.1 Semi-structured end user feedback survey ............................................................ 35
4.2.2 Data collection from internal project documentation .............................................. 35
4.2.3 Reports from external third party vendors .............................................................. 35
5 Applying the Improvement Model Framework ............................................................................. 36
5.1 PDSA form - completed ...................................................................................................... 36
5.2 Project lifecycle timeline ..................................................................................................... 38
5.2.1 K5 milestone – permission to rollout ...................................................................... 38
5.2.2 PDSA 1 cycle – testing of new process ................................................................. 39
5.2.3 PDSA 2 cycle – new recruit & more regions .......................................................... 40
5.2.4 End of the project ................................................................................................... 41
6 Findings from data collection ....................................................................................................... 42
6.1 Deployments over project lifecycle ..................................................................................... 42
6.1.1 Data plotted across 19 months ............................................................................... 42
6.2 Deployment feedback survey Feb 2013 – Feb 2014 .......................................................... 44
6.3 Deployment feedback survey Feb 2014 – Sep 2014 ......................................................... 46
6.4 Monthly customer satisfaction (CSAT) rates ...................................................................... 47
6.5 Customer satisfaction (CSAT) rates over project lifecycle ................................................. 48
7 Analysis ........................................................................................................................................ 49
7.1 Types of variation ............................................................................................................... 49
7.2 Identifying non-random patterns ......................................................................................... 50
7.3 Analysis of change in MS Windows 7 deployments ........................................................... 51
7.4 Analysis of change in CSAT survey Question 9 ................................................................. 52
8 Conclusions .................................................................................................................................. 53
8.1 Conclusion of results .......................................................................................................... 53
8.2 Personal evaluation ............................................................................................................ 53
9 Discussion and further development ........................................................................................... 54
10 References ................................................................................................................................... 55
11 Appendices .................................................................................................................................. 59
11.1 Appendix 1: Windows 7 deployment feedback survey ....................................................... 59
11.2 Appendix 2: PDSA Form template ...................................................................................... 33
11.3 Appendix 3: PDSA form for the project - filled .................................................................... 34
11.4 Appendix 4: Windows 7 migration cross functional diagram (10/2012 – 6/2013) .............. 35
11.5 Appendix 5: Windows 7 migration cross functional diagram (6/2013 – 9/2014) ................ 36
11.6 Appendix 6: CSAT log March 2013 – September 2014 ..................................................... 37
Table of Figures
Figure 1:Operating system use between 2011 – 2014 for Finland and worldwide Dataset adapted
(StatCounter, 2015). ........................................................................................................................................... 1
Figure 2: Global market share of operating systems. Dataset adapted .............................................................. 2
Figure 3: 12 Key drivers for migrating to Windows 7 and Office 2010. ............................................................... 4
Figure 4: Framework of global IT project dynamic risks (Lee et al., 2015) .......................................................... 7
Figure 5: Dynamic risk mitigation strategies from SOA principles (Lee et al., 2015)........................................... 9
Figure 6: Schedule of key milestones for the Windows 7 deployment project .................................................. 13
Figure 7: Standard Microsoft Windows 7 deployment program ........................................................................ 13
Figure 8: The business excellence model of EFQm ......................................................................................... 19
Figure 9: Merging Process Reengineering and Continuous Process Improvement .......................................... 20
Figure 10: Six Sigma. DMAIC Cycle (Shaffie & Shabbaz, 2012) ...................................................................... 21
Figure 11: The Seven Types of Waste (adapted after Shaffie) ......................................................................... 22
Figure 12 Lean Six Sigma Implementation, adapted (Shaffie & Shabbaz, 2012) ............................................. 23
Figure 13: W. Edward Deming’s System of Profound Knowledge .................................................................... 25
Figure 14: The Improvement Model Framework developed by API. ................................................................. 27
Figure 15 The science of improvement. Adapted (Parry, 2014) ....................................................................... 30
Figure 16: A systematic approach for empirical research (Partington, 2002) ................................................... 34
Figure 17 timeline of changes ........................................................................................................................... 38
Figure 18: Allocation of regions across the project team. ................................................................................ 40
Figure 19: Key Performance Indicators (KPIs) ................................................................................................. 41
Figure 20 Windows 7 deployments over project lifecycle ................................................................................. 42
Figure 21: Deployment feedback survey Feb 2013 – Feb 2014 (n=236) .......................................................... 44
Figure 22: Deployment feedback survey Feb 2014 – Sep 2014 (n=608) .......................................................... 46
Figure 23: Monthly CSAT rates from March 2013 –September 2014 ............................................................... 47
Figure 24: Total CSAT volume over project lifecycle (n=844) ........................................................................... 48
Figure 25: Types of variation (Lloyd, 2004) ...................................................................................................... 49
Figure 26: Identifying non-random patterns (Provost & Murray, 2007) ............................................................. 50
Figure 27: Analysis of non-random patterns in Windows 7 deployments over project ...................................... 51
Figure 28: Analysis of improvement in CSAT survey (March 2013 – September 2014) ................................... 52
Form 1: The PDSA form (adapted from (IHI, 2015)) ......................................................................................... 33
Form 2: The PDSA form completed (adapted from (IHI, 2015)) ....................................................................... 34

Abbreviations
COQ Cost of Quality
CQI Chartered Quality Institute
Dp Data Point
DP Distribution Point
EFQM European Foundation for Quality Management
PDSA Plan, Do, Study, Act Cycle
QA Quality Assurance
SCCM System Centre Configuration Manager
SME Subject Matter Expert
SOE Standard Operating Environment
SoPK (Deming’s) System of Profound Knowledge
SQC Statistical Quality Control
TQC Total Quality Control
UAT User Acceptance Testing
WAN Wide Area Network

1
1 Introduction
By April of 2014, at least one billion copies of Windows XP were sold (Anthony, 2014).
Windows XP was the most widely used operating system until August of 2012. As seen in
Figure 1, in 2011, Windows XP worldwide owned 44% of the market share and by 2014,
the market share ownership decreased to 16%. In 2011, Windows 7 covered 35% of the
market and by August 2012 surpassed Windows XP and became the leader in market
share at over 50% (Figure 1).
Finland provides quite similar numbers for Windows 7 operating systems with 38% of
Finnish operating systems running on Windows 7 and increasing to 57% in 2014, above
the global percentage of Windows 7 operating systems in use. Windows XP had an initial
market share of 29% and has decreased significantly to just 4% in 2014.
Figure 1:Operating system use between 2011 – 2014 f or Finland and worldwide
Dataset adapted (StatCounter, 2015).
Win7 Finland; 2011; 38%
2012; 54%
2013; 59%Win7 Finland; 2014; 57%
WinXP Finland; 2011; 29%
2012; 18%
2013; 11%
WinXP Finland; 2014; 4%
0%
20%
40%
60%
2011 2012 2013 2014
OS use over time - Win7 vs WinXP
Comparison of Finland and worldwide 2011 - 2014
Win7 Finland WinXP Finland Win7 worldwide WinXP worldwide
2
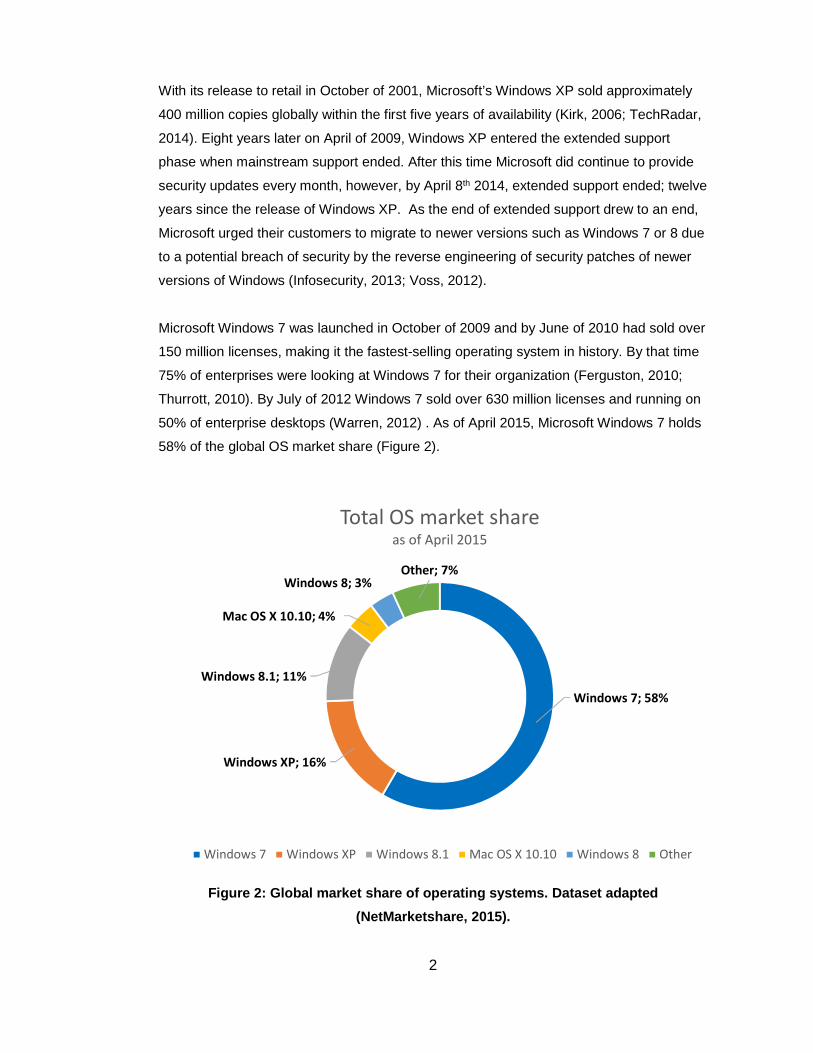
Windows 7; 58%
Windows XP; 16%
Windows 8.1; 11%
Mac OS X 10.10; 4%
Windows 8; 3%Other; 7%
Total OS market shareas of April 2015
Windows 7 Windows XP Windows 8.1 Mac OS X 10.10 Windows 8 Other
With its release to retail in October of 2001, Microsoft’s Windows XP sold approximately
400 million copies globally within the first five years of availability (Kirk, 2006; TechRadar,
2014). Eight years later on April of 2009, Windows XP entered the extended support
phase when mainstream support ended. After this time Microsoft did continue to provide
security updates every month, however, by April 8th 2014, extended support ended; twelve
years since the release of Windows XP. As the end of extended support drew to an end,
Microsoft urged their customers to migrate to newer versions such as Windows 7 or 8 due
to a potential breach of security by the reverse engineering of security patches of newer
versions of Windows (Infosecurity, 2013; Voss, 2012).
Microsoft Windows 7 was launched in October of 2009 and by June of 2010 had sold over
150 million licenses, making it the fastest-selling operating system in history. By that time
75% of enterprises were looking at Windows 7 for their organization (Ferguston, 2010;
Thurrott, 2010). By July of 2012 Windows 7 sold over 630 million licenses and running on
50% of enterprise desktops (Warren, 2012) . As of April 2015, Microsoft Windows 7 holds
58% of the global OS market share (Figure 2).
Figure 2: Global market share of operating systems. Dataset adapted
(NetMarketshare, 2015).
3
1.1 Background
In 2011 a large multinational engineering and service organization based in southern Fin-
land drew up a business case to launch a large-scale OS and Office upgrade initiative that
would affect 43,000 personnel worldwide. The project initiation was triggered by the fast
approaching April 8th, 2014 deadline, when Microsoft ended support for Windows XP and
Office 2003 (Microsoft, 2014). This organization is the focus of this study.
At the time, supported end user PCs (desktop, laptop, tablet, etc.) currently ran on the Mi-
crosoft Windows XP operating system. Any support related to security updates or tech-
nical troubleshooting would no longer be available to enterprise users. An additional major
change coming into effect was the dismantling of the internal packaged application distri-
bution infrastructure, Radia, to prepare for the System Centre Configuration Manager
(SCCM) infrastructure to be put into place.
The Radia client automation software, or Radia for short, was an end-user device lifecycle
management tool used in automating client-management related tasks such as patch
management, application software deployment, application use monitoring, security, com-
pliance, and remote system management. (Gardner, 2009), and at the time proved to be a
major pain point for the end-users as it resulted in a decrease in computer performance in
the newer pc models of Windows XP.
1.1.1 Key drivers
The end of support for XP was the major driver for the transition. Other key drivers for this
organization to initiate a large-scale project were the many software productivity and effi-
ciencies available in Windows 7 over XP. There are 12 key drivers that were identified as
supporting the business case for the transition to Windows 7. The end of support of XP,
however, underscored the decision to upgrade to Windows 7.
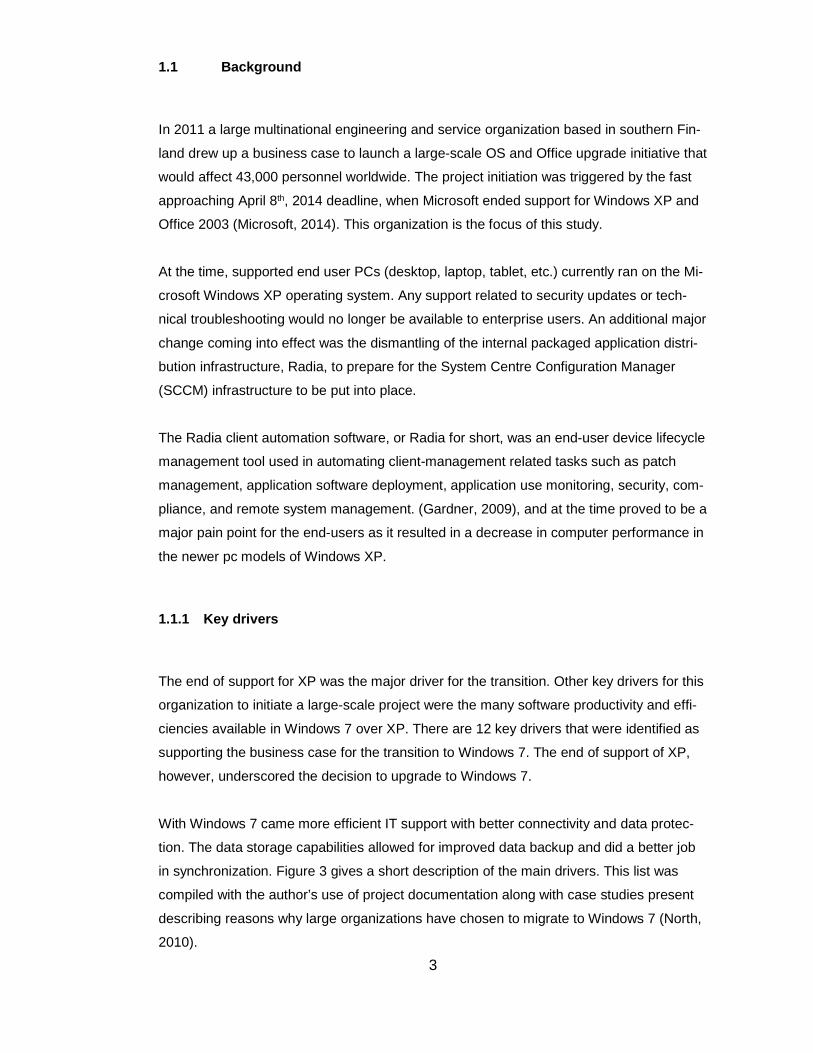
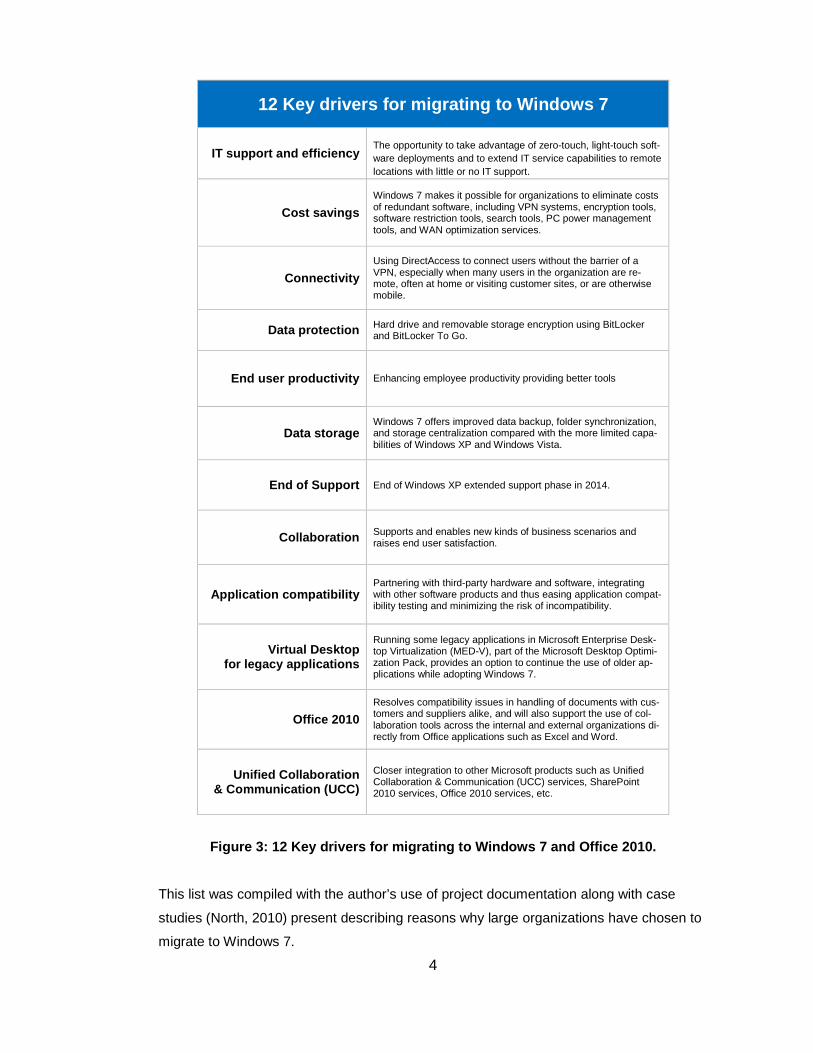
With Windows 7 came more efficient IT support with better connectivity and data protec-
tion. The data storage capabilities allowed for improved data backup and did a better job
in synchronization. Figure 3 gives a short description of the main drivers. This list was
compiled with the author’s use of project documentation along with case studies present
describing reasons why large organizations have chosen to migrate to Windows 7 (North,
2010).
4
12 Key drivers for migrating to Windows 7
IT support and efficiency
The opportunity to take advantage of zero-touch, light-touch soft-ware deployments and to extend IT service capabilities to remote locations with little or no IT support.
Cost savings Windows 7 makes it possible for organizations to eliminate costs of redundant software, including VPN systems, encryption tools, software restriction tools, search tools, PC power management tools, and WAN optimization services.
Connectivity Using DirectAccess to connect users without the barrier of a VPN, especially when many users in the organization are re-mote, often at home or visiting customer sites, or are otherwise mobile.
Data protection Hard drive and removable storage encryption using BitLocker and BitLocker To Go.
End user productivity Enhancing employee productivity providing better tools
Data storage Windows 7 offers improved data backup, folder synchronization, and storage centralization compared with the more limited capa-bilities of Windows XP and Windows Vista.
End of Support End of Windows XP extended support phase in 2014.
Collaboration Supports and enables new kinds of business scenarios and raises end user satisfaction.
Application compatibility Partnering with third-party hardware and software, integrating with other software products and thus easing application compat-ibility testing and minimizing the risk of incompatibility.
Virtual Desktop for legacy applications
Running some legacy applications in Microsoft Enterprise Desk-top Virtualization (MED-V), part of the Microsoft Desktop Optimi-zation Pack, provides an option to continue the use of older ap-plications while adopting Windows 7.
Office 2010 Resolves compatibility issues in handling of documents with cus-tomers and suppliers alike, and will also support the use of col-laboration tools across the internal and external organizations di-rectly from Office applications such as Excel and Word.
Unified Collaboration & Communication (UCC)
Closer integration to other Microsoft products such as Unified Collaboration & Communication (UCC) services, SharePoint 2010 services, Office 2010 services, etc.
Figure 3: 12 Key drivers for migrating to Windows 7 and Office 2010.
This list was compiled with the author’s use of project documentation along with case
studies (North, 2010) present describing reasons why large organizations have chosen to
migrate to Windows 7.

5
1.1.2 Challenges
By January of 2012 relevant third party service providers were selected, teams were set
into place, and arrangements were made for the project kick-off to take place during the
summer of the 2012. The windows 7 rollout moved forward, but with challenges. By the
summer of 2013, there was a clear need to review the processes that were in place. Trust
lost among local stakeholders had prevented the project from ramping up Windows 7 de-
ployments and reaching key milestones.
Process gaps also prevented a smooth experience and was evident by low percentages
found in customer satisfaction feedback surveys. As a result, an essential prerequisite to
ensure project continuity was to restore trust among local stakeholders and end-users
alike. This triggered a quality improvement initiative while serving as the project’s Jr. Pro-
ject Manager in the organization.
The following sections explain how the lack of trust and other factors can work against the
overall success of a global IT project.
6
1.1.2.1 Risks
Studies have shown that trust, cultural management and collaborative communication can
become critical risk factors in the overall success of a global IT project (Mohtashami, Mar-
lowe, Kirova, & Deek, 2006). Risk, as identified by Badiru (2009) are uncertainties which
may prevent a project delivering expected outcomes in time, scope, budget, and/or qual-
ity. Risk in Global IT projects increase when there are differences related to geographic
distances, ineffective structures for collaboration, language barriers, and technological in-
compatibility (Dawidson, Karlsson, & Trygg, 2004; Persson, Mathiassen, Boeg, Madsen, &
Steinson, 2009; Powell, Piccoli, & Ives, 2004) as cited in (Lee, Blake, & Baby, 2015)
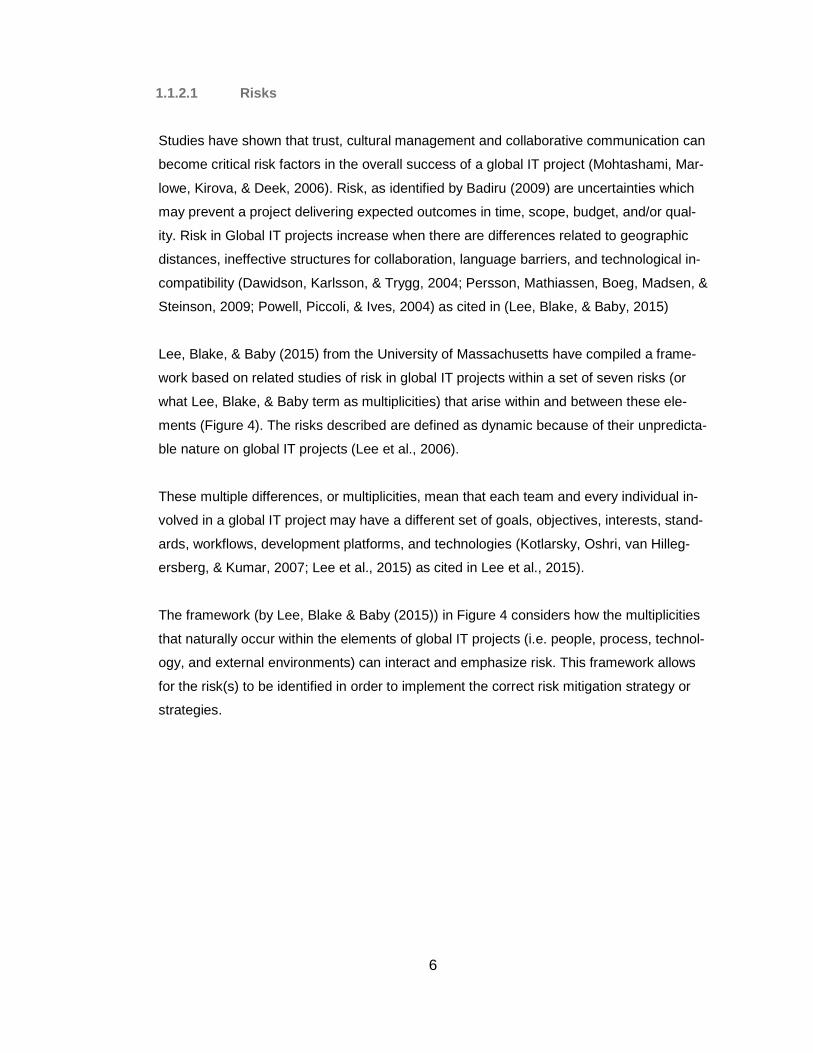
Lee, Blake, & Baby (2015) from the University of Massachusetts have compiled a frame-
work based on related studies of risk in global IT projects within a set of seven risks (or
what Lee, Blake, & Baby term as multiplicities) that arise within and between these ele-
ments (Figure 4). The risks described are defined as dynamic because of their unpredicta-
ble nature on global IT projects (Lee et al., 2006).
These multiple differences, or multiplicities, mean that each team and every individual in-
volved in a global IT project may have a different set of goals, objectives, interests, stand-
ards, workflows, development platforms, and technologies (Kotlarsky, Oshri, van Hilleg-
ersberg, & Kumar, 2007; Lee et al., 2015) as cited in Lee et al., 2015).
The framework (by Lee, Blake & Baby (2015)) in Figure 4 considers how the multiplicities
that naturally occur within the elements of global IT projects (i.e. people, process, technol-
ogy, and external environments) can interact and emphasize risk. This framework allows
for the risk(s) to be identified in order to implement the correct risk mitigation strategy or
strategies.

7
Framework of global IT project dynamic risks
Multiplicities Dynamic Risk Example
People –
People
Multi-Stakeholder Relations
Unresolved conflict from divergent opinions and interests
Communication
Challenges Multiple languages and cultural practices
Process –
Process
Multi-PM Practices Heterogeneous project management meth-odologies, practices, and capabilities
Heterogeneous
Business Traditions
Varying and possibly incompatible business
processes, policies, and strategies across multiple locations
Technology -
Technology Heterogeneous IT Strategies
Varying levels of IT investment, organiza-
tional competencies (e.g. CMMI), and devel-
opment platforms
People –
Process
Multi-Group
Knowledge Sharing
Lack of trust between two or more groups and difficulty to transfer useful knowledge
from one group to another
Task Distribution and
Resource Coordination
Mismatch between task and resource alloca-
tions, or planned resources unavailable
People –
Technology New Technology Adoption
Resistance to new technologies from learn-
ing curves necessary, inertia, change organ-
izational power
Process -
Technology
Task-Technology
Misfits
Discrepancy between tasks assigned to a
group or location and availability of re-
sources or technologies
Misalignment of Business and IT
Strategies
IT strategies that are inappropriate or inef-fective in fulfilling business strategies
Internal –
External
Multi-Regulatory Compliance
Different or ambiguous compliance require-ments, misunderstanding of rules and regu-
lations
Project Continuity
Incompatible or varying disaster recovery
plans, potential impact of local disasters or
catastrophes
Figure 4: Framework of global IT project dynamic ri sks (Lee et al., 2015)

8
Within the Windows 7 deployment project, a difficulty to transfer critical information and
feedback within the People-Process multiplicity resulted in a failed knowledge sharing
efforts across multiple groups ranging from the external technical teams, the internal pro-
ject teams and the local country stakeholder.
In addition to this, the multiple languages and cultural practices found within the People-
People multiplicity in this project with having offshore service providers and having to
deploy Windows 7 across 54 countries worldwide resulted in communication challenges
and unresolved conflict from divergent opinions and interests within the multi-stakeholder
relations category.
Heterogeneous business traditions resulted through the varying incompatible business
processes, policies, and strategies across multiple locations within the Process-Process
multiplicity .
A fourth major element involved in enhancing risk within the project was the Internal-Ex-
ternal multiplicity . With the inability to communicate critical information in relation to a lo-
cal business unit, a misunderstanding arose in understanding local governmental compli-
ance requirements and the inability to assess the potential impact of local disasters such
as total network outages, and other deleterious events that had major impacts to busi-
ness-as-usual (BAU) continuity.
9
1.1.2.2 Mitigating risks
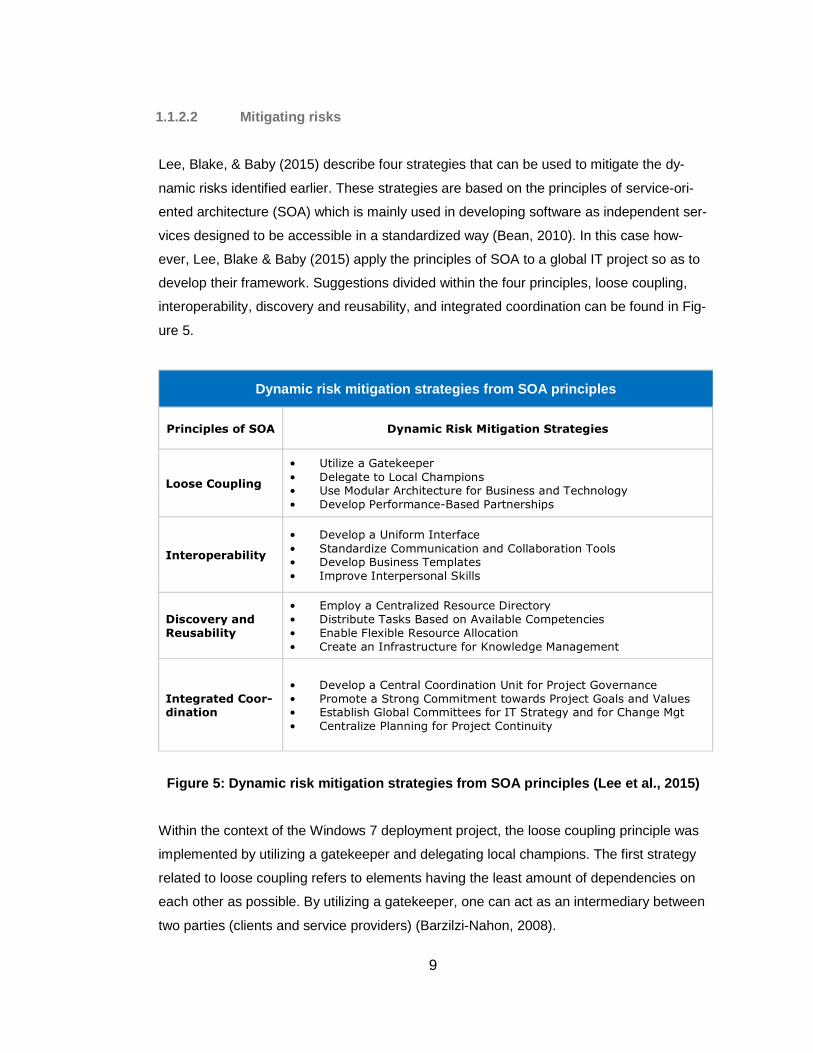
Lee, Blake, & Baby (2015) describe four strategies that can be used to mitigate the dy-
namic risks identified earlier. These strategies are based on the principles of service-ori-
ented architecture (SOA) which is mainly used in developing software as independent ser-
vices designed to be accessible in a standardized way (Bean, 2010). In this case how-
ever, Lee, Blake & Baby (2015) apply the principles of SOA to a global IT project so as to
develop their framework. Suggestions divided within the four principles, loose coupling,
interoperability, discovery and reusability, and integrated coordination can be found in Fig-
ure 5.
Dynamic risk mitigation strategies from SOA princip les
Principles of SOA Dynamic Risk Mitigation Strategies
Loose Coupling
• Utilize a Gatekeeper
• Delegate to Local Champions • Use Modular Architecture for Business and Technology
• Develop Performance-Based Partnerships
Interoperability
• Develop a Uniform Interface
• Standardize Communication and Collaboration Tools • Develop Business Templates
• Improve Interpersonal Skills
Discovery and
Reusability
• Employ a Centralized Resource Directory
• Distribute Tasks Based on Available Competencies
• Enable Flexible Resource Allocation
• Create an Infrastructure for Knowledge Management
Integrated Coor-dination
• Develop a Central Coordination Unit for Project Governance
• Promote a Strong Commitment towards Project Goals and Values • Establish Global Committees for IT Strategy and for Change Mgt
• Centralize Planning for Project Continuity
Figure 5: Dynamic risk mitigation strategies from S OA principles (Lee et al., 2015)
Within the context of the Windows 7 deployment project, the loose coupling principle was
implemented by utilizing a gatekeeper and delegating local champions. The first strategy
related to loose coupling refers to elements having the least amount of dependencies on
each other as possible. By utilizing a gatekeeper, one can act as an intermediary between
two parties (clients and service providers) (Barzilzi-Nahon, 2008).
10
A gatekeeper could be a project manager or someone with equal knowledge. In the qual-
ity improvement project that was to follow, the author took on the role of gatekeeper and
reorganized the client and service provider approach by creating a face to face platform in
order to address issues related to the risks found in the people-people and people-pro-
cess multiplicities.
The second strategy in this category is to delegate to local champions. By delegating
tasks to local champions , a sense of accountability emerges and immediate awareness
of changes and their potential impact on project outcomes becomes evident. Also, this
strategy facilitates adaptation to unique needs at the local sites. During the quality im-
provement project, the local country managers, or local stakeholders, took on the role of
local champions.
Within the discovery and reusability principle, a centralized resource directory was im-
plemented in the Windows 7 deployment project during the quality improvement initiative.
An additional recruit was hired to help keep the consistency in place within the additional
regions. Consistency was essential when determining which approach would best fit an
emerging requirement. Implementing a centralized resource directory also allowed the
ability to correctly allocate resources on short notice across globally distributed business
units based on available competencies.
It is important to note at this point that while there were various initiatives that improved
the performance within the overall lifecycle of the project, this study focuses on specific
measures taken between June of 2013 and September of 2014 to retain the buy-in of lo-
cal stakeholders to re-launch windows 7 deployments within the specific country and to
improve end user satisfaction levels regarding the overall deployment experience.

11
1.2 Purpose
The purpose of this study was to apply The Improvement Model Framework to a process
change in a large-scale IT project to achieve the following results:
• Increase the rate of Windows 7 deployments to achieve target dates
• Improve end user satisfaction levels to make use of the more efficient operating system.
This thesis describes how The Improvement Model Framework has been applied to the
Windows 7 deployment project in a large multinational corporation to achieve improve-
ment in quality to regain the buy-in of local stakeholders and to re-launch Windows 7 de-
ployments within pending countries. There appears to be limited research as of yet re-
garding the joining of the Improvement Model Framework with an IT project and based on
the research that has been found thus far, there is a propensity to use the Improvement
Model Framework in mainly healthcare related initiatives.
The concept of Quality, dating back to medieval Europe and culminating into a scientific
discipline by the 20th Century has developed into a diverse set of methodologies that
have been applied to all sectors of the society we live in today - healthcare, business, in-
dustry, government, military, to give some examples. To say that there has been research
done and books written in this field would be an understatement.
Quality frameworks such as Six Sigma, Lean, TQM, etc., is the more natural choice when
applying quality improvement initiatives within the business and technology sectors. The
Improvement Model is similar to other quality improvement frameworks in that the basis
for these models trace back to Shewhart’s statistics based quality control and Deming’s
System of Profound Knowledge.
The Improvement Model Framework, based on Dr. W. Edwards Deming's philosophy, al-
lows a deep dive into taking action to improve a specific aim that the organization -within a
relatively short time frame required for planning. By documenting the learning of how The
Improvement Model Framework can be applied to a process change in a large large-scale
IT systems project, and determining how applicable it would be in this type of setting, this
study can give the organization in question the possibility of using this methodology in fur-
ther improvement projects within the organization to achieve desired results.

12
1.3 Objectives
The objectives of this thesis are the following:
• Identify where improvement action should be taken • Identify the improvement action to be taken • Implement and measure the outcomes of the improvement action taken
1.4 Research Questions
The author poses two questions to answer the purpose and objectives set for this study:
• How can the quality of the process be improved in order to regain deployment mo-
mentum to reach 2000 deployments per month?
• How can the quality of the process be improved in order to raise end user cus-
tomer satisfaction levels by 5%?
1.5 Scope
The scope of this thesis is to show how confidence levels within Windows 7 deployment
project was regained following a major problem with the initial deployment software cho-
sen and inefficiencies in the processes that had been put into place. It will look at the pro-
cesses put in place to achieve this confidence so that timescales could be met. It will also
look at the metrics used to ensure that end user satisfaction was improved to meet the
new timescales put into place.
This thesis will not be reviewing the technology being used unless the decision was made
in accordance to the Quality Processes put in place. The author will not be reviewing in
depth at the failures that caused the requirement to reassess the processes in place. The
author will also not be looking at the problems that occurred during the rollout that are
apart from those that have had a direct impact on the overall metrics of the new pro-
cesses.

13
Standard Microsoft Windows 7 deployment program
Operational readiness
Delivery Support
Application readiness OS build Training
End users Support staff
Comms/ Buy in
End users Stakeholders
Business intelligence
Focus areas for this improvement project
1.6 Case overview
The model used in the organization provides a path which leads a project from an idea
through different phases and stages in the project (K0 – K6). By passing the standardized
decision points and gates, the aim is to ensure that the project fulfils the quality criteria
and develops to a profitable business for the company.
The planning stages for the Window7 and Office 2010 project began in December of 2011
and permission was given to start piloting in April of 2012 (Figure 6).
Milestones
Baseline
Actual
K0 – Permission for preparation 2011-12-09 2011-12-09
K1 – Permission to start project 2012-01-31 2012-01-31
K2 – Specification frozen 2012-04-15 2012-04-15
K3 – Development completed 2012-06-30 2012-06-30
K4 – Permission to pilot 2012-04-30 2012-04-30
K5 – Permission to roll-out 2013-01-07 2013-01-07
K6 – Project closed 2014-04-30 2014-09-30
Figure 6: Schedule of key milestones for the Window s 7 deployment project
Improvement initiatives for the windows 7 deployment project only include the following
areas: operational readiness, specifically delivery and support of the windows 7 deploy-
ment, communication and buy-in from end users and stakeholders. Figure 7 shows the
shaded areas where the process improvement changes have been set into place.
Figure 7: Standard Microsoft Windows 7 deployment p rogram
(Rajavelu, Eylon, & Duncan, 2010) .

14
1.7 Key terms and definitions
The terminology used throughout this thesis will be described here.
Microsoft Windows XP
Windows XP is a personal computer operating system produced by Microsoft as part of
the Windows NT family of operating systems (Wikipedia).
Microsoft Windows 7
Windows 7 is a personal computer operating system developed by Microsoft. It is a part of
Windows NT family of operating systems. Windows 7 was released to manufacturing on
July 22, 2009 and became generally available on October 22, 2009 less than three years
after the release of its predecessor, Windows Vista. Windows 7's server counterpart, Win-
dows Server 2008 R2, was released at the same time (Wikipedia).
Unified Collaboration & Communication (UCC)
Unified communications and collaboration (UCC) describes the combination of communi-
cations and collaboration technologies (Gartner).
Microsoft System Centre Configuration Manager (SCCM)
System Centre Configuration (SCCM) is a systems-management software product devel-
oped by Microsoft for managing large groups of computers. Configuration Manager pro-
vides remote control, patch management, software distribution, operating system deploy-
ment, network access protection and hardware and software inventory (Wikipedia).
15
2 Evolution of quality improvement
2.1 Beginnings of quality
The concept of quality has origins that date back to the late 13th century when craftsmen
began organizing unions called guilds in medieval Europe. Besterfield & Juran (as cited in
(Yong & Wilkinson, 2002) describe how these guilds organized inspection committees that
would assess the quality of the product and would acknowledge superior craftsmanship
with a mark or symbol to show that specifications were carefully adhered to (History of
Quality, 2014).
2.2 Industrial age
These practices continued to develop but it wasn't until the beginning of the Industrial
Revolution when mass production became the norm and self-inspections were no longer
possible (Yong & Wilkinson, 2002), that a new and innovative management approach was
brought into the fold. One of the most influential writings in organizational science, as de-
scribed by Bed & Wren (as cited in (Yong & Wilkinson, 2002), Fredrick Taylor's (1911)
Principles of Scientific Management introduced a production methodology that would
yield such efficiency on the manufacturing floor that profits increased and wages were
raised (Satyanarayana, White, & Hough, 2002) through the implementation of a style
called flow-line (Yong & Wilkinson, 2002).
Gabor (2000) as cited in (Satyanarayana et al., 2002) called Taylor the "Father of scien-
tific management" and wrote, "If American management became a global standard, it was
due in large part to the foundations laid by Taylor. Without Taylorism, large-scale mass
production would have been impossible". As if to foresee what was to come, Taylor pre-
pared the way for the era of "processes" in quality practices, marking the beginning of the
20th century (History of Quality, 2014).

16
2.3 Early 20 th Century
In 1924, Walter Shewhart, with a background in physics, engineering and statistics began
focusing on controlling the processes that went on in Bell laboratories and developed a
statistical chart for the control of product variables (Yong & Wilkinson, 2002), in other
words, he focused on making quality relevant not only for the final product but for the pro-
cesses that created it (History of Quality, 2014). With the publishing of his book in 1931,
Economic Control of Quality of Manufactured Product, Shewhart marked the beginning of
a new era in statistical quality control (SQC) (History of Quality, 2014; Yong & Wilkinson,
2002). This endeavour by Shewhart was the first time a scientific approach was taken in
the realm of quality (Yong & Wilkinson, 2002). The modern-day control chart is based on
this foundation and is the analysis tool used in this study.
2.4 World War II
Parallel to this work, two additional colleagues at Bell laboratories were developing the
practice of acceptance sampling, an important element in the growth of SQC (Yong & Wil-
kinson, 2002). Harry Romi and Harold Dodge proposed that checking a limited number of
items in a production lot was much more efficient than checking every one. To state in a
simplified manner, if the sample chosen did not pass inspection, then and only then would
the entire lot be checked. These acceptance sampling techniques played a major role in
the quality control used in the manufacturing of large volumes of ammunition during World
War II (Yong & Wilkinson, 2002).
2.5 The move to management
By the 1950’s a new contribution was added to statistical quality control (SQA) (Yong &
Wilkinson, 2002) when Joseph Juran, also an engineer at Bell Laboratories, became in-
volved in the subject of management (History of Quality, 2014). At the time companies be-
lieved that in order to improve quality, cost would be compromised. Juran, in his book
Quality Control Handbook, brought a breakthrough in the managerial approach of the day
and showed that expenditures on prevention were justified if they were lower than the cost
of the product failures (Yong & Wilkinson, 2002).
17
It was at this time that Costs of Quality (COQ) was introduced, where Juran described the
two aspects management needs to focus on: unavoidable and voidable costs. Prevention
activities such as inspection, sampling and other quality control activities are unavoidable
costs whereas defect and product failures such as break-fix, complaints, and recalls are
avoidable costs (Yong & Wilkinson, 2002).
Feigenbaum also took it a step further in the subject of COQ by introducing Total Quality
Control (TQC) (Yong & Wilkinson, 2002). Feigenbaum stressed the importance of includ-
ing marketing, design, engineering, purchasing, manufacturing, inspection, and so on to
create an effective system for quality development, quality maintenance, and quality im-
provement efforts (Feigenbaum, 1983 as cited in (Yong & Wilkinson, 2002).
It was also in the 1950’s that Dr W Edwards Deming, a statistician with the U.S. Depart-
ment of Agriculture and Census Bureau, and a proponent of Shewhart’s SQC methods
became a leader of the quality movement both in Japan and the United States (History of
Quality, 2014). While in Japan, Dr Deming played a key role in introducing the quality phi-
losophy to Japanese engineers in an 8-day lecture held in Tokyo (Yong & Wilkinson,
2002).
Through these and further efforts, Japanese industry rose to quality excellence and cap-
tured the world market within five years (History of Quality, 2014).
18
3 Review of quality improvement methodologies
Quality improvement has become a foundation of organizations today and various mod-
els, frameworks and methodologies can be found in the study of quality covering public
and private sectors. The related methodologies discussed in this paper have been chosen
for their relation to the Improvement model which is the theoretical framework used for this
case study.
Methodologies that will be discussed in this chapter are Total Quality Management, Con-
tinuous Process Improvement, Six Sigma, Lean, Lean Six Sigma, Deming’s system of
profound knowledge, The Improvement Model Framework and the PDSA cycle.
19
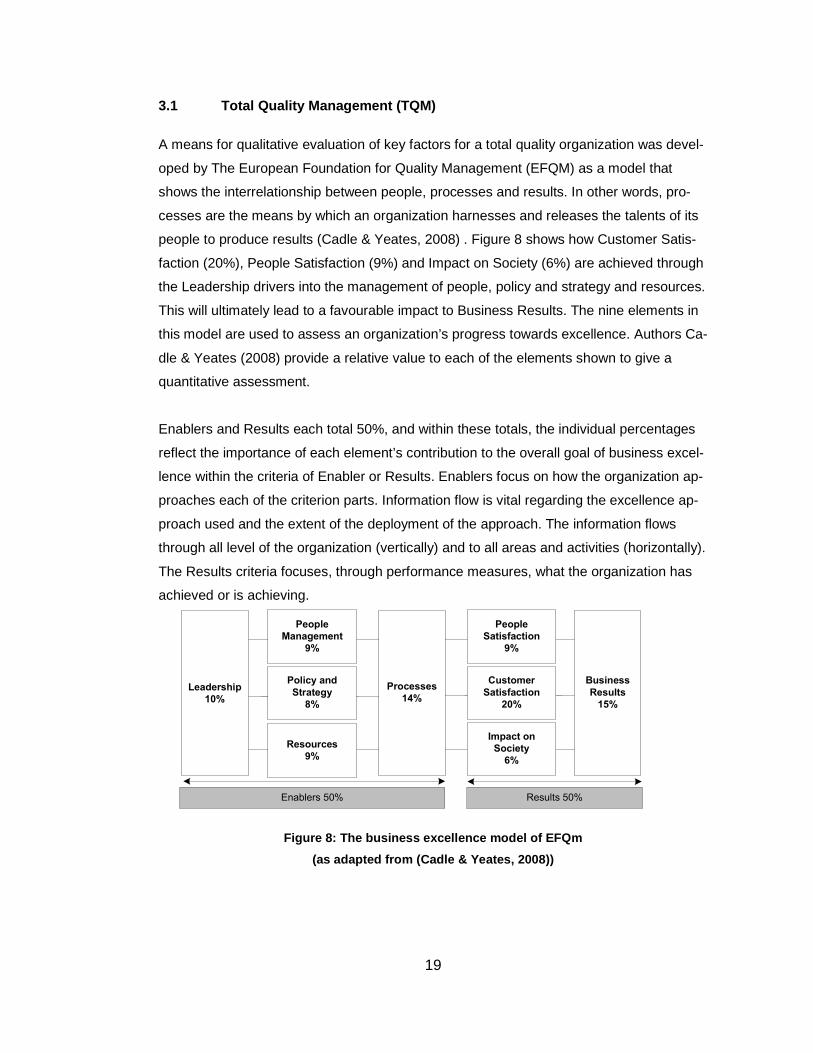
3.1 Total Quality Management (TQM)
A means for qualitative evaluation of key factors for a total quality organization was devel-
oped by The European Foundation for Quality Management (EFQM) as a model that
shows the interrelationship between people, processes and results. In other words, pro-
cesses are the means by which an organization harnesses and releases the talents of its
people to produce results (Cadle & Yeates, 2008) . Figure 8 shows how Customer Satis-
faction (20%), People Satisfaction (9%) and Impact on Society (6%) are achieved through
the Leadership drivers into the management of people, policy and strategy and resources.
This will ultimately lead to a favourable impact to Business Results. The nine elements in
this model are used to assess an organization’s progress towards excellence. Authors Ca-
dle & Yeates (2008) provide a relative value to each of the elements shown to give a
quantitative assessment.
Enablers and Results each total 50%, and within these totals, the individual percentages
reflect the importance of each element’s contribution to the overall goal of business excel-
lence within the criteria of Enabler or Results. Enablers focus on how the organization ap-
proaches each of the criterion parts. Information flow is vital regarding the excellence ap-
proach used and the extent of the deployment of the approach. The information flows
through all level of the organization (vertically) and to all areas and activities (horizontally).
The Results criteria focuses, through performance measures, what the organization has
achieved or is achieving.
Figure 8: The business excellence model of EFQm
(as adapted from (Cadle & Yeates, 2008))
Leadership
10%
Policy and
Strategy
8%
Resources
9%
Customer
Satisfaction
20%
Impact on
Society
6%
Business
Results
15%
Enablers 50% Results 50%
People
Management
9%
Processes
14%
People
Satisfaction
9%

20
3.2 Continuous Process Improvement (CQI & TQM)
As can be seen from the concepts presented at the introduction of this thesis, improve-
ment and quality have been and are the focus of many organizations and can be found in
every sector. Shaffie & Shabbaz (2012) write in their book, “”Lean Six Sigma” that no
methodology (or framework) has staying power if there is no foundation and consensus on
being committed to continuous improvements throughout the whole organization. In addi-
tion to dedication to improvement, the importance of managing information is just as im-
portant and go hand in hand.
Today’s business functions are interlinked with the presence of IT and information sys-
tems management and are vital in successfully aligning processes with business strategy
(Shaw, 2013). In summary, having a specific framework may not be the ultimate goal, but
having a standard roadmap on how to conduct improvement projects within one’s organi-
zation, is probably one of the most important facets of an organization today.
There is a vast body of knowledge on the concept of continuous improvement (CI), and
process improvement is the key to keeping a quality product in production (McDermott &
Sharp, 2008). Kaizen, developed by Masaaki Imai in his book, “Kaizen: The Key to Ja-
pan’s Competitive Success” describes 16 Kaizen management practices that can be ap-
plied in an organization. Continuous improvement also combines reengineering practices
that stem from the first World Ward. Called, Chartered Quality Institute (CQI), the reengi-
neering (CQI) and kaizen (TQM) communities have been brought together to form the
general concept of process management as seen in Figure 9 (McDermott & Sharp, 2008).
Figure 9: Merging Process Reengineering and Continu ous Process Improvement
(McDermott & Sharp, 2008)

21
3.3 Six Sigma
A familiar framework that is related to this research is Six Sigma. The hunt for a quality ini-
tiative that would be able to compete against Japanese companies using Total Quality
Control (TQC) and Lean principles to improve manufacturing performance and design
“customer-centric” products came to a head in the late 1970s, when many U.S.-based
companies, leading manufacturers, began losing market share to overseas competitors
(Shaffie & Shabbaz, 2012). A push toward a variation of TQC, Total Quality Management
(TQM) became the main quality methodology to overtake U.S. firms. Six Sigma, began
gaining ground in the 1990’s, with a solid endorsement from Jack Welch, CEO of General
Electric at the time.
Fast forward to today and one can see Six Sigma in all major segments; financial ser-
vices, healthcare, defence, government, and manufacturing. Six Sigma, as defined by
Shaffie & Shabbaz (2012), is a statistical problem-solving methodology and a manage-
ment philosophy, on that dictates that business and process decisions should be based
on data. The Six Sigma methodology contains 5 phases, known as DMAIC; Define the
problem, goal, or benefit, Measure how the current process is doing and collect data,
Analyse the cause of the issue, Improve the process to troubleshoot and solve issues,
and Control the process of improvement creating continuity and sustainability (Figure 10).
Critical in areas such as the service sector, the fundamental goal in the Six Sigma meth-
odology is to reduce operational variance by improving the quality and performance; an
ode to Walter Shewhart’s breakthrough work in the 1920’s making quality relevant not
only for the final product but for the processes that created it (History of Quality, 2014).
Figure 10: Six Sigma. DMAIC Cycle (Shaffie & Shabba z, 2012)
Define
Measure
Analyze
Improve
Control
DMAIC

22
The Six Sigma methodology provides a roadmap to identify hidden factors that can cause
the organization money, opportunities and customers. Key deliverables that Six Sigma
can provide, if applied at optimal level are improved service reliability, which is con-
sistency of delivering high quality service the first time, improved responsiveness to cus-
tomer needs, improved assurance that the customer’s trust in the product or service can
be upheld and reduced expenses by improving the effectiveness and accuracy of the or-
ganization’s processes and lastly increased revenue by understanding how and when to
deliver customer specifications at the right price (Shaffie & Shabbaz, 2012).
3.4 Lean
The Lean methodology focuses on improving value from the customer’s point of view by
shortening the timeline between the customer request and the delivery of the service,
through the reduction of waste of time and resources. The basic steps an organization has
to follow to implement Lean is to understand customer’s needs and wants and develop a
value stream to determine the steps, and discover where value is added and waste is pro-
duced.
Shaffie & Shabbaz (2012) define waste as any activity that adds time and cost but shows
no improvement in the form of fit, form or function of the service or product delivered and
undermines the value from the customer’s point of view. Figure 11 describes the seven
types of waste that is identified in the Lean methodology; defects, waiting, overproduction,
unnecessary transportation, inventory, over processing, and motion.
Figure 11: The Seven Types of Waste (adapted after Shaffie )

23
3.5 Lean Six Sigma
The principles that are known today as Lean and Six Sigma have merged over the years.
Six Sigma offers a method to go into in-depth problem solving while Lean focuses on
quickly and efficiently improving processes by removing waste. By reducing variation
through the enhancement of quality and accuracy of processes, Six Sigma provides a
very structured approach not found in Lean. However when combining these two princi-
ples the root cause of various different business challenges can be addressed and work
well together to provide a toolkit to the various tasks presented in obtaining the best re-
sults in an organization, whether it is to identify redundant processes or improve the qual-
ity in a product or service offered (Shaffie & Shabbaz, 2012).
A successful implementation of lean Six Sigma follows the path shown in Figure 12. In the
rollout of a Lean Six Sigma effort it is vital for the Quality leader to align efforts with the or-
ganization’s mission in the initial phase by promoting four milestones (Figure 12). Im-
portant to this first phase is the building of an infrastructure that promotes quality in the
Strategy that is developed. The next milestone is to create awareness concerning the initi-
ative by formulating a communication plan. The third milestone is the Culture rollout where
the organization is shown what can be expected if it moves into the Lean Six Sigma path.
The final milestone is to institutionalize the initiative to ensure that all projects are con-
ducted under the Lean Six Sigma framework (Shaffie & Shabbaz, 2012).
Figure 12 Lean Six Sigma Implementation, adapted (S haffie & Shabbaz, 2012)

24
3.6 Deming’s System of Profound Knowledge (SoPK)
Dr. W. Edwards Deming, the father of quality, culminates his lifelong work into the System
of Profound Knowledge (SoPK) a framework of thought and action to be used for the pur-
pose of transforming and creating a thriving organization, with the aim for everybody to
win (Deming Institute, 2015).
The Deming institute (2015) states that by applying the principles and practices of SoPK,
a business can simultaneously reduce costs through reducing waste, rework, staff turno-
ver and possible legal liabilities, while increasing profitability, customer loyalty, work satis-
faction, and, ultimately quality.
25
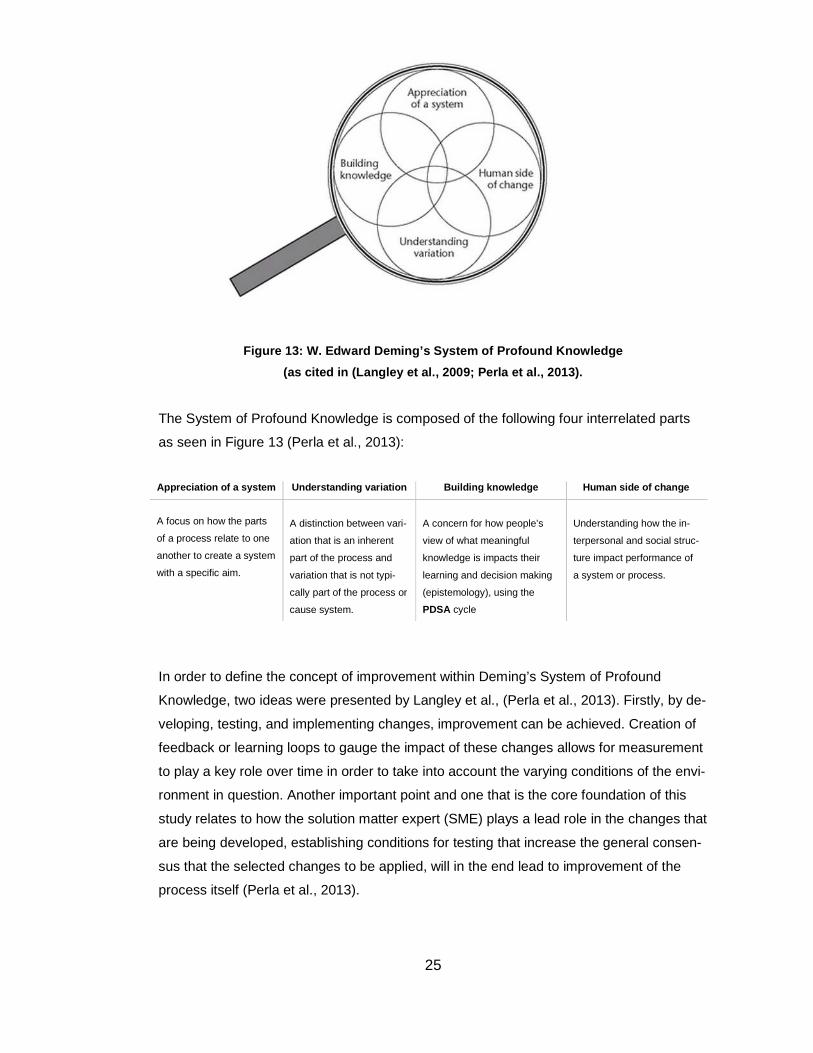
Figure 13: W. Edward Deming’s System of Profound Knowledge
(as cited in (Langley et al., 2009; Perla et al., 2 013).
The System of Profound Knowledge is composed of the following four interrelated parts
as seen in Figure 13 (Perla et al., 2013):
In order to define the concept of improvement within Deming’s System of Profound
Knowledge, two ideas were presented by Langley et al., (Perla et al., 2013). Firstly, by de-
veloping, testing, and implementing changes, improvement can be achieved. Creation of
feedback or learning loops to gauge the impact of these changes allows for measurement
to play a key role over time in order to take into account the varying conditions of the envi-
ronment in question. Another important point and one that is the core foundation of this
study relates to how the solution matter expert (SME) plays a lead role in the changes that
are being developed, establishing conditions for testing that increase the general consen-
sus that the selected changes to be applied, will in the end lead to improvement of the
process itself (Perla et al., 2013).
Appreciation of a system Understanding variation Building knowledge Human side of change
A focus on how the parts
of a process relate to one
another to create a system
with a specific aim.
A distinction between vari-
ation that is an inherent
part of the process and
variation that is not typi-
cally part of the process or
cause system.
A concern for how people’s
view of what meaningful
knowledge is impacts their
learning and decision making
(epistemology), using the
PDSA cycle
Understanding how the in-
terpersonal and social struc-
ture impact performance of
a system or process.

26
Within the theory of knowledge, (one of the four parts described above in the System of
profound knowledge, Figure 13), Deming wanted to push the importance of attaining
knowledge by developing what is known today as the plan-do-study-act cycle (PDSA).
This was originally introduced to Deming by Walter Shewhart. Deming wanted to show a
systematic and dynamic process introducing not only theory but applied science as well to
yield valuable information that has the potential to be used for continual development of a
process or product (Deming Institute, 2015).
The Associates in Process Improvement (API) took this one step further by developing the
Improvement Model Framework through the joining of the PDSA cycle with three funda-
mental questions, and will be described in the next section. The Associates in Process Im-
provement (API) helps organizations improve their products and service by developing
methods and working with leaders and teams to provide education and training to build
their capability for on-going improvement.
27
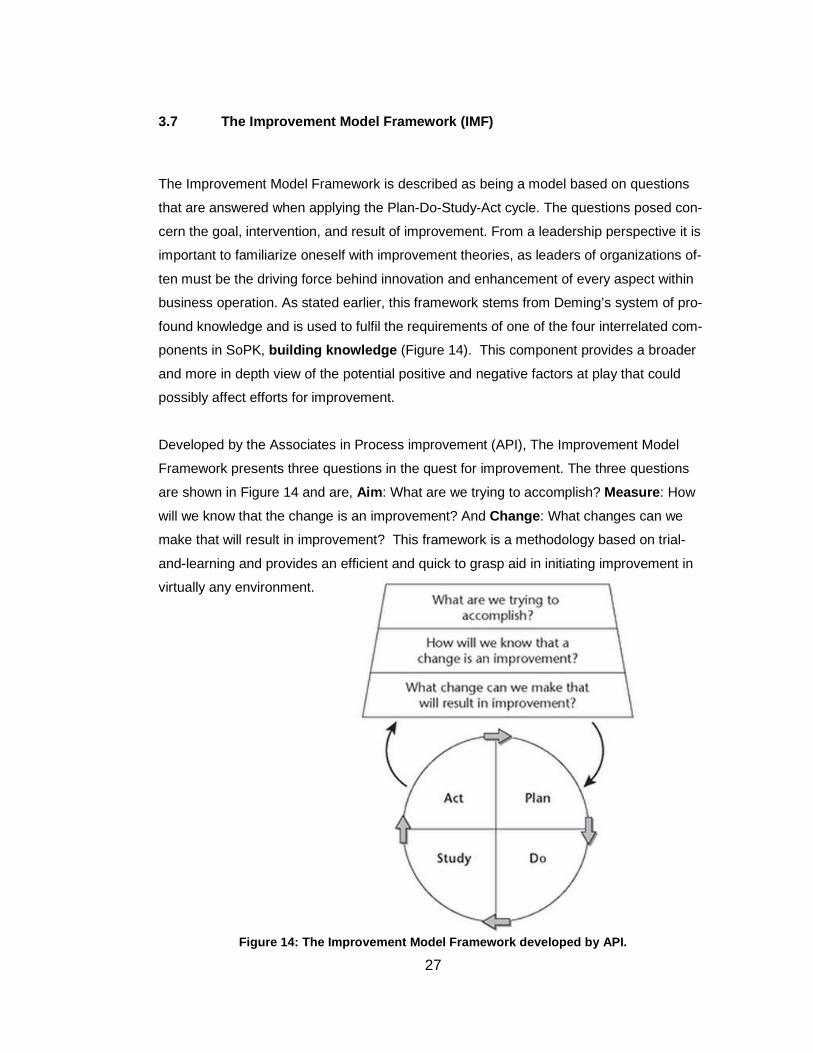
3.7 The Improvement Model Framework (IMF)
The Improvement Model Framework is described as being a model based on questions
that are answered when applying the Plan-Do-Study-Act cycle. The questions posed con-
cern the goal, intervention, and result of improvement. From a leadership perspective it is
important to familiarize oneself with improvement theories, as leaders of organizations of-
ten must be the driving force behind innovation and enhancement of every aspect within
business operation. As stated earlier, this framework stems from Deming’s system of pro-
found knowledge and is used to fulfil the requirements of one of the four interrelated com-
ponents in SoPK, building knowledge (Figure 14). This component provides a broader
and more in depth view of the potential positive and negative factors at play that could
possibly affect efforts for improvement.
Developed by the Associates in Process improvement (API), The Improvement Model
Framework presents three questions in the quest for improvement. The three questions
are shown in Figure 14 and are, Aim : What are we trying to accomplish? Measure : How
will we know that the change is an improvement? And Change : What changes can we
make that will result in improvement? This framework is a methodology based on trial-
and-learning and provides an efficient and quick to grasp aid in initiating improvement in
virtually any environment.
Figure 14: The Improvement Model Framework developed by API.

28
Walter Shewhart was the originator of this four-phase (PDSA) process and Dr. Walter
Deming created a mainstream approach by implementing what is also known as the
“Shewhart's cycle” (Deming Institute, 2015). This framework is used as the foundation for
this thesis as it allows for changes to be tested relatively quickly instead of launching a
large-scale planning initiative that could easy take several months before any action is
taken.
To answer the Aim , Measure , and Change questions, the phases of Plan, Do, Study, and
Act (PDSA) are included as a cycle in order to implement the change and determine if
there has been a desired effect (Langley et al., 2009).
This framework is best applied with the formation of a team where each member has an
important role in getting the change to happen in a complex system. With the question,
what are we trying to accomplish? , the aim is determined. The aim should be time-spe-
cific and measurable. Secondly, to answer, how will we know that a change is an improve-
ment? , measures need to be established to obtain the outcome measures of the current
state. Thirdly, to identify what changes can be made that would result in improvement? , a
review of the current process needs to be made to see what improvement suggestions
can be brought forward to be tested (IHI, 2015).
Once these three questions are answered, the next step is to begin the PDSA cycle, as
shown in figure 14. The changes suggested in the third (Change) question along with the
specific measures used as a benchmark in question two (Measure ) can be applied and
monitored to determine if the changes result in the accomplishment of question one
(Aim ), that is, the improvement goals set out in the beginning of the improvement project.
The PDSA cycle is ongoing as shown by the 2 arrows in Figure 14. Continual improve-
ment is a constant effort, and once the aim is achieved, the next phase can begin with fur-
ther improvement ideas based on the latest improvement efforts.
29
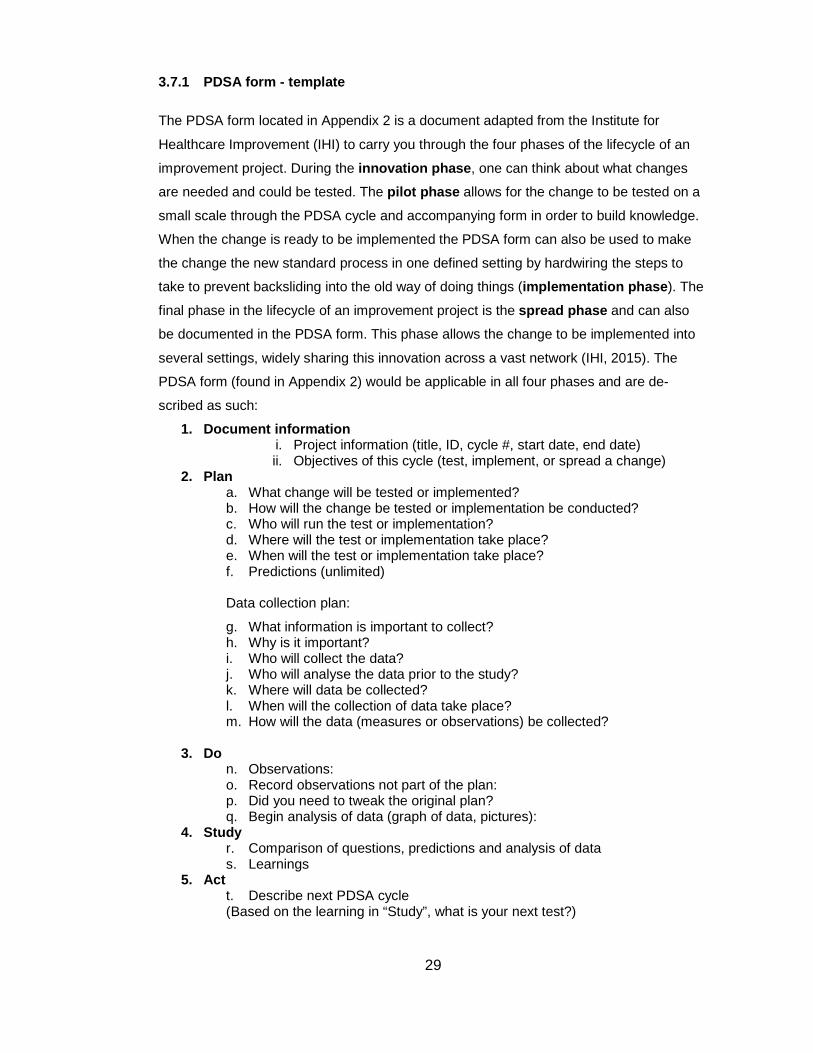
3.7.1 PDSA form - template
The PDSA form located in Appendix 2 is a document adapted from the Institute for
Healthcare Improvement (IHI) to carry you through the four phases of the lifecycle of an
improvement project. During the innovation phase , one can think about what changes
are needed and could be tested. The pilot phase allows for the change to be tested on a
small scale through the PDSA cycle and accompanying form in order to build knowledge.
When the change is ready to be implemented the PDSA form can also be used to make
the change the new standard process in one defined setting by hardwiring the steps to
take to prevent backsliding into the old way of doing things (implementation phase ). The
final phase in the lifecycle of an improvement project is the spread phase and can also
be documented in the PDSA form. This phase allows the change to be implemented into
several settings, widely sharing this innovation across a vast network (IHI, 2015). The
PDSA form (found in Appendix 2) would be applicable in all four phases and are de-
scribed as such:
1. Document information i. Project information (title, ID, cycle #, start date, end date) ii. Objectives of this cycle (test, implement, or spread a change)
2. Plan a. What change will be tested or implemented? b. How will the change be tested or implementation be conducted? c. Who will run the test or implementation? d. Where will the test or implementation take place? e. When will the test or implementation take place? f. Predictions (unlimited)
Data collection plan:
g. What information is important to collect? h. Why is it important? i. Who will collect the data? j. Who will analyse the data prior to the study? k. Where will data be collected? l. When will the collection of data take place? m. How will the data (measures or observations) be collected?
3. Do
n. Observations: o. Record observations not part of the plan: p. Did you need to tweak the original plan? q. Begin analysis of data (graph of data, pictures):
4. Study r. Comparison of questions, predictions and analysis of data s. Learnings
5. Act t. Describe next PDSA cycle (Based on the learning in “Study”, what is your next test?)
30
3.8 SoPK & IMF as a scientific tool for study
There is unquestionable doubt that the work done by Dr. Edward Deming and his col-
leagues have had a profound effect on the many quality improvement frameworks alive
today. The foundation of this paper is to use Deming’s system of profound knowledge
(SoPK) described in Chapter 3.1 and the Improvement Model Framework (IMF) de-
scribed in Chapter 3.2 to show how a change was documented and measured in order to
bring about improvement in my organization.
In order to show that the System of Profound knowledge (SoPK) can be used as a scien-
tific tool to implement, measure, and assess a change, seven propositions are pre-
sented to support SoPK as well as present the full cycle of how improvement can be
achieved.
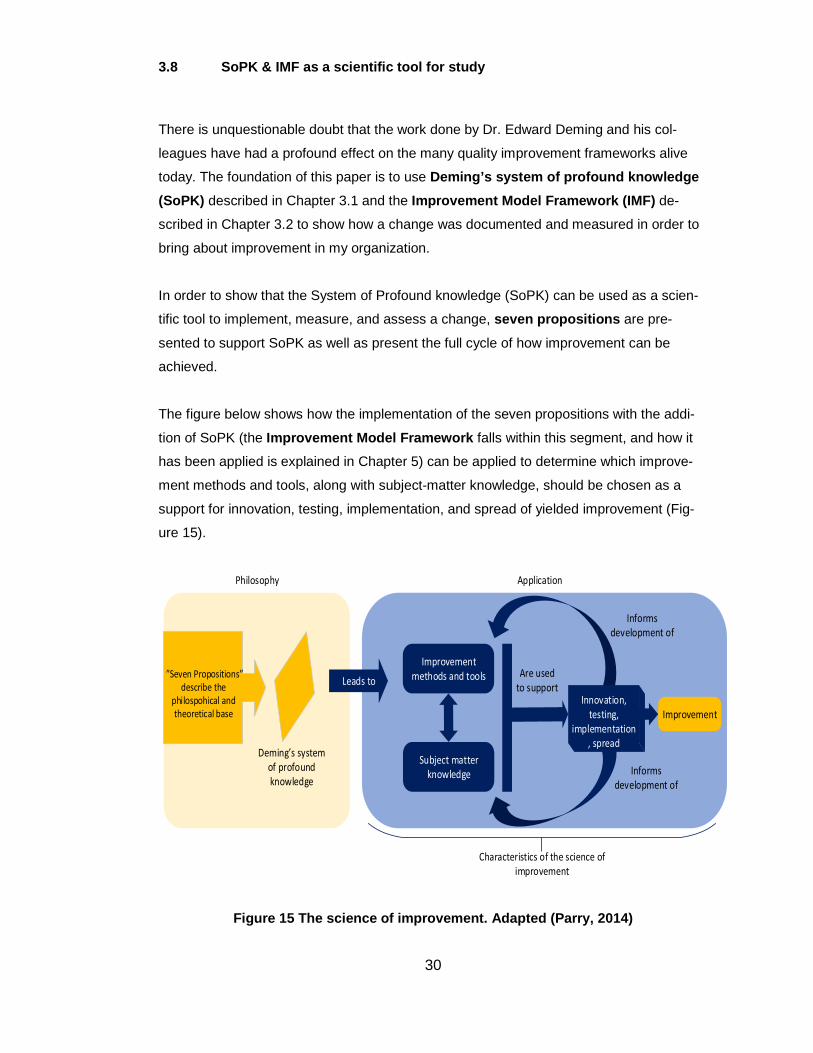
The figure below shows how the implementation of the seven propositions with the addi-
tion of SoPK (the Improvement Model Framework falls within this segment, and how it
has been applied is explained in Chapter 5) can be applied to determine which improve-
ment methods and tools, along with subject-matter knowledge, should be chosen as a
support for innovation, testing, implementation, and spread of yielded improvement (Fig-
ure 15).
”Seven Propositions”
describe the
philospohical and
theoretical base
Deming’s system
of profound
knowledge
Philosophy
Leads to
Improvement
methods and tools
Subject matter
knowledge
Are used
to supportInnovation,
testing,
implementation
, spread
Improvement
Informs
development of
Characteristics of the science of
improvement
Application
Informs
development of
Figure 15 The science of improvement. Adapted (Parr y, 2014)

31
Perla et al., (2013) write that it is the solution matter experts (SMEs) that are the closest to
the problems and hence the most effective due to experience, knowledge and intuition to
framing the change ideas in a scientific and test worthy fashion (Perla, Provost, & Parry,
2013). Effective changes, as stated by Perla et al., must be informed by SMEs -but to be
most effective, these insights must be framed scientifically and tested.
Framing the change ideas suggested by SMEs using a scientific approach in a real world
context is the essence of the science of improvement and will maximize learning about the
ideas. Recognizing that testing ideas is the key to science, one can begin to understand
that the problems encountered in various fields may be different and vary in complexity,
but that all meaningful solutions must pass through a testing and learning phase (Perla et
al., 2013).
3.8.1 Seven propositions supporting SoPK
Perla et al., (2013) discusses seven propositions giving Deming’s System of Profound
Knowledge a scientific foundation. If applied, these propositions could yield stronger im-
provement programs.
3.8.1.3 Testing and learning cycles
The first proposition, The science of improvement is grounded in testing and learning cy-
cles, justifies the use of the Plan-Do-Study-Act (PDSA) cycle which is used in this case
study. In this cycle, a hypothesis is established in the form of a prediction or aim (Plan), an
analysis (Study) is done to determine if the prediction or aim is correct or achievable, and
whether the results are correct or not, it can be brought forward as the basis of the next
PDSA cycle (Act).
3.8.1.4 Conceptualistic proposition
The second proposition, the philosophical foundation of the science of improvement is
conceptualistic pragmatism, emphasized the importance of prior knowledge obtained and
supports the use of the Shewhart control chart methodology to bring about improvement
methods. Perla et.al. (2013) define conceptualism as observations informed by past expe-
riences. The past experiences in turn form the basis for future scenarios (pragmatism) that
may be acted upon. This proposition underlines the importance of allowing these theories
from past experiences to be applied in the form of change concepts in the future.

32
3.8.1.5 Psychology and logic
The third proposition, the science of improvement embraces a combination of psychology
and logic (i.e., a weak form of "psychologim") emphasizes the importance of understand-
ing a problem through different perspectives. Understanding the psychology of change
and the necessity for creativity, innovation and problem solving to champion the improve-
ment movement.
3.8.1.6 Justification and discovery
The science of improvement considers the contexts of justification and discovery, the
fourth proposition, discusses how important it is to keep a balance between being rational
and scientifically based, the "justification" phase of the work, and being creative and dis-
covering, fulfilling the "discovery" phase of the work. Emphasizing one phase over the
other can stifle possible leads to discovery or lose sight of data and measurement. The
PDSA cycle serves as a good medium for this proposition as there is no set way in under-
going a PDSA cycle and the continuity process, in fact, each iteration provides the map for
the next cycle.
3.8.1.7 Operational definitions
The fifth proposition is the science of improvement requires the use of operational defini-
tions stresses the importance of having a common vocabulary for improvers. The aim or
goal of an improvement project may be lost in translation if there is no shared meaning
and understanding of concepts, ideas, goals, and measures. Deming writes in his book,
"Out of the Crisis", the following; "An operational definition puts communicable meaning
into a concept. Adjectives like good, reliable, uniform, round, tired, safe, unsafe, unem-
ployed have no communicable meaning until they are expressed in operational terms, of
sampling, test and criterion. The concept of a definition is ineffable: It cannot be communi-
cated to someone else." (Deming, 2000 as cited in Perla et. al, 2013).
3.8.1.8 Shewhart’s theory of cause systems
The sixth proposition, "The science of improvement employs Shewhart's theory of cause
systems" states that in order to understand variation, one must be familiar with tools that
Shewhart has provided to understand whether a process is stable or not. Shewhart's con-
trol chart can inform an improvement project team on whether the changes that are being
applied is actually leading to an improvement or in fact increasing variation and leading
down a road of poorer performance. Random variation is normal within certain chance-
cause systems and it is important to distinguish between the two.

33
3.8.1.9 Systems theory
The last proposition, Systems theory directly informs the science of improvement is based
on Deming's "Appreciation for a System" where understanding how all the parts fit to-
gether in a process or organization is vital to understand in order to lead improvement.
Appendices 4 and 5 provide cross-functional diagrams on the processes occurring with
the case study project before (Appendix 4) and after (Appendix 5) process changes. Fig-
ure 15 provides a visual description of how the seven propositions when combined can
lead to innovation and improvement of the process.

34
4 Research design
The study design, theoretical framework and data collection are based on case study re-
search. The following will discuss each area and is the foundation for the case study pre-
sented in this thesis.
4.1 Embedded single case design – mixed methods app roach
This study uses case study research which is valuable when there is an unstructured envi-
ronment and the theory base is not robust (Partington, 2002). Within case study research,
an embedded single-case design is the approach taken and focuses on multiple units of
analysis (Honggen, 2010). An embedded single case design uses multiple units of analy-
sis in the course of an enquiry and helps to achieve an in-depth understanding of what is
happening in the study. Yin, (as cited in (Honggen, 2010)) however, cautions against the
potential to shift in focus and/or nature of the study in the process of implementing this
type of study.
It is also important to determine how to implement the inductive and deductive approach.
Inductive enquiry moves from observation to the development of general hypothesis, while
deductive research uses general statements derived from a priori logic to explain particu-
lar instances. Both approaches can be used when doing an empirical research and de-
scribes in the following figure (16) how to conduct empirical research (Partington, 2002)
Figure 16: A systematic approach for empirical rese arch (Partington, 2002)
There is a seven-stage process (described in Figure 16) where one begins by selecting a
theory-building or theory-testing foundation. The empirical research design is selected at
stage 2 and appropriate data collection method(s) to compliment the research design are
determined at stage 3. The research is defined at stage 4 and lastly at stage 5, the data
analysed.
1. Establish the
theoretical foundation
- Theory building
- Theory verification
2. Select a research
design
- Single case study
- Multiple case study
- Panel study
- Focus group
- Survey
3. Select a data
collection method
- Historical archive
analysis
- Participant observation
- Outside observation
- Interviews
- Questionnaires
4. Implementation
- Population selection
- Sample seleection
- Scale development
- Questionnaire construction
- Pilot testing
- Mailing
- Analysis of non-respondent
characteristics
- Data entry
5. Data analysis
35
Feedback loops have been added to interconnect stages 1 to 5 (Partington, 2002). The
units of analysis used in this case study research is the content derived during the im-
provement phase of this project. The content is described to be weekly operational dash-
boards and action lists where the project team, local stakeholders, and the service provid-
ers were present and provided either feedback or issues to topics raised during the ses-
sions.
4.2 Data collection
4.2.1 Semi-structured end user feedback survey
A semi-structured feedback survey was used as well as an analysis of both a closed and
open end user questionnaire of a sample population. This questionnaire was sent in the
form of a webpropol based feedback survey which sought information regarding the win-
dows 7 deployment experience from the perspective of the end user, covering the prepa-
ration phase and the post-deployment phase (Appendix I). The windows 7 deployment
feedback survey was sent in the form of a URL link within an automated Microsoft Outlook
email message and used with an MS SharePoint 2010 developed scheduling tool system.
4.2.2 Data collection from internal project documen tation
Data collection of project documentation consisted of all reports related to the project as
well as the improved documentation containing status updates and action lists.
4.2.3 Reports from external third party vendors
The daily and weekly reports given by the service providers were also collected to meas-
ure and determine benchmarks for this study.

36
5 Applying the Improvement Model Framework
The framework used for this quality improvement project was The Improvement Model
Framework described earlier in Figure 14. By applying The Improvement Model Frame-
work, PDSA forms were completed for each test and implementation of each cycle. An ex-
ample is shown in the next section. By regaining the buy-in of local stakeholders in order
to re-launch Windows 7 deployments, the aims were to reach a target of 2000 deploy-
ments per month, and raise end user satisfaction levels by 5%.
5.1 PDSA form - completed
A PDSA form was completed when running a PDSA cycle, shown in Appendix 3. The first
cycle is logged beginning in September of 2013 and ending in December of 2013. The
change to be tested was the introduction of various actions to get face-to-face time with
local country management to restore buy-in in order to proceed with the Windows 7 de-
ployment project on a large-scale. The change was tested (and later implemented) by re-
structuring the weekly sessions with the local stakeholders/country management and im-
proving the project documentation. The improvement project team leader, which was the
author, monitored the test and later implementation of the change. The change was tested
and implemented in the weekly call session with the local country management, averaging
between 5 and 15 calls per week.
Based on studying feedback from the local stakeholders and end users experiencing diffi-
culties during the deployment of Window 7, various changes to the process were intro-
duces. As these changes were based on studied material, our predictions were as follows:
• Permission from the local country management to rollout in larger numbers will be
given (through incremental increases of pilots)
• Increase in deployment numbers would occur compared to the current level of de-
ployments
• A rise in customer satisfaction would occur when comparing to the current cus-
tomer satisfaction (CSAT) average

37
The data collection plan to be followed included the gathering of the improved documenta-
tion which consisted of the weekly operational dashboard reporting, action points, con-
cerns, and to-do‘s. Also, customer satisfaction surveys were collected via the scheduling
tool along with the service provider’s daily log regarding deployments done that day. The
most important aspect of the data collection was the weekly operation dashboards and ac-
tion lists as that was where the level of trust gained from local country management could
be gauged. The project team leader collected the data. There were also automated sys-
tems that collected the survey results.
The analysis of the data was conducted by the project team leader and the internal solu-
tion matter expert. The system of use to store the data was MS SharePoint 2010 and was
collected on a monthly basis with a final tally in December of 2013. The restructured
weekly sessions and improved documentation allows for the local country management to
focus on concerns that would otherwise not be brought up.
The realignment of resources was not part of the plan and signified a freeze in the data
collection for a period of 3 months. No tweaking was done to the original plan, however
instructions were added in order to train the new recruit of the changes. With the introduc-
tion of the restructured weekly sessions along with the improved documentation, there
was more dialogue with the local country management and allowed for pilots to be under-
taken despite the previous halt in deployments.
After the pilots were performed to the satisfaction of the local country management,
larger-scale rollouts could be performed. With the implementation of the new weekly ses-
sion, if any issues or escalations came up, the stakeholders could address them quickly
and efficiently with the virtually-live presence of the service provider within each weekly
call. As there were more deployments, there was the possibility to distribute more feed-
back surveys.
Though still to be determined, there seemed to be an increase in the satisfaction levels of
the end-users. The next implementation would be to employ a new recruit to apply these
changes to more countries in order to increase deployment numbers and obtain getter
end-user satisfaction results.

38
2013 Jan Mar May Jul Sep Nov Sep 2014
Implementation of second cycle change
(PDSA 2)
Dec 2013
Project end
Scheduling tool freeze -start8/2013
MS SCCM infrastructure replace former technology6/2013
K5 milestone: Permission to rollout
1/2013
6/2013
Planning for process improvement begins
Implementation of first cycle change
(PDSA 1)
July 2013
9/2014
Scheduling tool freeze -end9/2013
Jan
5.2 Project lifecycle timeline
5.2.1 K5 milestone – permission to rollout
The timeline in Figure 17 displays the main events of the project as well as notes where
the PDSA cycles were implement. The timeline of this project covers only the scope of this
study. Hence, though the project began in early of 2012, for the purposes of this paper,
the timeline shows the project lifecycle beginning in January of 2013. As described earlier
(please see case overview in Ch.1.6 for specific dates), the model used in the organiza-
tion provides path which leads a project from an idea through different phases and stages
in the project (K0 – K6). By passing the standardized decision points, gates, the aim is to
ensure that the project fulfils the quality criteria and develops to a profitable business for
the company.
Figure 17 timeline of changes
39
The project reached K5 milestone (permission to rollout) in January of 2013 and during
the summer months, the Microsoft System Centre Configuration Manager (SCCM) client
(terminology found in Ch.1) was implemented as the chosen operating and application
distribution management tool, a replacement to the former Mirage technology that was ini-
tially used. This client allows the control and distribution of the Microsoft Windows 7 image
deployment and all necessary applications onto the user’s machine via a distribution point
(DP) a term from Microsoft to define hub where applications are distributed. This is done
with minimum impact to the network and within the agreed amount of time.
5.2.2 PDSA 1 cycle – testing of new process
Based on studying the people-process , people-people , process-process , and internal-
external multiplicities (see Chapter 1.1.2.2 for descriptions) targets aimed for improve-
ment fell under the following mitigation strategies:
• A gatekeeper was appointed
~ Reorganization of the client and service provider approach by creating a
face to face platform in order to address issues related to the risks found in
the people-people and people-process multiplicities. During the PDSA 1 cy-
cle, the author was appointed to be gatekeeper
• Delegated tasks to local champions
~ Accountability was created. There was immediate awareness of changes
and their potential impact on project outcomes. Adaptation to unique
needs at the local sites was facilitated during the PDSA 1 cycle. Local
country managers/ local stakeholders, took on the role of local champions.
Appendix 5 shows the new process that occurred in the project. By July of 2013 a new ap-
proach in the form of a restructured weekly session and improved documentation was im-
plemented. The development of this approach was based on improving lowered end user
satisfaction due to unsatisfactory deployment experiences as well as the diminished buy-
in from the local stakeholders. The change that occurred in this initial PDSA cycle was to
create the opportunity to involve the local stakeholders, not only with the project team it-
self but with the technical project manager from the side of the service provider as well as
an internal solution matter expert (SME) that had long-standing experience with applica-
tions and OS deployment within the organization. Appendix 5 shows a cross-functional
diagram of the new process tested and implemented between June 2013 and September
2014.

40
Prior to this change user selection and issue resolution was performed centrally and was
represented by the Windows 7 deployment project team and the service provider. Appen-
dix 4 shows a cross-functional diagram of the process prior to any changes. The Win-
dows 7 deployment project team would determine the selected users based on feedback
by the local country stakeholders. This list would be prepared with prerequisites for de-
ployment readiness and the interaction was limited to the project team and the service
provider.
Interaction with the service provider by the either the end user or the local stakeholder
would only occur if there were any issues post-deployment, essentially a phase where it
would be too late to prevent any issues that may have been avoided if there had been in-
teraction with the local stakeholder, and due to his/her in-depth knowledge of the local en-
vironment and the users themselves would have been able to avert the issue.
5.2.3 PDSA 2 cycle – new recruit & more regions
The second PDSA cycle was set into place after implementation of the changes made in
the first cycle were established. The second change came about as an enhancement and
involved creating consistency across all regions as a third mitigation strategy where:
• A centralized resource directory was implemented
~ Consistency was essential when determining which approach would best fit
an emerging requirement. Implementing a centralized resource directory
allowed the ability to correctly allocate resources on short notice across
globally distributed business units based on available competencies. An
additional recruit was hired to help keep the consistency in place in the ad-
ditional regions.
A new recruit came on board to cover more regions in December of 2013 and we were
able to implement the second cycle, PDSA 2 of the improvement project (as seen in Fig-
ure 18). The project member was trained according to the new implementation and given
the restructured operational dashboards and updated documents to proceed with the
rollouts in the specified regions:
Figure 18: Allocation of regions across the projec t team.
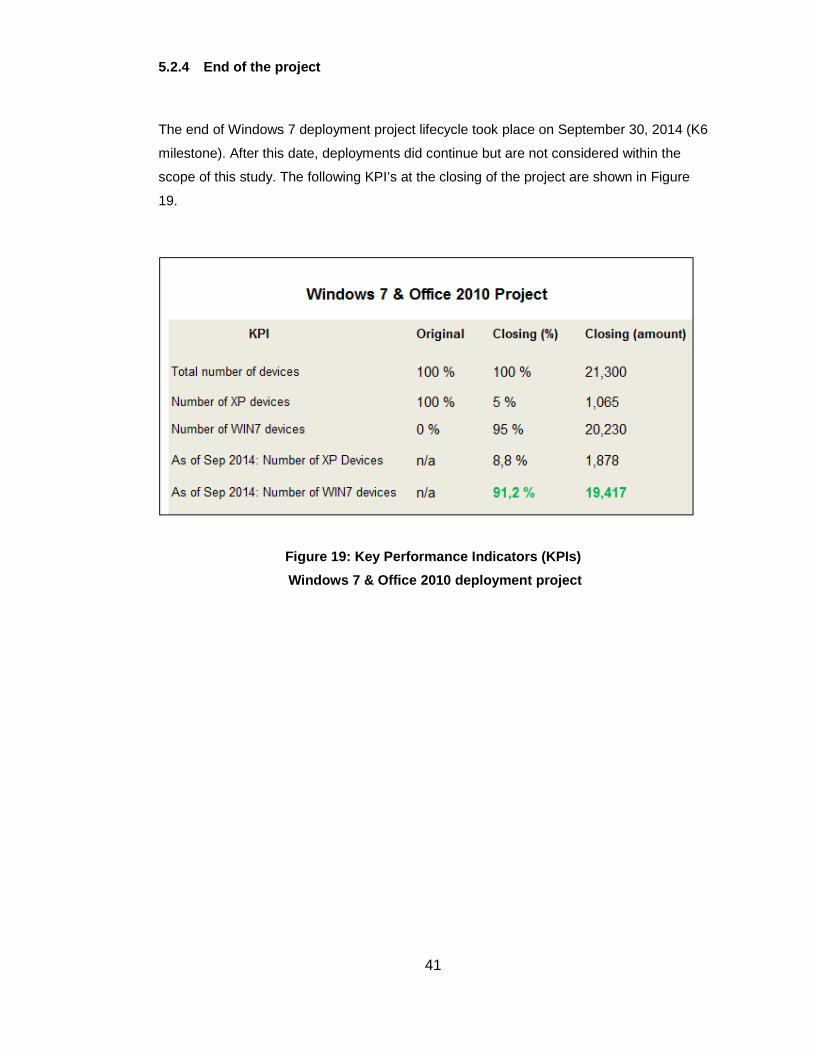
41
5.2.4 End of the project
The end of Windows 7 deployment project lifecycle took place on September 30, 2014 (K6
milestone). After this date, deployments did continue but are not considered within the
scope of this study. The following KPI’s at the closing of the project are shown in Figure
19.
Figure 19: Key Performance Indicators (KPIs)
Windows 7 & Office 2010 deployment project

42
110 223 192123
92
171226
388
511
498
1116
1401
2160
2585
22682198
2063
1564
1180
Baseline Median(Mar-13 - Jul-13)
GOAL: 2000 machines deployed per month
0
250
500
750
1000
1250
1500
1750
2000
2250
2500
2750
Mar-13 Jun-13 Sep-13 Dec-13 Mar-14 Jun-14 Sep-14
MS Win7/ Office 2010 deployments over project lifec yle
Date
Num
ber o
f Mig
ratio
ns
6 Findings from data collection
6.1 Deployments over project lifecycle
In order to make an assessment on the outcome of the test change, a run chart was cre-
ated to plot down windows 7 deployments per month before, during, and after the PDSA
cycles. By annotating these events a clear picture can be achieved to determine whether
any improvement has been made. The aim, or overall goal of this improvement project
was to reach or exceed 2000 deployments per month as stipulated by the initial project
charter at the start of the project’s lifecycle. The planning of the change began in June of
2013 and the first PDSA implementation began in July of 2013. Clearance was given to
resume a full-scale rollout by September of 2013 and the goal of deploying windows 7 to
2000 or more machines per month was set in place to be reached by December of 2013.
Figure 20 Windows 7 deployments over project lifecy cle
6.1.1 Data plotted across 19 months
MS SCCM infra-
structure re-
places former
technology
PDSA 1: Implementation of
new approach in the form of
restructured weekly sessions
and improved documentation
PDSA 2: Addition of new re-
cruit to implement the new
and improved process to more
regions
Project end
Sep-14
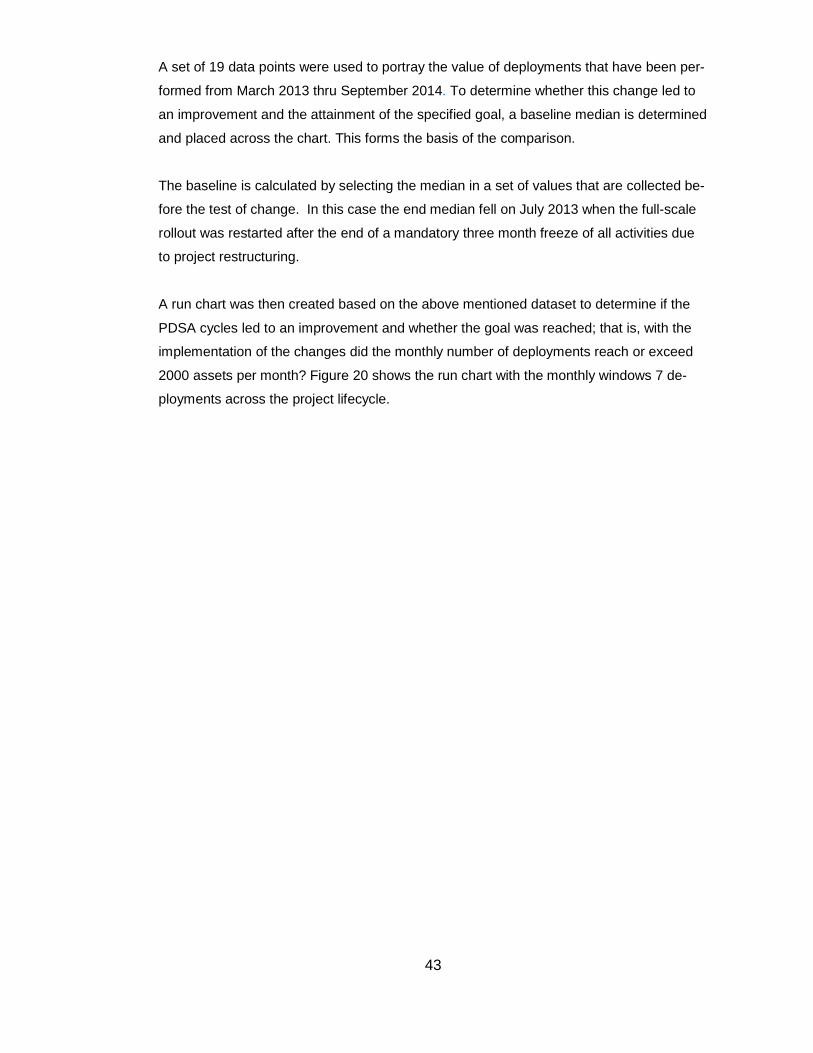
43
A set of 19 data points were used to portray the value of deployments that have been per-
formed from March 2013 thru September 2014. To determine whether this change led to
an improvement and the attainment of the specified goal, a baseline median is determined
and placed across the chart. This forms the basis of the comparison.
The baseline is calculated by selecting the median in a set of values that are collected be-
fore the test of change. In this case the end median fell on July 2013 when the full-scale
rollout was restarted after the end of a mandatory three month freeze of all activities due
to project restructuring.
A run chart was then created based on the above mentioned dataset to determine if the
PDSA cycles led to an improvement and whether the goal was reached; that is, with the
implementation of the changes did the monthly number of deployments reach or exceed
2000 assets per month? Figure 20 shows the run chart with the monthly windows 7 de-
ployments across the project lifecycle.

44
14%
13%
12%
9%
15%
45%
13%
44%
42%
15%
45%
29%
58%
47%
60%
49%
21%
39%
23%
32%
22%
2%
15%
2%
23%
32%
19%
30%
2%
2%
12%
2%
0% 20% 40% 60% 80% 100% 120%
Overall, I am happy about the upgrade to Windows 7 and Office 2010.
I would rather have continued to work with Windows XP.
I knew who to contact in case of any problems during and after the
upgrade.
The upgrade went smoothly and everything worked fine.
I was given enough information about the training possibilities.
I was able to change the date of the upgrade if needed.
I received enough information about the upgrade to Windows 7.
I was notified about my upgrade date in advance.
Deployment feedback survey Feb 2013 - Feb 2014(n=236)
Strongly Agree Agree Disagree Strongly Disagree
6.2 Deployment feedback survey Feb 2013 – Feb 2014
In order to assess how these PDSA changes affected end user satisfaction throughout the
project life cycle, a run chart was created based on the results of the Windows 7 deploy-
ment feedback survey. The survey went through two iterations in order to have a better
understanding on where the need for improvements lay. The first iteration, migration sur-
vey Feb 2013 – Feb 2014 received 236 completed surveys. The second iteration, migra-
tion survey Feb 2014 – Sep 2014, received 608 completed surveys (Figures 21 & 22).
Figure 21: Deployment feedback survey Feb 2013 – Fe b 2014 (n=236)

45
The first iteration of questions were delivered to the user post deployment between the
months of February 2013 thru February 2014 (Figure 21) with 236 respondents. In order
to gauge if the PSDA changes affected the end user satisfaction, the study only focused
on the statement, “Overall, I am happy about the upgrade to Windows 7 and Office
2010”(Q9), as this question was retained in the second iteration of the feedback survey.
In the first iteration 100 respondents out of the 236 surveys chose “Disagree”, or “Strongly
Disagree” to the Q9 statement. In summary, looking at the overall deployment experience,
42% of the total respondents were not happy with the upgrade process to Windows 7 and
office 2010 during this time period.

46
6.3 Deployment feedback survey Feb 2014 – Sep 2014
The second iteration of questions was delivered to the user, post deployment, between
the months of February 2014 thru September 2014. In the second iteration 608 respond-
ents replied to the survey (Figure 22). Regarding the statement, “Overall, I am happy about
the upgrade to Windows 7 and Office 2010”(Q9), 184 respondents marked that they either
“Disagree”, or “Strongly Disagree” with statement Q9. In summary, looking at the overall
deployment experience, 30% of the total respondents were not happy with the upgrade
process to Windows 7 and office 2010 during this time period.
Figure 22: Deployment feedback survey Feb 2014 – Se p 2014 (n=608)
19%
15%
18%
13%
25%
20%
45%
24%
47%
51%
44%
56%
42%
48%
62%
50%
60%
50%
17%
17%
17%
25%
12%
16%
2%
11%
2%
14%
12%
9%
20%
16%
2%
2%
2%
2%
13%
0% 20% 40% 60% 80% 100% 120%
Overall, I am happy about the upgrade to Windows 7 and Office 2010.
I was satisfied with the post migration support I received.
I knew who to contact in case of any problems during and after the
upgrade
I got the applications I need after the upgrade
I was able to use my PC within 4-6 hours from the upgrade.
I was given enough information about the training possibilities.
I was able to change the date of the upgrade if needed.
I received enough information about the upgrade to Windows 7.
I was notified about my upgrade date in advance.
Deploymentfeedback survey Feb 2014 - Sep 2014 (n=608)
Strongly Agree Agree Disagree Strongly Disagree Not applicable
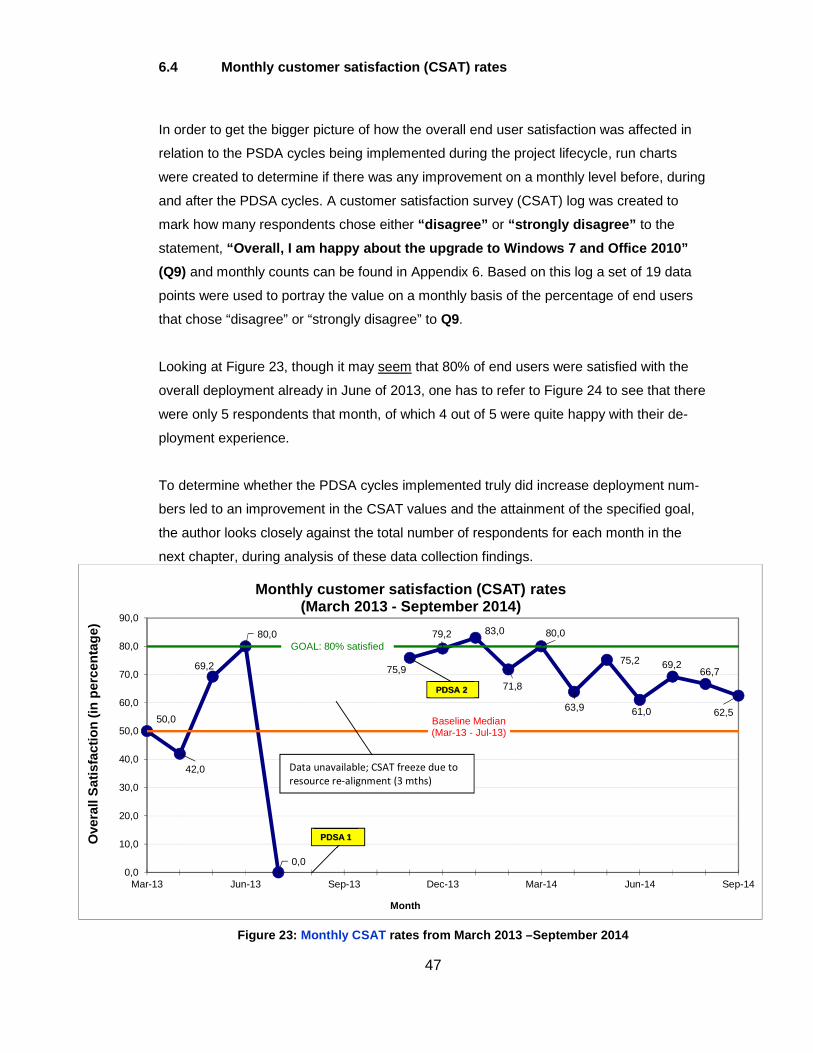
47
6.4 Monthly customer satisfaction (CSAT) rates
In order to get the bigger picture of how the overall end user satisfaction was affected in
relation to the PSDA cycles being implemented during the project lifecycle, run charts
were created to determine if there was any improvement on a monthly level before, during
and after the PDSA cycles. A customer satisfaction survey (CSAT) log was created to
mark how many respondents chose either “disagree” or “strongly disagree” to the
statement, “Overall, I am happy about the upgrade to Windows 7 and Office 2010”
(Q9) and monthly counts can be found in Appendix 6. Based on this log a set of 19 data
points were used to portray the value on a monthly basis of the percentage of end users
that chose “disagree” or “strongly disagree” to Q9.
Looking at Figure 23, though it may seem that 80% of end users were satisfied with the
overall deployment already in June of 2013, one has to refer to Figure 24 to see that there
were only 5 respondents that month, of which 4 out of 5 were quite happy with their de-
ployment experience.
To determine whether the PDSA cycles implemented truly did increase deployment num-
bers led to an improvement in the CSAT values and the attainment of the specified goal,
the author looks closely against the total number of respondents for each month in the
next chapter, during analysis of these data collection findings.
Figure 23: Monthly CSAT rates from March 2013 –September 2014
50,0
42,0
69,2
80,0
0,0
75,9
79,2 83,0
71,8
80,0
63,9
75,2
61,0
69,266,7
62,5Baseline Median (Mar-13 - Jul-13)
GOAL: 80% satisfied
0,0
10,0
20,0
30,0
40,0
50,0
60,0
70,0
80,0
90,0
Mar-13 Jun-13 Sep-13 Dec-13 Mar-14 Jun-14 Sep-14
Monthly customer satisfaction (CSAT) rates (March 2013 - September 2014)
Month
Ove
rall
Sat
isfa
ctio
n (in
per
cent
age)
PDSA 1
PDSA 2
Data unavailable; CSAT freeze due to
resource re-alignment (3 mths)
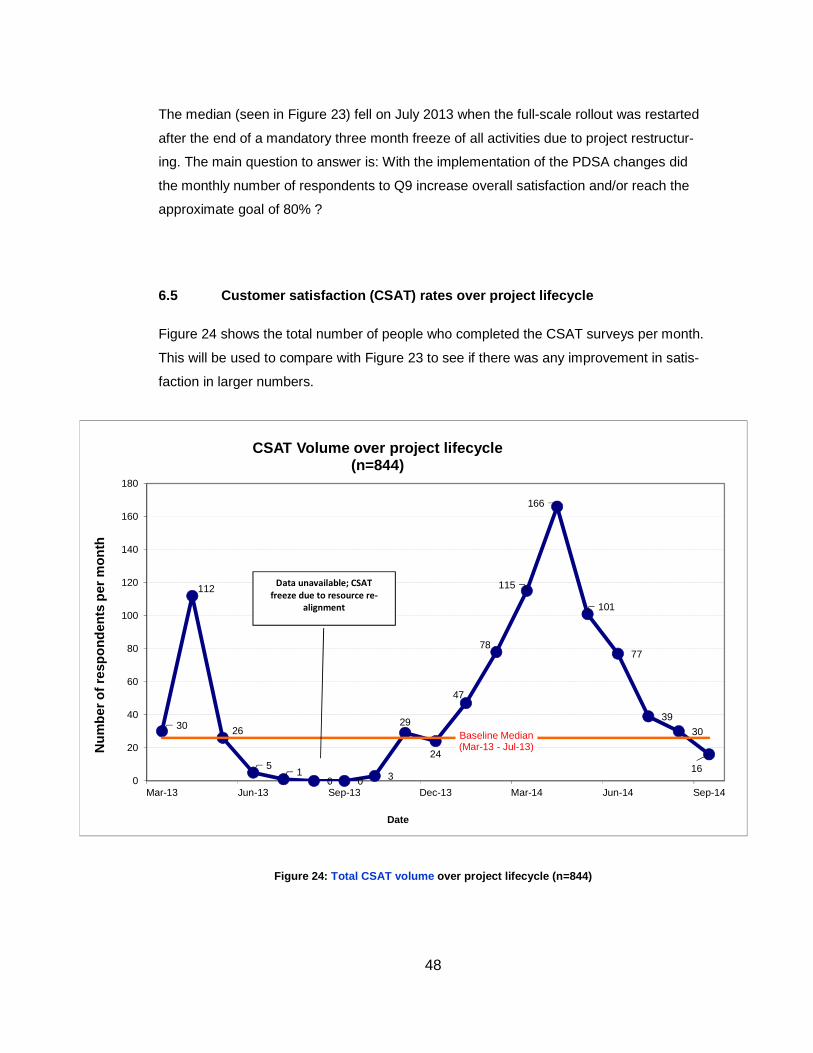
48
30
112
26
51
0 0 3
29
24
47
78
115
166
101
77
39
30
16
Baseline Median (Mar-13 - Jul-13)
0
20
40
60
80
100
120
140
160
180
Mar-13 Jun-13 Sep-13 Dec-13 Mar-14 Jun-14 Sep-14
CSAT Volume over project lifecycle(n=844)
Date
Num
ber o
f res
pond
ents
per
mon
th
The median (seen in Figure 23) fell on July 2013 when the full-scale rollout was restarted
after the end of a mandatory three month freeze of all activities due to project restructur-
ing. The main question to answer is: With the implementation of the PDSA changes did
the monthly number of respondents to Q9 increase overall satisfaction and/or reach the
approximate goal of 80% ?
6.5 Customer satisfaction (CSAT) rates over project lifecycle
Figure 24 shows the total number of people who completed the CSAT surveys per month.
This will be used to compare with Figure 23 to see if there was any improvement in satis-
faction in larger numbers.
Figure 24: Total CSAT volume over project lifecycle (n=844)
Data unavailable; CSAT
freeze due to resource re-
alignment

49
7 Analysis
7.1 Types of variation
When conducting a statistical analysis of the results obtained there has to evidence that
the change implemented actually resulted in improvement and was not due to random
events. Figure 25 explains the various types of variation. There is the common cause vari-
ation, or “random” variation in which cause of the change seen is due to normal activities
within the design of the process. Another factor that that can cause a random variation are
regular, natural or ordinary causes. Basically, if the results depicted in the run charts are
found to be normal, predictable, and stable, then there was no improvement and the varia-
tion is deemed to be random. If however, there are non-random events occurring, then
once can assume that there has been an irregular or unnatural cause affecting a part of
the process
Types of variation common cause
(random) variation "special cause"
(nonrandom) variation
Is inherent in the design of the process
Is due to irregular or unnatural causes that are not inherent in the design of the process
Is due to regular, natural or ordinary causes
Affect some, but not necessarily all aspects of the process
Affects all the outcomes of a pro-cess Results in an "unstable" process that
is not predictable
Results in a "stable" process that is predictable
Also known as non-random or assign-able variation
Also known as random or unassign-able variation
Figure 25: Types of variation (Lloyd, 2004)

50
7.2 Identifying non-random patterns
An analysis on the findings gathered in Chapter 6 can be accomplished through the use of
run charts. A run chart is an effective tool to determine if improvement has been made
over time by displaying all data points gathered during the improvement project. There are
four rules used to interpret the run chart. If any of the following four rules apply then there
is evidence of non-random patterns in the data. Confirmation can be made that the results
produced are in fact the direct outcome of the changes that have been implemented in the
process improvement project. The four rules are as follows (Figure 26):
Rules for interpretation
Rule 1: A shift in the process is indicated by 6 or more consecutive points above or below the
median.
Rule 2: A trend is indicated by 5 or more consecutive points all increasing or decreasing.
Rule 3: Too many or too few runs indicate a non-random pattern.
Rule 4: An “astronomical” data point indicates a non-random pattern.
Figure 26: Identifying non-random patterns (Provost & Murray, 2007)
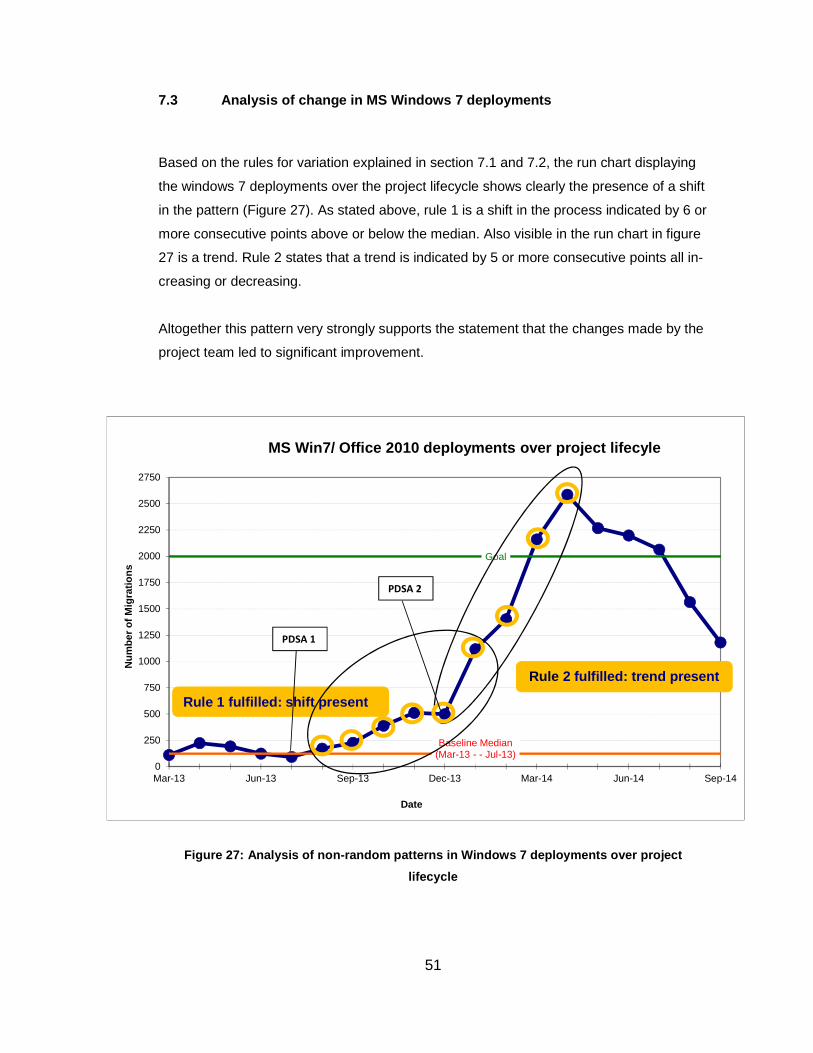
51
7.3 Analysis of change in MS Windows 7 deployments
Based on the rules for variation explained in section 7.1 and 7.2, the run chart displaying
the windows 7 deployments over the project lifecycle shows clearly the presence of a shift
in the pattern (Figure 27). As stated above, rule 1 is a shift in the process indicated by 6 or
more consecutive points above or below the median. Also visible in the run chart in figure
27 is a trend. Rule 2 states that a trend is indicated by 5 or more consecutive points all in-
creasing or decreasing.
Altogether this pattern very strongly supports the statement that the changes made by the
project team led to significant improvement.
Figure 27: Analysis of non-random patterns in Windo ws 7 deployments over project
lifecycle
Baseline Median(Mar-13 - - Jul-13)
Goal
0
250
500
750
1000
1250
1500
1750
2000
2250
2500
2750
Mar-13 Jun-13 Sep-13 Dec-13 Mar-14 Jun-14 Sep-14
MS Win7/ Office 2010 deployments over project lifec yle
Date
Num
ber o
f Mig
ratio
ns
Rule 1 fulfilled: shift present
Rule 2 fulfilled: trend present
PDSA 1
PDSA 2

52
7.4 Analysis of change in CSAT survey Question 9
Based on the rules for variation explained in section 7.1 and 7.2, the run chart displaying
the monthly customer satisfaction rates over the project lifecycle shows clearly the pres-
ence of a shift in the pattern. As stated above, rule 1 is a shift in the process indicated by
6 or more consecutive points above or below the median. This pattern very much supports
the statement that the changes made by the project team led to improvement, despite the
variation of monthly CSAT results.
At the height of the deployments (seen in Figure 24) CSAT respondents maintained an
average above the median and even reached the 80% satisfaction rate or surpassed it.
This indicates a clear improvement from the initial 50% satisfaction rate in March of 2013,
as seen in the graph below.
Figure 28: Analysis of improvement in CSAT survey ( March 2013 – September 2014)
Baseline Median (Mar-13 - Jul-13)
Goal: 80% satisfied
0,0
10,0
20,0
30,0
40,0
50,0
60,0
70,0
80,0
90,0
Mar-13 Jun-13 Sep-13 Dec-13 Mar-14 Jun-14 Sep-14
Monthly customer satisfaction (CSAT) rates (March 2013 - September 2014)
Month
Ave
rage
sur
vey
perc
enta
ge (o
ut o
f 100
)
Data unavailable; CSAT freeze due to
resource re-alignment
Rule 1 fulfilled: shift present
53
8 Conclusions
The improvement changes implemented in the Windows 7 deployment project have
shown to be effective in reaching the goals set out in the initial stage of this improvement
project.
8.1 Conclusion of results
The results obtained in this improvement project meet the goals initially posted in this
study. The first objective was to achieve 2000 or more deployments per month. This goal
was achieved and even surpassed in the months of March and April of 2014.
The second objective was to increase the satisfaction levels of end users responding to
the feedback survey by at least 5%. By referring to Figure 28, one can see that the satis-
faction levels are quite near each other. As stated in the statistical rules described above,
Figure 28 does show a clear upward shift near the 80% satisfaction rate, which shows
clear improvement in this area as well. However, more cycles could be run to really under-
stand why the variations have occurred so frequently.
8.2 Personal evaluation
Perhaps the most rewarding aspect of this study was to witness the improvement unfold
through the application of relatively straightforward changes. Despite the immensity of the
project, basic principles were applied and within a matter of months, a grim outlook turned
into a bright one. By putting the focus on managing the interaction between the service
providers and stakeholders with the utilization of a gatekeeper and allocating tasks to lo-
cal champions , creating accountability, the overarching business goals were aligned and
allowed for a balanced and progressive move forward.
In addition, by implementing a centralized resource directory , both the concerns of the
business and technical risks posed by the service providers were presented in a collabo-
rative manner. Using consistent documentation within a standard location allowed for
members in the weekly sessions to rescope the IT requirements originally put forth to fit
into the specific environments in question.

54
9 Discussion and further development
The author hopes that through the implementation of quality improvement initiatives in an
IT project, the organization can further develop this study by applying these techniques to
other IT projects currently being rolled out in the organization. The aim of quality improve-
ment in products and processes is never-ending, and this is a good start to apply the les-
sons learned from this process improvement project onto the next iteration.
Applying the Improvement Model Framework did not require many months of planning.
Once a decision was made on where the pain points were, changes proposed were tested
relatively quickly. The tools given to implement a quality improvement project allows for
quick feedback through measurements done on whether the change put into effect is
worth pursuing or should be replaced by another option. The PDSA cycle allows continual
improvement based on past performance.
Any member of the organization can perform a quality improvement initiative by applying
the tools described in this study. Most importantly is the organization’s commitment from
the senior level management to promote quality initiatives throughout the organization. As
Shaffie & Shabbaz (2012) write in their book, “”Lean Six Sigma”, no methodology (or
framework) has staying power if there is no foundation and consensus on being commit-
ted to continuous improvements throughout the whole organization.
55
10 References
References
Anthony, S. (2014). Windows XP finally put to sleep by Microsoft – but it will still haunt us for years to come. ExtremeTech. Ziff Davis media.
Retrieved from http://www.extremetech.com/computing/180062-windows-xp-finally-put-to-sleep-by-microsoft-but-it-will-still-haunt-us-for-years-to-come
Accessed May 2015.
Barzilzi-Nahon, K. (2008). Towards a theory of network gatekeeping: A framework for ex-ploring information control. Journal of the American Society for Information Science and Technology, 59(9), 1493-1512.
Bean, J. (2010). SOA and web services interface design: Principles, techniques, and standards. Burlington, MA: Morgan Kaufmann Publisher.
Cadle, J., & Yeates, D. (2008). Project management for information systems. London: Pearson Education Limited.
Dawidson, O., Karlsson, M., & Trygg, L. (2004). Complexity perception - model develop-ment and analysis of two technical platform projects in the mobile phones industry. Inter-national Journal of Information Technology & Decision Making, 3(3), 493-512.
Deming Institute. (2015). the system of profound knowledge.
Retrieved from https://deming.org/theman/theories/profound knowledge
Accessed May 2015
Ferguston, T. (2010). Windows 7 now fastest-selling windows OS. ZDnet.
Retrieved from http://www.zdnet.com/article/windows-7-now-fastest-selling-windows-os/
Accessed May 2015
Gardner. (2009). Virtualization journal: HP gets real on client virtualization.
Retrieved from http://virtualization.sys-con.com/
Accessed May 2015
History of Quality. (2014). Retrieved from http://asq.org/learn-about-quality/history-of-qual-ity/overview/overview.html
Accessed May 2015.
56
Honggen, X. (2010). In Mills A., Durepos G. and Wiebe E. (Eds.), Encyclopedia of case study research. Single-case designs. Thousand Oaks: SAGE Publications, Inc.
IHI. (2015). Institute for healthcare improvement. Retrieved from http://www.ihi.org/Pages/default.aspx
Accessed May 2015.
Infosecurity, R. E. (2013). Microsoft warns of permanent zero-day exploits for windows XP. Infosecurity. Reed exhibitions. Retrieved from http://www.infosecurity-maga-zine.com/news/microsoft-warns-of-permanent-zero-day-exploits/
Accessed May 2015.
Kirk, J. (2006). Analyst: No effect from tardy XP service pack. IT world. Retrieved from http://web.archive.org/web/20070317204906/http://www.it-world.com/Comp/4063/060118xpsp3/pfindex.html
Accessed May 2015.
Kotlarsky, J., Oshri, I., van Hillegersberg, J., & Kumar, K. (2007). Globally distributed com-ponent-based software development: An exploratory study of knowledge management and work division. Journal of Information Technology, 22(2), 161-173.
Langley, G. L., Moen, R. D., Nolan, K. M., Nolan, T. W., Norman, C. L., & Provost, L. P. (2009). The improvement guide. Jossey-Bass.
Lee, O. -. D., Banerjee, P., Lim, K. H., Kumar, K., van Hillegersberg, J., & Wei, K. K. (2006). Aligning IT components to achieve agility in globally distributed system develop-ment. Communications of the ACM, 49(10), 49-54.
Lee, O. -. D., Blake, R., & Baby, D. V. (2015). A framework of risk in global IT projects and mitigation strategies from service-oriented architecture. Modern Techniques for Success-ful IT Project Management. 200.
Lloyd, R. (2004). Quality health care: A guide to developing and using indicators. Sudbury, MA: Jones and Bartlett Publishers.
McDermott, P., & Sharp, A. (2008). Workflow modeling: Tools for process improvement and application development (2nd ed.) Artech House, Incorporated.
57
Microsoft. (2014). Enterprise customers, support for windows XP has ended. Retrieved from https://www.microsoft.com/en-us/windows/enterprise/end-of-support.aspx
Accessed May 2015.
Mohtashami, M., Marlowe, T., Kirova, V., & Deek, F. P. (2006). Risk management for col-laborative software development. IT Project Management, 4, 20-30.
NetMarketshare. (2015). Desktop operating system market share April 2015. Net applica-tions.com. Retrieved from http://www.netmarketshare.com/operating-system-market-share.aspx?qprid=10&qpcustomd=0
Accessed May 2015
North, J. (2010). The total economic Impacttm of Windows 7. Multi company case study prepared for Microsoft. Forrester Research. Accessed May 2015.
Parry, G. (2014). A brief history of quality improvement. Journal of Oncology Practice, 10(3), 196-199.
Partington, D. (2002). In Partington D., Harrison A. (Eds.), Essential skills for management research. Thousand Oaks: SAGE Publications Ltd.
Perla, R., Provost, L., & Parry, G. (2013). Seven propositions of the science of improve-ment: Exploring foundations. Q Manage Health Care, 22(3), 170-186.
Persson, J. S., Mathiassen, L., Boeg, J., Madsen, T. S., & Steinson, F. (2009). Managing risks in distributed software projects: An integrative framework. IEEE Transactions on En-gineering Management, 56(3), 508–532.
Powell, A., Piccoli, G., & Ives, B. (2004). Virtual teams: A review of current literature and directions for future research. ACM SIGMIS Database, 35(1), 6-36.
Provost, L., & Murray, S. (2007). The data guide. Austin, Texas:
Rajavelu, A., Eylon, G., & Duncan, S. (2010). Rapid deployment of Microsoft windows 7* across a large enterprise. Intel IT. IT best practices. Enterprise security and employee productivity. IT@Intel White Paper. May 2015.
58
Satyanarayana, P., White, M., & Hough, J. (2002). Juxtaposition of Chester I. bar nard and Frederick Taylor: Forerunners of management. Management Decision, 40(10), 1003-1012.
Shaffie, S., & Shabbaz, S. (2012). Lean six sigma (1st ed.) McGraw-Hill.
Shaw, K. A. (2013). Integrated management of processes and information Business Ex-pert Press.
StatCounter, G. S. (2015). StatCounter global stats. Top 7 desktop OSs from 2011 to 2014. Retrieved from http://gs.statcounter.com/#desktop-os-ww-yearly-2011-2014
Accessed May 2015.
TechRadar, F. P. (2014). Windows XP end-of-life. Thanks for all the fish! Retrieved from http://www.techradar.com/news/software/operating-systems/windows-xp-end-of-life-what-you-need-to-know-1240791
Accessed May 2015.
Thurrott, P. (2010). Windows 7: 150 copies sold. WindowsITPro. Retrieved from http://win-dowsitpro.com/windows/windows-7-150-million-copies-sold
Accessed May 2015.
Voss, P. (2012). Windows XP and office 2003 countdown to end of support, and the April 2012 bulletins. Retrieved from http://blogs.technet.com/b/msrc/archive/2012/04/10/win-dows-xp-and-office-2003-countdown-to-end-of-support-and-the-april-2012-bulletins.aspx
Accessed May 2015.
Warren, T. (2012). Windows 7 hits 630 million licenses sold, now running on 50 percent of enterprise desktops. The verge. Retrieved from http://www.thev-erge.com/2012/7/9/3146777/windows-7-630-million-licenses-sold-enterprise-adoption
Accessed May 2015.
Yong, J., & Wilkinson, A. (2002). The long and winding road: The evolution of quality man-agement. Total Quality Management, 13(1).
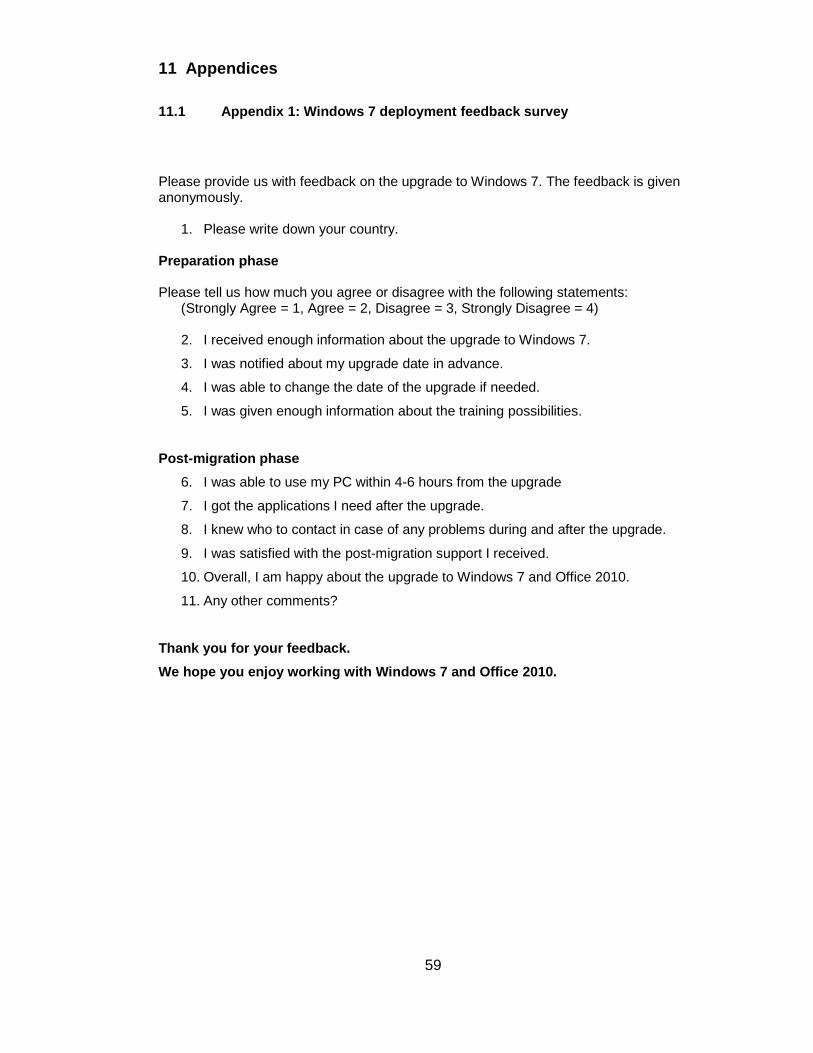
59
11 Appendices
11.1 Appendix 1: Windows 7 deployment feedback surv ey
Please provide us with feedback on the upgrade to Windows 7. The feedback is given anonymously.
1. Please write down your country. Preparation phase Please tell us how much you agree or disagree with the following statements:
(Strongly Agree = 1, Agree = 2, Disagree = 3, Strongly Disagree = 4)
2. I received enough information about the upgrade to Windows 7.
3. I was notified about my upgrade date in advance.
4. I was able to change the date of the upgrade if needed.
5. I was given enough information about the training possibilities.
Post-migration phase
6. I was able to use my PC within 4-6 hours from the upgrade
7. I got the applications I need after the upgrade.
8. I knew who to contact in case of any problems during and after the upgrade.
9. I was satisfied with the post-migration support I received.
10. Overall, I am happy about the upgrade to Windows 7 and Office 2010.
11. Any other comments?
Thank you for your feedback.
We hope you enjoy working with Windows 7 and Office 2010.
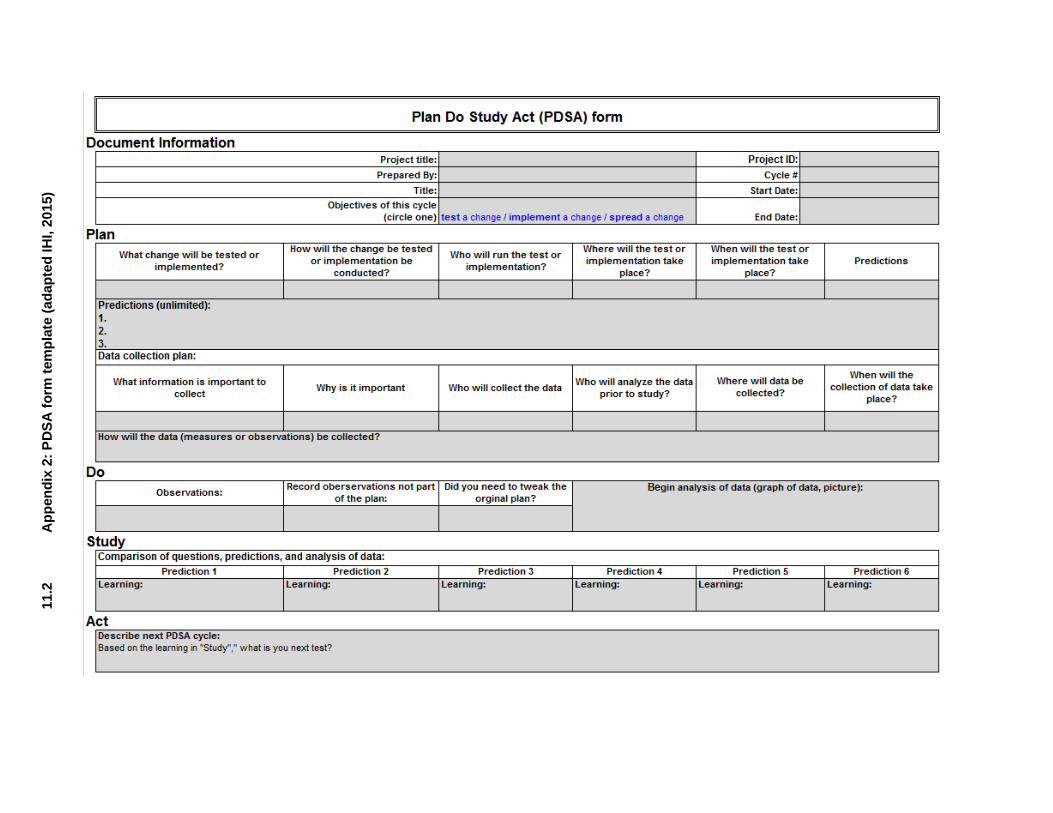
11.2 Appendix 2: PDSA Form template
Form 1: The PDSA form (adapted from (IHI, 2015))
11.2
App
endi
x 2:
PD
SA
form
tem
plat
e (a
dap
ted
IHI,
2015
))13
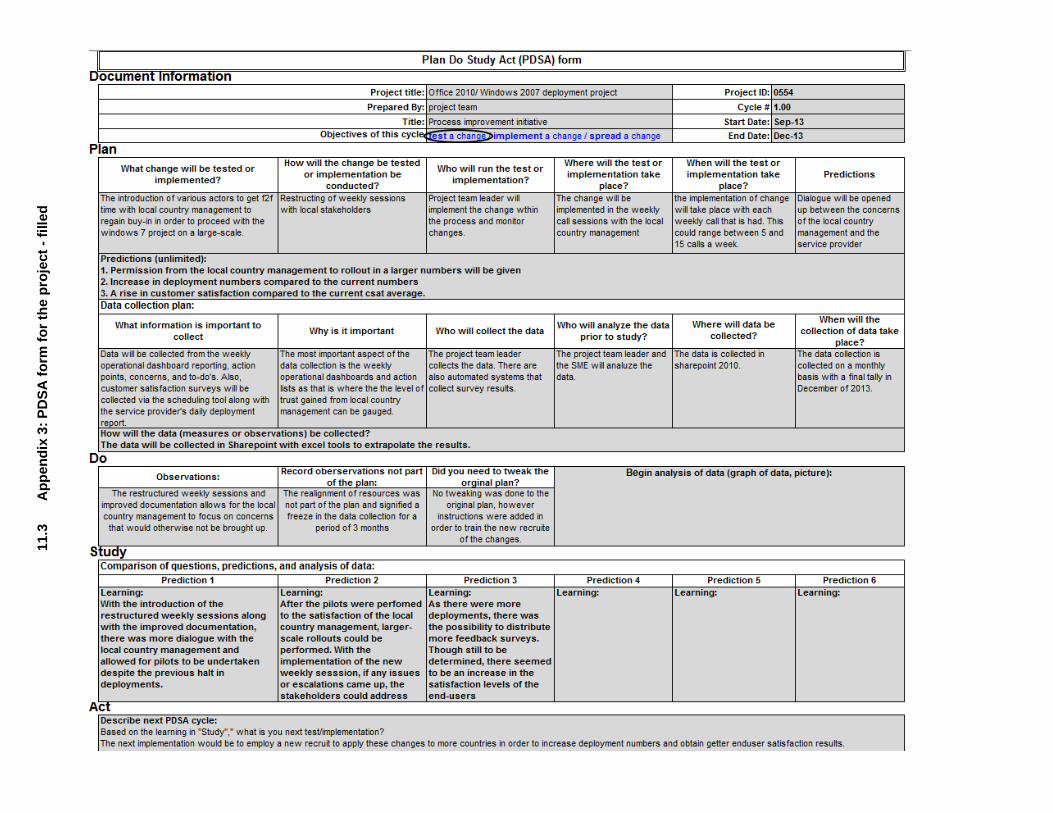
11.3 Appendix 3: PDSA form for the project - filled
Form 2: The PDSA form completed (adapted from (IHI, 2015))
11.3
App
endi
x 3:
PD
SA
form
for
the
proj
ect -
fill
ed 0
13

11.4 Appendix 4: Windows 7 migration cross function al diagram (10/2012 – 6/2013)
11.4
A
ppen
dix
4: W
indo
ws
7 m
igra
tion
cros
s fu
nctio
nal d
iagr
am (
Oct
ober
201
2 –
June
Windows 7 Migration cross-functional diagram (October 2012 – June 2013)
Final User List
Users have been confirmed
Applications have been confirmed
service provider pre-reqs are
complete
(ID ready for push)
Windows 7 Migration
Scheduling Tool
XP User
Scheduling Tool
sends first
Migration Message
to user for
confirmation/
rescheduling/
cancellation
Windows 7 Migration
Scheduling Tool
All stipulated
scheduling
parameters are
followed for each user
Confirm
Reschedule
Cancel
Mirage Tool
Service provider
instigates on the
Mirage Manager the
migration
XP User
1 Day prior reminder message sent to User
MS SCCM
Application
Database
Windows 7 Migration Post-Migration Applications Delivered
Post Migration Feedback Survey sent to User
Cancel proposed date
Change proposed date
Project follows up
with Country
Coordinator and User
Daily Migration Report
Service provider is
notified of asset to be
migrated
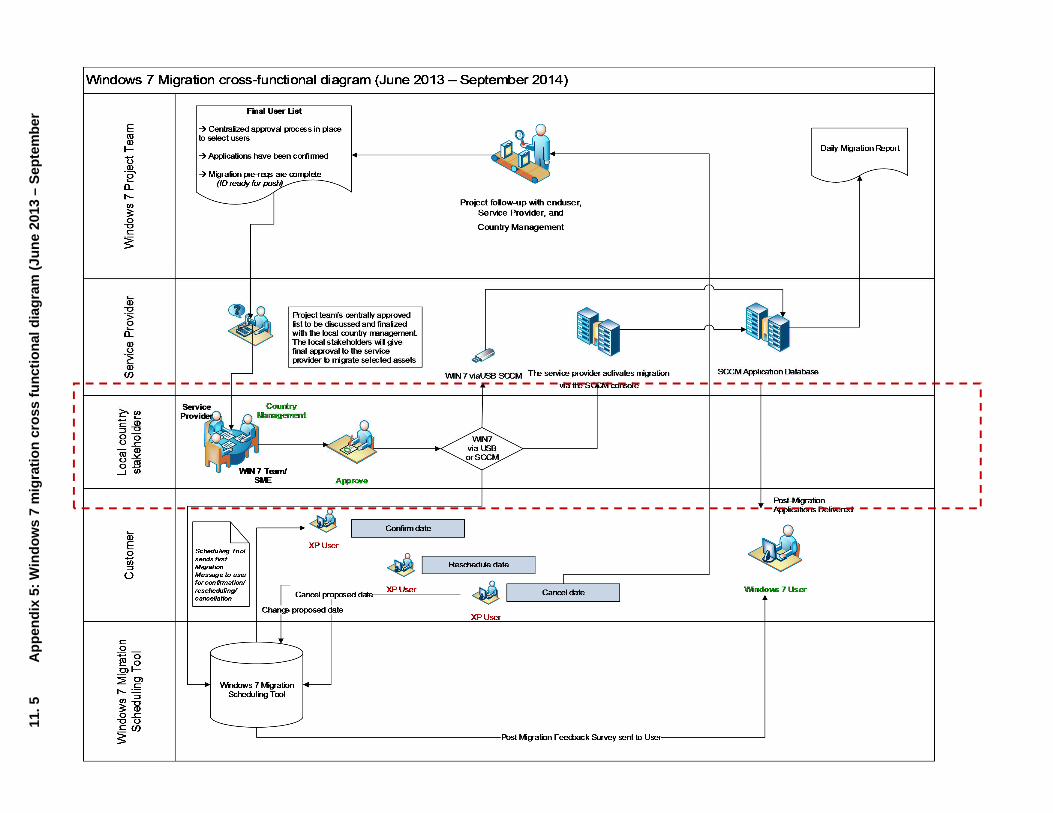
11.5 Appendix 5: Windows 7 migration cross function al diagram (6/2013 – 9/2014)
11. 5
A
ppen
dix
5: W
indo
ws
7 m
igra
tion
cros
s fu
nctio
nal d
iagr
am (
June
201
3 –
Sep
tem
ber

11.6 Appendix 6: CSAT log March 2013 – September 20 14