Embed Size (px)
Citation preview

Abstract
Contemporary research has been examining potential links existing among
sensory, motor and attentional systems. Previous studies using TMS have shown that the
abrupt onset of sounds can both capture attention and modulate motor cortex excitability,
which may reflect the potential need for a behavioral response to the attended event.
TMS, however, only quantifies motor cortex excitability immediately following the
deliverance of a TMS pulse. Therefore, the temporal development of how the motor
cortex is modulated by sounds can’t be quantified using TMS. Thus, the purpose of the
present study is to use time frequency analysis of EEG to identify the time course of
cortical mechanisms underlying increased motor cortex excitability after sound onset.
Subjects sat in a sound attenuated booth with their hands outstretched at 45-degree angles
while frequency modulated sounds were intermittently presented from a speaker either in
the left and right hemispace. Our results indicated a transient reduction in EEG power
from 18-24 Hz (300-600 ms latency) and then a long lasting increase in EEG power that
began at ~800 ms and continued until at least 1.7 sec. The latency of EEG power
changes was shorter for sounds presented from the right speaker at both time periods.
When sounds were presented from the right speaker the contralateral hemisphere over
motor regions also showed greater power increases after 800 ms relative to the ipsilateral
hemisphere. In addition, power increases were greater in the left-handed subjects (8-12
Hz). Results showed that sounds increased EEG power at the time of a previously
observed increase in motor cortex excitability. Findings also suggest an increased
attentional salience to the right hemispace in neurologically normal subjects and
asymmetrical hemispheric activations in right and left-handers.

©Copyright by Xavier N. Readus, 2013
All Rights Reserved
ii
Acknowledgments
I would like to thank Dr. Edward J. Golob, Ph.D., for his direction in project
design and his continued support and assistance in completing this research.
I would also like to thank Dr. Jeffrey Mock, Ph.D., for his guidance and
assistance.
iii
Table of Contents
ACKNOWLEGDEMENTS……………………………………………...ii
LIST OF TABLES……………………………….………………………..iv
LIST OF FIGURES………………………………….…………………….v
Chapter
1. INTRODUCTION……………………………………………….1
2. HYPOTHESES/GOALS……………………………….………20
3. METHODS………………………………………..…………….22
4. RESULTS………………………………….……………………27
5. DISCUSSION………………………..………………………….39
Appendix
1. FIGURES...…………………………………………………………48
2. REFERENCES……………………………………………………..58

iv
LIST OF TABLES
TABLE 1: Inclusion & Exclusion Factors….…………………………...48
TABLE 2: Overview of Significant Results….………………………….57
v
LIST OF FIGURES
FIGURE 1: Design Schematic………………………………..…………..49
FIGURE 2: Average Plot of ERP and ERSP Data...……………………50
FIGURE 3: ERSP Amplitude…………………………………………….51
FIGURE 4: Lower Beta ERSP Amplitude………………………………52
FIGURE 5: Electrode Site ERSP Data……...…………………………...53
FIGURE 6: Electrode Site ERSP Amplitude………………..…………..54
FIGURE 7: Handedness ERSP Data...…………………………………..55
FIGURE 8: Handedness and Power Perturbations Correlation………56
1
Introduction
Sensory systems and Audition
Imagine a bee buzzing in close proximity to your hand. There has to be a
mechanism that transduces and integrates the sensory stimulus from the acoustic buzzing
sound made by the bee to the motor output of a fight-or-flight response, which means you
either swing at the bee or run away from the bee. Therefore, a link exists between
sensory, in this case a sound, and motor systems. This is further evidenced by the fact
that posterior sensory and premotor areas are anatomically connected (Petrides,
Tomaiuolo, Yeterian & Pandya, 2012). The present study aspires to examine some
feature of these auditory motor interactions. Visual properties of objects, such as a bee,
within our personal space can attract the attention of the observer (Makin, Holmes,
Brozzoli, Rossetti & Farnè, 2008). The abrupt onset of sounds, in the above case the
buzzing of the bee, can also orient attention to the source of sound (Serino, Annella &
Avenanti, 2009). The hair cells in the cochlea transduce sound pressure-waves into
neural action potentials, and subsequently convey sound information to the central
nervous system. The primary auditory cortex is the first region in the cerebral cortex to
receive auditory input. The secondary auditory cortex, or the association cortex,
interconnects the primary auditory cortex as well as many other prominent brain regions
and is also implicated in the processing of sound (Ghez & Krakauer, 2000). The primary
auditory cortex is located within the left and right temporal lobe, deep within the lateral
Sylvian fissure on the transverse gyrus of Heschl (Brodmann’s area 41) (Brodmann,
1909). The secondary auditory cortex is housed in the surrounding anatomic regions of
2
the superior temporal gyrus (Brodmann’s area 21, 22, 42 and 52) (Brodmann, 1909;
Celesia, 1976).
The present study examines how auditory stimuli influence the motor cortex.
Auditory stimuli can be described in terms of frequency, intensity, and time. Frequency
is defined as number of cycles in a sound wave per second. Higher frequencies will have
more complete waves than lower frequency sound waves. Generally, frequency
determines pitch; the lower the frequency of the sound wave, the lower the perceived
pitch. Intensity (or amplitude) refers to the amount of energy in the sound wave.
Intensity is translated to changes in the height of the sound wave. Generally speaking,
greater intensity sounds are perceived to be louder than lesser intensity sounds. A change
in a sound feature can attract the attention of a passive listener (Yantis & Jonides, 1990).
Attending to an auditory stimulus molds perception and governs subsequent processing in
the auditory cortex (Welsh, 2011). Auditory input to the central auditory system
originates from both ears. Due to hemispheric asymmetries, the processing of
environmental sounds differs based on the ear the sound enters (Gonzalez & McLennan,
2009). That is, attenuation in priming was observed when environmental sounds were
presented to the left ear, but not when the same sounds were presented to the right ear.
Defining motor systems
The premotor cortex and primary motor cortex are the main components of the
motor system. The goal of this project is to examine how a component of the motor
system is modulated by sounds. The premotor cortex is located in the frontal lobe anterior
to primary motor cortex (M1) in Brodmann’s area 6 (Brodmann, 1909). The premotor
3
cortex is the part of the brain responsible for the preparation and regulation of movement.
The premotor cortex receives information from other cortical regions and based on the
obtained information, determines the appropriate necessary movement. Subsequently,
the premotor cortex conveys the defined information to M1. Next, M1 readies the body
part for the coordinated movement based on the processed information from the premotor
cortex. M1 is located in the posterior portion of the frontal lobe on the precentral gyrus
and on the anterior paracentral lobule in Brodmann’s area 4 (Brodmann, 1909). Like the
somatosensory cortex, M1 is somatotopically organized. Intuitively, when the person
performs the coordinated movement, M1 is highly active. Thus, the premotor cortex
mediates movement preparation, and the M1 has a key role in the actual coordination of
the previously planned movement. M1 is divided into hemispheres. The right hemisphere
controls contralateral movement, meaning movement on the left side of the body, and the
left hemisphere controls movements on the right side of the body (Makin, et al., 2008).
Handedness
Motor cortex physiology is related to handedness (Bernard, Taylor & Seidler,
2011). As will be discussed below assessing the role of handedness in auditory motor
interactions is a major objective of this project. In a study using self-report to measure
handedness in the human populace, results indicated that about ninety percent of the
human population is right-handed, about ten percent is left-handed, and less than one
percent is ambidextrous (Perelle & Ehrman, 1994). The dominant hand is better at
performing fine motor tasks specifically, in executing tasks that require the use of
individual fingers (Barnsley & Rabinovitch, 1970; Fennell, 1986; Johnstone, Galin &
Herron, 1979; Palmer, 1974; Provins & Cunliffe, 1972). A magnetoencephalography
4
(MEG) study suggests that a similar number of pyramidal neurons are active in the
dominant and non-dominant hemisphere, but the neurons are dispersed over a larger area
of motor cortex opposite the preferred hand (Volkmann et al., 1998). Multiple brain
regions have been correlated with handedness (Kertesz, Polk, Black & Howell, 1990;
Steinmetz, 1996; Amunts, et al., 1999; Galaburda, 1980). Additional evidence on the
importance of M1 in handedness is provided by TMS work showing lower threshold in
the dominant M1 for left and right-handed subjects (Triggs, Calvanio, Macdonell, Cros &
Chiappa, 1994). However, other brain regions have been associated with handedness.
For example, hand preference has been associated with neuroanatomical asymmetries in
the precentral gyrus (Amunts et al., 1996; Foundas, Leonard & Heilman, 1995). M1 is
the primary region of the brain activated during individual finger movement (Triggs, et
al., 1994). An fMRI study during a sequential finger movement task found that left-
handers showed less laterality, activating larger volumes and more association cortices
than did right-handers (Solodkin et al., 2001). A subsequent study by the same authors
revealed right-handers had left premotor activation with both left and right hand
movements, which indicates a left hemispheric dominance in motor function; whereas,
left-handers showed activation in the premotor cortex contralateral to the moving hand,
which indicates lack of asymmetry. Motor cortex physiology can be examined using
transcranial magnetic stimulation (TMS) (Mock, et al., 2011; Nikulin et al., 2003).
Transcranial magnetic stimulation (TMS) and motor cortex physiology
Auditory motor interactions have been studied previously employing a TMS
paradigm. TMS is a noninvasive technique that causes depolarization (positive increase
in voltage) or hyperpolarization (negative shift in voltage) in brain regions under the site
5
of stimulation (Rosler, 2001). That is, TMS stimulates neurons to fire action potentials or
inhibits firing of action potentials by bringing cortical neurons away from threshold. A
brief magnetic pulse is delivered to the cortex using a plastic-enclosed copper coil, which
is capable of generating rapidly changing electric currents. Through electromagnetic
induction, a magnetic field perpendicular to the current flow is produced unhampered
through the skin and skull. The magnetic field produces an oppositely directed current
flow in the brain that activates neurons nearby. The shape of the coil determines magnetic
field patterns. Examples include round coil, figure-eight coil, double-cone coil and four-
leaf coil. If neurons in the motor cortex are stimulated using TMS, overt peripheral
muscular movements can be observed. The overt muscular activity observed from single
or paired TMS is termed motor evoked potentials (MEPs). MEPs are quantified by
electromyography (EMG) and have been correlated with corticospinal excitability
(Taylor, Walsh & Eimer, 2008; Rosler, 2001). Hence, the greater the MEP amplitude
elicited by TMS, the greater the corticospinal activity.
Motor cortex excitability in the presence of a sound
Two previous studies used TMS to assess motor cortex excitability as a function
of sound presentation. The first study presented sounds to subjects from near and far
locations (Serino, Annella, & Avenanti, 2009). A TMS pulse was delivered at 50 ms,
100 ms, 200 ms, and 300 ms after the presentation of the sound. The findings suggest
sounds emitted in both locations elicited similar motor cortex excitability but only in the
dominant M1 hemisphere. In another study, Mock et al., (2011) presented sounds
intermittently to subjects while watching a nature video in a similar experimental setup.
A TMS pulse that was delivered 1-second after sound onset assessed motor cortex
6
excitability. The results showed that motor cortex excitability was significantly increased
for the M1 area of the dominant hand as measured by EMG. In contrast, the non-
dominant hand did not show increased excitability relative to baseline. Speakers located
on the same side as the non-dominant hand and speakers located on the opposite side of
dominant hand elicit similar corticospinal arousal (Mock, et al., 2011). Neither speaker
nor sound location influence corticospinal activity (Makin, et al., 2008; Mock, et al.,
2011). In addition, results indicated sounds presented within the space surrounding the
body that can be reached by the hands cause corticospinal excitability only when the
sound is presented to the dominant hand immediately following (Serino, et al., 2009) and
1-second post (Mock, Foundas & Golob, 2011) sound presentation. This could be the
case because the dominant hand should be more primed to action due to better dexterity.
That means brain processing of a sound is dependent on hand dominance (or preference)
and hand closeness to the speaker emitting the sound (Graziano & Cooke, 2006;
Rizzolatti, Fogassi & Gallese, 1997).
Limitations of past research and the present study:
The experimental setup of the two previous studies examining the response of the
motor cortex to sounds had several limitations. Although Mock et al., (2011) studied
both hemispheres, the use of TMS did not allow the measurement of motor cortex
activity in both hemispheres simultaneously or at multiple times after sound onset.
Therefore, a future study should examine both hemispheres simultaneously after
presentation of a sound. Secondly, TMS only collects data on motor cortex activation
immediately following the deliverance of the TMS pulse. This means information about
motor cortex activity is restricted to the point in time when the TMS pulse is delivered.
7
Thus, TMS use makes it difficult to understand the different stages involved in the
processing of the sound in the brain and its influence on the motor cortices and
surrounding motor areas. Hence a future study should use a technique that allows the
assessment of the motor cortex throughout the entire time the sound is modulating the
motor cortex. Consequently, although Serino et al., (2009) and Mock et al., (2011)
results suggesting increased motor cortex activation, the cortical mechanisms producing
the larger MEP amplitudes and increased motor cortex activation cannot be understood
using TMS. Therefore, the present study will address the aforementioned limitations by
employing EEG, ERPs, and time-frequency analysis to assess motor cortex physiology
and it’s response to sounds (Ilmoniemi & Kicic, 2010).
Measures of cerebral cortex activity: EEG
The present study will employ EEG to study auditory motor interactions.
Discussed below is background information on EEG. Scientists have estimated the brain
has one hundred billion brain or nerve cells, which function to maintain the brain’s
electrical potential. Eighty-five percent of cortical neurons are excitatory while the
remaining fifteen percent are inhibitory (Braitenberg & Schüz, 1991). Each neuron has
an electrical charge or polarity, which is regulated by membrane transport proteins
pumping ions across the membrane (Kandel, Schwartz & Jessell, 2000). The membrane
potential is the electrical potential difference between the interior and exterior of the
neuron. Transmembrane ion pumps regulate membrane voltage. If positive ions (e.g.
Na2+, K+, Ca2+) enter or negative ions (e.g. Cl-) leave the interior membrane, intuitively,
the membrane voltage will become more positive, also called depolarization. However,
if negative ions influx or enter into the interior membrane or positive ions depart or efflux
8
from the interior membrane, the membrane voltage will decrease, also termed
hyperpolarization. While at rest, neurons in the brain have a resting voltage of
approximately negative 70 millivolts (mVs) due mainly to the activity of potassium ions.
However, brain cells generate action potentials, which involve a transient, rapid
dissention from the resting membrane potential in a characteristic path of depolarization
and subsequent hyperpolarization (Kandel, Schwartz & Jessell, 2000). In some cases, the
membrane potential is not sufficiently depolarized to trigger the firing of an AP.
Therefore, a “graded” potential is produced, which could bring the neuron closer to its
firing threshold by a depolarization, termed excitatory postsynaptic potentials (EPSP), or
away from the threshold and less likely to fire an action potential or a hyperpolarization,
called inhibitory postsynaptic potential (IPSP).
Defining EEG and EEG use in measuring motor cortex physiology
Although attenuated, electrical potentials due to small currents in the cortex can
be measured on the surface of the scalp. A letter represents each electrode site, each
describing the brain region underlying the electrode (i.e. Fp-Frontopolar; F-Frontal; P-
Parietal; T-Temporal; O-Occipital). The numerical subscript identifies position relative
to the midline. Even and odd numbers represent electrodes on the right side and left side
of the midline, respectively. A z subscripts refers to an electrode positioned on the
midline. Recording of these voltage fluctuations over time is termed
electroencephalography (or EEG). Action potentials are not responsible for the waves
produced in the EEG. Instead EEG mostly reflects graded membrane potentials. Graded
IPSPs and EPSPs last longer than APs and are spread over more disperse surface area,
allowing an increased opportunity for summation (Kandel, Schwartz & Jessell, 2000).
9
However, graded potentials for individual cells are weak, and as such are not readily
measurable by EEG. In order to generate an ample external signal recordable by EEG,
neurons within a volume of tissue must be spatially aligned and must be temporally
synchronized. Of all the neurons in the human brain, the most spatially aligned neuronal
network is the cortical (or pyramidal) neurons of the cerebral cortex, making them well
suited to obtain an externally measurable EEG signal. Thus, cortical neurons contribute
predominately to the amplitude of the EEG. Consequently, motor cortex physiology can
be quantified using EEG (Ilmoniemi & Kicic, 2010). Therefore, synchronous cortical
neurons that receive the same input or output information produce extracellular rhythmic
field potentials that can be measured using scalp EEG electrodes.
EEG measures are often quantified by decomposing the complex EEG waveform
into a set of sine waves of different frequencies. Sine waves are defined by three
characteristics: frequency, magnitude (or amplitude), and phase. The frequency of an
EEG sine wave is measured in Hertz (Hz) and is defined as the number of oscillations or
complete cycles per second (1 Hz equaling 1 cycle per second). There are four
characteristic EEG frequency bands: delta (δ) 0.5-4 Hz, theta (Θ) 4-8 Hz, alpha (α) 8-13
Hz, and beta (β) 13-30 Hz. Magnitude refers to the maximum height of the sine wave’s
peak or the maximal valley, both in regards to the x-axis. Therefore, the amplitude and
frequency of a normal EEG ranges from about -50 uV to +50 uV and 0 Hz to 40 or more
Hz, respectively. The phase refers to the location that specific time points fall within a
cycle, ranging from -180 degrees to +180 degrees or if expressed in radians, -π to +π.
Consequently, EEG is represented as sine waves of different frequencies and phase
angles that overlap in time with respect to sound onset.
10
Volume conduction
The open electric field potentials are propagated throughout the body, decreasing
in strength as distance from the current sources increases. Stronger field potentials,
suggesting stronger neuronal activation, propagate further (Van den Broek, Reinders,
Donderwinkel & Peters, 1998). This propagation is termed volume conduction. Hence,
EEG data contains the summation of the volume conducted neural oscillations. EEG
electrode positioning does not correspond with a specific region of the brain. Current
source may be localized in a particular region; however, due to volume conduction, the
current is spread to many different regions. For example, currents generated in auditory
cortex within the temporal lobes also have substantial current density in frontal and
parietal cortex near the dorsal midline. Thus, it is unwise to assume location of the
electrode cap is measuring changes over the corresponding brain region. However,
volume conductance does have a discernible pattern. Although difficult, differences in
hemispheric activation can help in determining location of regional excitability, despite
volume conductance. Therefore, although EEG is limited in the accuracy in locating
cortical sources, it enables functional coupling to be analyzed across distant cortical areas
with a rather high temporal resolution.
EEG and event-related potentials (ERPs)
One derivative of EEG is event-related potentials (ERPs). ERPs are changes in
the EEG that arise in response to a specific stimulus (e.g. auditory, visual, or
somatosensory) (Wijers, Mulder, Gunter & Smid, 1996). The brain intuitively performs
numerous operations simultaneously. Therefore, the EEG recording reflects many
concordant brain processes. Thus, discriminating the brain’s response to a single event or
11
stimulus of interest is difficult. Normally, the process of obtaining an ERP entails
recording EEG activity time-locked to multiple presentations of similar experimental
events subsequently averaging these traces together. ERP waveforms are comprised of
characteristic positive and negative deflections, termed components. In characterizing
ERP components, the letter N or P is used to define deflection direction, either negative
or positive, respectively. Usually the deflection direction or polarity alternates between N
and P. Immediately following the shift in direction, scientists add conventionally, either
a number that indicates the latency in milliseconds, (or the amount of time passed to see
the shift after the stimulus presentation) or number defining the sequential positioning of
the deflection. More precisely, ERPs are the positive or negative deflections in voltage
recorded by the ongoing EEG observed at the onset of a stimulus and up to 500 ms.
Scientists suspect that ERP production reflects discrete, high-level cognitive processes
(i.e. attention capture, expectation, or mental state changes) that occur in response to a
stimulus. EEG continuously records brain activity. Hence, scientists are able to discern
the effect a stimulus (or any other experimental manipulation) has on specific cognitive
stages even when no behavioral changes are observed. Thus, scientists can objectively
observe the influence a stimulus is having on specific stages in cognitive processing.
Defining characteristic ERPs
Neuroscientists have discovered a large set of auditory ERPs that are elicited from
subjects when sounds are presented. After covering the main auditory ERPs we will then
discuss the impact of attention on the ERPs. The latency of ERPs is believed to provide
information about the time needed to process a stimulus or the amount of time necessary
for brain regions to communicate. However, latencies vary in time relative to the
12
stimulus. In the present study, speakers will deliver auditory stimuli to a subject who is
wearing an electrode cap to record EEG. Hence, certain ERP components are
characteristic of an auditory stimulus. Different cortical responses can result in similar
ERP component labels (i.e. N1 or P2).
The N100 or N1 peaks in adults in the brain region underlying the fronto-central
between 80-120 ms after the stimulus is presented. Albeit elicited by a number of stimuli
other than sound (e.g. visual, heat and pain), the auditory N100, as it is sometimes called,
is sensitive to several features of sound. The main influencing factor is predictability of
the sound; that is, the N100 is weaker when a stimulus is repetitive and stronger when a
stimulus is random. For example, the N100 amplitude is smaller when subjects control
when the sounds are given related to passive listening. Intuitively, warning a subject of
an ensuing sound additionally reduces the N100. Although the Mismatch negativity
(MMN) has similar properties to the N100, the MMN should not be confused with the
N100. The MMN is an evoked potential that appears at a later latency and may be
elicited in the absence of an expected auditory stimulus (Näätänen, Paavilaninen, Rinne
& Alho, 2007). A second ERP component is the P2 or P200 waveform measured at the
scalp. P2 is a positive shift in electrical potential that peaks around 200 ms (varying
between 150 and 275 ms) after the onset of the stimulus. As is the case for all evoked-
response potentials in appropriate paradigms, P2 is observed in the waveform of the EEG
by time-locking data from trials to the start of the stimulus. The P2 component is
distributed over electrodes underlying the centro-frontal and parieto-occipital regions
with a maximal around the vertex of the scalp. Characterizing the P2 is difficult because
it is modulated by a varying number of cognitive tasks. An enhanced P2 component is
13
associated with auditory learning and repeated stimulus exposure (Ben-David et al.,
2011). Changes in P2 amplitude are sometimes seen independent of N1 amplitude
changes, suggesting some degree of independence between the two components (Sato,
Tremblay & Gracco, 2009). However, attention influences P2 and N1 amplitude
concurrently (Anllo-Vento and Hillyard, 1996; Eimer, 1994)
Attention
The auditory motor interactions studied in the present study have been known to
be modulated by attention. Recent evidence suggests that the neuronal characteristics of
selective attention depend on selective neuronal synchronization (Womelsdorf & Fries,
2006). The behavioral advantages of attentional selection are manifold and include
expedited reaction times and processing, higher efficiency rates, enhanced sensitivity to
fine changes, and increased apparent contrast (Womelsdorf & Fries, 2006). The
aforementioned behavioral returns are accomplished by selective neuronal
synchronization within and across cortical regions. First, the attended sensory input is
represented within local neuronal populations, tuning specifically to the attended spatial
or feature characteristics (Reynolds & Chelazzi, 2004; Maunsell & Treue, 2006). Second,
attention regulates the communication among spatially distant neuronal assemblies,
enhancing effective communication with groups that convey behaviorally relevant
information in a ‘top down’ manner (Miller & D’Esposito, 2005). Recent evidence
strongly suggests that the synchronization is important for promoting selective neuronal
communication and attention might be the substrate for such dynamic control of effective
neuronal interactions (Rose & Büchel, 2006; Pesaran, Pezaris, Sahani, Mitra & Andersen
2002). Studies on attention have shown that ERP component accurately reflect the
14
differential processing of attended and unattended information (Wijers, Mulder, Gunter &
Smid, 1996). ERP studies have shown using voluntary attention tasks (e.g. sustained
attention and central cueing paradigms) that stimuli at an attended location elicit enlarged
P1 and/or N1 components at posterior recording sites contralateral to stimulus location
(Anllo-Vento and Hillyard, 1996; Eimer, 1994). This N1/P1 enhancement is associated
with faster reaction times and increased sensitivity to the targets (Eimer, 1994; Anllo-
Vento and Hillyard, 1996).
Defining frequency and amplitude characteristics of EEG
Communication among neuronal assemblies is readily detectable by EEG and
MEG signals. Neuronal networks can display differing states of synchrony, oscillating
at different characteristic frequencies (Pfurtscheller & Lopes da Silva, 1999). The
frequency of brain oscillations is inversely proportional to the amplitude of such
fluctuations, meaning as the amplitude decreases, the frequency of oscillatory activity
increases (Pfurtscheller & Lopes da Silva, 1999). The amplitude (or magnitude) of the
EEG sine wave is defined as the height of the waveform. The synchrony and number of
recruited neural elements determine the amplitude of the EEG waveform (Elul, 1972).
Therefore, as neural synchrony within a network increases, the EEG amplitude increases
and the frequency decreases (Pfurtscheller & Lopes da Silva, 1999b). The amplitude
provides some insight on the number of EPSPs reaching a neural assembly at a certain
point.
EEG time-frequency analysis
15
While ERP analysis of the EEG data provide some indication of the serial or
sequential events occurring in the brain in response to a specific stimulus, an umbrella
term known as time-frequency analysis encompasses numerous methods that allow a
researcher to measure the various components of EEG magnitude and phase
relationships. The present study will utilize EEG time-frequency analysis to assess
auditory motor interactions. The magnitude relationships can be defined in terms of
power and the phase relationships can be defined in terms of synchronization. Therefore,
time-frequency analysis provides additional information about brain frequency in terms
of power and synchronization, respectively. Each frequency apparent in the EEG can be
characterized based on power and synchronization. These changes in power and
synchronization can be recording over time relative to the onset of the stimulus. Hence,
the magnitude of each frequency at a specific time can be quantified in terms of power
and the phases can provide information about the synchronization of the waves with
regard to time and space. Both ERP and time-frequency analysis examine the effect that
a stimulus (in the present study, a sound) has relative to a pre-stimulus baseline. The
main advantage of using time-frequency analysis is the ability to assess the brain’s
parallel processing by assessing the magnitude of the frequency wave (power) and neural
synchronization (based on phase angle assessment) throughout an experiment. That is,
ERPs are EEG response that are time and phase-locked with the onset of the stimulus and
typically last up to 500 milliseconds after stimulus onset. Time-frequency analysis, in
contrast, can assess frequency characteristics throughout the entire recording process
even if they are not phase-locked to the onset of the stimulus.
16
Time-frequency analysis: Event-related Synchronization (ERS) and Event-related
Desynchronization (ERD)
The general assumption is that neuronal assembly dynamics are expressed in at
least two characteristic ways using a time-frequency analysis: (i) amplitude attenuation or
power decrease and (ii) amplitude enhancement or power increase of specific frequency
bands termed event-related desynchronization (ERD) and event-related synchronization
(ERS), respectively. As we will discuss below, ERS and ERS provide information about
the auditory motor cortical interactions occurring after sound onset. ERS is indicative of
cooperation or synchronization among a large number of neurons (Pfurtscheller, Stancak
Jr & Neuper, 1996). Increased cellular excitability in thalamo-cortical systems is
proceeded by a low amplitude EEG desynchronization (Steriade & Llinas, 1988). Thus,
ERD can be understood as an electrophysiological correlate of activated cortical areas
undergoing the processing of sensory or cognitive information or producing a motor
output (Pfurtscheller, 1992). An enhanced ERD is observed when task complexity is
increased, (Dujardin et al., 1993; Boiten et al., 1992) and/or more attention or effort is
given to a task (Defebvre et al., 1996; Neubauer, Freudenthaler & Pfurtscheller, 1995).
The terms ERS and ERD are only suggestive if there exist a meaningful shift in
percentage power relative to a referenced rhythmic baseline measured some seconds prior
to an event. (Pfurtscheller & Lopes da Silva, 1999). When referring to ERD/ERS of the
EEG/MEG, it is necessarily to specify a frequency band. Mathematically, ERD/ERS is
defined according to the expression ERD%=(A-R)/R X 100, in which A represents the
power within the frequency band of interest in the period after the event whereas R
signifies the power of the preceding baseline or reference point (and Pfurtscheller &
17
Lopes da Silva, 1999). ERPs are assumed to represent the responses of cortical neurons
due to changes in afferent activity, while ERS/ERD reflect changes in the activity of the
neurons that control the frequency components of the ongoing EEG.
ERD/ERS in alpha band (8-12 Hz)
There are four characteristic frequency bands: delta (δ) 0.5-4 Hz, theta (Θ) 4-8
Hz, alpha (α) 8-13 Hz, and beta (β) 13-30 Hz. When ERS is not time-locked with
stimulus onset and assemblies of neurons undergo alpha ERS (or display coherent
behavior), an active processing of information is very unlikely and the underlying
corresponding network are in a deactivated state (Pfurtscheller & Lopes da Silva, 1999).
A recent findings suggests rhythmic alpha ERS might actively inhibit effective local
neuronal processing (Thut, Nietzel, Brandt & Pascual-Leone, 2006). Alpha can be
broken down into upper alpha and lower alpha. Lower alpha desynchronization (ranging
from 7-10 Hz) is topographically widespread over the scalp and is usually observed in
almost any type of experimental task. Desynchronization in the lower alpha region
reflects general task demands and attentional processing (Bauer, Oostenveld, Peeters &
Fries, 2006; Palva, Palva & Kaila, 2005). Upper alpha (mu) desynchronization (ranging
from 10-12 Hz), on the other hand, is usually topographically circumscribed to parieto-
occipital areas and develops during the processing of sensory-semantic information
((Klimesch, Schimke & Pfurtscheller, 1993; (Klimesch, Schimke & Schwaiger, 1994).
Voluntary movement induces upper alpha desynchronization topographically restricted
over scalp regions underlying sensorimotor areas (Pfurtscheller & Aranibar, 1979;
Pfurtscheller & Berghold, 1989). This mu desynchronization commences approximately
2 seconds before movement-onset over the contralateral Rolandic region and becomes
18
bilaterally symmetrical immediately before movement execution. Although brisk and
slow movements are quite different, the time course of the contralateral mu
desynchronization is similar (Pfurtscheller, Zalaudek & Neuper, 1998). The dominant
contralateral pre-movement mu ERD is independent of movement duration and is
identical with index finger, thumb, and hand movement. One interpretation of these
findings is that the contralateral pre-movement mu ERD reflects a relatively unspecific
pre-activation, priming or presetting of neurons in motor regions, which is fairly
independent of speed (e.g. brisk vs. slow) and the type of ensuing movement (e.g. wrist
vs. hand).
ERD/ERS in the beta band (12-30 Hz)
Previous studies have specifically linked the beta band to motor function. The
localization of the beta ERD is slightly anterior to the largest mu ERD with regard to
hand and foot movement. Central beta ERD (at least some portion of it) is located in the
pre-Rolandic motor area during movement. Analysis on a single trial basis also revealed
a slightly more anterior focus of the beta rhythm (Pfurtscheller, Flotzinger & Neuper,
1994). MEG measurements revealed the 20-Hz beta rhythm as being located in the
motor cortex and slightly more anterior to the 10-Hz alpha rhythm (Salmelin et al., 1995).
Imaginary right hand movement is accompanied by a contralateral beta ERD and a
corresponding ipsilateral beta ERS, both circumscribed and localized over the hand areas
(Pfurtscheller & Neuper, 1997). Voluntary movement induces lower beta ERD localized
close to sensorimotor areas (Stancak & Pfurtscheller, 1996; Leocani et al., 1997). Similar
to the mu desynchronization noted in response to voluntary movement, the observed
lower beta ERD starts about 2-seconds prior to movement initiation over the contralateral
19
Rolandic region, becoming symmetrical immediately preceding movement execution.
The pre-movement beta ERD was higher for movements performed in sequential order
when compared to a single ballistic movement (Manganotti et al., 1998; Alegre et al.,
2004). A beta ERS is present proceeding mechanical or somatosensory stimulation of the
limbs, even without movement (Pfurtscheller, Krausz & Neuper, 2001; Salenius,
Schnitzler, Salmelin, Jousmaki & Hari, 1997). In patients with neurological disorders,
the ERD is reduced or abolished over the affected hemisphere. In patients with
Parkinson’s disease, the pre-movement ERD is less lateralized over the contralateral
sensorimotor region and commences significantly later than in normal subjects (Magnani
et al., 1998).
EEG measures and the present study
In the present study time-frequency analysis will assess power in frequency bands
between 8-30 Hz for up to 1,700 ms after stimulus onset, with a specific time of interest
at 1,000 ± 200 milliseconds. This time period was chosen because that was the time
period where Mock et al (2011) found increased dominant motor cortex excitability in
response to a sound. Therefore, the full time-course of motor cortex response to sounds
can be assessed so that we might better understand the cortical mechanisms inducing the
greater MEP amplitudes seen in the aforementioned studies. Hence, the present study will
analyze neuronal activity with millisecond precision before, during and several seconds
after sound presentation.
20
Hypotheses/ Goals
Objectives of current study:
Goal: The overall purpose of the present study is to identify cortical mechanisms
associated with the production of larger MEP amplitudes following the presentation of a
sound using ERP and time-frequency analyses.
Objective 1: Compare EEG responses originating in dominant vs. non-dominant cortex in
response to sounds:
Hypothesis: We hypothesize that after the presentation of a sound, beta event-related
desynchronization (ERD) (13-30 Hz) will be observed only for the dominant hemisphere
as evidenced by changes in time-frequency analysis recordings.
The experimental setup of the previous two studies allowed Mock et al, (2011) to
observe the left and right motor cortices and Serino et al., (2009) to study only the left
motor cortex. Although Mock et al., (2011) studied both hemispheres; the use of TMS
did not allow the measurement of motor cortex activity in both hemispheres
simultaneously. Hence, the present study uses EEG, which allows neuronal activity in
both hemispheres to be assessed at the same time. In addition, EEG allows measurement
of cortical activity in regions of the brain surrounding the motor cortex such as the Pre-
frontal cortex (PFC), Premotor cortex, and Supplementary motor areas (SMAs).
Objective 2: Examine the time course of motor cortical responses to sounds, from
several hundred ms to beyond 1-second.
21
Hypothesis: Based on the results by Mock et al., (2011), we hypothesize that reductions
in beta power will occur over dominant hand M1 areas approximately 1-second after the
sound is initially presented.
TMS only collects data on motor cortex activation immediately following the
delivering of the TMS pulse. This means collection of data is restricted a few
milliseconds after the TMS pulse is delivered. Thus, TMS use makes it difficult to
understand the different stages involved in the processing of the sound in the brain and its
influence on the motor cortices and surrounding motor areas. EEG can infer changes in
the brain, several seconds before, during, and several seconds after the sound has been
presented from speaker. In the present study, time-frequency analysis will assess
frequency characteristics throughout the entire recording process, from -500 ms to 1700
ms. Therefore, changes in brain regions as the sound is processed can be recorded,
helping to explain possibly the mechanisms that caused the greater MEP amplitudes seen
in the aforementioned studies.
Objective 3: Compare left vs. right speaker locations for each hemisphere, relate to
dominant vs. non-dominant hemisphere:
Hypothesis: We hypothesize neither speaker (nor sound) location will influence
corticospinal activity (Mock, et al., 2011).
A sound presented within the peripersonal space (PPS), which is the space
surrounding the body reachable by the limbs, can cause increases in corticospinal
excitability as evidenced by the production of a MEP with greater amplitudes
immediately following (Serino, et al., 2009) and 1-second post (Mock, Foundas, Golob,
22
2011) sound presentation. Similar increased MEP amplitudes were seen when sounds
were coming from the left and the right speaker but only if the sound was being emitted
to the dominant hand (Mock, et al., 2011). Neither speaker (nor sound) location
influence corticospinal activity (Makin, et al., 2008; Mock, et al., 2011). This could be
the case because the dominant hand should be more primed to action due to better
dexterity. For example, if I wanted to swing at a bee, I would want to maneuver with my
most adept hand because of the potential dangers that could occur if I miss. That means
brain processing of a sound is dependent on hand dominance (or preference) and hand
closeness to the speaker emitting the sound (Graziano & Cooke, 2006; Rizzolatti,
Fogassi, & Gallese, 1997). Hence, cortical arousal is not controlled by only one variable.
Methods
Participants
A notice was posted on an online research system only accessible to Tulane
affiliates alongside other researcher studies that students could voluntarily participate in
until the desired number of participants was reached. Fifteen participants (8 females and
9 males) affiliated with Tulane University were examined. Subjects were between 18 and
37 years of age (mean 22 years old). Participation was open to all regardless of gender or
minority status. The Edinburgh inventory was administered to assess the handedness of
each participant (see section below for more details). 11 were classified as right-handed
and 6 were identified as left-handed. All subjects had completed high school and had
some form of secondary education. A Maico automated audiometer tested hearing
thresholds (0.5-8 kHz) for pure tones (Maico, Eden Prairie, MN, USA) in addition to

23
ascertaining the disparity in hearing thresholds between ears were <10 dB. All
participants had normal hearing levels. All participants reported no major neurologic or
psychiatric aberrations. Participants gave written consent to participate in the
experiment. All procedures obeyed the protocols outlined by Tulane University
Institutional Review Board, which is in accordance with the Declaration of Helsinki (for
inclusion and exclusion criteria see Table 1). Some participants have received course
credit (alternative methods of course credit were provided).
Experimental Design and Paradigm
Behavioral Tasks
All participants sat in a comfortable chair in an electrically attenuated sound
booth watching a nature video without audio. During the experiment, subjects extended
their arms toward speakers situated at about 45-degree angles ensuring the sound emitted
from the speakers was within the PPS (Figure 1). To ascertain the sound was within the
PPS, the hands of the participant was placed 3 cm from the speakers while pure tones
were intermittently presented from one of the two speakers. Participants were instructed
to minimize eye movements and blinking. In addition, subjects were required to maintain
complete muscle relaxation of the hands during all data acquiring periods. A total of 80
sounds were presented in each block with three total blocks per subject. Each block
consisted of the same sounds; however, the sounds were presented in a different order in
each block. To ensure muscle relaxation, background EMG activity was monitored
during the study. The experimental session lasted 45 minutes. Once the participant was
24
exposed to all three blocks and the pre and post 3-minute assessments, the participant was
given the option to be debriefed orally.
Handedness Quotient
Subjects were administered an inventory, originally developed by Annett and
subsequently modified by Briggs and Nebes, to quantify handedness, footedness, ear
preference, and eye preference. The questionnaire consisted of 15 prompts requiring
participant response by checking one of five boxes ‘always right,’ ‘usually right,’ ‘no
preference,’ ‘usually left,’ and ‘always left.’ One sample query in the handedness section
was the following: “To hold scissors to cut paper.” A subject would respond by selecting
the box that best describes their hand preference for the given task. Scores on the hand
section of the questionnaire ranged from -24 to +24, with positive values indicating a
right-handed preference and negative values a left-handed preference. Participants were
further subdivided into a category of moderately left or right-handed if the score on the
hand section of the questionnaire was ≥ -10 for left-handers and ≥ +10 for right-handers.
Footedness was measured because some research suggests it may be a better predictor of
functional cerebral asymmetries of higher cognitive functions (Elias & Bryden, 1998;
Searleman, 1980). One such question to assess footedness was the following: “Which
foot do you use to kick a ball?” Eye preference was assessed since it has been found to
modulate the influence of handedness on lateralization of non-spatial auditory functions
(Khalfa, Veuillet & Collet, 1998). In addition, ear preference was assessed as it is the
highest correlated with laterality in terms of direction and degree of asymmetry in
dichotic listening tasks (Strauss, 1986) One sample question was as follows: “Which ear
25
do you use to listen through a phone?” Footedness, ear preference, and eye preference
have been highly correlated with handedness (Reiss, Tymnik, Kögler & Reiss, 1999).
For each lateral preference, a laterality quotient was calculated according to the method
of Oldfield (1971). Scores on the laterality quotient ranged from -100 to +100, with
positive values indicating a right-sided preference and negative values a left-sided
preference.
Electrophysiological Recordings
Subjects wore a 64 Ag/AgCl EEG electrode cap with a reference electrode
between Cz and CPZ. Standard EEG system (Compumedics Neuroscan, Charlotte, NC)
and EOG recording procedures were employed. Bipolar horizontal EOG channels
affixed to the right (HEOGR) and left (HEOGL) canthi in addition to vertical EOG
bipolar channels attached to the upper (VEOGU) and lower (VEOGL) orbital ridges
documented eye movements. Also, EMGs were recorded bilaterally from the first dorsal
interosseous (FDI) and the other on the adductor pollicis trans using 0.9-cm-diameter
silver/silver chloride surface electrodes. Subjects were not permitted visual assess to
EMG and EOG data during testing, however, verbal feedback between blocks helped
ensure muscles were relaxed. Impedances of all electrode channels were kept below 10
kOkm. The EEG and EOG were continuously digitized at 500 Hz. The auditory
stimulus onset was automatically documented with inputted markers within the
continuous EEG file. APC-based Neuroscan recording system (Scan) with SynAmps
(biological amplifiers) were utilized to sample and attain the EEG and EOG data.
EEGLAB Matlab Toolbox was utilized for visualization of neuronal excitability and
filtering intentions. EEG permits analysis of non-phase locked changes in electrical
26
activity. Data from each subject was stored on a magnetic optical disk for subsequent
processing offline.
Data Analysis
The software program EEGLAB, a program within MATLAB (The Mathworks,
Inc., Natick, MA, USA) was used to analyze the EEG data. The number of electrodes
was reduced to 41, ascertaining there are an equal number of central scalp, temporal-
parietal, and frontal electrodes. A high-pass filter attenuates or blocks signals that are too
low while a low-pass filter attenuates frequency bands that are deemed too high. A high-
pass filter at 1 Hz and a low-pass filter of 50 Hz with a digital finite-impulse-response
filter were applied to the continuous EEG file to extract linear trends and remove high
frequency line noise. Subsequently, the sampling rate was attenuated to 250 Hz with a
32-bit resolution. For improved temporal, salient data analysis, the data were cut or
epoched into 1200-ms segments or sweeps. ‘Bad’ electrodes, defined as sites with
potential values that exceeded a predefined value or some level of noise, were excised.
Afterwards, an average reference was computed in order to sum the outward and inward
electric fields to zero. All sweeps containing eye blinks, based on visual inspection, were
corrected employing a blind algorithm paradigm (Gratton, Coles & Donchin, 1983) and
corrected for DC drift and offset. Trials contaminated with hand muscle movements
(without muscle relaxation) were discarded from subsequent analysis. Epochs with large
artifacts were excised from successive analysis. Additionally, noisy channels were
excluded from analysis and corrected trial sweeps were averaged. In event-related
experimental setups, individual epochs correspond to one or more trials that are
experimentally phased locked temporally with the presentation of the auditory stimulus.
27
Results
General profile of ERD/ERS to auditory stimuli
Alpha was characterized as being from 8-12 Hz. Beta was separated into lower
beta (12-18 Hz), central beta (18-24 Hz), and upper beta (24-30 Hz). Overall, the
acoustic stimuli led to an increase in delta (0-4 Hz), theta (4-8 Hz), alpha, lower beta,
central beta and upper beta power (synchronization) that lasted about 500 ms (See Figure
2). This early power increase corresponded to the ERP. This was followed by alpha and
beta desynchronization that lasted up to 600 ms. Subsequently, alpha and beta
synchronization then occurred around 1000 ms and lasted until the end of data
acquisition, which was 1700 ms. We analyzed all significant ERSP perturbations after the
ERP separately. Here we focus on ERSP data because we are interested in longer
latencies. Based on these observations, we categorized the perturbations in three separate
time intervals 300-600 ms, 800-1200, and 1200-1700, parsed into 100 ms blocks. FC5
corresponds to the left hemisphere and FC6 corresponds to the right hemisphere. We
focused a separate analysis between 800-1200 because this time range corresponded with
the production of larger MEPs seen in a previous study (Mock et al., 2011).
T-tests were performed to determine whether synchronization or
desynchronization was significantly above or below a 0 baseline, respectively for the
three different time intervals using 100 ms blocks. Subsequently, speaker location,
handedness, electrode site and interactions were analyzed using a repeated measures
ANOVA that was a 2 (Location: right speaker, left speaker) x 2 (Site: FC5, FC6) x 3
(Time: 300 ms-400 ms, 400-500 ms, 500-600 ms) for the 300-600 ms time interval, a 2
28
(Location: right speaker, left speaker) x 2 (Site: FC5, FC6) x 4 (Time: 800 ms-900 ms,
900-1000 ms, 1000-1100 ms, 1100-1200 ms) for the 800-1200 ms time interval, or a 2
(Location: right speaker, left speaker) x 2 (site: FC5, FC6) x 5 (Time: 1200 ms-1300,
1300-1400 ms, 1400-1500 ms, 1500-1600 ms, 1600-1700 ms) for the 1200-1700 time
interval. Stimulus-induced changes in EEG power were assessed using T-tests and
speaker location, handedness, and electrode site were assessed using ANOVAs.
300-600 ms time window
Alpha (8-12 Hz)
Stimulus-induced changes in EEG power
The left speaker location became desynchronized from 500-600 ms (p < .04), while the
right speaker never showed significant power perturbations.
Left vs. Right Speaker Location
There was a main effect of time for alpha (F(1,15) = 5.4, p < .02). On average, during this
time, motor cortical areas became more desynchronized over time (See Figures 3).
Right Handers vs. Left Handers
There was no main effect for handedness in the alpha frequency band between 300-600
ms.
FC5 vs. FC6
There was no main effect for electrode site in the alpha frequency range between 300-600
ms.
29
Interactions
There were no interactions in alpha between 300-600 ms.
Lower beta band (12-18 Hz)
Stimulus-induced changes in EEG power
The left speaker showed trends of becoming desynchronized between 400-500 ms while
the right speaker never became significantly synchronized or desynchronized.
Left vs. Right Speaker Location
There was a main effect of time for lower beta (F(2,30) = 4.5, p < .02). On average, during
this time, motor cortical areas became more desynchronized over time (See Figure 3).
Right Handers vs. Left Handers
There was no main effect of handedness in the lower beta band for 300-600 ms.
FC5 vs. FC6
There was no main effect of electrode site in the lower beta band for 300-600 ms.
Interactions
There were no interactions for lower beta in the 300-600 ms time interval.
Central beta Band (18-24 Hz)
Stimulus-induced changes in EEG power
30
The left speaker location became significantly desynchronized between 500-600 ms (p <
.04) while the right speaker location showed trends between 300-400 ms.
Left vs. Right Speaker Location
There was a main effect of time for central beta (F(2,30) = 2.5, p < .02). On average, during
this time, motor cortical areas became more desynchronized over time (See Figure 3).
Right Handers vs. Left Handers
There were no main effects of handedness for the central beta band between 300-600 ms.
FC5 vs. FC6
There was no main effect of electrode site for central beta between 300-600 ms.
Interactions
In the central beta band, there was an interaction between location and time (F(2,30) = 4.5,
p < .01). The left speaker location became desynchronized at a later time than the right
speaker location (See Figure 3).
Upper beta band (24-30 Hz)
Stimulus-induced changes in EEG power
The left speaker location became significantly desynchronized between 500-600 ms (p <
.04) while the right speaker location never showed any ERS or ERD changes relative to
baseline.
Left vs. Right Speaker Location
31
There was a main effect of time for upper beta bands (F(2,30) = 5.6, p < .01). On average,
during this time, motor cortical areas became more desynchronized over time (See Figure
3).
Right Handers vs. Left Handers
There was no main effect of handedness in upper beta band between 300-600 ms.
FC5 vs. FC6
There was no main effect of electrode site in the upper beta band for the 300-600 ms time
interval.
Interactions
There were no interactions found in the upper beta band for the 300-600 ms time interval.
800-1200 ms time window
Alpha frequency band (8-12 Hz)
Stimulus-induced changes in EEG power
In the alpha frequency range, the right speaker location became significantly
synchronized between 1000 to 1100 ms (p <.01) while the left speaker location showed
no significant difference from baseline.
Left vs. Right Speaker Location
32
There was a significant effect of time for the alpha frequency bands (F(3,45) = 7.6, p <
.001). For alpha, synchronization progressively increased from 800 ms-1200 ms (See
Figure 3).
Right Handers vs. Left Handers
There was no main effect of handedness for the alpha frequency band between 800-1200
ms.
FC5 vs. FC6
There was no main effect of electrode site for alpha between 800-1200 ms.
Interactions
There were no interactions in the alpha frequency band between 800-1200 ms.
Lower beta band (12-18 Hz)
Stimulus-induced changes in EEG power
In the lower beta range, the right speaker location became significantly synchronized at
1000-1100 ms (p <.01) while the left speaker showed trends of becoming synchronized at
1100-1200 ms.
Left vs. Right Speaker Location
There was a significant effect of time for lower beta (F(3,45) = 10.0, p < .001). For lower
beta, synchronization progressively increased from 800 ms-1200 ms (See Figure 3). To
determine when significant changes in synchronization occurred, a post-hoc paired
33
sample t-test was performed. Between 800-900 ms and 900-1000 ms, the left speaker
location had a significant change in power (p < .01). However, the right speaker location
had significant changes in power between 900-1000 ms and 1000-1100 ms, at a later time
interval (p <. 01) (See Figure 4).
Right Handers vs. Left Handers
There was no main effect of handedness for lower beta between 800-1200.
FC5 vs. FC6
There was no main effect of electrode site between 800-1200 ms.
Interactions
There were no interactions found in the lower beta frequency band between 800-1200 ms.
Central beta band (18-24 Hz)
Stimulus-induced changes in EEG power
The right speaker location in the central beta range became significantly synchronized
between 1100-1200 (p <.01) while the left speaker showed trends of being significant
between 900-1000 ms.
Left vs. Right Speaker Location
There was no main effect in the central beta range between 800-1200.
Right Handers vs. Left Handers
There was no main effect of handedness for the central beta range between 800-1200 ms.
34
FC5 vs. FC6
There was no main effect of central beta in examining the 800-1200 time interval.
Interactions
There was an interaction between speaker location and site (F(1,15) = 5.9, p < .03) in the
central beta frequency range. Post-hoc paired sample t-tests were performed to better
understand the relationship between speaker location and site. There was a significant
difference between FC5 and FC6 when sounds were presented from the right speaker
location (p < .03). FC5 was greater than FC6 (See Figure 8). There was no significant
difference in FC5 and FC6 when sounds were presented from the left speaker. In
addition, there was a difference between the right and left speaker locations for FC5 (p <
.001). For FC5, sounds presented from the right speaker elicited a greater
synchronization than sounds presented from the left speaker (See Figure 6).
Upper beta band (24-30 Hz)
Stimulus-induced changes in EEG power
In the upper beta range, the right speaker location showed trends of becoming significant
between 1100-1200 ms (p <.01) while the left speaker location was not significantly
different from baseline at any time interval.
Left vs. Right Speaker Location
There was no main effect of speaker location in the upper beta band in examining 800-
1200 time interval.
35
Right Handers vs. Left Handers
There was no main effect of handedness in examining the upper beta range between 800-
1200 ms.
FC5 vs. FC6
There was no main effect of electrode site in assessing the upper beta band between 800-
1200 ms.
Interactions
There were no found interactions in the upper beta range between 800-1200 ms.
1200-1700 ms time window
Alpha (8-12 Hz)
Stimulus-induced changes in EEG power
The synchronization seen in the right speaker continued until the end of data acquisition.
Left vs. Right Speaker Location
There was a main effect of speaker location. There was a significant difference between
the right and left speaker locations between 8-12 Hz (F(1,15) = 8.2, p < .01) (See Figure 5).
Right Handers vs. Left Handers
There was a main effect of group. During this time interval in the alpha frequency band,
left-handers showed greater synchronization than right- handers (F(1,15) = 5.1, p < .04)
(See Figure 7). Alpha showed significant differences between right and left-handers
36
between 1300-1400 ms (F(1,15) = 11.3, p < .01) and 1400-1500 (F(1,15) = 6.6, p < .03).
Between 1200-1700, a Pearson R Correlation was employed to determine whether there
was a relationship between degree of handedness and power perturbations. Right
Speaker location FC5 was correlated with handedness (p< .04) (See Figure 8).
FC5 vs. FC6
There was no main effect of electrode site in the alpha frequency range between 1200-
1700 ms.
Interactions
There were no interactions in the data for the alpha frequency band between 1200-1700
ms.
Lower beta band (12-18 Hz)
Stimulus-induced changes in EEG power
The synchronization seen in the right speaker continued until the end of data acquisition.
Left vs. Right Speaker Location
There was a main effect of speaker location. There was a significant difference between
the right and left speaker locations between 12-18 Hz (F(1,15) = 10.5, p < .01). EEG in
response to sound from the right speaker location was more synchronized than the left
speaker location in the lower beta frequency band (See Figure 3 & 5)).
Right Handers vs. Left Handers
37
There was no main effect of handedness in the lower beta frequency band between 1200-
1700 ms.
FC5 vs. FC6
There was no main effect of electrode site in the lower beta frequency range between
1200-1700 ms.
Interactions
There were no significant interactions in the lower beta frequency range in the 1200-1700
time interval.
Central beta band (18-24 Hz)
Stimulus-induced changes in EEG power
The significant synchronization continued until the end of data acquisition.
Left vs. Right Speaker Location
There was no main effect of speaker location in the central beta range between 1200-
1700 ms.
Right Handers vs. Left Handers
There was no main effect of handedness in the central beta frequency band between
1200-1700 ms.
FC5 vs. FC6
38
There was no main effect of electrode site between 1200-1700 in the central beta
frequency band.
Interactions
There were no interactions present in the data in the central beta band between 1200-1700
ms.
Upper beta band (24-30 Hz)
Stimulus-induced changes in EEG power
The significant synchronization present in upper beta at 1100-1200 ms subsided and did
not continue.
Left vs. Right Speaker Location
There was no main effect of speaker location observed in the upper beta band between
1200-1700 ms.
Right Handers vs. Left Handers
There was no main effect of handedness in the upper beta band between 1200-1700 ms.
FC5 vs. FC6
There was no main effect of electrode site in the upper beta band in the 1200-1700 ms
time interval.
Interactions
There were no interactions found in the upper beta band between 1200-1700 ms.
39
Discussion
Main Findings
For EEG measures there was an initial increase in power (ERS) that was related to
the ERPs. This was followed by a transient ERD during the 300-600 ms time window
and then a long lasting synchronization that commenced around 800 ms and continued
through the end of data acquisition (1700 ms) (See Table 1). Between 300-600 ms in the
central beta band we found that sound from the right speaker caused the electrodes over
motor cortical areas to become desynchronized at an earlier time than the left speaker
location (See Table 1). Between 800-1200 ms in the lower beta band, the right speaker
location induced synchronized earlier than the left speaker location (See Table 1).
Between 800-1200 ms in the central beta band, when sounds were presented from the
right speaker, the contralateral hemisphere showed greater synchronization than the
ipsilateral hemisphere; however, when sounds were presented from the left speaker, there
was no difference between the contralateral or ipsilateral hemispheres (See Table1).
From 1200-1700 ms in the alpha frequency band, individuals who where left-handed
showed greater synchronization than right-handed (See Table 1). These responses were
correlated negatively with degree of handedness.
General profile of ERS/ERD
In this section I will consider why the ERD elicited by our sounds likely
represents motor cortex processing. First, the ERD were measured from scalp electrodes
overlying frontal motor areas. Secondly, ERD is commonly observed premovement.
Event-related desynchronization is characteristic of an awake brain involved in motor
output and motor preparation (Van Winsum, Sergeant & Geuze, 1984; Pfurtscheller &
40
Berghold, 1989). A desynchronized state can also indicate a state of maximum motor
readiness (Thatcher et al., 1983). Increased ERD amplitude is seen in conjunction with
increased motor corticospinal excitability as assessed using MEPs (Takemi, Masakado,
Liu & Ushiba, 2013). However, although we saw a transient beta ERD the beta ERD did
not continue through the 800-1200 and 1200-1700 time windows as hypothesized. At 1
sec after sound presentation our participants showed beta ERS instead of beta ERD. The
current study still supports the hypothesis that sound is priming the motor cortex (Mock
et al., 2011) because beta ERD was present. However, beta ERD was present from 300-
600 but not at 800-1200. Several researchers findings suggest a negative correlation
between duration of desynchronization and manual reaction time (e.g. Van Winsum et al.,
1984). Thus, the sounds in our study may be priming the motor cortex for faster reaction
time. The differences in results between the present study and Mock et al., (2011) might
be due to differences in the intrinsic properties of the sounds. Mock et al., (2011) used
environmental sounds and sounds with emotional valence, whereas the present study
utilized frequency modulated tones.
However, several experimental parameters should be taken into account when
considering this hypothesis. One should take into consideration that ERD measured here
might be generated in non-motor areas. Current source may be localized over motor
areas; however, due to volume conduction the current is spread to many different regions
(Van den Broek, Reinders, Donderwinkel & Peters, 1998). Thus, although the electrodes
were preferentially placed over motor areas, it cannot be assumed that the electrodes are
measuring voltage changes due to neurons in the corresponding brain region directly
under the electrode. One should also consider that ERD is not specific to motor
41
functions. For example, alpha ERD may also reflect attentional and semantic processing
(Klimesch, Schimke & Schwaiger, 1994).
300-‐600 ms time window
We will next explain the possible consequences of desynchronizations occurring
earlier when sound is presented from the right hemispace. The second hypothesis that
neither speaker location nor sound location will influence corticospinal excitability was
not supported. In addition, hypothesis one was not supported because beta ERD was seen
over both the contralateral and ipsilateral hemispheres, not just over the dominant
hemisphere. Previous studies has correlated the duration of beta ERD with mean reaction
time; the longer the ERD duration, the more prolonged the reaction time, indicating an
increase in motor organization time (Williams et al., 2003; Kühn et al., 2004). The basal
ganglia and subthalamic nucleus (STN) modulate ERD/ERS (Brown and Marsden 1999;
Cassim et al., 2002). Beta band ERD is reduced and finally reversed as movement is
inhibited in the subthalamic nucleus (STN) (Kühn et al., 2004). Thus, a delayed ERD
seen in response to sound coming from the left hemispace may be an automatic bottom
up motor response that is occurring earlier in the right hemispace. However, sounds
presented from the right hemispace correspond to a faster reaction time and shorter motor
preparatory time. Future behavioral studies should be done to test this hypothesis.
The implications of a delayed ERD have been studied in patients with Parkinson’s
disease (PD). Current Parkinson’s Disease (PD) models posit impaired modulation of
alpha and beta band oscillations in both subcortical and motor cortical areas in the
pathophysiology of bradykinesia and akinesia (Brown and Marsden 1999; Cassim et al.
2002). In patients with PD, a delayed preparatory or pre-movement cortical alpha and
42
beta ERD is observed (Cassidy et al., 2002, Levy et al., 2002). Viable therapeutic
options such as treatment with levodopa (Devos et al., 2003; Devos and Defebvre 2006)
or deep-brain stimulation of the subthalamic nucleus (STN) (Devos et al. 2004; Devos
and Defebvre 2006) results in earlier ERD and reversal of akinesia and bradykinesia.
Thus, the earlier ERD, as seen in PD patients after successful treatment, suggests that the
central processing of movement commences earlier. Therefore, sounds presented from
the right hemispace results in an earlier ‘priming’ of the motor cortex to action. This
deduction is further supported by the fact that 300-600 ms is within the typical time range
for subjects to respond to simple reaction time experiments. Several studies have
examined this phenomenon (e.g. Beurrier et al., 2001) but none have examined it with
regards to sound. To my knowledge, there are no studies examining PD and spatial
hearing, particularly studies having patients responding to sounds from the left vs. right
hemispace. Future studies should address this issue.
a. 800-‐1200 ms time window
Within the 800-1200 ms time window in the lower beta frequency band sound
presented from the right hemispace showed earlier cortical responses than sounds
presented from the left hemispace. Results suggest some preference to the right
hemispace. Neurological disorders provide great insight into normal functioning of the
human brain. The next paragraph attempts to explain why sound presented from the right
hemispace showed an earlier cortical response using a prominent neurological disorder as
a model.
Hemineglect (or hemispatial neglect syndrome) is a disorder characterized by an
abnormal bias towards one side of space. Most hemineglect patients give more
43
attentional salience to the right hemispace, effectively neglecting the left hemispace
(Corbetta and Shulman, 2011). The line-bisection task is commonly used to assess the
severity of visual hemineglect. Patients typically will dissect horizontal lines
significantly to the right of the true center, implying they are giving more attentional
salience to the right hemispace or are, alternatively, ignoring the majority of the left
hemispace (McCourt & Jewell, 1999). Based on human functional neuroimaging studies,
the posterior parietal cortex is thought to be integral for attending to spatial locations
(Fink et al., 1997).
More recent research has examined auditory hemineglect, which normally
presents with a bias to the right hemispace (Corbetta & Shulman, 2011). Normally,
patients with auditory hemineglect have unilateral omissions when perceiving two stimuli
presented simultaneously from both the left and right hemispace (Hugdahl et al., 1991).
They normally exhibit neglect of auditory stimuli in the left hemispace due to impairment
in the contralateral hemisphere. For example, when addressed verbally from the left, a
person with auditory hemineglect may not respond or more commonly, may behave as if
they heard the voice originating from the right. The most widely employed paradigm to
study auditory hemineglect is the dichotic listening test, in which two different auditory
stimuli are presented simultaneously. Ear related asymmetry in auditory hemineglect has
been accounted for by several theories. One model posits that completely neglecting one
hemispace reflects an over-attention to the ipsilateral hemispace, due to inter-hemispheric
imbalance created by unilateral brain damage (Kinsbourne, 1977). The basal ganglia has
been documented as being involved in spatial attention in primates (Boussaoud and
Kermadi, 1997) and in humans (Mesulam, 1990). The insula has been documented as
44
being involved in selection of relevant auditory information (Habib et al., 1995).
Damage to either of these areas can induce auditory hemineglect (Bellmann, Meuli &
Clark, 2000). Therefore, we believe sounds presented to the right side of space
automatically receive more attention than sounds presented from the left side of space
due to preferential processing in the basal ganglia and insula.
In addition to the dramatic impairments in attending to the left side of space in
hemineglect, studies in healthy subjects show differences in attending and processing
information from the left vs. right. Neurologically normal subjects also systematically
err in visual tasks such as the visual line-bisection. However, they err to the left of the
true center, suggesting a right-sided neglect or increased attentional salience to the left
side in a phenomenon called ‘pseudoneglect’ (McCourt and Jewell, 1999). A similar
phenomenon can be seen in the tactile and kinesthetic modalities (Bowers & Heilman,
1980). Pseudoneglect and hemineglect represent a set of twin phenomena that
demonstrate hemispheric attentional asymmetries (McCourt & Jewell, 1999). While
pseudoneglect has been studied extensively in the visual modality, it has not been studied
thoroughly in the auditory modality. One study found a right hemispace bias when two
sounds were presented simultaneously, with one from each side (Dufour, Touzalin &
Candas, 2007). To our knowledge for the first time, the present study supports the
existence of a right bias in audiospatial attention even when sounds are presented
intermittently.
b. 800-‐1200 ms time window
We will now discuss longer-latency ERS results, and interpret results that indicate
sounds presented from the right speaker induced greater ERS in the contralateral
45
hemisphere than in the ipsilateral hemisphere in central beta. A general observation is
that ERD over a brain region corresponds to cortical activation, with the brain region
prepared to process information and having an increased excitability of cortical neurons
(Pfurtscheller and Lopes da Silva, 1999). Whereas brain regions that are not central to
performing a task or may have potentially confounding information, exhibit ERS
(Pfurtscheller & Lopes da Silva, 1999b). One study assessing corticospinal excitability
during this time window suggests that the ERS might be due to either late attentional
orienting effects or a reorienting of the participant back to the nature video (Mock et al.,
2011). One event-related potential studies on reorienting using task relevant stimuli
found a long latency ‘reorienting negativity’ (Schroger & Wolff, 1998). Dipole analysis
of this component suggests it has a source in the primary motor cortex (Horvath, Diano &
Van Den Pol, 1999). This is further supported by the fact that after attention is captured,
an action usually follows (Sokolov, 1963).
We will now discuss an alternative interpretation of the results. After an ERD,
ERS possibility indicates subsequent ‘idling’ of underlying neuronal networks
(Mulholland, 1995). The greater the ERS, the greater the processing that took place
before the ERS commenced (Lutzenberger, Preissi & Pulvermüller, 1994). According to
the aforementioned hypotheses, the greater ERD could correspond to greater motor
priming. Hence, since greater ERS intensity corresponds to greater motor priming, the
contralateral hemisphere had a greater motor priming than the ipsilateral hemisphere.
The question now becomes why is the contralateral hemisphere more primed than
the ipsilateral hemisphere. Studies show that when action is needed in the contralateral
hemispace, the preferred hand use decreases strongly, since most subjects shift to using
46
their ipsilateral hand (Helbig and Gabbard, 2004). From these data, the researchers
concluded that while hand dominance is the key factor in determining hand selection in
the ipsilateral space, attention is a mediating factor in determining hand selection in the
contralateral hemispace, a phenomena termed kinesthetic efficiency and/or hemispheric
bias (Gabbard et al., 1997). Thus, we can conclude that since the sound was presented
from the right speaker, we would expect the left motor cortex to be primed because the
subject would want to respond with the ipsilateral hand (right hand) because attention is a
mediating factor.
1200-‐1700 ms time window
Left-handed subject (or sinistrals) showing greater synchronization than those
who were right–handed (or dextrals) in alpha supports the claim that cortical spatial
processing differs between sinistrals and dextrals. We did not see a difference between
the dominant and non-dominant hand as hypothesized and seen in previous studies (Mock
et al., 2011). There are few studies on ERSP changes in response to sounds and even
fewer that have looked at ERSP changes this late after sound onset with respect to
handedness. Handedness is a clear example of anatomical asymmetry; in fact, this
lateralization defines handedness. Left-handers, as a group, are more variable than right-
handers on many behavioral and psychological measures, suggesting a greater within-
group heterogeneity (Arroyo & Uematsu, 1992). One study found a correlation between
the lateralization seen in handedness and functional activation of the motor cortex
(Dassonville et al., 1997). Left-handed subjects have been shown to be less strongly
lateralized in terms of hemispheric spatial function (McGlone & Davidson, 1973; Vogel,
Bowers, & Vogel, 2003). Gesturing has been found to be more bilaterally organized in
47
left-handers than in right-handers (King & Kimura, 1972). Even when sounds are
presented from the right hemispace in a dichotic listening task, left-handers still showed
bilateral organization. Thus, we believe the handedness affects seen in the present study
might be due to interaction between asymmetrical hemispheric activations in either group
and an asymmetrical allocation of attention between the left and right hemispheres.
Future Research
Considering the large ERS and ERD observed in this study in the alpha and beta
bands, it might be interesting to examine frequency bands higher than gamma (Arroyo &
Uematsu, 1992). In addition, it might be of interest to examine older subjects. Older
subjects would be expected a desynchronization longer in duration and a resultant shorter
synchronization indicating inefficient motor preparation (Salthouse, 1996). Moreover, it
would be of interest to examine patients with neurological disorders, specifically patients
with problems initiating or stopping movements such as Parkinson’s patients or patients
with attentional problems such as hemineglect. We could examine the duration and
latencies of ERD and ERS in response to sounds and compare the finding to normal
subjects in hopes of gaining more insight into the disorders at a neuronal level in order to
develop better therapeutic options.
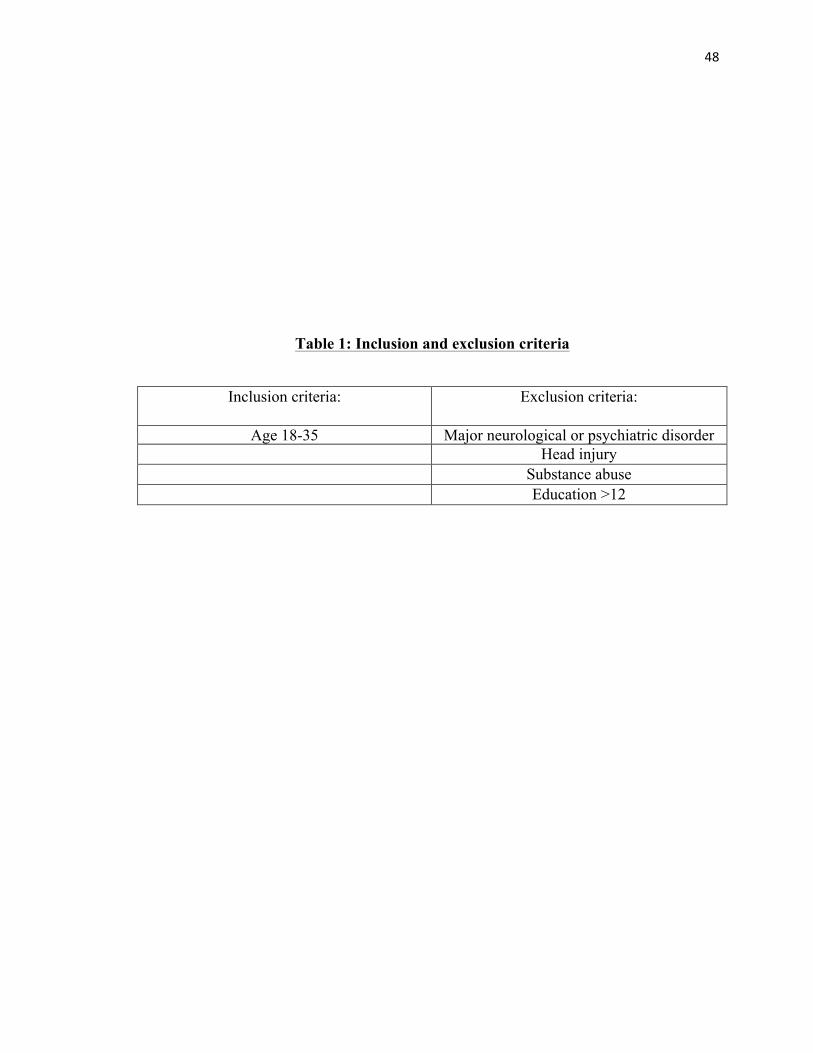
48
Table 1: Inclusion and exclusion criteria
Inclusion criteria: Exclusion criteria:
Age 18-35 Major neurological or psychiatric disorder Head injury Substance abuse Education >12
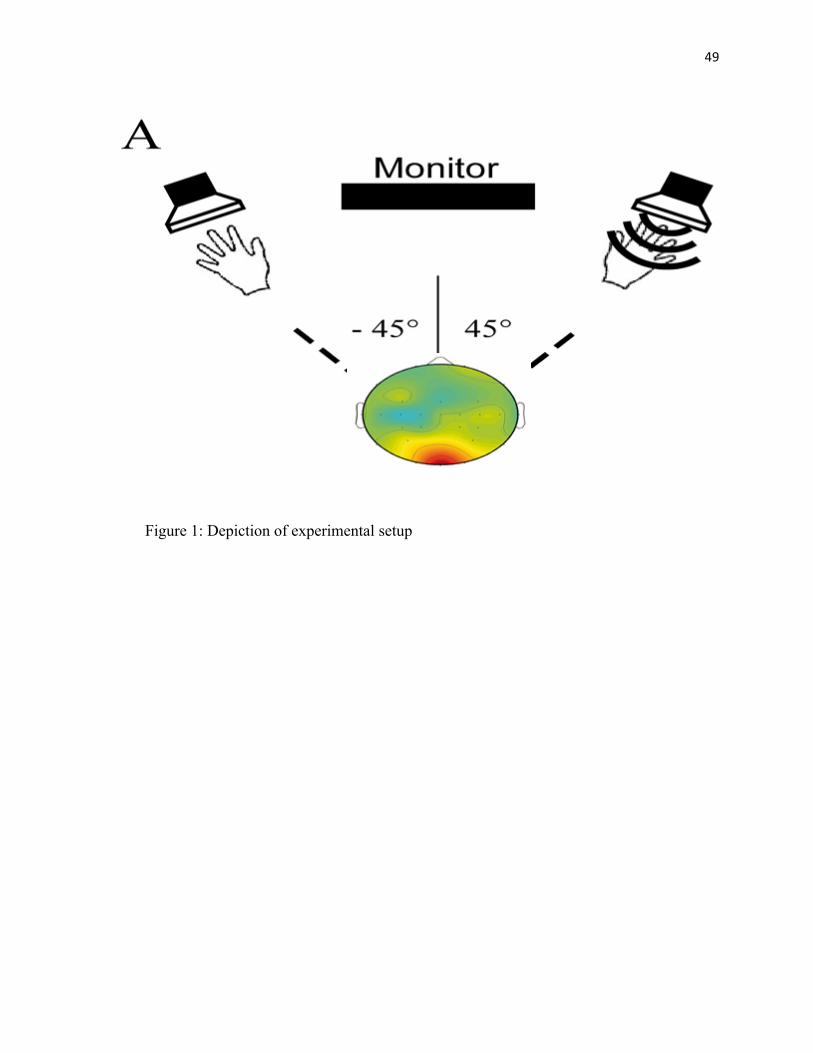
49
Figure 1: Depiction of experimental setup
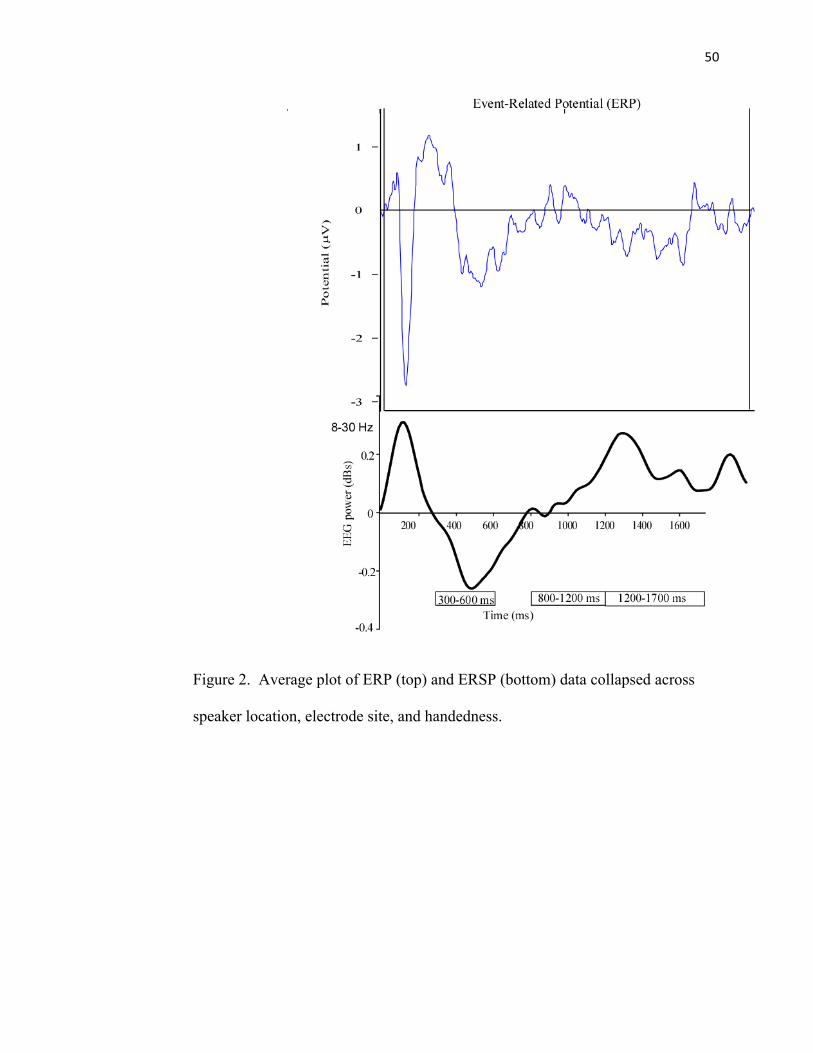
50
Figure 2. Average plot of ERP (top) and ERSP (bottom) data collapsed across
speaker location, electrode site, and handedness.
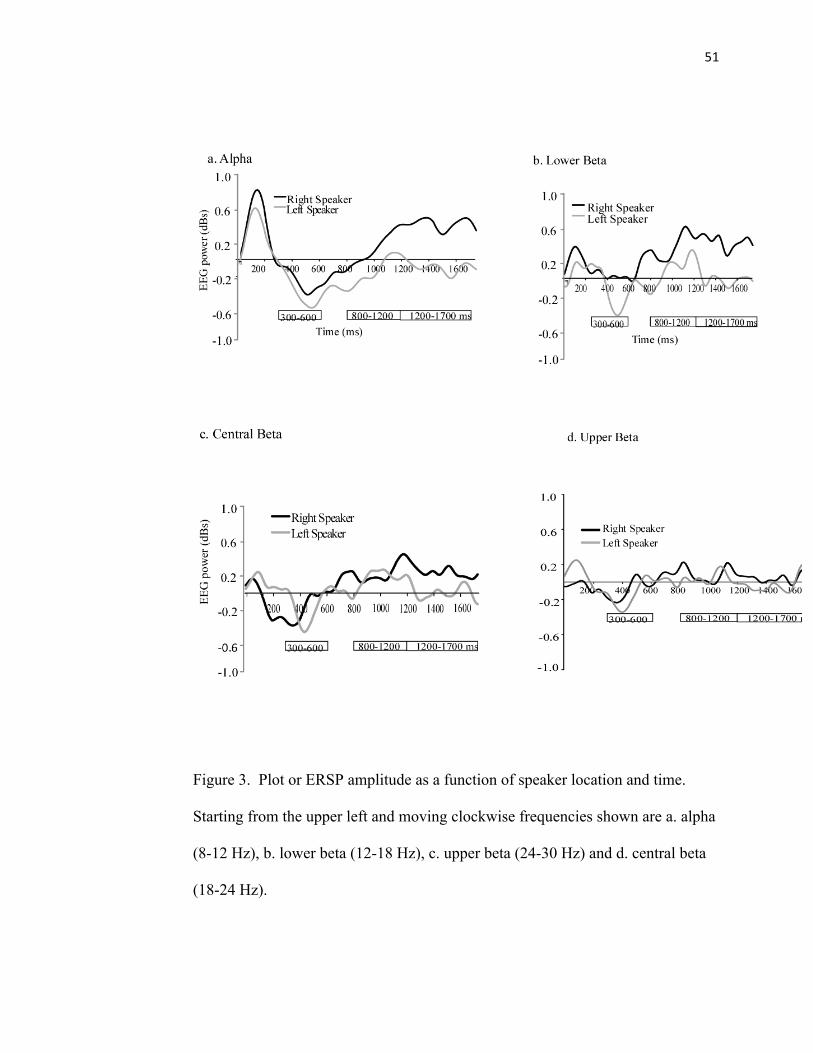
51
Figure 3. Plot or ERSP amplitude as a function of speaker location and time.
Starting from the upper left and moving clockwise frequencies shown are a. alpha
(8-12 Hz), b. lower beta (12-18 Hz), c. upper beta (24-30 Hz) and d. central beta
(18-24 Hz).
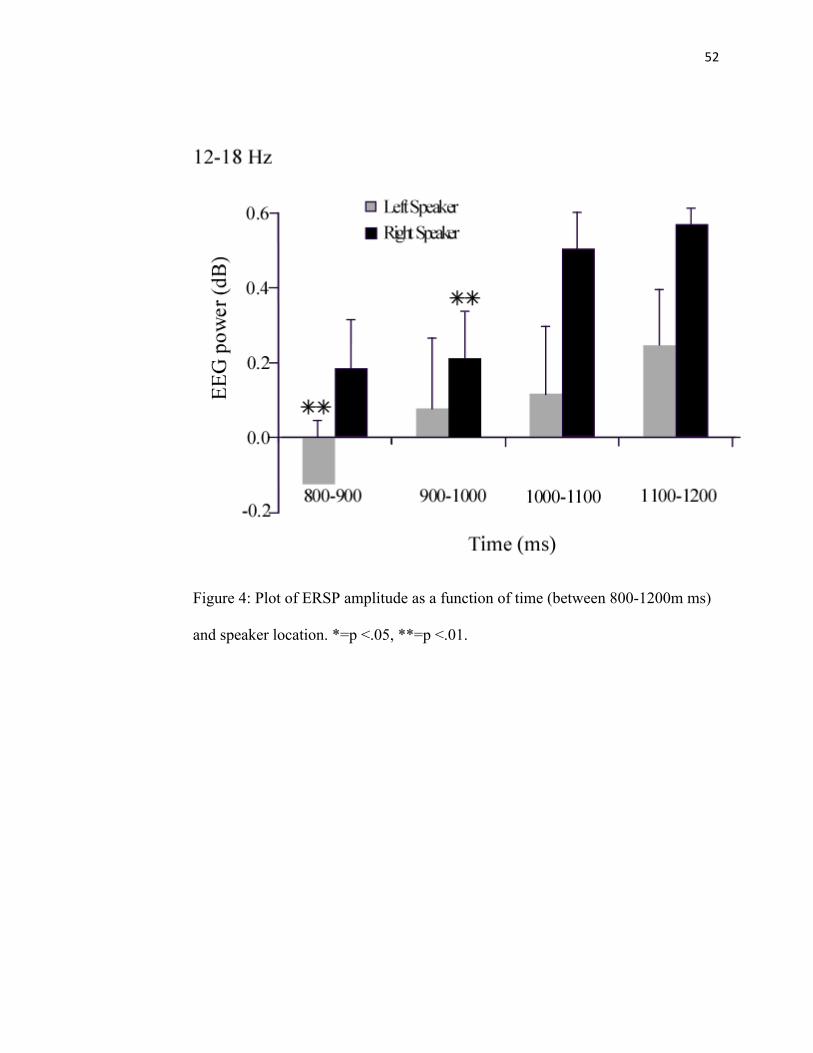
52
Figure 4: Plot of ERSP amplitude as a function of time (between 800-1200m ms)
and speaker location. *=p <.05, **=p <.01.
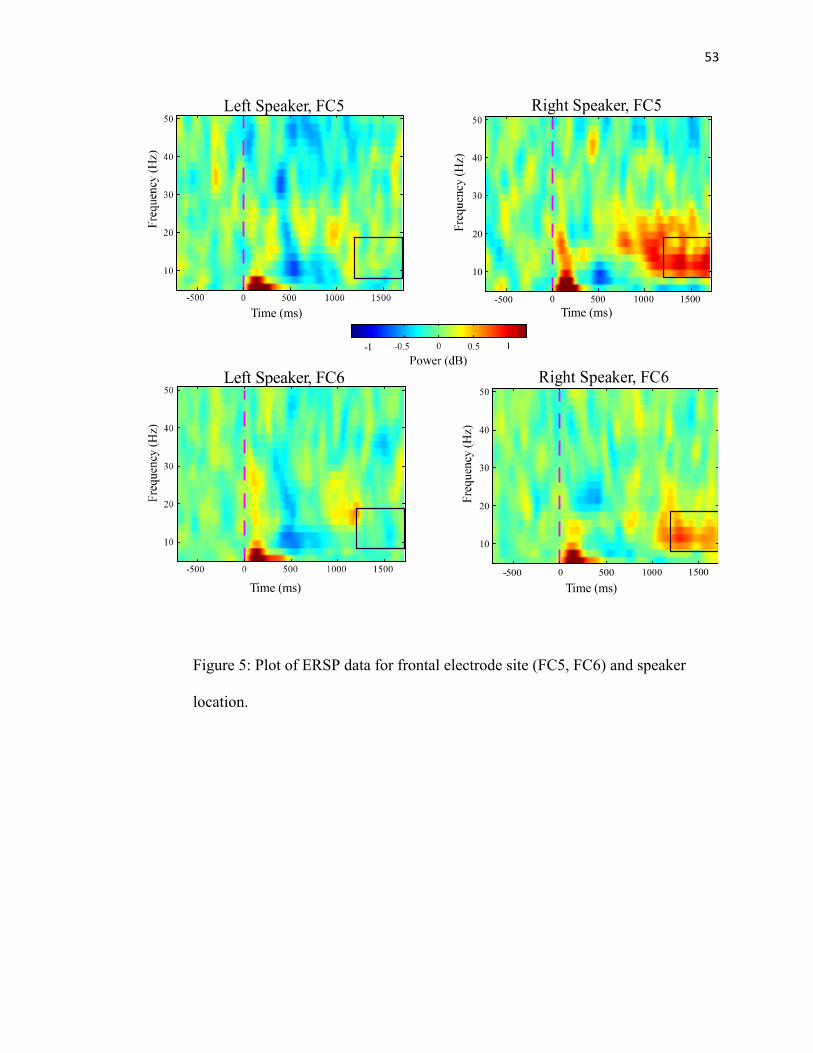
53
Figure 5: Plot of ERSP data for frontal electrode site (FC5, FC6) and speaker
location.
Time (ms)
Left Speaker, FC5
Time (ms)
Left Speaker, FC6
-500 0 500 1000 1500
10
20
30
40
50
Time (ms)
Right Speaker, FC5
Right Speaker, FC6
10
20
30
40
50
-500 0 500 1000 1500
Time (ms)
Figure 7: Plot of ERSP data for frontal electrode sites (FC5, FC6) and speaker location.
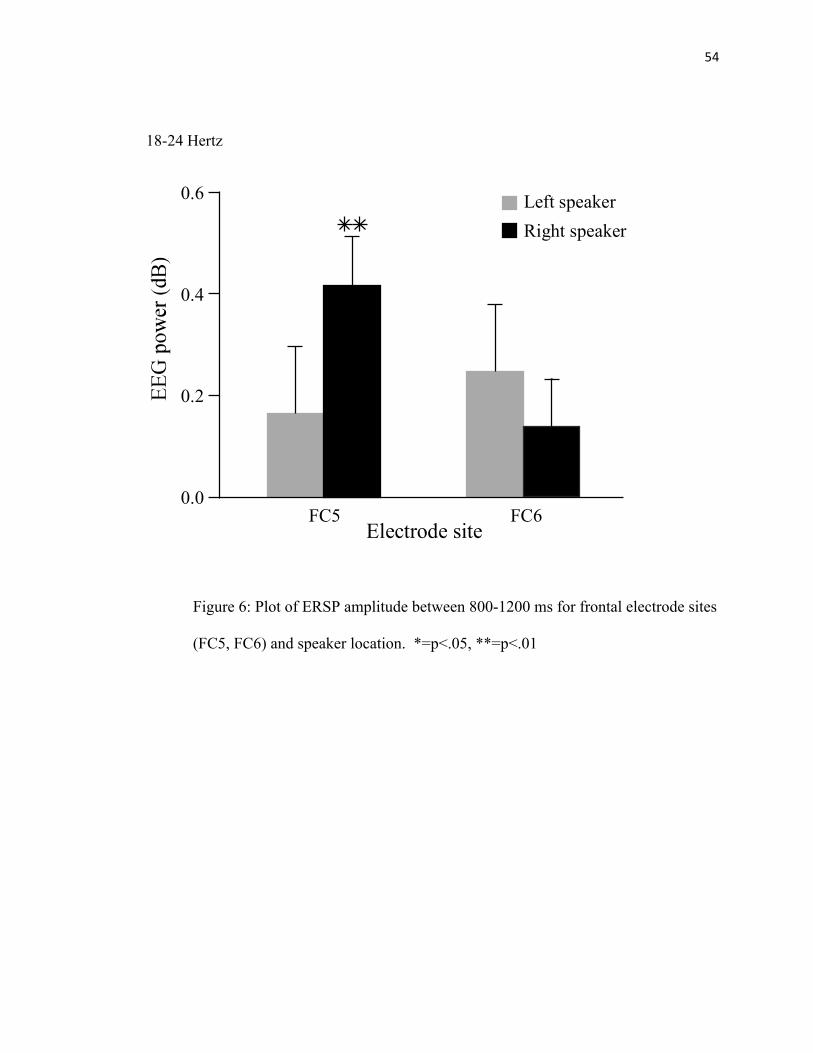
54
Figure 6: Plot of ERSP amplitude between 800-1200 ms for frontal electrode sites
(FC5, FC6) and speaker location. *=p<.05, **=p<.01
FC50.0
0.6
0.2
0.4
FC6
Left speakerRight speaker
Electrode site
Figure 6: Plot of ERSP amplitude between 800-1200 ms for frontal electrode sites(FC5, FC6) and speaker location. *=p<.05, **=p<.01.
18-24 Hertz
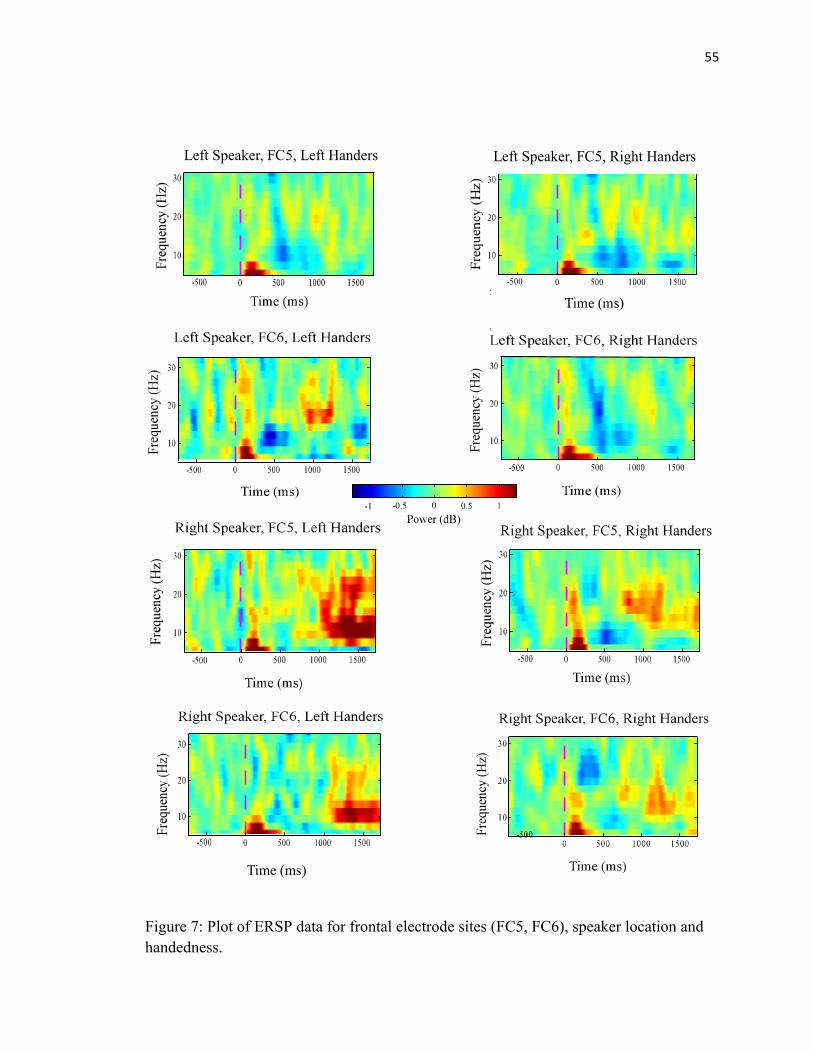
55
Figure 7: Plot of ERSP data for frontal electrode sites (FC5, FC6), speaker location and handedness.
Time (ms)
Figure 9: Plot of ERSP data for frontal electrodes sites (FC5, FC6), speaker location, andhandedness.
Left Speaker, FC5, Right HandersLeft Speaker, FC5, Left Handers
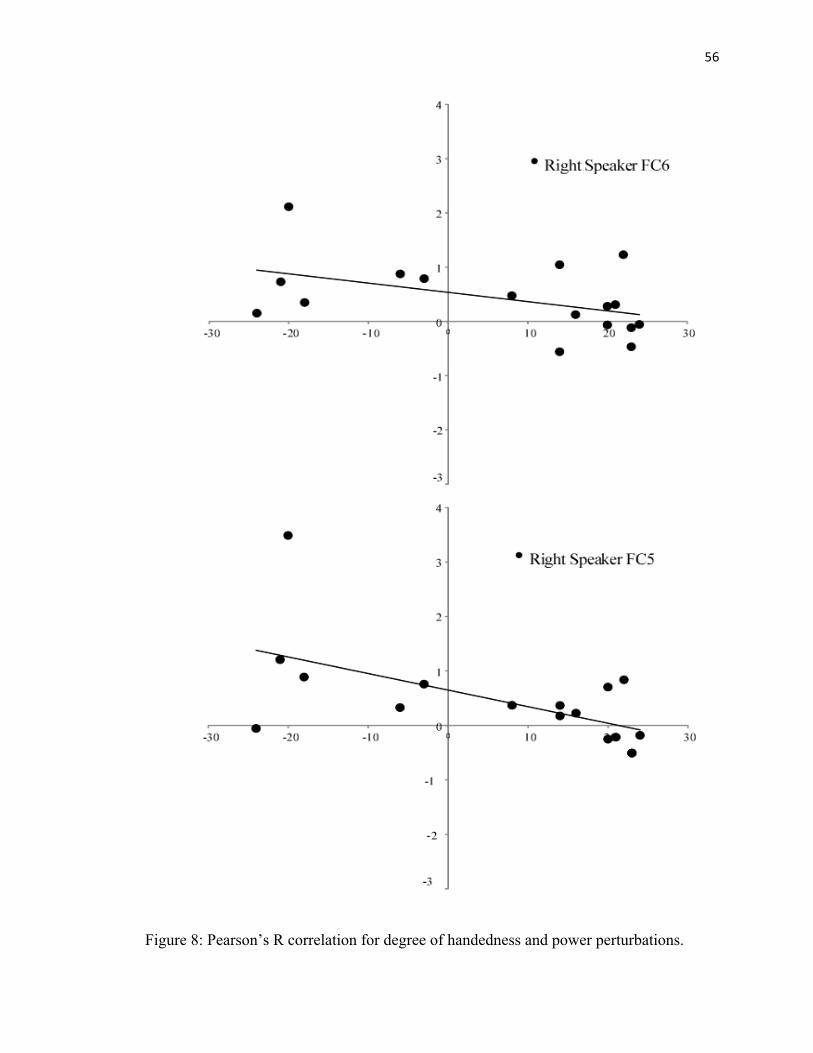
56
Figure 8: Pearson’s R correlation for degree of handedness and power perturbations.
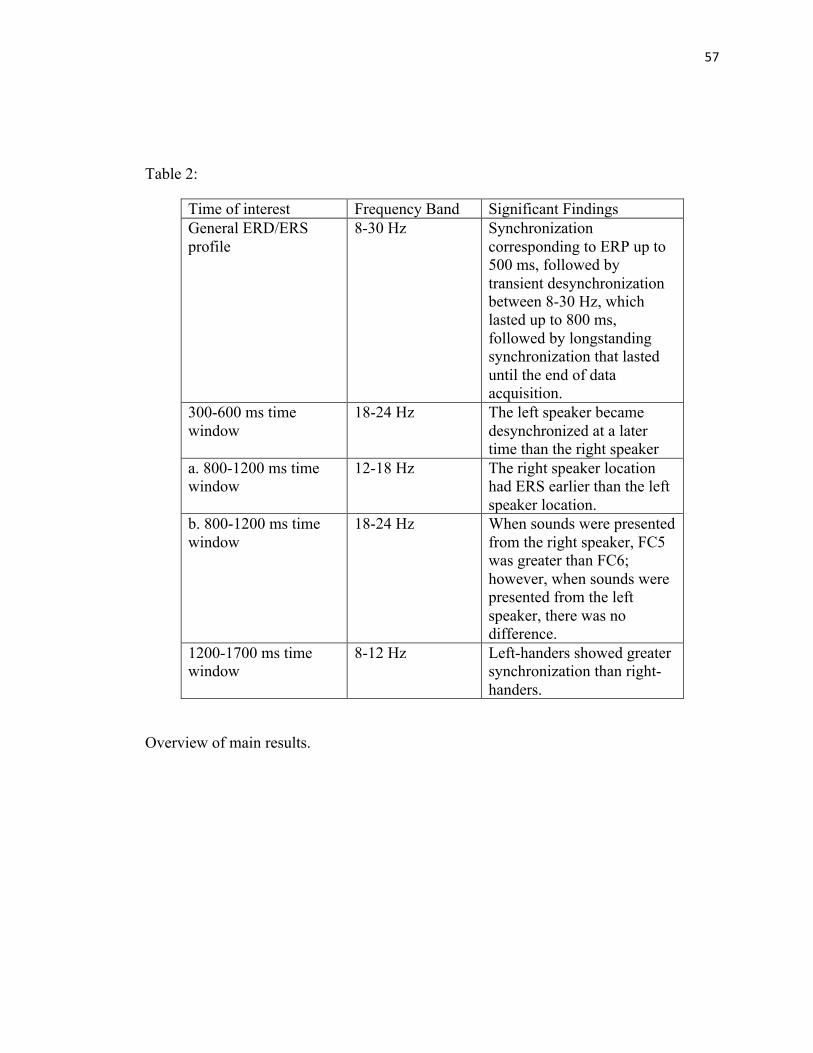
57
Table 2:
Time of interest Frequency Band Significant Findings General ERD/ERS profile
8-30 Hz Synchronization corresponding to ERP up to 500 ms, followed by transient desynchronization between 8-30 Hz, which lasted up to 800 ms, followed by longstanding synchronization that lasted until the end of data acquisition.
300-600 ms time window
18-24 Hz The left speaker became desynchronized at a later time than the right speaker
a. 800-1200 ms time window
12-18 Hz The right speaker location had ERS earlier than the left speaker location.
b. 800-1200 ms time window
18-24 Hz When sounds were presented from the right speaker, FC5 was greater than FC6; however, when sounds were presented from the left speaker, there was no difference.
1200-1700 ms time window
8-12 Hz Left-handers showed greater synchronization than right-handers.
Overview of main results.
58
References
Alegre, M., Gurtubay, I., Labarga, A., Iriarte, J., Malanda, A., & Artieda, J. (2004).
Alpha and beta oscillatory activity during a sequence of two movements. Clinical
Neurophysiology, 115(1), 124-130.
Amunts, K., Schlaug, G., Schleicher, A., Steinmetz, H., Dabringhaus, A., Roland, P. E.,
& Zilles, K. (1996). Asymmetry in the human motor cortex and
handedness. NeuroImage, 4(3), 216-222.
Amunts, K., Schleicher, A., Bürgel, U., Mohlberg, H., Uylings, H., & Zilles, K. (1999).
Broca's region revisited: Cytoarchitecture and intersubject variability. The Journal
of Comparative Neurology, 412(2), 319-341.
Anllo-Vento, L., & Hillyard, S. (1996). Selective attention to the color and direction of
moving stimuli: Electrophysiological correlates of hierarchical feature selection.
Perception & Psychophysics, 58(2), 191-206.
Annett, M. (1967). The binominal distribution of right, mixed and left-handedness. Q.J.
Experimental Psychology, (20), 327-333.
Arroyo, S., Uematsu, S. (1992). High-Frequency EEG Activity at the Start of Seizures.
Journal of Clinical Neurophysiology, 3(9),
http://journals.lww.com/clinicalneurophys/Abstract/1992/07010/High_Frequency
_EEG_Activity_at_the_Start_of.12.aspx
Barnsley, R. H., & Rabinovitch, M. S. (1970). Handedness: Proficiency versus stated
preference. Perceptual Motor Skills, (30), 343-362.
59
Bauer, M., Oostenveld, R., Peeters, M., & Fries, P. (2006). Tactile spatial attention
enhances gamma-band activity in somatosensory cortex and reduces low-
frequency activity in parieto-occipital areas. The Journal of Neuroscience, 26(2),
490-501.
Bear, D., Schiff, D., Saver, J., Greenberg, M., & freeman, R. (1986). Quantitative
analysis of cerebral asymmetries: fronto-occipital correlation, sexual dimorphism
and association with handedness. Archives of Neurology, 43, 598-603.
Ben-David, B. M., Campeanu, S., Tremblay, K. L., & Alain, C. (2011). Auditory evoked
potentials dissociate rapid perceptual learning from task repetition without
learning. Psychophysiology,48(6), 797-807.
Bernard, J., Taylor, S., & Seidler, R. (2011). Handedness, dexterity, and motor cortical
representations. Journal of Neurophysiology, 105(1), 88-99.
Beurrier, C., Bioulac, B., Audin, J.,Hammond, C. (2001). High-frequency stimulation
produces a transient blockade of voltage-gated currents in subthalamic neurons.
Journal of Neurophysiology, 85, 1351–1356.
Boiten, F., Sergeant, J., & Geuze, R. (1992). Event-related desynchronization: the effects
of energetic and computational demands. Electroencephalography and Clinical
Neurophysiology, 82(4), 302-309.
Bowers, D., Heilman, K.M. (1980). Pseudoneglect: effects of hemispace on a tactile line
bisection task. Neuropsychologia, 18(4–5), 491–498.
60
Boussaoud, D., Kermadi, I. (1997). The primate striatum: neuronal activity in relation to
spatial attention versus motor preparation. European Journal of Neuroscience, 9,
2152–2168.
Braitenberg, V., & Schüz, A. (1991). Anatomy of the cortex. New York: Springer.
Briggs, G.G., Nebes, R.D. (1975). Patterns of hand preference in a student population.
Cortex, (11), 230-238.
Brodmann, K., (1909). Brodmann's “Localisation in the cerebral cortex.” Translated and
edited by Gary, L.G. from “Vergleichende Lokalisationslehre der Grosshirnrinde
in ihren Prinzipien dargestellt auf Grund des Zellenbaues.” Leipzig: Johann
Ambrosius Barth.
Brovelli, A., Ding, M., Ledberg, A., Chen, Y., Nakamura, R., & Bressler, S. (2004). Beta
oscillations in a large-scale sensorimotor cortical network; directional influences
revealed by granger causality. Proceedings of the National Academy of Sciences,
101, 9849-9854.
Brown, P., Marsden, C.D. (1999). Bradykinesia and impairment of EEG
desynchronization in Parkinson’s disease. Movement Disorders, 14(3), 423–429.
Canolty, R., Edwards, E., Dalal, S., Soltani, M., Nagarajan, S., Kirsch, H., Knight, R.T.,
Berger, M., & Barbaro, N. (2006). High gamma power is phase-locked to theta
oscillations in human neocortex. Science, 313, 1626-1628.
61
Cassidy, M., Mazzone, P., Oliviero, A., Insola, A., Tonali, P., DiLazzaro, V., et al.
(2002). Movement‐related changes in synchronization in the human basal ganglia.
Brain, 125, 1235–1246.
Cassim, F., Labyt, E., Devos, D., Defebvre, L., Destée, A., Derambure, P. (2002)
Relationship between oscillations in the basal ganglia and synchronization of
cortical activity. Epileptic Disorders, 4(3), S31–S45.
Celesia, G. G. (1976). Organization of auditory cortical areas in man. Journal of
Neurology, 99(3), 403-414.
Clarke, S., Bellmann, A., Meuli, R., Assal, G., & Steck, A. (2000). Auditory agnosia and
auditory spatial deficits following left hemispheric lesions: evidence for distinct
processing pathways. Neuropsychologia, 38(6), 797-807.
Constanini, M., Ambrosini, E., Tieri, G., Sinigaglia, C., & Committeri, G. (2010). Where
does an object trigger an action? An investigation about affordances in space.
Experimental Brain Resolution, (207), 95-103.
Corbetta, M., & Shulman, G. (2011). Spatial neglect and attention networks. Annual
Review of Neuroscience,34, 569-599.
Dassonville, P., Zhu, X., Ugurbil, K., Kim, S., & Ashe, J. (1997). Functional activation in
motor cortex reflects the direction and the degree of handedness. PNAS:
Proceedings of the National Academy of Sciences of the United States of
America, 94(25), 14015-14018.
62
Defebvre, L., Bourriez, L., Destée, A., & Guieu, J. D. (1996). Movement related
desynchronization pattern preceding voluntary movement in untreated
Parkinson. Journal of Neurology, Neurosurgery, and Psychiatry with Practice
Neurology, 60, 307-312.
Devos, D., Defebvre, L., (2006). Effect of deep brain stimulation and L-Dopa on
electrocortical rhythms related to movement in Parkinson’s disease. Progress in
Brain Research, 159, 331–349.
Devos, D., Labyt, E., Derambure, P., Bourriez, J.L., Cassim, F., Guieu, J.D., Destée, A.,
Defebvre, L. (2003) Effect of L-Dopa on the pattern of movement-related
(de)synchronisation in advanced Parkinson’s disease. Clinical Neurophysiology
33(5), 203–212.
Devos, D., Labyt, E., Derambure, P., Bourriez, J.L., Cassim, F., Reyns, N., Blond, S.,
Guieu, J.D., Destée, A., Defebvre, L. (2004) Subthalamic nucleus stimulation
modulates motor cortex oscillatory activity in Parkinson’s disease. Brain 127(2),
408–419.
Dufour, A., Touzalin, P., Candas, V. (2007). Rightward shift of the auditory subjective
straight ahead in right- and left-handed subjects. Neuropsychologia, 45(2), 447–
453.
Dujardin, K., Derambure, P., Defebvre, L., Bourriez, L., Jacquesson, J. M., & Guieu, J.
D. (1993). Evaluation of event-related desynchronization (ERD) during a
recognition task: effect of attention. Electroencephalography and Clinical
Neurophysiology, 86(5), 353-356.
63
Eimer, M. (1994). "Sensory gating" as a mechanism for visuospatial orienting:
Electrophysiological evidence from trial-by-trial cuing experiments. Perception &
Psychophysics, 55(6), 667-675.
Elias, L., Bryden, M., & Bulman-Fleming, M. (1998). Footedness is a better predictor
than is handedness of emotional lateralization. Neuropsychologia,36(1), 37-43.
Elul, R. (1972). The genesis of EEG. International Review of Neurobiology, 15, 227-272.
Falzi, G., Perrone, P., & Vignolo, L. (1982). Right-left asymmetry in anterior speech
region. Archives of Neurology, 39(4), 239-240. doi:
doi:10.1001/archneur.1982.00510160045009.
Fink, G., Dolan, R., Halligan, P., Marshall, J., & Frith, C. (1997). Space-based and
object-based visual attention: shared and specific neural domains. Brain: A
Journal of Neurology, 120(11), 2013-2028.
Foundas, A. L., Leonard, C. M., & Heilman, K. M. (1995). Morphologic cerebral
asymmetries and handedness the pars triangularis and planum temporale. Archives
of Neurology, 52(5), 501-508.
Gabbard, C., Iteya, M., Rabb, C. (1997). A lateralized comparison of handedness and
object proximity. Canadian Journal of Experimental Psychology, 51(2), 176–180.
Ghez, C., Krakauer, J., &, (2000). The organization of movement. In E. Kandel, J.
Schwartz & T. Jessell (Eds.), Principles of Neural Science (4 ed., pp. 653-673).
New York, St. Louis, San Framcisco, Auckland, Gogota, caracas, Lisbon,London,
64
Madrid, Mexico City, Milan, Montreal, New Delhi, San Juan, Singapore, Sydney,
Tokyo and Toronto: McGraw-Hill.
Gonzalez, J., & McLennan, C. (2009). Hemispheric differences in the recognition of
environmental sounds. Psychological Science, 20(7), 887-894.
Gratton, G., Coles, G. H., & Donchin, E. (1983). A new method for off-line removal of
ocular artifact . Electroencephalography and Clinical Neurophysiology, 55(4),
468-484.
Graziano M.S., Cooke D.F. (2006). Parieto-frontal interactions, personal space, and
defensive behavior. Neuropsychologia, (44), 845–859.
Gross, J., Schmitz, F., Schnitzler, I., Kessler, K., Shapiro, K., Hommel, B., & Schnitzler,
A. (2004). Modulation of long-range neural synchrony reflects temporal
limitations of visual attention in humans. Proceedings of the National Academy of
Sciences, 101, 103050-103055.
Habib, M., Daquin, G., Milandre, L., Royere, M., Rey, M., Lanteri, A., Salamon, G., &
Khalil, R. (1995). Autism and auditory agnosia due to bilateral insular damage—
role of the insula in human communication. Neuropsychologia, 33(3), 327-339.
Handy, T., & Mangun, G. (2000). Attention and spatial selection: Electrophysiological
evidence for modulation by perceptual load. Perception & Psychophysics, 62(1),
175-186.
Horvath, T., Diano, S., & Van Den Pol, A. (1999). Synaptic interaction between
hypocretin (orexin) and neuropeptide y cells in the rodent and primate
65
hypothalamus: A novel circuit implicated in metabolic and endocrine
regulations. The Journal of Neuroscience, 19(3), 1072-1087.
Helbig, C.R., Gabbard, C. (2004). What determines limb selection for reaching?
Research Quarterly for Exercise and Sport, 75 (1), 47–59.
Hugdahl, K., Wester, K., Asbjornsen, A. (1991). Auditory neglect after right frontal lobe
and right pulvinar thalamic lesions. Brain Language, 41, 465–473.
Hyman, J., Zilli, E., Paley, A., & Hasselmo, M. (2005). Medial prefrontal cortex cells
show dynamic modulation with the hippocampal theta rhythm dependent on
behavior. Hippocampus, 15, 739-749.
Ilmoniemi, R. J., & Kicic, D. (2010). Methodology for combined TMS and EEG . Brain
Topography , (22), 233-248.
Johnstone, J., Galin, D., & Herron, J. (1979). Choice of handedness measures in studies
of hemispheric specialization. International Journal of Neuroscience, (9), 71-80.
Jones, M., & Wilson, M. (2005). Theta rhythms coordinate hippocampal-prefrontal
interactions in a spatial memory task. PLoS, 3(402),
Kertesz, A., Polk, M., Black, S., & Howell, J. (1990). Sex, handedness, and the
morphometry of cerebral asymmetries on magnetic resonance imaging. Brain
Research, 530(1), 40-48.
Khalfa, S., Veuillet, E., & Collet, L. (1998). Influence of handedness on peripheral
auditory asymmetry. European Journal of Neuroscience, 10(8), 2731-2737.
66
King, F. L., & Kimura, D. (1972). Left-ear superiority in dichotic perception of vocal
nonverbal sounds. . Canadian Journal of Psychology, 26(2), 111-116.
Kinsbourne, M. (1977). Hemi-neglect and hemisphere rivalry. Advances in Neurology,
18, 41–49.
Klimesch, W., Schimke, H., & Pfurtscheller, G. (1993). Alpha frequency, cognitive load
and memory performance. Brain Topography, 5(3), 241-251.
Klimesch, W., Schimke, H., & Schwaiger, J. (1994). Episodic and semantic memory: An
analysis in the EEG theta and alpha band. Electroencephalography and Clinical
Neurophysiology, 91(6), 428-441.
Komssi, S., Aronen, H. J., Huttunen, J., Kesäniemi , M., Soinne, L., … Nikouline, V. V.,
Ollikainen, M., & Roine, R. O. (2002). Ipsi-and contralateral EEG reactions to
transcranial magnetic stimulation. Clinical Neurophysiology, (113), 175-184.
Kühn, A.A., Williams, D., Kupsch, A., Limousin, P., Hariz, M., Schneider, G.H.,
Yarrow, K., Brown, P. (2004) Event-related beta desynchronization in human
subthalamic nucleus correlates with motor performance. Brain 127(4), 735–746.
Leocani, L., Toro, C., Manganotti, P., Zhuang, P., & Hallett, M. (1997). Event-related
coherence and event-related desynchronization/synchronization in the 10 Hz and
20 Hz EEG during self-paced movements. Electroencephalography and Clinical
Neurophysiology/Evoked Potentials Section,104(3), 199-206.
Levitsky, W., & Geschwind, N. (1968). Asymmetries of the right and left hemisphere in
man. Transactions of the American Neurological Association, 93, 232-233.
67
Levy, R., Hutchison, W.D., Lozano, A.M., Dostrovsky, J.O. (2002). Synchronized
neuronal discharge in the basal ganglia of parkinsonian patients is limited to
oscillatory activity. Journal of Neuroscience, 22, 2855–61.
Lutzenberger, W., Preissl, H., and Pulvermüller, F. (1995). Fractal dimension of EEG
time series and underlying brain processes. Biological Cybernetics, 73, 477–482.
Magnani , G., Cursi, M., Leocani , L., Cursi, M., Volonté, M. A., Locatelli , T., Elia, A.,
& Comi , G. (1998). Event-related desynchronization to contingent negative
variation and self-paced movement paradigms in Parkinson. Movement Disorders,
14(4), 653-660.
Makin, T. R., Holmes, N. P., Brozzoli, C., Rossetti, Y., & Farnè, A. (2008). Hand-
centered visual representation of space: TMS evidence for early modulation of
motor cortex excitability. Journal of Vision, 8(6), doi: 10.1167/8.6.375
Manganotti, P., Gerloff, C., Toro, C., Katsuta, H., Sadato, N., Zhuang, P., Leocani, L., &
Hallett, M. (1998). Task-related coherence and task-related spectral power
changes during sequential finger movements. Electroencephalography and
Clinical Neurophysiology/Electromyography and Motor Control, 109(1), 50-62.
Mangun, G., & Hillyard, S. (1990). Allocation of visual attention to spatial locations:
Tradeoffs functions for event-related brain potentials and detection performance.
47(6), 532-550.
68
Massimini, M., Ferrarelli, F., Huber, R., Esser, S. K., Singh, H., & Tononi, G. (2005).
Breakdown of cortical effective connectivity during sleep. Science, (309), 2228-
2232.
Maunsell, J., & Treue, S. (2006). Feature-based attention in visual cortex. Trends in
Neuroscience, 29, 317-322.
McCourt, M.E., Jewell, G. (1999). Visuospatial attention in line bisection: Stimulus
modulation of pseudoneglect. Neuropsychologia, 37(7), 843–855.
McGlone, J., Davidson, W. (1973). The relation between cerebral speech laterality and
spatial ability with special reference to sex and hand preference.
Neuropsychologia, 11(1), 105–113.
Mesulam, M.M. (1990). Large-scale neurocognitive networks and distributed processing
for attention, language, and memory. [Review]. Annals of Neurology, 28, 597–
613.
Miller, B., & D'Esposito, M. (2005). Searching for 'the top' in top-down control. Neuron,
48, 535-538.
Mock, J. R., Foundas, A. L., & Golob, E. J. (2011). Selective influence of auditory
distractors on motor cortex excitability. Neuroreport, 22(16), 830-833. doi:
10.1097/WNR.0b013e32834bc6aa
Mulholland, T. (1995). Human EEG, behavioral stillness and biofeedback. International
Journal of Psychophysiology, 19, 263–279.
69
Naatanen, R., Paavilainen, P., Rinne, T., & Alho, K. (2007). The mismatch negativity
(MMN) in basic research of central auditory processing. Clinical
Neurophysiology, 118(12), 2544-2590.
Neubauer, A., Freudenthaler, H., & Pfurtscheller, G. (1995). Intelligence and
spatiotemporal patterns of event-related desynchronization
(ERD). Intelligence,20(3), 249-266.
Nikulin, V. V., Kičić , D., Kähkönen , S., & Ilmoniemi , R. J. (2003). Modulation of
electroencephalographic response to transcranial magnetic stimulation: evidence
for changes in cortical excitability related to movement. European Journal of
Neuroscience, (18), 1206-1212.
Oldfield, R. C. (1971). The assessment and analysis of handedness: The Edinburgh
inventory. Neuropsychologia, (9), 97-113.
Palmer, R. D. (1974). Dimensions of differentiation in handedness. Journal of Clinical
Psychology, (30), 545-552.
Palva, J., Palva, S., & Kaila, K. (2005). Phase synchrony among neuronal oscillations in
the human cortex. The Journal of Neuroscience, 25(15), 3962-3972.
Perelle, I. B., & Ehrman, L. (1994). An international study of human handedness: The
data. Behavioral Genetics, (24), 217-227.
Pesaran, B., Pezaris, J., Sahani, M., Mitra, P., & Andersen, S. (2002). Temporal structure
in neuronal activity during working memory in macaque parietal cortex. Nature
Neuroscience, 5, 805-811.
70
Pertides, M., Tomaiuolo, F., Yeterian, E., & Pandya, D. (2012). The prefrontal cortex:
Comparative architectonic organization in the human and the macaque monkey
brains. Cortex, 48(1), 46-57.
Pfurtscheller, G. (1992). Event-related synchronization (ERS): an electrophysiological
correlate of cortical areas at rest. Electroencephalography and Clinical
Neurophysiology, 83, 62-69.
Pfurtscheller, G., & Aranibar, A. (1979). Evaluation of event-related desynchronization
(ERD) preceding and following voluntary self-paced movement.
Electroencephalography and Clinical Neurophysiology, 46(2), 138-146.
Pfurtscheller, G., & Berghold, A. (1989). Patterns of cortical activation during planning
of voluntary movement. Electroencephalography and Clinical
Neurophysiology, 72(3), 250-258.
Pfurtscheller, G., Flotzinger, D., & Neuper, C. (1994). Differentiation between finger, toe
and tongue movement in man based on 40 Hz EEG. Electroencephalography and
Clinical Neurophysiology, 90(6), 456-460.
Pfurtscheller, G., Krausz, G., & Neuper, C. (2001). Mechanical stimulation of the
fingertip can induce bursts of [beta] oscillations in sensorimotor areas. Journal of
Clinical Neurophysiology, 18(6), 559-564.
Pfurtscheller , G., & Lopes da Silva, F. (1999). Functional meaning of event-related
desynchronization (ERD) and -synchronization (ERS). event-related
71
desynchronization and related oscillatory phenomena of the brain. Handbook of
Electroencephalography and Clinical Neurophysiology, 6, 51-66.
Pfurtscheller, G., & Lopes da Silva, F. (1999b). Event-related EEG/MEG synchronization
and desynchronization: Basic principles. Clinical Neurophysiology, 110, 1842-
1857.
Pfurtscheller, G., & Neuper, C. (1997). Motor imagery activates primary sensorimotor
area in humans. Neuroscience Letters, 239(2-3), 65-68.
Pfurtscheller, G., Stancak Jr, A., & Neuper, C. (1996). Event-related synchronization
(ERS) in the alpha band-an electrophysiological correlate of cortical idling: a
review. International Journal of Psychophysiology, 24, 39-46.
Pfurtscheller, G., Zalaudek, K., & Neuper, K. (1998). Episodic and semantic memory: An
analysis in the EEG theta and alpha band. Electroencephalography and Clinical
Neurophysiology/Electromyography and Motor Control, 109(2), 154-160.
Provins, K. A., & Cunliffe, P. (1972). Motor performance tests of handedness and
motivation. Perceptual Motor Skills, (35), 143-150.
Reiss, M., Tymnik, G., Kogler, P., & Kogler, W. (1999). Laterality of hand, foot, eye,
and ear in twins. Laterality: Asymmetries of Body, Brain and Cognition, 4(3),
287-297.
Reynolds , J., & Chelazzi, L. (2004). Attentional modulation of visual processing. Annual
Review of Neuroscience, 27, 611-647.
72
Rizzolatti G., Fadiga L., Fogassi L., Gallese V. (1997). The Space Around Us. Science,
(277), 190–191.
Rose, M., Sommer, T., & Büchel, C. (2006). Integration of local features to a global
percept by neural coupling. Cerebral Cortex, 16, 1522-1528.
Rosler, K. M. (2001). Transcranial magnetic brain stimulation: A tool to investigate
central motor pathways. News Physiological Science, (16), 297-302.
Salthouse, T. (1996). The processing-speed theory of adult age differences in cognition.
Psychological Review, 103(3), 403-428.
Serino, A., Annella, L., & Avenanti, A. (2009). Motor properties of peripersonal space in
humans. PLoS One, 4(8), 1-8.
Salenius, S., Schnitzler, A., Salmelin, R., Jousmaki, V., & Hari, R. (1997). Modulation of
human cortical Rolandic rhythms during natural sensorimotor tasks.
NeuroImage, 5(3), 221-228.
Salmelin, R., Hamaalainen, M., Kajola, M., & Hari, R. (1995). Functional segregation of
movement-related rhythmic activity in the human brain. NeuroImage,2(4), 237-
243.
Sato, M., Tremblay, P., & Gracco, V. (2009). A mediating role of the premotor cortex in
phoneme segmentation. Brain and Language, 111(1), 1-7.
Schroger, E., & Wolff, C. (1998). Attentional orienting and reorienting is indicated by
human event-related brain potentials. Neuro Report, 9(15), 3335-3358.
73
Searleman, A. (1980). Subject variables and cerebral organization for
language. Cortex, 16(2), 239-254.
Sokolov, E. (1963). Higher nervous functions: The orienting reflex. Annual Review of
Physiology, 25, 545-580.
Solodkin, A., Hlustik, P., Noll, D. C., & Smal, S. L. (2001). Lateralization of motor
circuits and handedness during finger movements. European Journal of
Neurology, 8(5), 425-434.
Stancak, A., & Pfurtscheller, G. (1996). Event-related desynchronisation of central beta-
rhythms during brisk and slow self-paced finger movements of dominant and
nondominant hand. Cognitive Brain Research, 4(3), 171-183.
Steinmetz, H. (1996). Structure, function and cerebral asymmetry: In vivo morphometry
of the planum temporale. Neuroscience & Biobehavioral Reviews, 20(4), 587-
591.
Steriade, M., & Llinas, R. (1988). The functional states of the thalamus and the
associated neuronal interplay. Physical Review, 68, 649-742.
Strauss, E. (1986). Hand, foot, eye and ear preferences and performance on a dichotic
listening test. Cortex, 22(3), 475-482.
Takemi, M., Masakado, Y., Liu, M., & Ushiba, J. (2013). Event-related
desynchronization reflects down-regulation of intracortical inhibition in human
primary motor cortex. Journal of Neurophysiology, Retrieved from
http://jn.physiology.org/content/early/2013/06/07/jn.01092.2012.abstract
74
Taylor, P. C., Walsh, V., & Eimer, M. (2008). Combining TMS and EEG to study
cognitive function and cortico-cortico interactions. Behavioral Brain Resolution,
(191), 141-147.
Thatcher, R. W., Walker, R. A., Gerson, I., & Geisler, F. H. (1989). EEG discriminant
analyses of mild head trauma. Electroencephalography and Clinical
Neurophysiology, 73(2), 94-106.
Thut, G., Nietzel, A., Brandt, S., & Pascual-Leone, A. (2006). α-band
electroencephalographic activity over occipital cortex indexes visuospatial
attention bias and predicts visual target detection. The Journal of
Neuroscience, 26(37), 9494-9502.
Tremblay, M., Stevens, B., Sierra, A., Wake , H., Bessis, A., & Nimmerjahn, A. (2011).
The role of microglia in the healthy brain. The Journal of Neuroscience, 31(45),
16064-16069.
Triggs, W. J., Calvanio, R., Macdonell, R. A. L., Cros, D., & Chiappa, K. H. (1994).
Physiological motor asymmetry in human handedness: Evidence from transcranial
magnetic stimulation. Brain Research, (63b), 270-276.
Van den Broek, S. P., Reinders, F., Donderwinkel, M., & Peters, M. J. (1998). Volume
conduction effects in EEG and MEG. Electroencephalography and Clinical
Neurophysiology, 106(6), 522-534.
75
Van Winsum, W., Sergeant, J., & Geuze, R. (1984). The functional significance of event-
related desynchronization of alpha rhythm in attentional and activating tasks .
Electroencephalography and Clinical Neurophysiology, 58(6), 519-524.
Vogel, J.J., Bowers, C.A., Vogel, D.S. (2003). Cerebral lateralization of spatial abilities:
a meta-analysis. Brain and Cognition, 52(2), 197–204.
Volkmann, J., Schnitzler, A., Witte, O., & Freund, H. (1998). Handedness and
asymmetry of hand representation in human motor cortex. Journal of
Neurophysiology, 79(4), 2149-2154.
Welsh, T. N. (2011). The relationship between attentional capture and deviations in
movement trajectories in a selective reaching task. Acta Psychologica, (137), 300-
308.
Wijers, A., Mulder, G., Gunter, C., & Smid, G. (1996). Chapter 9 brain potential analysis
of selective attention. Handbook of Perception and Action, 3, 333-387.
Williams, D., Kühn, A.A., Kupsch, A., Tijssen, M., Van Bruggen, G., Speelman, H., et
al. (2003). Behavioural cues are associated with modulations of synchronous
oscillations in the human subthalamic nucleus. Brain, 126, 1975–85.
Womelsdorf, T., & Fries, P. (2006). Neuronal coherence during selective attentional
processing and sensory–motor integration. Journal of Physiology-Paris, 100(4),
182-193.

76