Embed Size (px)
Citation preview
Master`s Thesis
Department: Master’s Programme in Geology and Geophysics
Subject: Petrology and Economic Geology
The distribution of talc within the Kevitsa Ni-Cu-PGE mine, Finland
Isabel Catriona McDonald
December 2020
HELSINGIN YLIOPISTO
MATEMAATTIS-LUONNONTIETEELLINEN TIEDEKUNTA
PL 64 (Gustaf Hällströmin katu 2)
00014 Helsingin yliopisto
Tiedekunta/Osasto Fakultet/Sektion – Faculty
Faculty of Science
Koulutusohjelma – Degree programme
Master’s Programme in Geology and Geophysics
Tekijä/Författare – Author Isabel Catriona McDonald
Työn nimi / Arbetets titel – Title The distribution of talc within the Kevitsa Ni-Cu-PGE mine, Finland
Opintosuunta/Studieinriktning – Study Strack
Petrology and Economic Geology
Työn laji/Arbetets art – Level
Master’s Thesis
Aika/Datum – Month and year
12/2020
Sivumäärä/ Sidoantal – Number of pages
68
Tiivistelmä/Referat – Abstract
Talc is a problematic alteration mineral at the Kevitsa Ni-Cu-(PGE) mine in Sodankylä, Finland, and its distribution and control were assessed in this thesis. Kevitsa is a polymetallic mine hosted in an ultramafic intrusion, extracting Ni, Cu, Co, Au, Pt and Pd, which are of increasing importance in green energy technologies. Talc – a common alteration product in ultramafic rocks – detrimentally interferes with the recovery of copper in the flotation stage of ore processing when concentrations exceed 5 wt. %, thus affecting the economics of mine operations. It was found different talc concentrations had different spatial associations and controls, with three dominant styles identified, and a multi-stage genesis of talc alteration is proposed. The talc styles identified in the study are as follows: (style 1) pervasive talc-chlorite alteration, (style 2) talc-dolomite alteration haloes proximal to dolomite veins and (style 3) talc on brittle structures, associated with magnetite. Low values of talc between 0.2-0.5 wt.% (style 1) were found to have no preferential spatial distribution, occurring as background alteration throughout the intrusion. Intermediate values (between 1-5 wt. %) were associated with late brittle fractures and structures (style 3), with a notable association with the NE-flt-rv1 fault zone. Style (2) was found to have a dominant structural control, specifically being associated with north-south trending structures. Dominant structures with this association identified are NS-flt1_flt-002 and NS-flt-2_flt-009. Highest values (commonly exceeding >10 wt. %) manifest themselves as alteration haloes proximal to veins, where talc-carbonate replaces the intercumulus mineral phases. Here it is proposed that ‘low talc’ alteration, style (1), was the first talc association to occur, generated by late magmatic fluids or regional metamorphism accompanying amphibole and serpentine alteration. The association observed as style (2) was likely generated by the infilling of north-south trending structures by carbonate-talc veins through metasomatism by a CO2 rich metamorphic fluid, perhaps delivered by a deep-seated structure, often generating talc values in excess of 10 wt.%. The third stage is proposed to be talc enrichment via meteoric fluid percolation, after exhumation. This generated talc along brittle structures associated with magnetite style (3), and talc-carbonate concentrations may also be upgraded at this stage. Further enrichment of talc is observed at the surface, attributed to freeze thaw-cycles of permafrost upgrading talc values. The identification of these processes and controls on talc will not only have implications for the economics of Kevitsa as high talc zones can be avoided, but findings may have useful applications for mining of similar deposits in the Central Lapland Greenstone belt such as the nearby Sakatti Cu-Ni-(PGE) project, when it enters production.
Avainsanat – Nyckelord – Keywords Kevitsa, ore geology, mamgatic Ni-Cu-PGE deposits, ultramafic intrusions, Central Lapland Greenstone Belt, alteration, talc
Säilytyspaikka – Förvaringställe – Where deposited HELDA – Digital Repository of the University of Helsinki
Muita tietoja – Övriga uppgifter – Additional information
This thesis was written in collaboration with Boliden Kevitsa Mining Oy and the University of Helsinki.
CONTENTS
1. Introduction ................................................................................................................... 3
1.1. Aims and Objectives ............................................................................................... 5
2. Background ................................................................................................................... 5
2.1 Magmatic Ni-Cu-(PGE) deposits ............................................................................ 5
2.1.1 Kevitsa Deposit Style ........................................................................................ 7
2.2 Talc as an Alteration Mineral .................................................................................. 8
3. Geological Setting ......................................................................................................... 9
3.1 Regional Geology .................................................................................................... 9
3.2 Local Geology – The Geology of Kevitsa ............................................................. 11
3.2.1 Kevitsa Mineralogy, Ore Style ........................................................................ 13
3.2.2 Kevitsa Alteration ........................................................................................... 15
3.3 Genetic Models Applied to Kevitsa ...................................................................... 15
3.4 Structural Models developed for Kevitsa .............................................................. 18
4. Materials and Methods ................................................................................................ 22
4.1 Materials ................................................................................................................ 22
4.2 Methods: Leapfrog Interpretation .......................................................................... 24
4.2.1 Talc, vein, and core photograph review .......................................................... 24
4.2.2 XRD Visualisation in Leapfrog Geo ............................................................... 27
4.2.3 Volume build of structural features ................................................................. 28
4.2.4 Contact Analysis ............................................................................................. 28
5. Results ......................................................................................................................... 30
5.1 Talc Distribution at the Kevitsa Deposit ............................................................... 30
5.2 Talc Associations ................................................................................................... 36
5.2.1 Talc-carbonate associations ............................................................................ 36
5.2.2 Brittle structures with related talc. .................................................................. 40
5.2.3 Near surface talc enrichment ........................................................................... 41
5.2.4 Talc chlorite magnetite veinlets ...................................................................... 42
5.2.5 Background talc .............................................................................................. 44
5.2.6 Talc and clay on joint planes ........................................................................... 45
5.3 Talc enrichment relative to faults .......................................................................... 46
5.3.1 Contact Analysis NS-flt-1_flt-002 .................................................................. 46
5.3.2 Contact Analysis NS-flt-2_flt-009 .................................................................. 49
6. Discussion ................................................................................................................... 53
6.1 Background Talc ................................................................................................... 54
6.2 Talc-carbonate assemblages .................................................................................. 55
6.3 Brittle talc .............................................................................................................. 56
6.4 Multi-stage talc generation .................................................................................... 57
7. Recommendations ....................................................................................................... 59
8. Conclusions ................................................................................................................. 59
Acknowledgements ......................................................................................................... 61
REFERENCES ............................................................................................................... 61
Abbreviations
CLGB: Central Lapland Greenstone Belt
DD: Diamond drill-cores
GTK: Geologian tutkimuskeskus (Geological Survey of Finland
MRE: Mineral resource estimate
NSTE: Near surface talc enrichment
PGEs: Platinum-group elements
RC: Reverse-circulation drillholes
RQD: Rock quality designation (degree of jointing)
XRD: X-ray diffraction
3
1. Introduction
Kevitsa is an operating polymetallic mine extracting Ni, Cu, Co, Au, Pt and Pd from an
ultramafic intrusion, located 140 km north of the arctic circle in Finnish Lapland near
Sodankylä, and is ‘one of the largest ever mineral discoveries in Finland’ (Gregory et al.
2011, Boliden 2020). The intrusion, dated at 2058 ± 4 Ma (Mutanen 1997, Mutanen and
Huhma 2001, LeVaillant et al. 2017) is a magmatic Ni-Cu-(PGE) deposit hosted in the
Central Lapland Greenstone Belt (CLGB), a highly prospective area with other notable
deposits being the Sakatti Cu-Ni-PGE prospect in the pre-feasibility stage
(AngloAmerican 2020) and Kittilä, currently the biggest active Au mine in Europe
(Agnico Eagle 2020). The Kevitsa deposit was discovered in 1987 by the Finnish
Geological Survey (GTK) through geophysical methods and mapping as described in
Mutanen (1997). Extensive geophysical and drilling data acquisition has been performed
since discovery by the GTK, Outokumpu Ltd, Scandinavian Minerals, First Quantum
Minerals Ltd and Boliden Kevitsa FinnEx/Mining Oy (Santaguida et al. 2015, SRK
2019). Production began in 2012 while under ownership by First Quantum Minerals Ltd
(Santaguida et al. 2015), and the resources mined from Kevitsa are currently forecast to
last until 2030 (SRK 2019). Boliden acquired the project in 2016. The 2019 Mineral
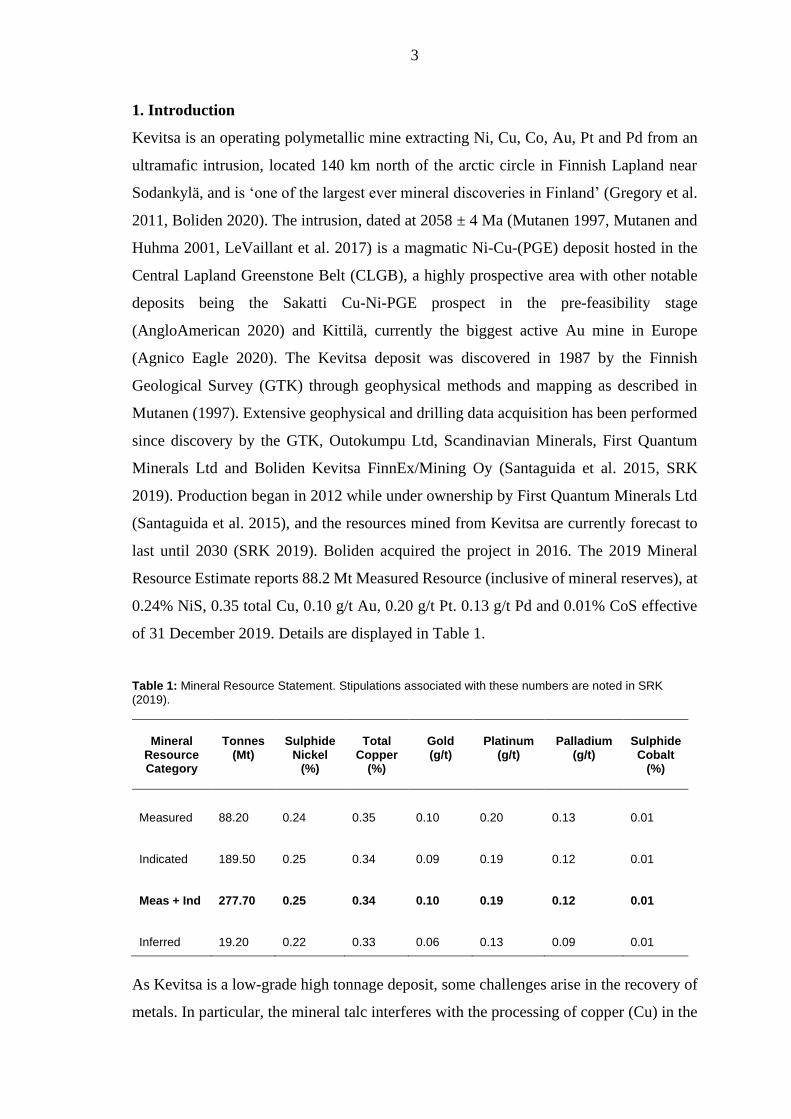
Resource Estimate reports 88.2 Mt Measured Resource (inclusive of mineral reserves), at
0.24% NiS, 0.35 total Cu, 0.10 g/t Au, 0.20 g/t Pt. 0.13 g/t Pd and 0.01% CoS effective
of 31 December 2019. Details are displayed in Table 1.
Table 1: Mineral Resource Statement. Stipulations associated with these numbers are noted in SRK (2019).
Mineral
Resource Category
Tonnes
(Mt)
Sulphide
Nickel (%)
Total
Copper (%)
Gold (g/t)
Platinum
(g/t)
Palladium
(g/t)
Sulphide Cobalt
(%)
Measured 88.20 0.24 0.35 0.10 0.20 0.13 0.01
Indicated 189.50 0.25 0.34 0.09 0.19 0.12 0.01
Meas + Ind 277.70 0.25 0.34 0.10 0.19 0.12 0.01
Inferred 19.20 0.22 0.33 0.06 0.13 0.09 0.01
As Kevitsa is a low-grade high tonnage deposit, some challenges arise in the recovery of
metals. In particular, the mineral talc interferes with the processing of copper (Cu) in the
4
flotation process, reducing Cu recovery from 90% to 83% in the presence of 7% talc
(Farrokhpay et al. 2018). At present, high talc ores, containing talc up to 30% are
stockpiled separately and processed in batches as the high amount of talc reduces copper
recovery at Kevitsa by up to 4% (SRK 2019). Assessing the distribution of talc - and
geological ‘processes and structures’ responsible for delivering talc or forming talc in situ
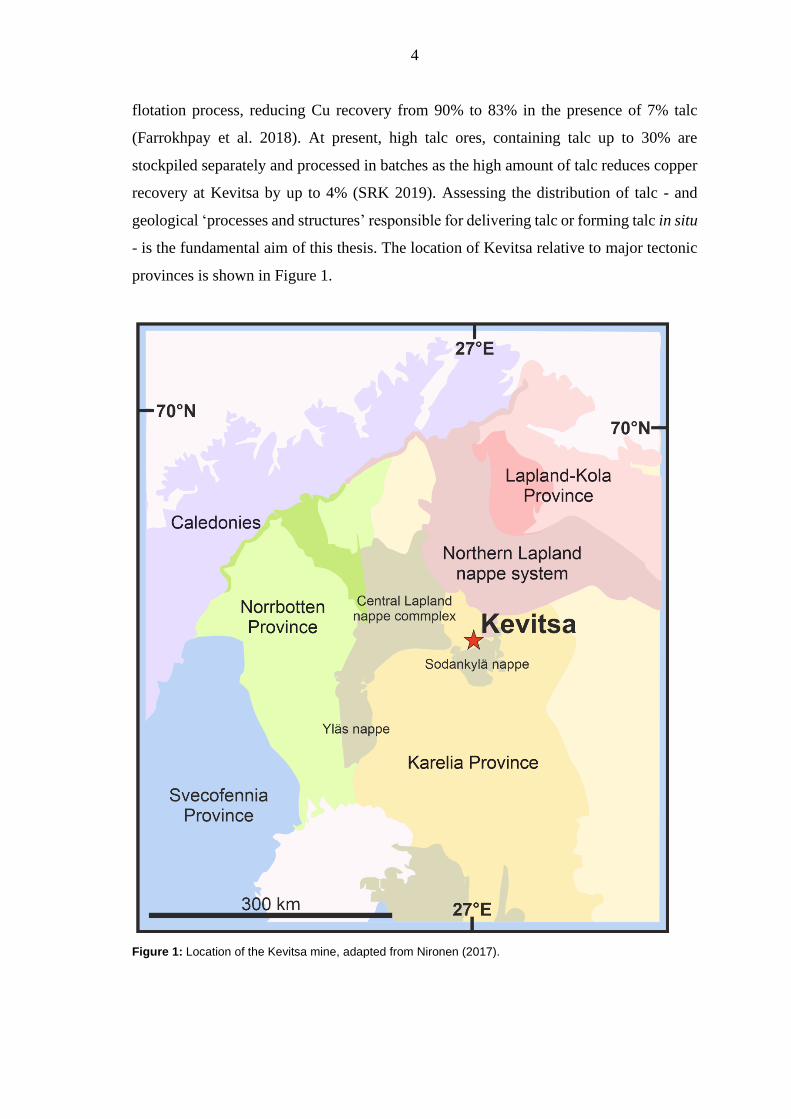
- is the fundamental aim of this thesis. The location of Kevitsa relative to major tectonic
provinces is shown in Figure 1.
Figure 1: Location of the Kevitsa mine, adapted from Nironen (2017).
5
1.1. Aims and Objectives
The controls on the distribution of talc and its impact directly on ore recovery are not
currently clear. As talc is a common alteration product in ultramafic rocks, associated
with serpentinisation and carbonatisation (Bjerga et al. 2015) identifying objects
responsible for delivering talc, i.e. channel-ways for alteration such as faults and other
features, is critical. Although faults are well suited as alteration fluid conduits (Naldrett
1966), it is also worth considering natural weathering as one possible source of talc.
Furthermore, magmatic fluids sourced from past intrusions or dykes, and/or pervasive
pore fluid movement may be responsible for a general background presence of talc.
There are a number of notable structures crossing the Kevitsa pit which may have some
control on the distribution of talc. It is therefore of key importance to identify the nature
of these different structures and identify any potential correlation with talc enrichment
and talc distribution, as prior internal research has also concluded (Kokko 2018).
The key research questions of this study are as follows:
• What is the distribution of talc across the Kevitsa intrusion?
• Is talc structurally controlled?
• What are the main fault characteristics and classes?
• If faults deliver talc, which generations or types of faults are associated with
talc?
Studying the presence and characteristics of talc alteration at Kevitsa will help to better
understand why, when and how talc forms around ultramafic-hosted deposits, and may
increase understanding of these mechanisms in similar deposits such as the Sakatti
prospect, thus having implications for other ultramafic-hosted mining operations in
Fennoscandia.
2. Background
2.1 Magmatic Ni-Cu-(PGE) deposits
Kevitsa is a magmatic Ni-Cu-(PGE) deposit, which is a subclass of magmatic sulphide
deposits (Naldrett 2010b, Herrington 2011) accounting for a broad classification of ore
deposits which contain Ni, Cu and PGEs. These deposits are orthomagmatic, whereby
mineralisation is formed primarily via magmatic processes (Herrington 2011). This
greater deposit class is responsible for 56% of Ni (the remainder being hosted in lateritic
6
deposits) and 96% of PGE resources globally (Lu et al. 2019) making them the most
important source of Ni and PGEs, as well as being a significant source of associated Cu
(Howell et al. 2017). Finland is highly prospective for these deposits (Makkonen et al.
2017). Magmatic sulphide deposits have a distinct spatial distribution, associated with
Archean cratons (Maier and Groves 2011).
Supercontinent cycles and secular changes in ore deposit patterns are known (Cawood &
Hawkesworth 2015, Pehrsson et al. 2016), with magmatic deposits being inherently
linked to the Nuna supercontinent cycle (Pehrsson et al. 2016). Mineralisation in these
deposits is hosted in sulphides, primarily pyrrhotite, pentlandite, and chalcopyrite – these
same sulphides comprise the normal ore at Kevitsa (Le Vaillant et al. 2017) – and is
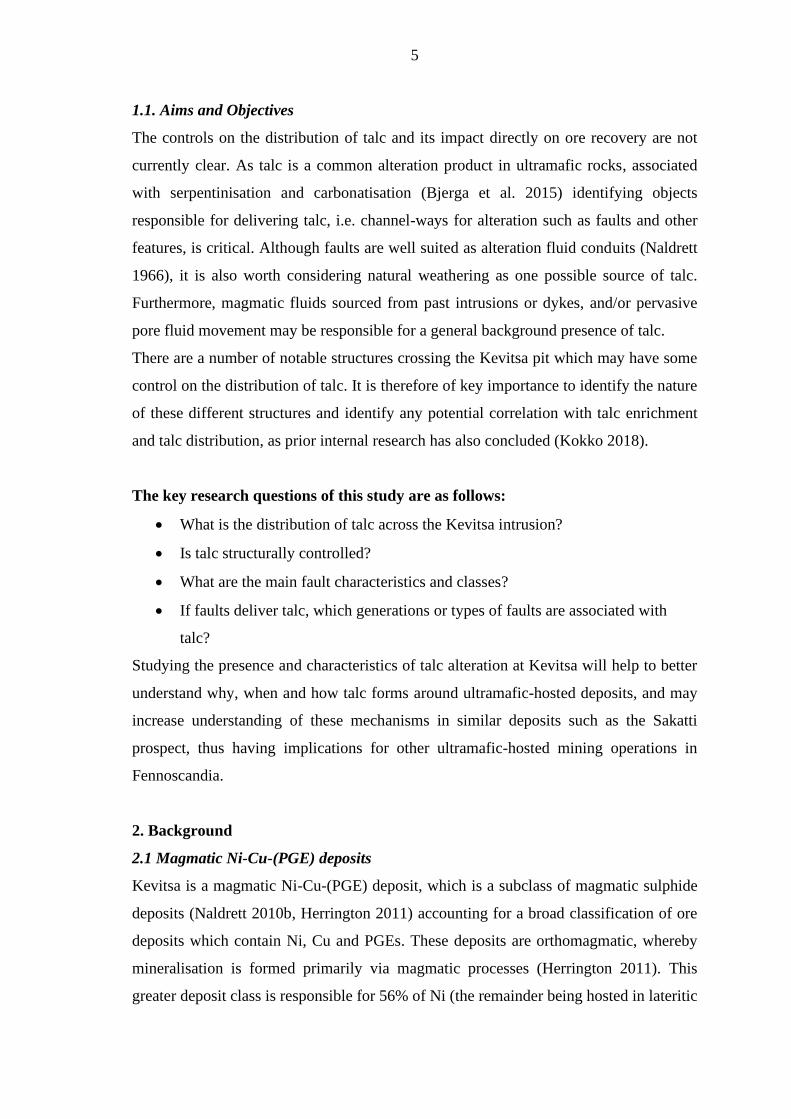
associated with mafic to ultramafic rocks (Maier & Groves 2011). The host intrusions of
magmatic Ni-Cu deposits are generally small (10-100 metres), and irregularly shaped,
while PGE deposits occur in larger (km-100s of km), more uniformly shaped intrusions
(Maier and Groves 2011). The ore itself can occur at the base, the roof, or hosted within
the intrusion (see Figure 2).
Figure 2: Models for a) PGE and b) nickel deposits. Although Kevitsa is classified as a magmatic Ni-Cu deposit as shown in b), it bears similarities to a), and likely lies in a continuum between these two models.
Adapted from Maier and Groves (2011).
The ultramafic magma in the ‘host intrusion’ has to be appropriately saturated in sulphur
to generate ore bearing sulphides. Mechanisms that promote sulphur saturation include
magma mixing, high pressures, contamination of a relatively Si-rich magma, or
assimilation of sulphur or silica from country rocks (Naldrett 2010a). The various stages
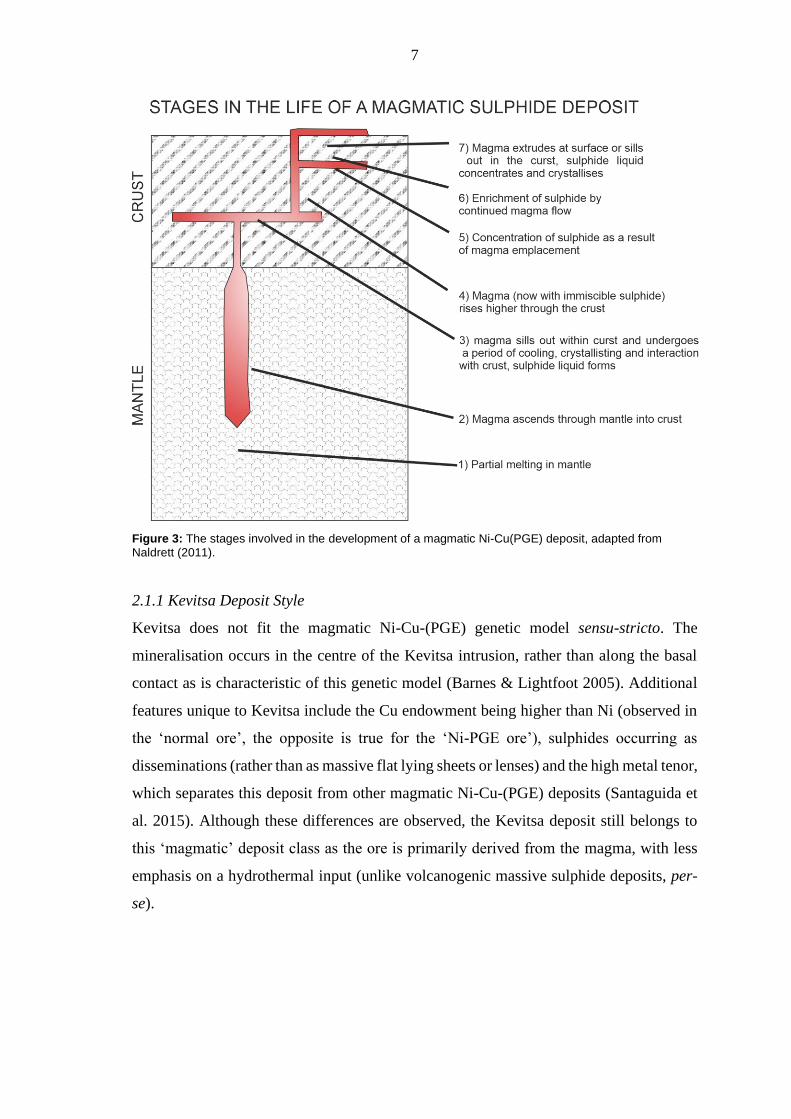
involved in the generation of a magmatic sulphide deposit are depicted in Figure 3.
7
Figure 3: The stages involved in the development of a magmatic Ni-Cu(PGE) deposit, adapted from Naldrett (2011).
2.1.1 Kevitsa Deposit Style
Kevitsa does not fit the magmatic Ni-Cu-(PGE) genetic model sensu-stricto. The
mineralisation occurs in the centre of the Kevitsa intrusion, rather than along the basal
contact as is characteristic of this genetic model (Barnes & Lightfoot 2005). Additional
features unique to Kevitsa include the Cu endowment being higher than Ni (observed in
the ‘normal ore’, the opposite is true for the ‘Ni-PGE ore’), sulphides occurring as
disseminations (rather than as massive flat lying sheets or lenses) and the high metal tenor,
which separates this deposit from other magmatic Ni-Cu-(PGE) deposits (Santaguida et
al. 2015). Although these differences are observed, the Kevitsa deposit still belongs to
this ‘magmatic’ deposit class as the ore is primarily derived from the magma, with less
emphasis on a hydrothermal input (unlike volcanogenic massive sulphide deposits, per-
se).
8
2.2 Talc as an Alteration Mineral
Talc, chemical formula Mg3Si4O10(OH)2, is a common alteration mineral in ultramafic
rocks, alongside amphiboles, carbonate- and serpentine-group minerals. Alteration styles
related to talc, carbonates and serpentine commonly occur together as a result of CO2 rich
fluids reacting with the rock (Power et al. 2013).
There are two dominant reactions which produce talc:
1. Hydration and Carbonatisation, Equations 1 and 2 (Hansen et al. 2005, Kelemen &
Hirth 2012, Power et al. 2013).
Serpentine + carbon dioxide → talc + magnesite + water
(1)
Olivine + aqueous fluid + dissolved carbon dioxide in fluid → talc + magnesite
𝑀𝑔2𝑆𝑖𝑂4(𝑂𝐻)4 + 𝐻2𝑂 + 5𝐶𝑂2 → 𝑀𝑔3𝑆𝑖4𝑂10(𝑂𝐻)2 + 5𝑀𝑔𝐶𝑂3 (2)
2. Via a reaction between dolomite and silica which is typical of skarnification of
dolomites by silica-flooding in contact metamorphic aureoles, Equation 3 (Robb 2005).
Dolomite + silica + water → talc + calcite + carbon dioxide
(3)
As observed in the equations above, the production of talc-carbonate and serpentine from
ultramafic rocks is largely isochemical (Bjerga et al. 2005 and references therein),
however, significant occurrences of carbonate alteration generally represents a separate
hydrothermal event (Naldrett 1966), producing talc–magnesite and magnesite– quartz
assemblages (Power et al. 2013). Metasomatic processes involving CO2 rich fluids in
prograde metamorphism can generate talc-chlorite assemblages (commonly associated
with serpentine and amphibole group minerals), and retrograde greenschist-facies
metamorphism is also known to promote talc generation (Spandler et al. 2008).
3𝐶𝑎𝑀𝑔(𝐶𝑂3)2 + 4𝑆𝑖𝑂2 + 𝐻2𝑂 → 𝑀𝑔3𝑆𝑖4𝑂10(𝑂𝐻)2 + 3𝐶𝑎𝐶𝑂3 + 3𝐶𝑂2
2𝑀𝑔3𝑆𝑖𝑂5(𝑂𝐻)4 + 3𝐶𝑂2 → 𝑀𝑔3𝑆𝑖4𝑂10(𝑂𝐻)2 + 3𝑀𝑔𝐶𝑂3 + 3𝐻2𝑂
9
3. Geological Setting
3.1 Regional Geology
Kevitsa is hosted in the Central Lapland Greenstone Belt (CLGB), which is a highly
prospective area for magmatic Ni-Cu-(PGE) deposits, and is underexplored for gold
deposits (Niiranen et al. 2015). The CLGB has been compared to other prospective
greenstone belts such as the Norseman-Wiluna, Abitibi, and Zimbabwe Craton
greenstone belts (Niiranen et al. 2015) It comprises part of a larger greenstone belt
extending into Norway, and records 500 Ma of geological activity culminating in
deformation at 1.9 Ga. (Hanski and Huhma 2005). The CLGB is comprised of three sub
terrains, the Pulju belt, the Kuusamo-Salla belt and the Kolari-Kittilä-Sodankylä belt, the
latter of which Kevitsa is hosted within (Makkonen et al. 2017). A number of
metalliferous deposits occur in the CLGB, the positions of which are shown below in
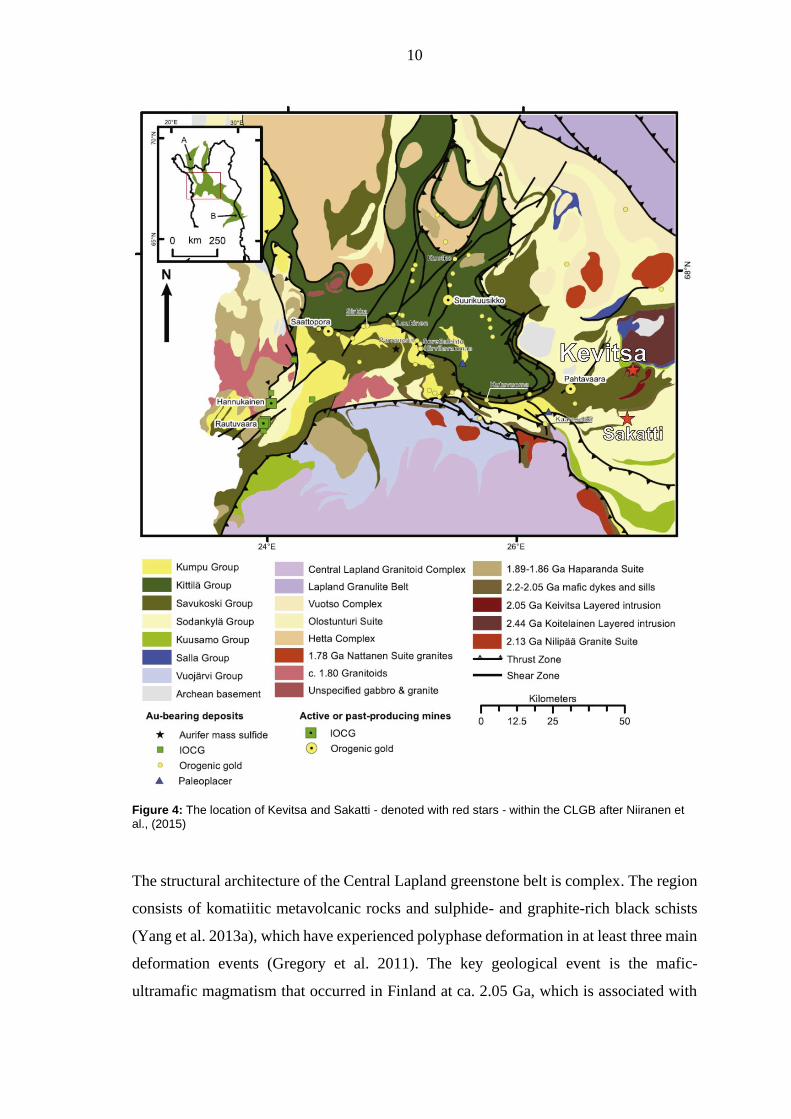
Figure 4.
10
Figure 4: The location of Kevitsa and Sakatti - denoted with red stars - within the CLGB after Niiranen et al., (2015)
The structural architecture of the Central Lapland greenstone belt is complex. The region
consists of komatiitic metavolcanic rocks and sulphide- and graphite-rich black schists
(Yang et al. 2013a), which have experienced polyphase deformation in at least three main
deformation events (Gregory et al. 2011). The key geological event is the mafic-
ultramafic magmatism that occurred in Finland at ca. 2.05 Ga, which is associated with
11
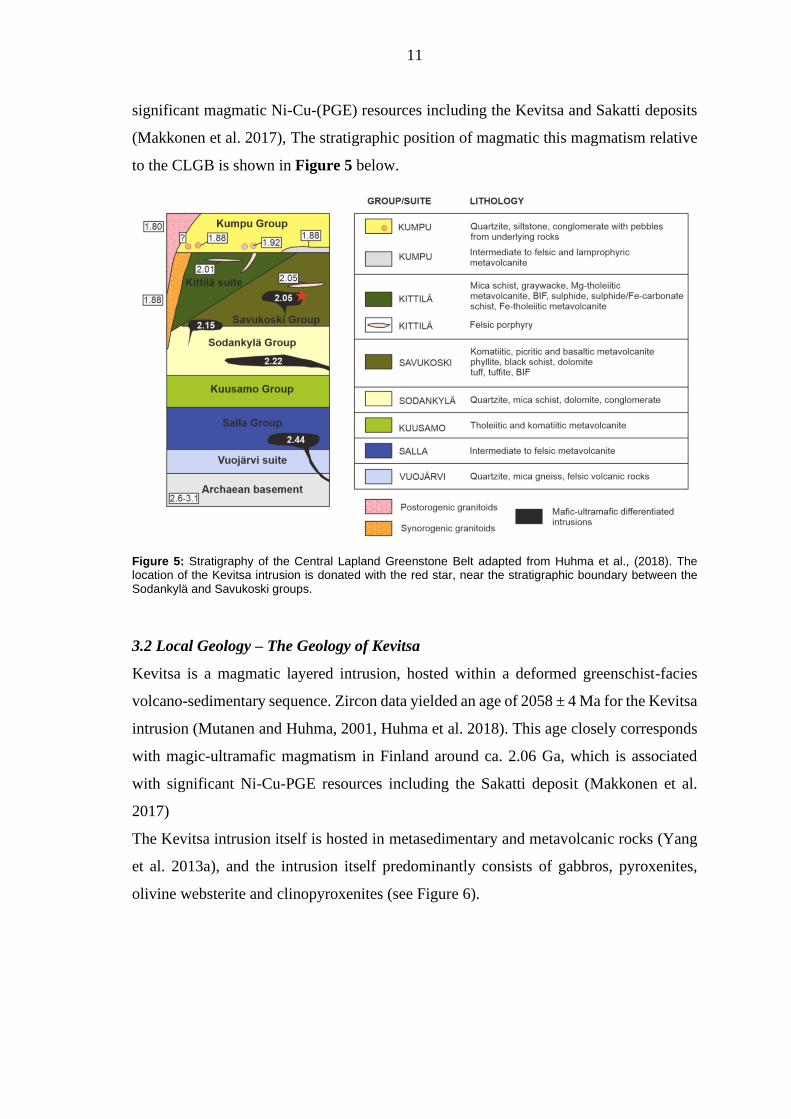
significant magmatic Ni-Cu-(PGE) resources including the Kevitsa and Sakatti deposits
(Makkonen et al. 2017), The stratigraphic position of magmatic this magmatism relative
to the CLGB is shown in Figure 5 below.
Figure 5: Stratigraphy of the Central Lapland Greenstone Belt adapted from Huhma et al., (2018). The location of the Kevitsa intrusion is donated with the red star, near the stratigraphic boundary between the Sodankylä and Savukoski groups.
3.2 Local Geology – The Geology of Kevitsa
Kevitsa is a magmatic layered intrusion, hosted within a deformed greenschist-facies
volcano-sedimentary sequence. Zircon data yielded an age of 2058 ± 4 Ma for the Kevitsa
intrusion (Mutanen and Huhma, 2001, Huhma et al. 2018). This age closely corresponds
with magic-ultramafic magmatism in Finland around ca. 2.06 Ga, which is associated
with significant Ni-Cu-PGE resources including the Sakatti deposit (Makkonen et al.
2017)
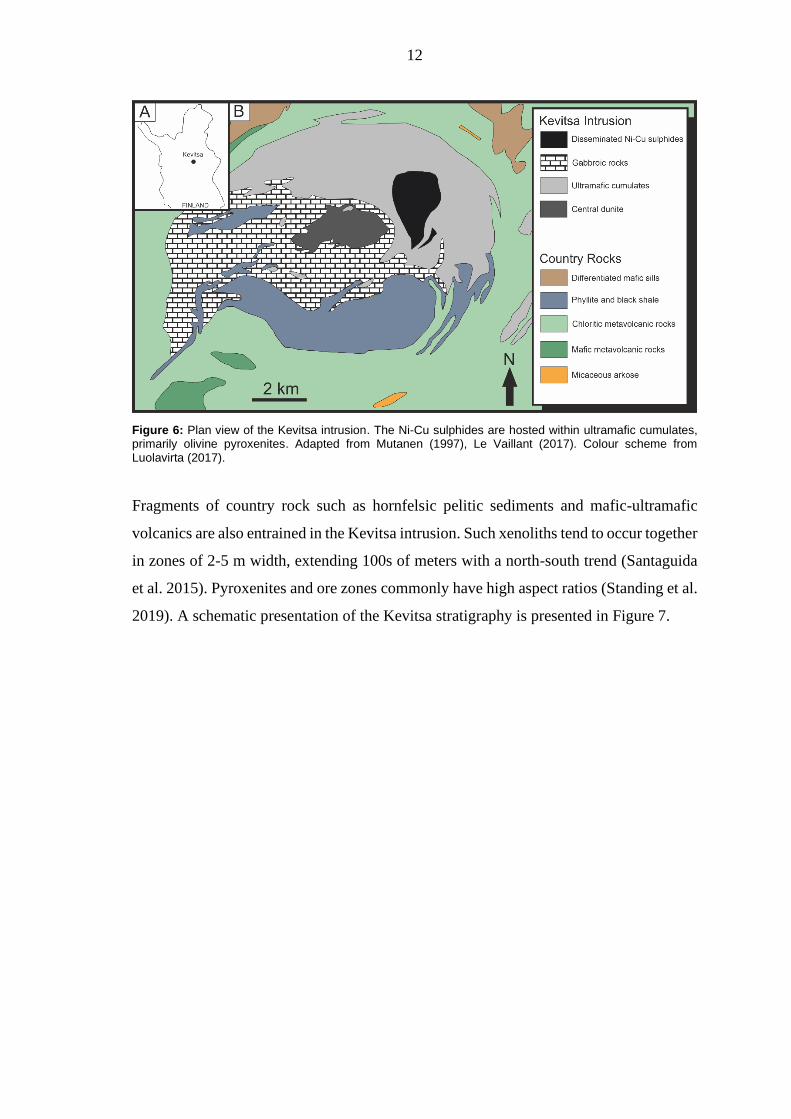
The Kevitsa intrusion itself is hosted in metasedimentary and metavolcanic rocks (Yang
et al. 2013a), and the intrusion itself predominantly consists of gabbros, pyroxenites,
olivine websterite and clinopyroxenites (see Figure 6).
12
Figure 6: Plan view of the Kevitsa intrusion. The Ni-Cu sulphides are hosted within ultramafic cumulates, primarily olivine pyroxenites. Adapted from Mutanen (1997), Le Vaillant (2017). Colour scheme from Luolavirta (2017).
Fragments of country rock such as hornfelsic pelitic sediments and mafic-ultramafic
volcanics are also entrained in the Kevitsa intrusion. Such xenoliths tend to occur together
in zones of 2-5 m width, extending 100s of meters with a north-south trend (Santaguida
et al. 2015). Pyroxenites and ore zones commonly have high aspect ratios (Standing et al.
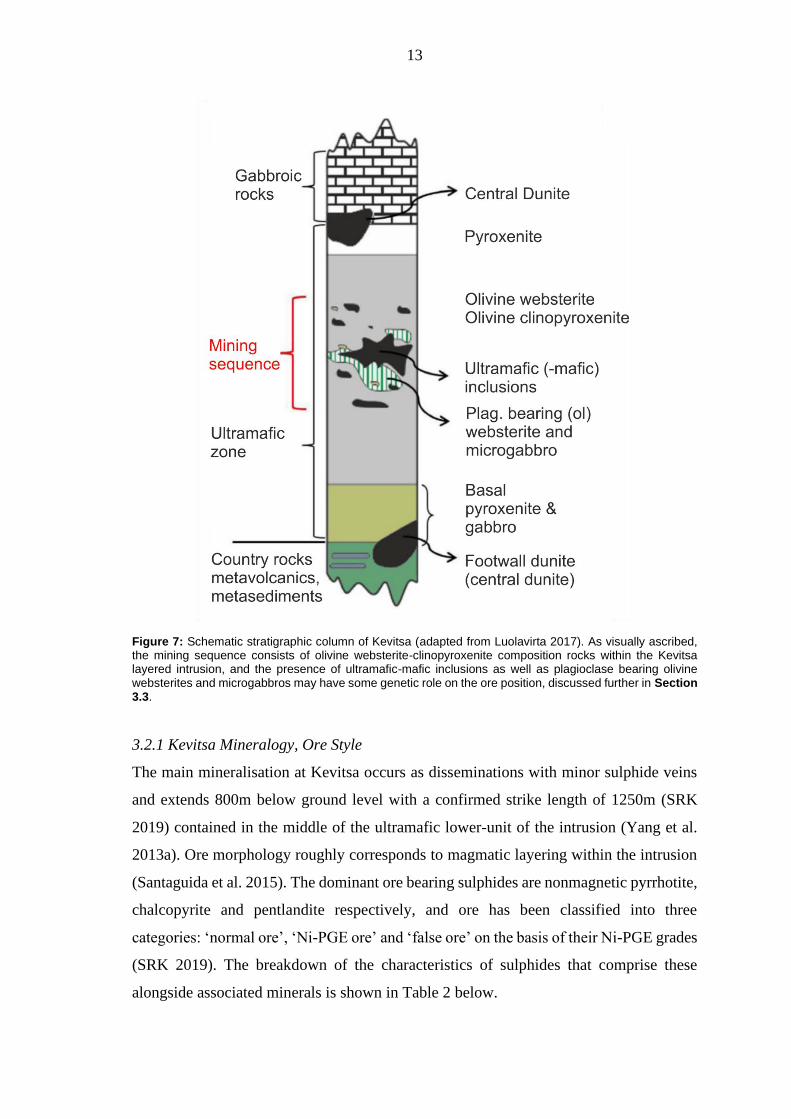
2019). A schematic presentation of the Kevitsa stratigraphy is presented in Figure 7.
13
Figure 7: Schematic stratigraphic column of Kevitsa (adapted from Luolavirta 2017). As visually ascribed, the mining sequence consists of olivine websterite-clinopyroxenite composition rocks within the Kevitsa layered intrusion, and the presence of ultramafic-mafic inclusions as well as plagioclase bearing olivine websterites and microgabbros may have some genetic role on the ore position, discussed further in Section 3.3.
3.2.1 Kevitsa Mineralogy, Ore Style
The main mineralisation at Kevitsa occurs as disseminations with minor sulphide veins
and extends 800m below ground level with a confirmed strike length of 1250m (SRK
2019) contained in the middle of the ultramafic lower-unit of the intrusion (Yang et al.
2013a). Ore morphology roughly corresponds to magmatic layering within the intrusion
(Santaguida et al. 2015). The dominant ore bearing sulphides are nonmagnetic pyrrhotite,
chalcopyrite and pentlandite respectively, and ore has been classified into three
categories: ‘normal ore’, ‘Ni-PGE ore’ and ‘false ore’ on the basis of their Ni-PGE grades
(SRK 2019). The breakdown of the characteristics of sulphides that comprise these
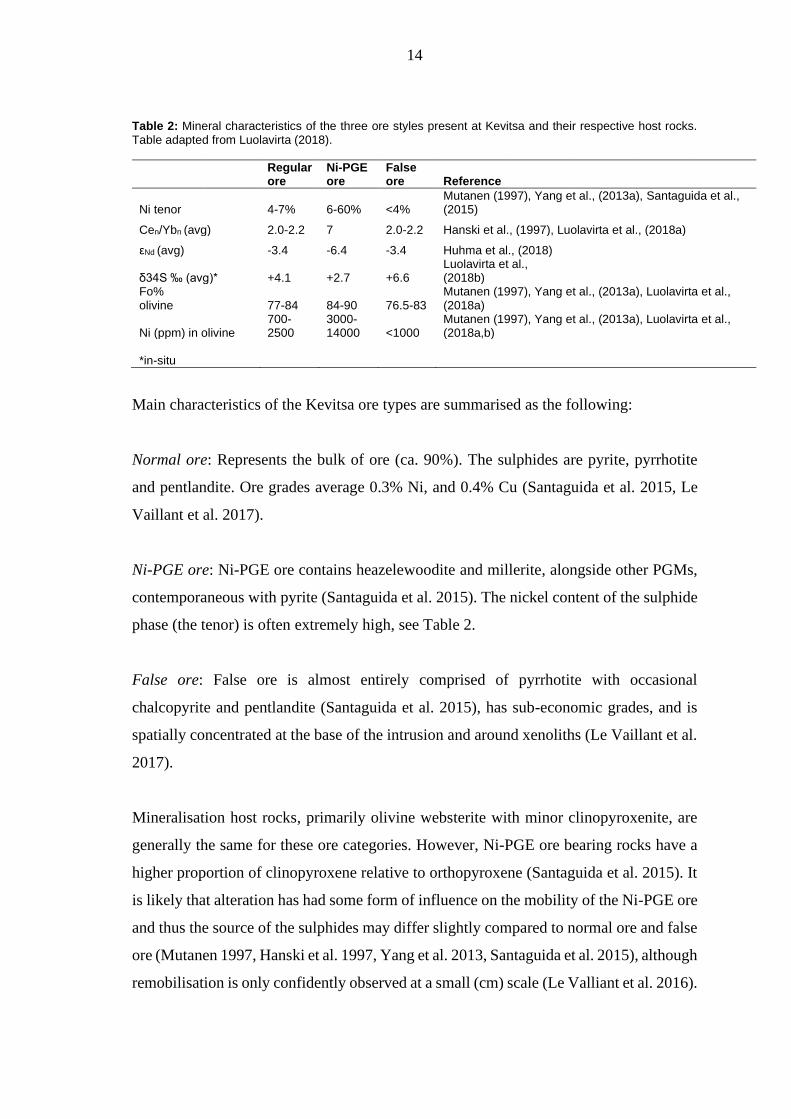
alongside associated minerals is shown in Table 2 below.
14
Table 2: Mineral characteristics of the three ore styles present at Kevitsa and their respective host rocks. Table adapted from Luolavirta (2018).
Regular ore
Ni-PGE ore
False ore Reference
Ni tenor 4-7% 6-60% <4% Mutanen (1997), Yang et al., (2013a), Santaguida et al., (2015)
Cen/Ybn (avg) 2.0-2.2 7 2.0-2.2 Hanski et al., (1997), Luolavirta et al., (2018a)
εNd (avg) -3.4 -6.4 -3.4 Huhma et al., (2018)
δ34S ‰ (avg)* +4.1 +2.7 +6.6 Luolavirta et al., (2018b)
Fo% olivine 77-84 84-90 76.5-83
Mutanen (1997), Yang et al., (2013a), Luolavirta et al., (2018a)
Ni (ppm) in olivine 700-2500
3000-14000 <1000
Mutanen (1997), Yang et al., (2013a), Luolavirta et al., (2018a,b)
*in-situ
Main characteristics of the Kevitsa ore types are summarised as the following:
Normal ore: Represents the bulk of ore (ca. 90%). The sulphides are pyrite, pyrrhotite
and pentlandite. Ore grades average 0.3% Ni, and 0.4% Cu (Santaguida et al. 2015, Le
Vaillant et al. 2017).
Ni-PGE ore: Ni-PGE ore contains heazelewoodite and millerite, alongside other PGMs,
contemporaneous with pyrite (Santaguida et al. 2015). The nickel content of the sulphide
phase (the tenor) is often extremely high, see Table 2.
False ore: False ore is almost entirely comprised of pyrrhotite with occasional
chalcopyrite and pentlandite (Santaguida et al. 2015), has sub-economic grades, and is
spatially concentrated at the base of the intrusion and around xenoliths (Le Vaillant et al.
2017).
Mineralisation host rocks, primarily olivine websterite with minor clinopyroxenite, are
generally the same for these ore categories. However, Ni-PGE ore bearing rocks have a
higher proportion of clinopyroxene relative to orthopyroxene (Santaguida et al. 2015). It
is likely that alteration has had some form of influence on the mobility of the Ni-PGE ore
and thus the source of the sulphides may differ slightly compared to normal ore and false
ore (Mutanen 1997, Hanski et al. 1997, Yang et al. 2013, Santaguida et al. 2015), although
remobilisation is only confidently observed at a small (cm) scale (Le Valliant et al. 2016).
15
3.2.2 Kevitsa Alteration
There are several styles of alteration that are observed in drill-core at Kevitsa. The
dominant phases known to occur proximal to or cross-cut mineralisation are
amphibolitisation, serpentinisation and epidotisation (Le Vaillant et al. 2016). Amphibole
alteration is the most widespread style, affecting olivine and pyroxene but preserving
original cumulate textures. Serpentine alteration is also relatively widespread and is often
associated with magnetite. Gervilla and Kojonen (2002) suggest serpentine alteration
upgraded the Ni sulphides and preserved original PGE concentrations delivered by
magmatic mineralisation. This alteration event is ascribed to be the first alteration event.
Epidote alteration is thought to be structurally controlled, associated with NE trending
faults, and is concentrated in the southern extension of the intrusion (Le Vaillant et al.
2017). Other alteration styles include actinolite-chlorite alteration and talc-carbonate
alteration. Gabbroic dykes cross cutting the intrusion often exhibit actinolite-chlorite
alteration (Santaguida et al. 2015). Talc-carbonate alteration is thought to indicate the
presence of CO2 bearing fluids and has been linked with ‘late’ fractures and veins (SRK
2019). The alteration occurs in a few styles, but mainly as pervasive alteration of
intercumulus minerals and as replacement of Fe-Mg minerals. The differing talc (±
carbonate) alteration styles are presented in Section 5.2. The Kevitsa Technical Report
2019 recognises a notable occurrence of talc-carbonate alteration at depth, “within and
around a flat-lying shear zone and composite quartz-carbonate reef” (SRK 2019, page
23).
3.3 Genetic Models Applied to Kevitsa
The formation of the Kevitsa mineralisation is somewhat enigmatic, with multiple studies
performed to explain the unusual ore distribution. The most recent study explaining the
formation of the deposit was performed by Luolavirta (2017). Prior models and their
conclusions are summarised in Table 3.
16
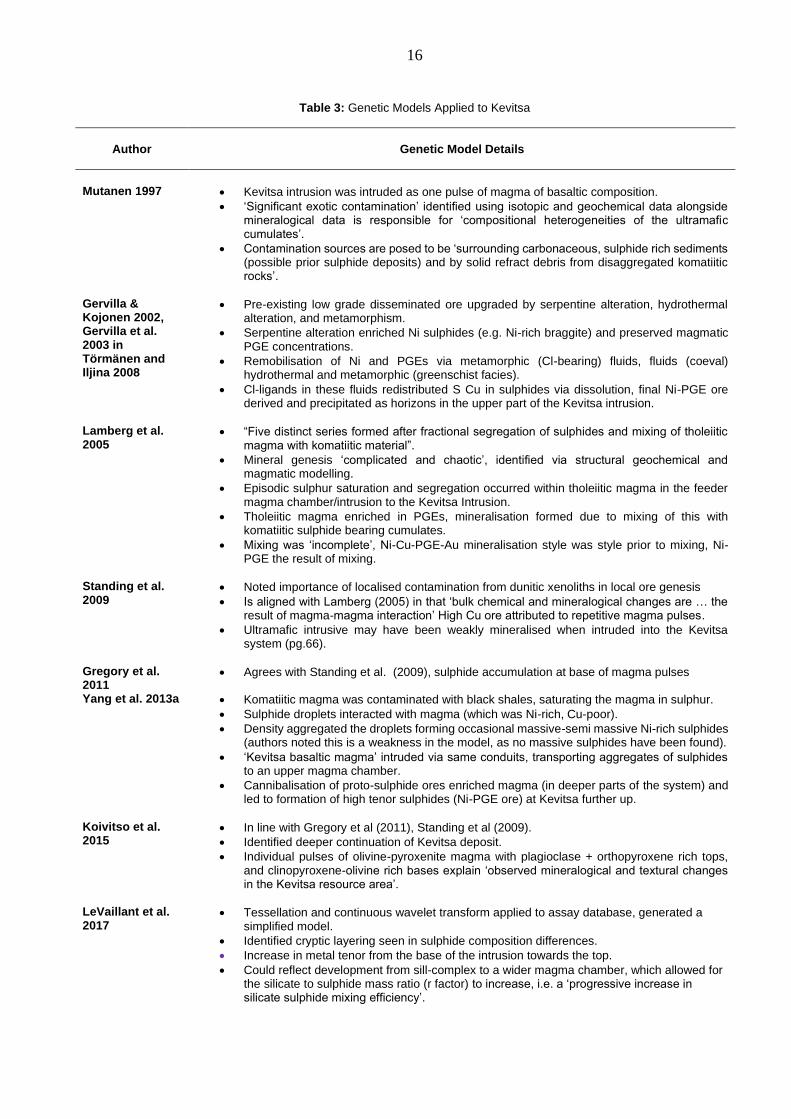
Table 3: Genetic Models Applied to Kevitsa
Author
Genetic Model Details
Mutanen 1997
• Kevitsa intrusion was intruded as one pulse of magma of basaltic composition.
• ‘Significant exotic contamination’ identified using isotopic and geochemical data alongside mineralogical data is responsible for ‘compositional heterogeneities of the ultramafic cumulates’.
• Contamination sources are posed to be ‘surrounding carbonaceous, sulphide rich sediments (possible prior sulphide deposits) and by solid refract debris from disaggregated komatiitic rocks’.
Gervilla & Kojonen 2002, Gervilla et al. 2003 in Törmänen and Iljina 2008
• Pre-existing low grade disseminated ore upgraded by serpentine alteration, hydrothermal alteration, and metamorphism.
• Serpentine alteration enriched Ni sulphides (e.g. Ni-rich braggite) and preserved magmatic PGE concentrations.
• Remobilisation of Ni and PGEs via metamorphic (Cl-bearing) fluids, fluids (coeval) hydrothermal and metamorphic (greenschist facies).
• Cl-ligands in these fluids redistributed S Cu in sulphides via dissolution, final Ni-PGE ore derived and precipitated as horizons in the upper part of the Kevitsa intrusion.
Lamberg et al. 2005
• “Five distinct series formed after fractional segregation of sulphides and mixing of tholeiitic magma with komatiitic material”.
• Mineral genesis ‘complicated and chaotic’, identified via structural geochemical and magmatic modelling.
• Episodic sulphur saturation and segregation occurred within tholeiitic magma in the feeder magma chamber/intrusion to the Kevitsa Intrusion.
• Tholeiitic magma enriched in PGEs, mineralisation formed due to mixing of this with komatiitic sulphide bearing cumulates.
• Mixing was ‘incomplete’, Ni-Cu-PGE-Au mineralisation style was style prior to mixing, Ni-PGE the result of mixing.
Standing et al. 2009
• Noted importance of localised contamination from dunitic xenoliths in local ore genesis
• Is aligned with Lamberg (2005) in that ‘bulk chemical and mineralogical changes are … the result of magma-magma interaction’ High Cu ore attributed to repetitive magma pulses.
• Ultramafic intrusive may have been weakly mineralised when intruded into the Kevitsa system (pg.66).
Gregory et al. 2011
• Agrees with Standing et al. (2009), sulphide accumulation at base of magma pulses
Yang et al. 2013a • Komatiitic magma was contaminated with black shales, saturating the magma in sulphur.
• Sulphide droplets interacted with magma (which was Ni-rich, Cu-poor).
• Density aggregated the droplets forming occasional massive-semi massive Ni-rich sulphides (authors noted this is a weakness in the model, as no massive sulphides have been found).
• ‘Kevitsa basaltic magma’ intruded via same conduits, transporting aggregates of sulphides to an upper magma chamber.
• Cannibalisation of proto-sulphide ores enriched magma (in deeper parts of the system) and led to formation of high tenor sulphides (Ni-PGE ore) at Kevitsa further up.
Koivitso et al. 2015
• In line with Gregory et al (2011), Standing et al (2009).
• Identified deeper continuation of Kevitsa deposit.
• Individual pulses of olivine-pyroxenite magma with plagioclase + orthopyroxene rich tops, and clinopyroxene-olivine rich bases explain ‘observed mineralogical and textural changes in the Kevitsa resource area’.
LeVaillant et al. 2017
• Tessellation and continuous wavelet transform applied to assay database, generated a simplified model.
• Identified cryptic layering seen in sulphide composition differences.
• Increase in metal tenor from the base of the intrusion towards the top.
• Could reflect development from sill-complex to a wider magma chamber, which allowed for the silicate to sulphide mass ratio (r factor) to increase, i.e. a ‘progressive increase in silicate sulphide mixing efficiency’.
17
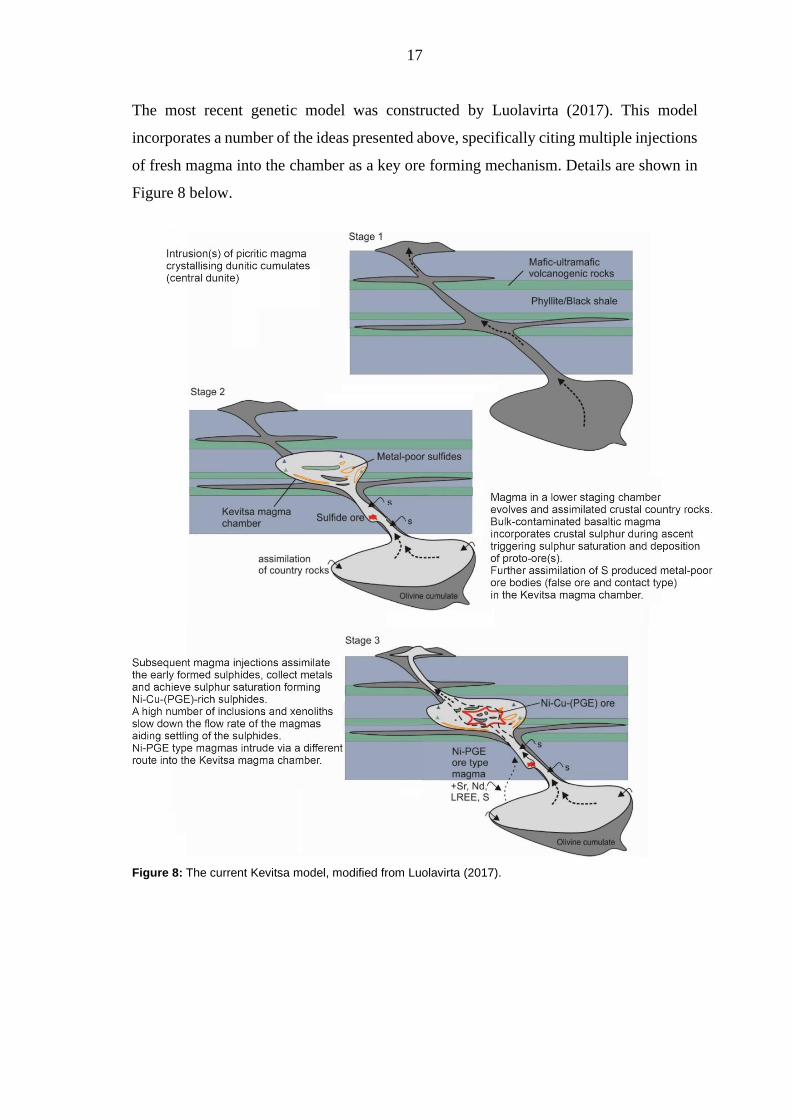
The most recent genetic model was constructed by Luolavirta (2017). This model
incorporates a number of the ideas presented above, specifically citing multiple injections
of fresh magma into the chamber as a key ore forming mechanism. Details are shown in
Figure 8 below.
Figure 8: The current Kevitsa model, modified from Luolavirta (2017).
18
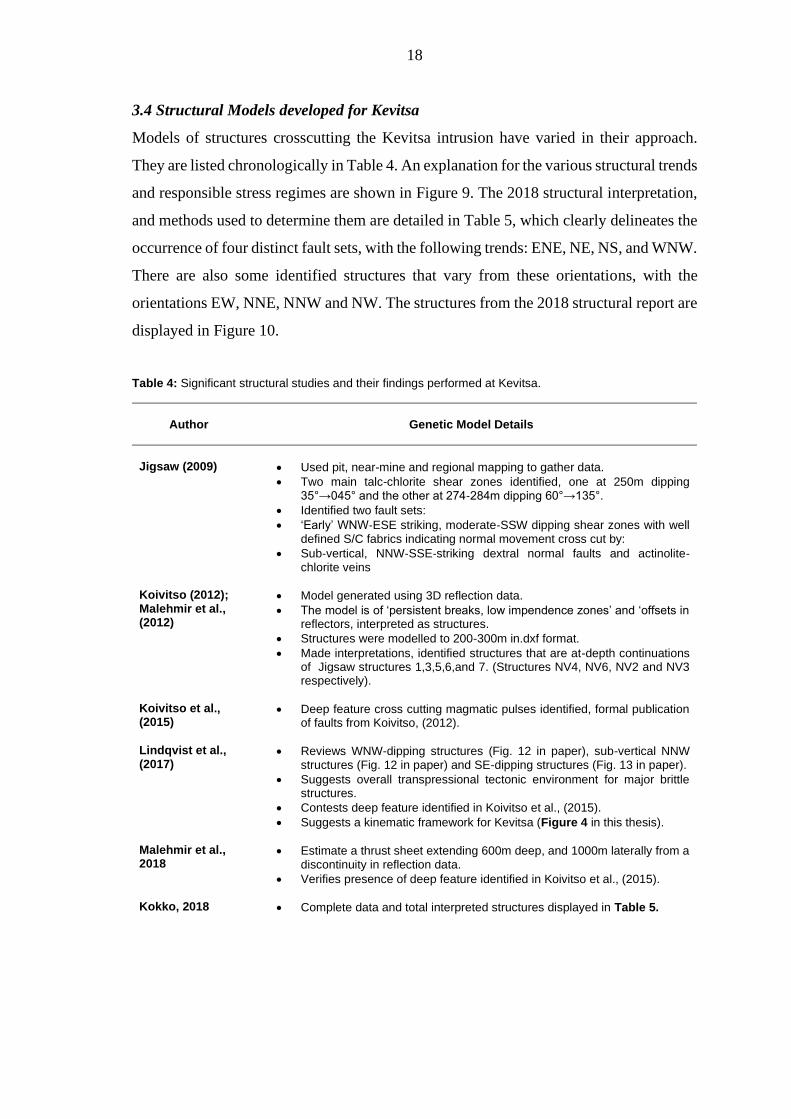
3.4 Structural Models developed for Kevitsa
Models of structures crosscutting the Kevitsa intrusion have varied in their approach.
They are listed chronologically in Table 4. An explanation for the various structural trends
and responsible stress regimes are shown in Figure 9. The 2018 structural interpretation,
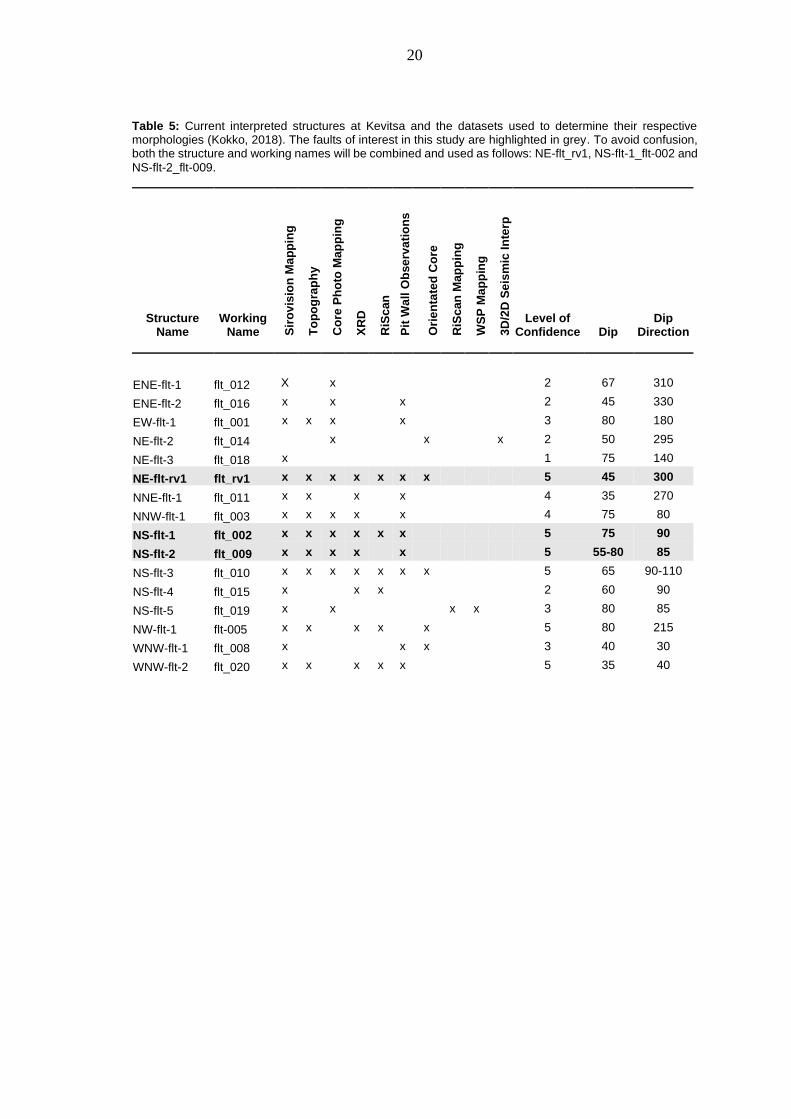
and methods used to determine them are detailed in Table 5, which clearly delineates the
occurrence of four distinct fault sets, with the following trends: ENE, NE, NS, and WNW.
There are also some identified structures that vary from these orientations, with the
orientations EW, NNE, NNW and NW. The structures from the 2018 structural report are
displayed in Figure 10.
Table 4: Significant structural studies and their findings performed at Kevitsa.
Author
Genetic Model Details
Jigsaw (2009)
• Used pit, near-mine and regional mapping to gather data.
• Two main talc-chlorite shear zones identified, one at 250m dipping 35°→045° and the other at 274‐284m dipping 60°→135°.
• Identified two fault sets:
• ‘Early’ WNW‐ESE striking, moderate‐SSW dipping shear zones with well defined S/C fabrics indicating normal movement cross cut by:
• Sub‐vertical, NNW‐SSE‐striking dextral normal faults and actinolite‐chlorite veins
Koivitso (2012); Malehmir et al., (2012)
• Model generated using 3D reflection data.
• The model is of ‘persistent breaks, low impendence zones’ and ‘offsets in reflectors, interpreted as structures.
• Structures were modelled to 200-300m in.dxf format.
• Made interpretations, identified structures that are at-depth continuations of Jigsaw structures 1,3,5,6,and 7. (Structures NV4, NV6, NV2 and NV3 respectively).
Koivitso et al., (2015)
• Deep feature cross cutting magmatic pulses identified, formal publication of faults from Koivitso, (2012).
Lindqvist et al., (2017)
• Reviews WNW-dipping structures (Fig. 12 in paper), sub-vertical NNW structures (Fig. 12 in paper) and SE-dipping structures (Fig. 13 in paper).
• Suggests overall transpressional tectonic environment for major brittle structures.
• Contests deep feature identified in Koivitso et al., (2015).
• Suggests a kinematic framework for Kevitsa (Figure 4 in this thesis).
Malehmir et al., 2018
• Estimate a thrust sheet extending 600m deep, and 1000m laterally from a discontinuity in reflection data.
• Verifies presence of deep feature identified in Koivitso et al., (2015).
Kokko, 2018 • Complete data and total interpreted structures displayed in Table 5.
19
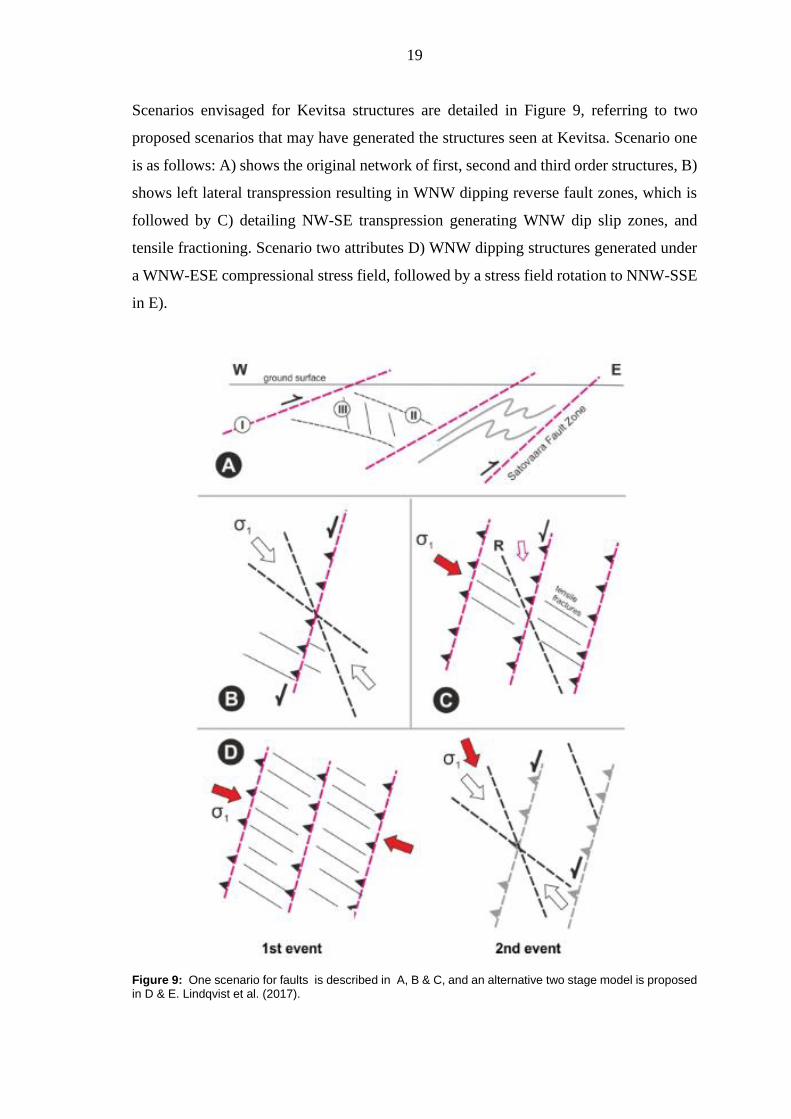
Scenarios envisaged for Kevitsa structures are detailed in Figure 9, referring to two
proposed scenarios that may have generated the structures seen at Kevitsa. Scenario one
is as follows: A) shows the original network of first, second and third order structures, B)
shows left lateral transpression resulting in WNW dipping reverse fault zones, which is
followed by C) detailing NW-SE transpression generating WNW dip slip zones, and
tensile fractioning. Scenario two attributes D) WNW dipping structures generated under
a WNW-ESE compressional stress field, followed by a stress field rotation to NNW-SSE
in E).
Figure 9: One scenario for faults is described in A, B & C, and an alternative two stage model is proposed in D & E. Lindqvist et al. (2017).
20
Table 5: Current interpreted structures at Kevitsa and the datasets used to determine their respective morphologies (Kokko, 2018). The faults of interest in this study are highlighted in grey. To avoid confusion, both the structure and working names will be combined and used as follows: NE-flt_rv1, NS-flt-1_flt-002 and
NS-flt-2_flt-009.
Structure Name
Working
Name
S
iro
vis
ion
Ma
pp
ing
T
op
og
rap
hy
Co
re P
ho
to M
ap
pin
g
XR
D
RiS
can
Pit
Wa
ll O
bse
rva
tio
ns
Ori
en
tate
d C
ore
RiS
can
Ma
pp
ing
WS
P M
ap
pin
g
3D
/2D
Se
ism
ic I
nte
rp
Level of Confidence
Dip
Dip
Direction
ENE-flt-1 flt_012 X x 2 67 310 ENE-flt-2 flt_016 x x x 2 45 330 EW-flt-1 flt_001 x x x x 3 80 180 NE-flt-2 flt_014 x x x 2 50 295 NE-flt-3 flt_018 x 1 75 140 NE-flt-rv1 flt_rv1 x x x x x x x 5 45 300 NNE-flt-1 flt_011 x x x x 4 35 270 NNW-flt-1 flt_003 x x x x x 4 75 80 NS-flt-1 flt_002 x x x x x x 5 75 90 NS-flt-2 flt_009 x x x x x 5 55-80 85 NS-flt-3 flt_010 x x x x x x x 5 65 90-110 NS-flt-4 flt_015 x x x 2 60 90 NS-flt-5 flt_019 x x x x 3 80 85 NW-flt-1 flt-005 x x x x x 5 80 215 WNW-flt-1 flt_008 x x x 3 40 30 WNW-flt-2 flt_020 x x x x x 5 35 40
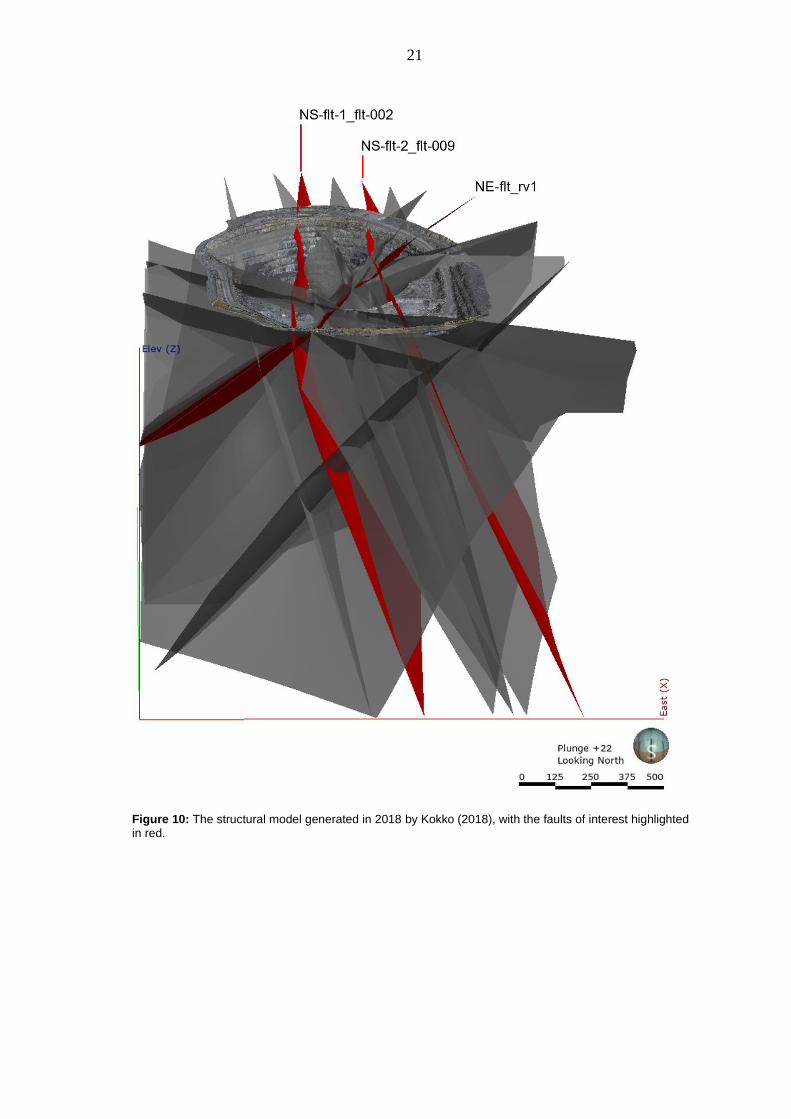
21
Figure 10: The structural model generated in 2018 by Kokko (2018), with the faults of interest highlighted in red.
22
4. Materials and Methods
4.1 Materials
To ensure clarity, and in order to glean a representative picture of the influence and style
of talc formation or enrichment, a variety of existing datasets have been utilised in this
project. Data availability is excellent at Kevitsa, thus defining a confident and practical
dataset to define structures driving the main production player’s spatial distribution
comprised a crucial element of this thesis. LeapfrogGeo version 5.0.1 (© 2019 Seequent
Limited) was used to visualise data. The datasets used for the study are as follows:
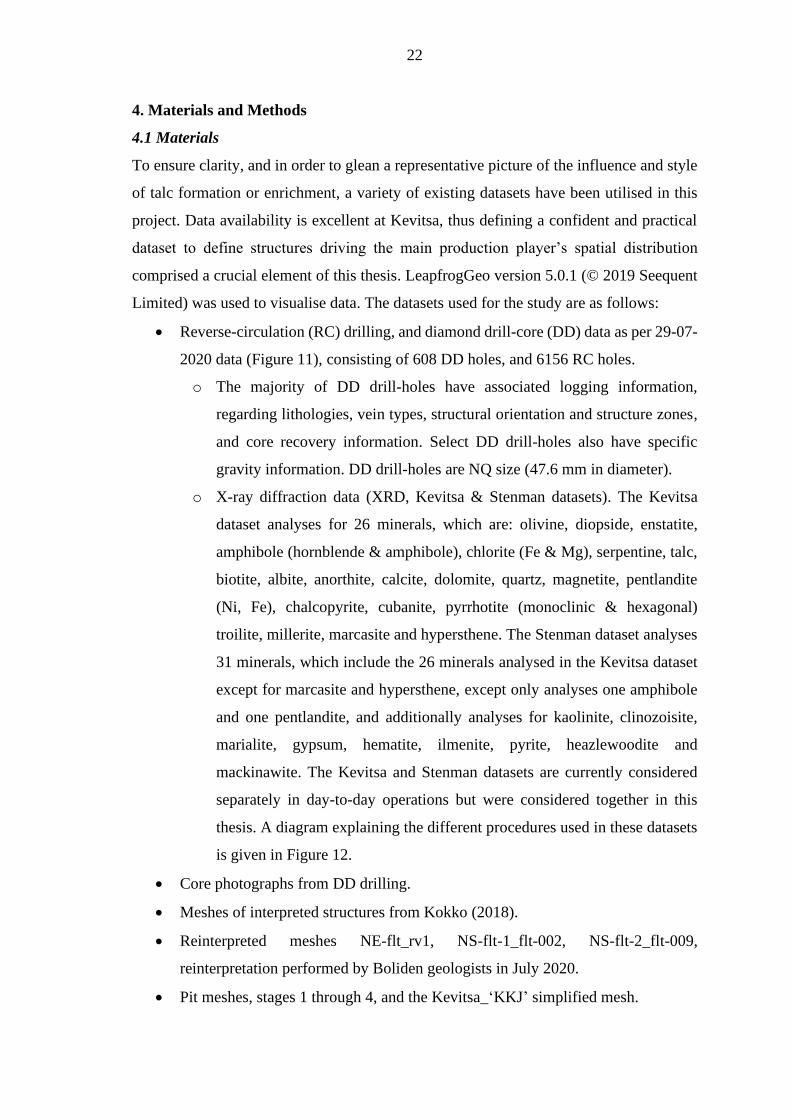
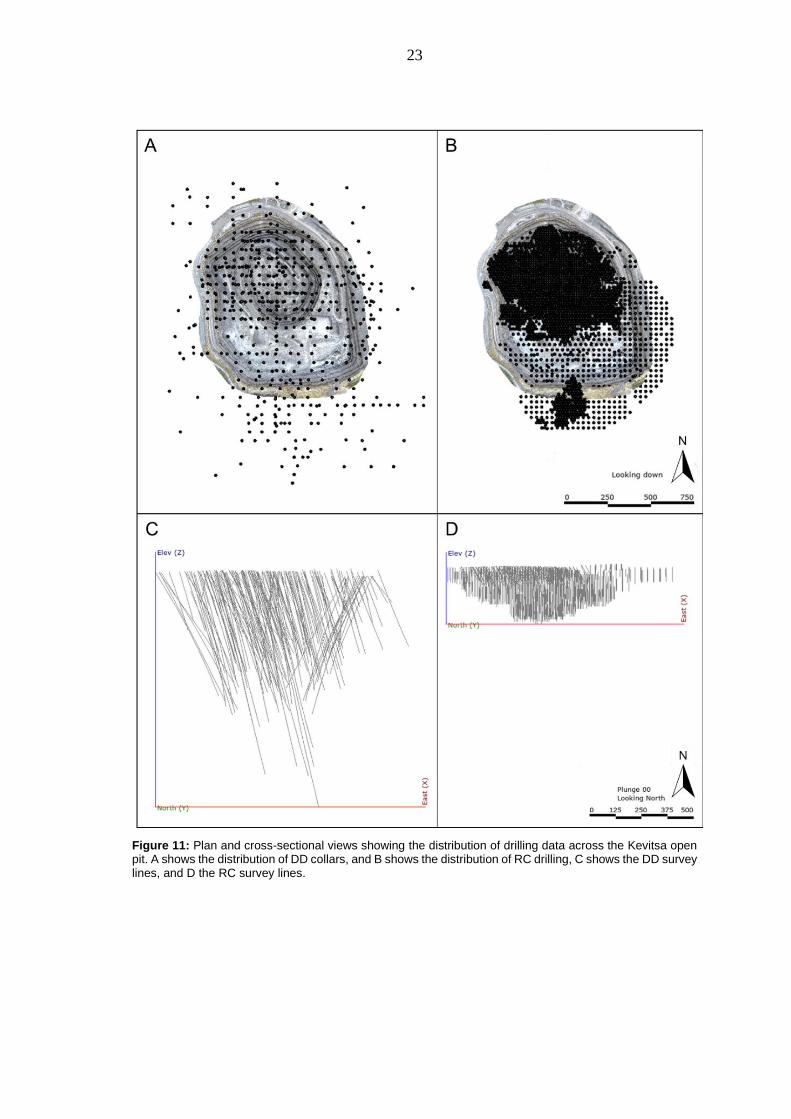
• Reverse-circulation (RC) drilling, and diamond drill-core (DD) data as per 29-07-
2020 data (Figure 11), consisting of 608 DD holes, and 6156 RC holes.
o The majority of DD drill-holes have associated logging information,
regarding lithologies, vein types, structural orientation and structure zones,
and core recovery information. Select DD drill-holes also have specific
gravity information. DD drill-holes are NQ size (47.6 mm in diameter).
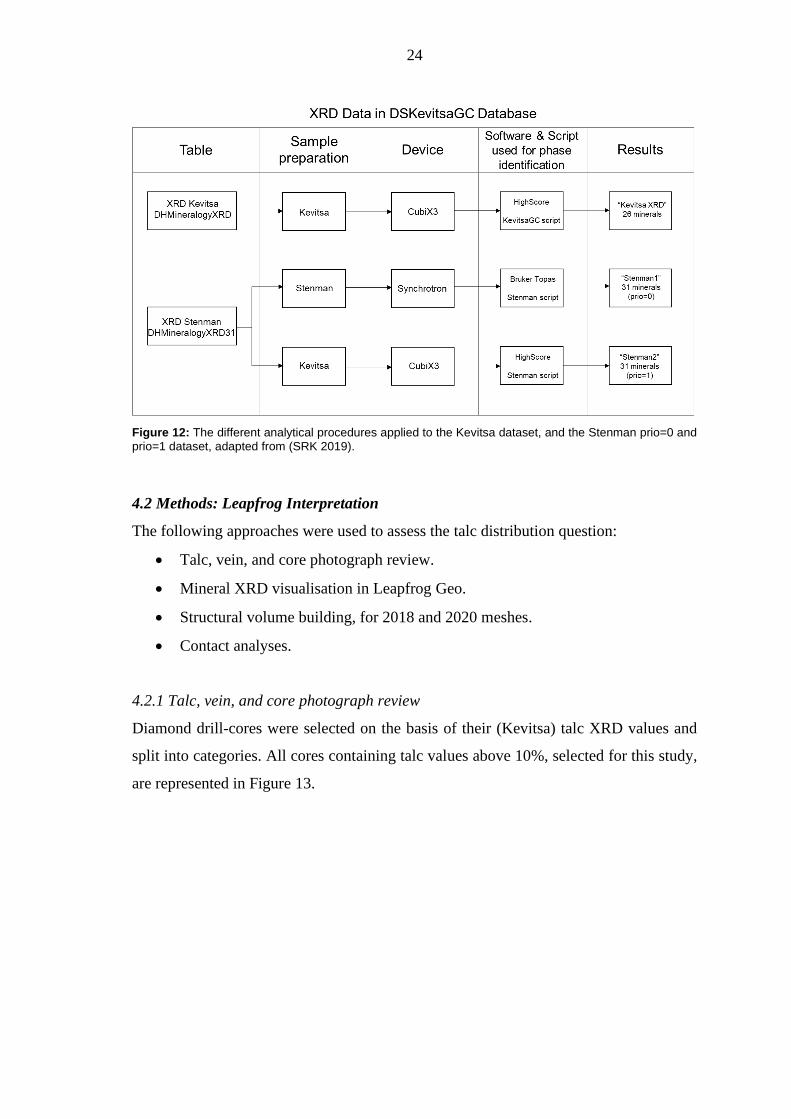
o X-ray diffraction data (XRD, Kevitsa & Stenman datasets). The Kevitsa
dataset analyses for 26 minerals, which are: olivine, diopside, enstatite,
amphibole (hornblende & amphibole), chlorite (Fe & Mg), serpentine, talc,
biotite, albite, anorthite, calcite, dolomite, quartz, magnetite, pentlandite
(Ni, Fe), chalcopyrite, cubanite, pyrrhotite (monoclinic & hexagonal)
troilite, millerite, marcasite and hypersthene. The Stenman dataset analyses
31 minerals, which include the 26 minerals analysed in the Kevitsa dataset
except for marcasite and hypersthene, except only analyses one amphibole
and one pentlandite, and additionally analyses for kaolinite, clinozoisite,
marialite, gypsum, hematite, ilmenite, pyrite, heazlewoodite and
mackinawite. The Kevitsa and Stenman datasets are currently considered
separately in day-to-day operations but were considered together in this
thesis. A diagram explaining the different procedures used in these datasets
is given in Figure 12.
• Core photographs from DD drilling.
• Meshes of interpreted structures from Kokko (2018).
• Reinterpreted meshes NE-flt_rv1, NS-flt-1_flt-002, NS-flt-2_flt-009,
reinterpretation performed by Boliden geologists in July 2020.
• Pit meshes, stages 1 through 4, and the Kevitsa_‘KKJ’ simplified mesh.
23
Figure 11: Plan and cross-sectional views showing the distribution of drilling data across the Kevitsa open pit. A shows the distribution of DD collars, and B shows the distribution of RC drilling, C shows the DD survey lines, and D the RC survey lines.
24
Figure 12: The different analytical procedures applied to the Kevitsa dataset, and the Stenman prio=0 and prio=1 dataset, adapted from (SRK 2019).
4.2 Methods: Leapfrog Interpretation
The following approaches were used to assess the talc distribution question:
• Talc, vein, and core photograph review.
• Mineral XRD visualisation in Leapfrog Geo.
• Structural volume building, for 2018 and 2020 meshes.
• Contact analyses.
4.2.1 Talc, vein, and core photograph review
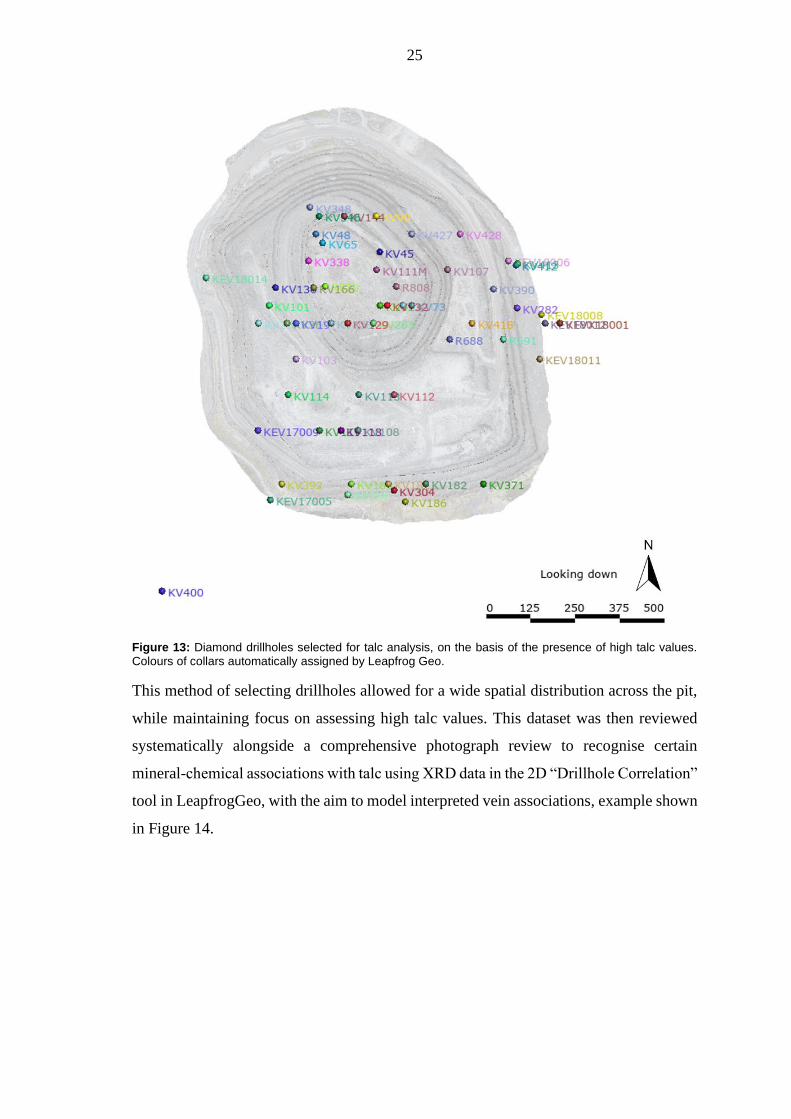
Diamond drill-cores were selected on the basis of their (Kevitsa) talc XRD values and
split into categories. All cores containing talc values above 10%, selected for this study,
are represented in Figure 13.
25
Figure 13: Diamond drillholes selected for talc analysis, on the basis of the presence of high talc values. Colours of collars automatically assigned by Leapfrog Geo.
This method of selecting drillholes allowed for a wide spatial distribution across the pit,
while maintaining focus on assessing high talc values. This dataset was then reviewed
systematically alongside a comprehensive photograph review to recognise certain
mineral-chemical associations with talc using XRD data in the 2D “Drillhole Correlation”
tool in LeapfrogGeo, with the aim to model interpreted vein associations, example shown
in Figure 14.
26
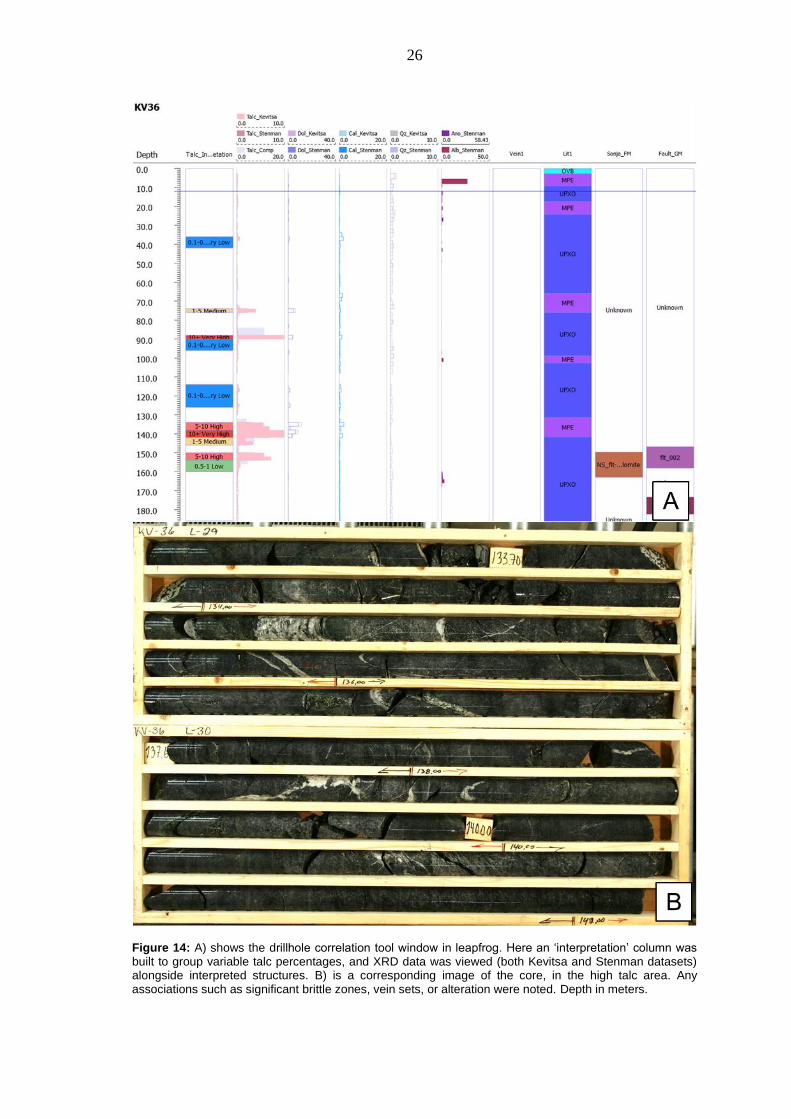
Figure 14: A) shows the drillhole correlation tool window in leapfrog. Here an ‘interpretation’ column was built to group variable talc percentages, and XRD data was viewed (both Kevitsa and Stenman datasets) alongside interpreted structures. B) is a corresponding image of the core, in the high talc area. Any associations such as significant brittle zones, vein sets, or alteration were noted. Depth in meters.
27
Logging data were used as a point of reference but could not be entirely relied upon due
to different logging conventions over the years. Through the exercise, it was found that
the 2m XRD sample intervals within DD holes were not of sufficient resolution to
concretely identify the chemical character of the sub-1m wide veins which can be
identified in core photographs. However, this exercise was useful in highlighting the
significance of carbonate veins and their talc association, and useful textural observations
were gleaned from the core photograph study. As the data density determined from
diamond drill-cores is significantly less than that of RC drilling, patterns were
inconclusive without incorporating the RC drilling data (which comprises the bulk of the
XRD dataset), thus the holistic raw dataset was visualised in 3D.
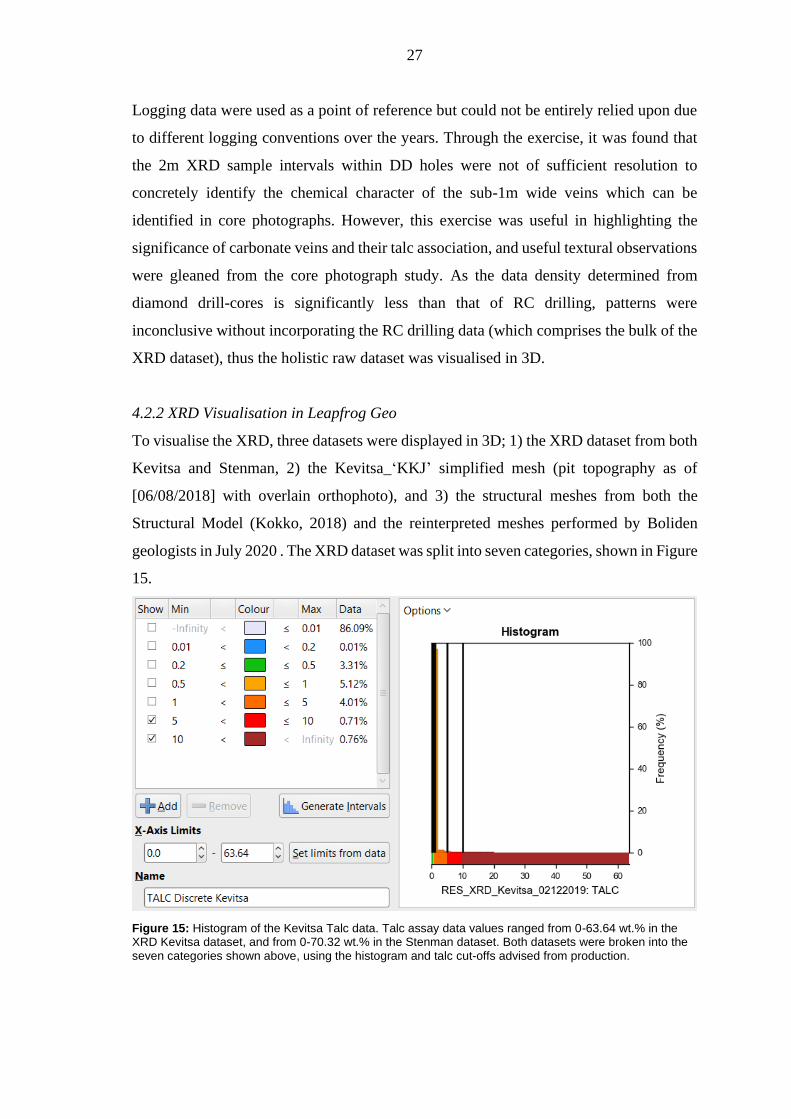
4.2.2 XRD Visualisation in Leapfrog Geo
To visualise the XRD, three datasets were displayed in 3D; 1) the XRD dataset from both
Kevitsa and Stenman, 2) the Kevitsa_‘KKJ’ simplified mesh (pit topography as of
[06/08/2018] with overlain orthophoto), and 3) the structural meshes from both the
Structural Model (Kokko, 2018) and the reinterpreted meshes performed by Boliden
geologists in July 2020 . The XRD dataset was split into seven categories, shown in Figure
15.
Figure 15: Histogram of the Kevitsa Talc data. Talc assay data values ranged from 0-63.64 wt.% in the XRD Kevitsa dataset, and from 0-70.32 wt.% in the Stenman dataset. Both datasets were broken into the seven categories shown above, using the histogram and talc cut-offs advised from production.
28
4.2.3 Volume build of structural features
As the faults are fault planes presented as meshes in .dxf format, in order to evaluate
where faults intersect drill-cores, a ‘volume’ had to be generated from the meshes. To do
this, a distance function was applied around the mesh to generate a 2-meter buffer either
side of the plane. This resultant ‘numeric model’ generated a volume around the fault
plane. This procedure was repeated for all faults in the 2018 structural interpretation and
for the reinterpreted meshes. These volumes generated could then be used to build a
‘geological model’ – according to LeapfrogGeo terminology – of these fault volumes,
where each volume generated per plane was named in accordance with the corresponding
fault.
Once this ‘geological model’ of the faults was generated, it was possible to apply the
‘evaluation’ tool to the drillholes. This tool calculates where the volumes in the geological
model intersect the drillholes and generates a new ‘interval’ in the drillholes that intersect
the fault volume. This ‘interval’ provides the ‘from’ and ‘to’ of the fault volume
intersect(s) in a given core, which allowed for easier selection of drillholes of interest for
further fault and talc review.
4.2.4 Contact Analysis
Contact analysis was performed on the reinterpreted fault meshes NS-flt-2_flt-009 and
NS-flt-1_flt-002. This method was used to test the relationship between dolomite and talc
which was observed in core review. Diamond drill-holes were selected that intersected
the pertinent fault plane. The intersections were found using the ‘fault evaluation’
intervals - generated from the structural volumes (Section 4.2.3). 11 diamond drill-holes
were selected for NS-flt-1_flt-002, and 9 diamond drill-holes were selected for NS-flt-
2_flt-009, shown in Figure 16.
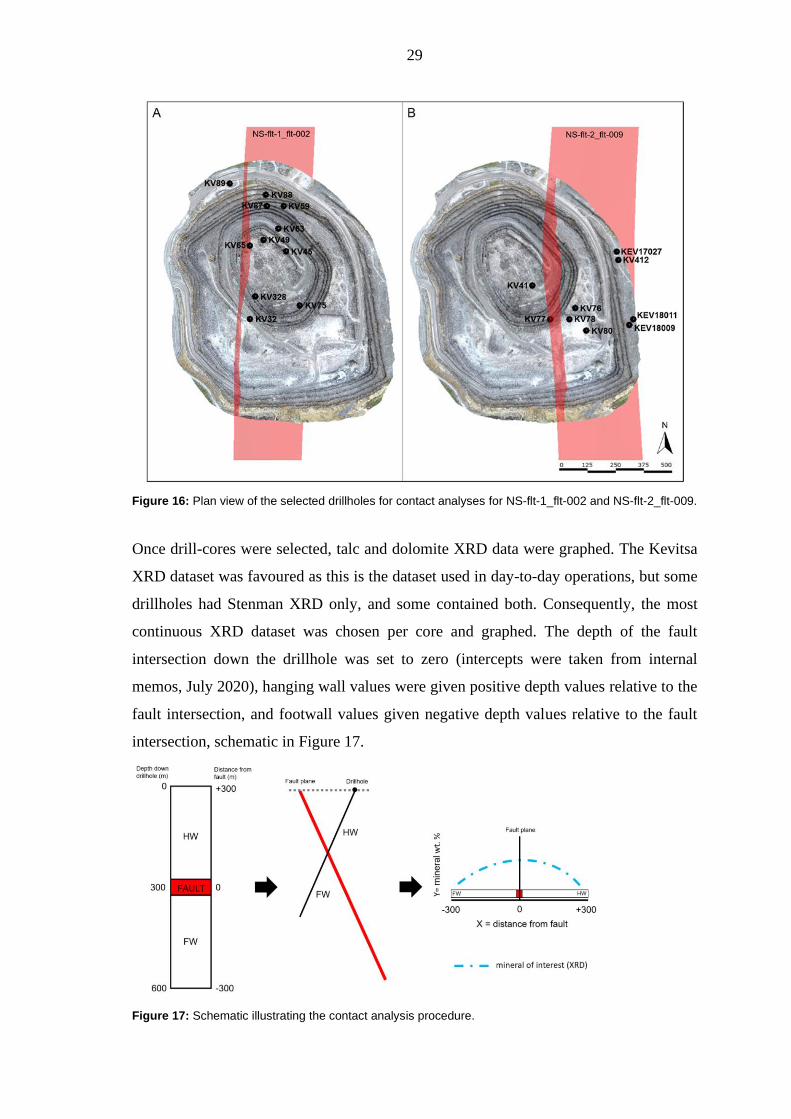
29
Figure 16: Plan view of the selected drillholes for contact analyses for NS-flt-1_flt-002 and NS-flt-2_flt-009.
Once drill-cores were selected, talc and dolomite XRD data were graphed. The Kevitsa
XRD dataset was favoured as this is the dataset used in day-to-day operations, but some
drillholes had Stenman XRD only, and some contained both. Consequently, the most
continuous XRD dataset was chosen per core and graphed. The depth of the fault
intersection down the drillhole was set to zero (intercepts were taken from internal
memos, July 2020), hanging wall values were given positive depth values relative to the
fault intersection, and footwall values given negative depth values relative to the fault
intersection, schematic in Figure 17.
Figure 17: Schematic illustrating the contact analysis procedure.
30
5. Results
The following results are described in this section; 1) The distribution of talc grades
across the mine shown by the raw XRD visualisation (Section 5.1), 2) talc mineral and
structural associations found through the photograph review (Section 5.2), and 3) the
behaviour of talc and dolomite concentrations relative to NS-flt-2_flt-009 and NS-flt-
1_flt-002 yielded by contact analysis (Section 5.3).
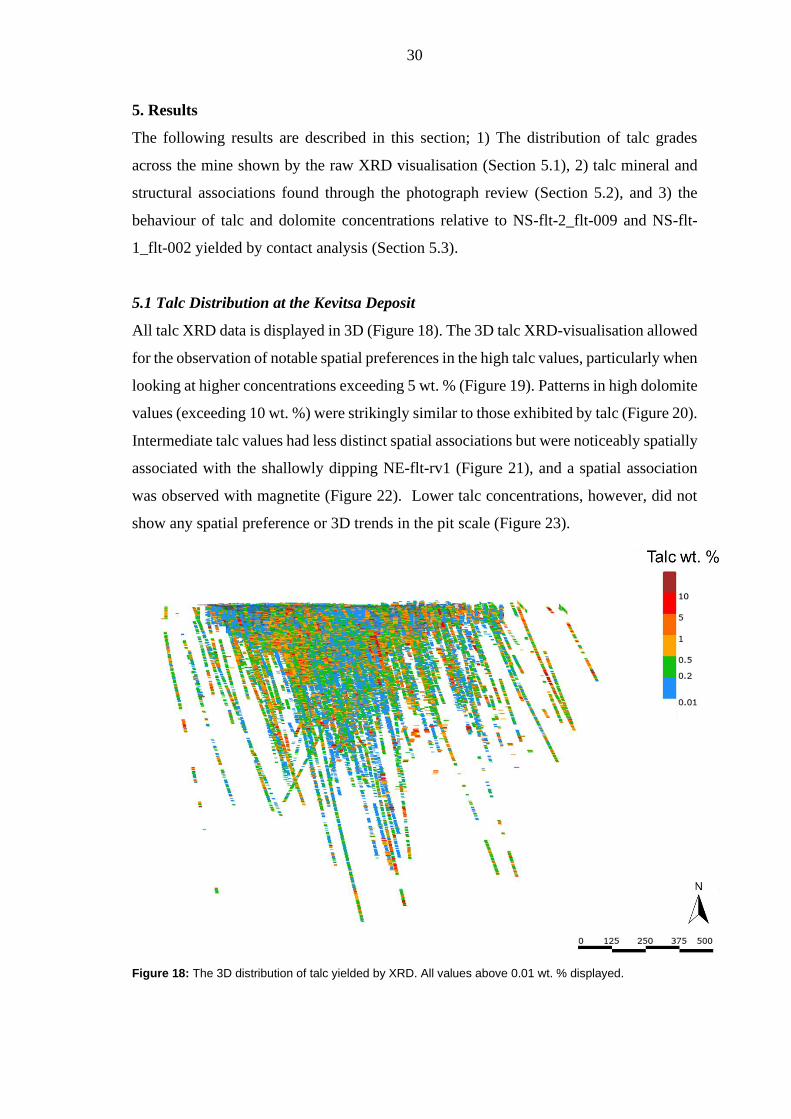
5.1 Talc Distribution at the Kevitsa Deposit
All talc XRD data is displayed in 3D (Figure 18). The 3D talc XRD-visualisation allowed
for the observation of notable spatial preferences in the high talc values, particularly when
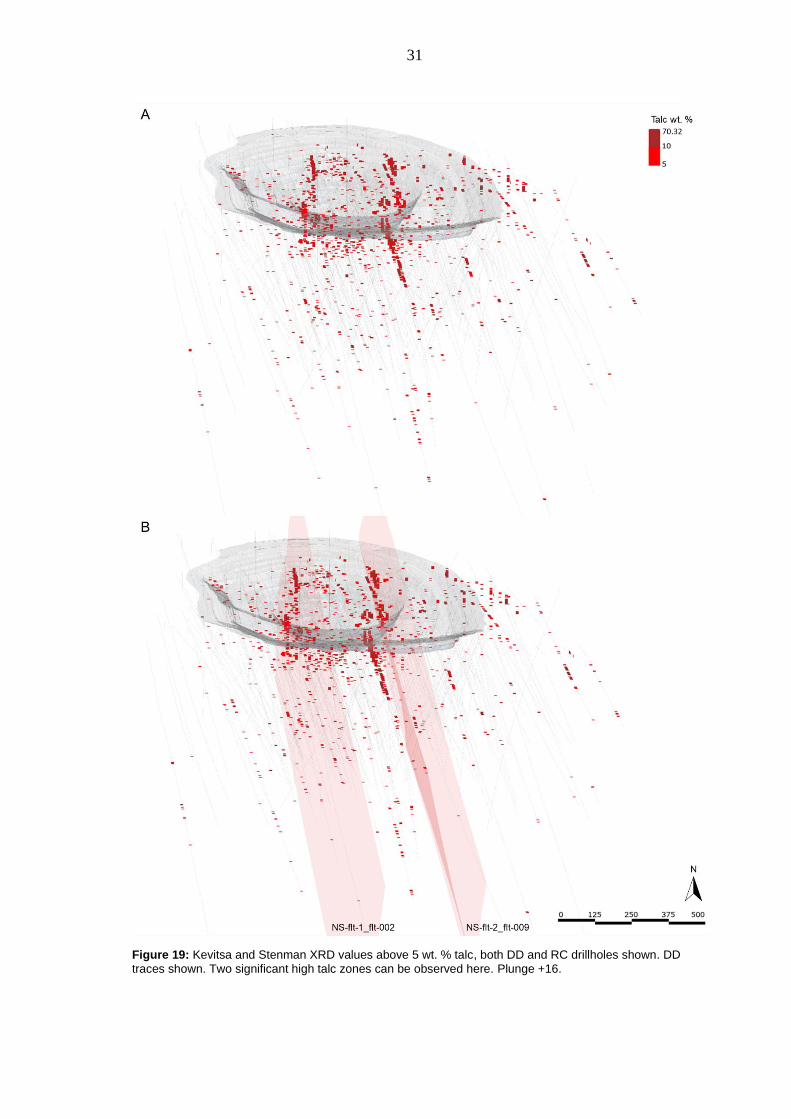
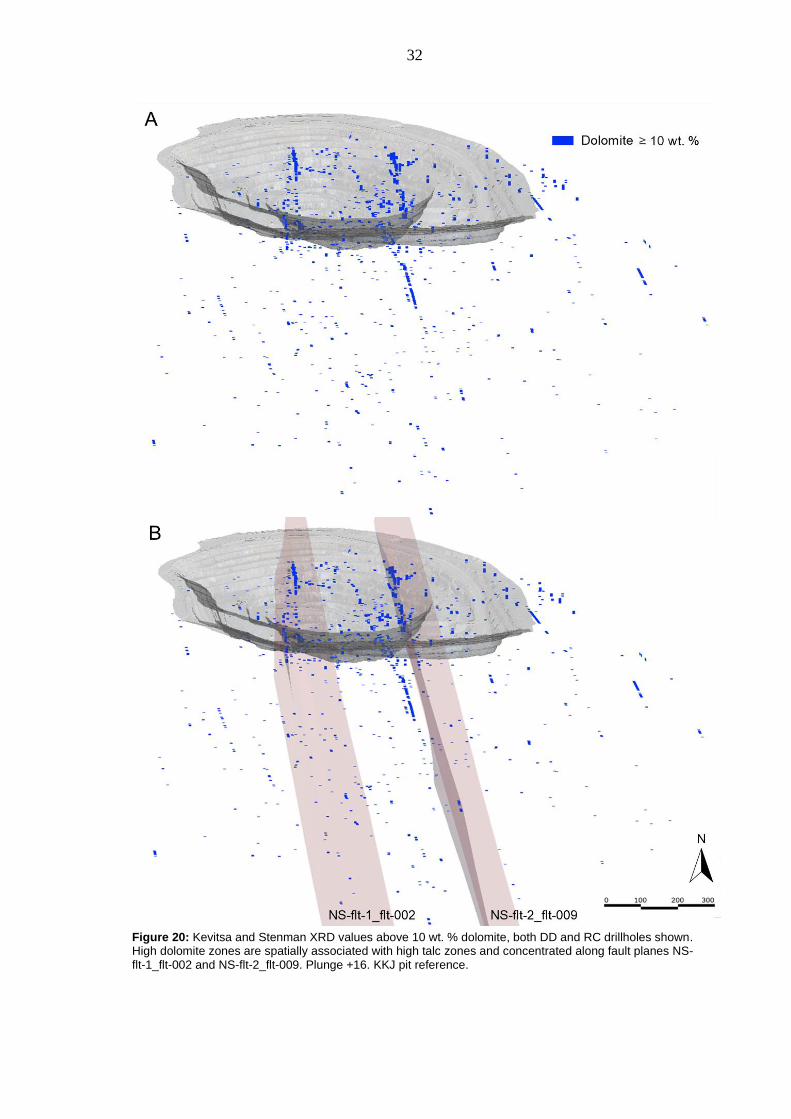
looking at higher concentrations exceeding 5 wt. % (Figure 19). Patterns in high dolomite
values (exceeding 10 wt. %) were strikingly similar to those exhibited by talc (Figure 20).
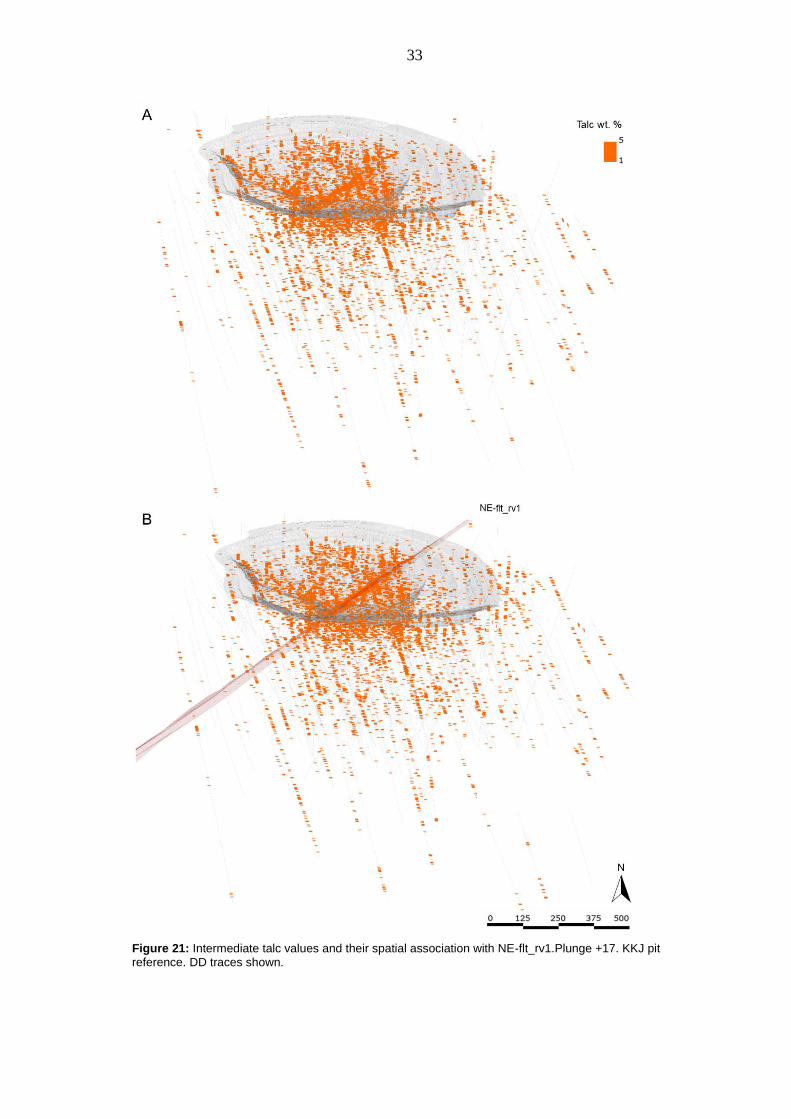
Intermediate talc values had less distinct spatial associations but were noticeably spatially
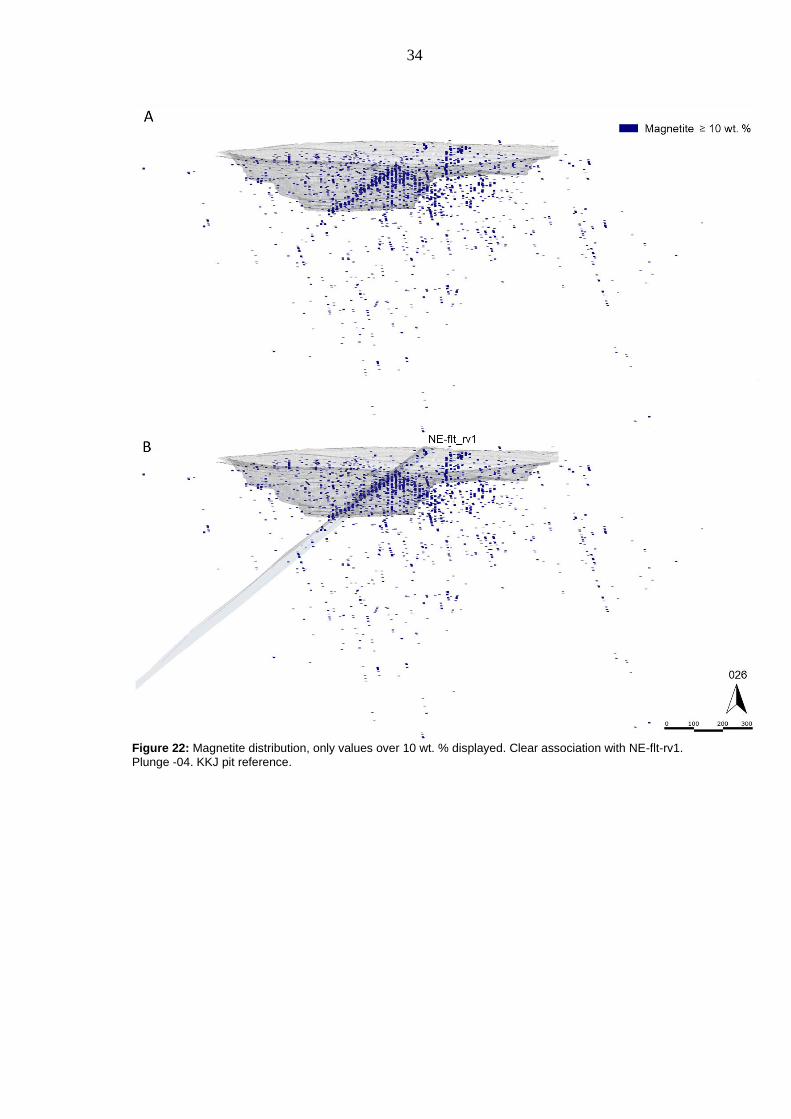
associated with the shallowly dipping NE-flt-rv1 (Figure 21), and a spatial association
was observed with magnetite (Figure 22). Lower talc concentrations, however, did not
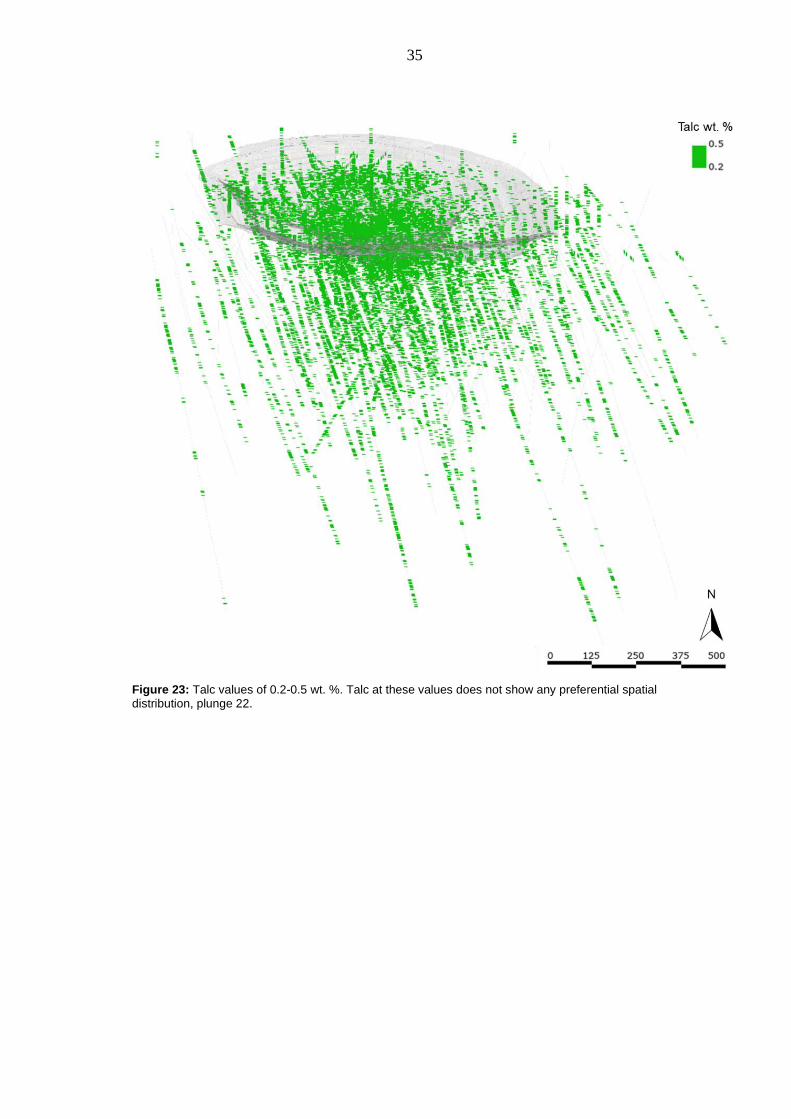
show any spatial preference or 3D trends in the pit scale (Figure 23).
Figure 18: The 3D distribution of talc yielded by XRD. All values above 0.01 wt. % displayed.
31
Figure 19: Kevitsa and Stenman XRD values above 5 wt. % talc, both DD and RC drillholes shown. DD
traces shown. Two significant high talc zones can be observed here. Plunge +16.
32
Figure 20: Kevitsa and Stenman XRD values above 10 wt. % dolomite, both DD and RC drillholes shown. High dolomite zones are spatially associated with high talc zones and concentrated along fault planes NS-flt-1_flt-002 and NS-flt-2_flt-009. Plunge +16. KKJ pit reference.
33
Figure 21: Intermediate talc values and their spatial association with NE-flt_rv1.Plunge +17. KKJ pit reference. DD traces shown.
34
Figure 22: Magnetite distribution, only values over 10 wt. % displayed. Clear association with NE-flt-rv1.
Plunge -04. KKJ pit reference.
35
Figure 23: Talc values of 0.2-0.5 wt. %. Talc at these values does not show any preferential spatial distribution, plunge 22.
36
5.2 Talc Associations
Significant textural or mineralogical talc associations were noted during the core
review. These are as follows: talc-carbonate associations (Section 5.2.1), brittle
structures with related talc (Section 5.2.2), near surface talc enrichment (Section 5.2.3),
talc-chlorite-magnetite veinlets (Section 5.2.4), background talc (Section 5.2.5) and talc
on joint planes (Section 5.2.6).
5.2.1 Talc-carbonate associations
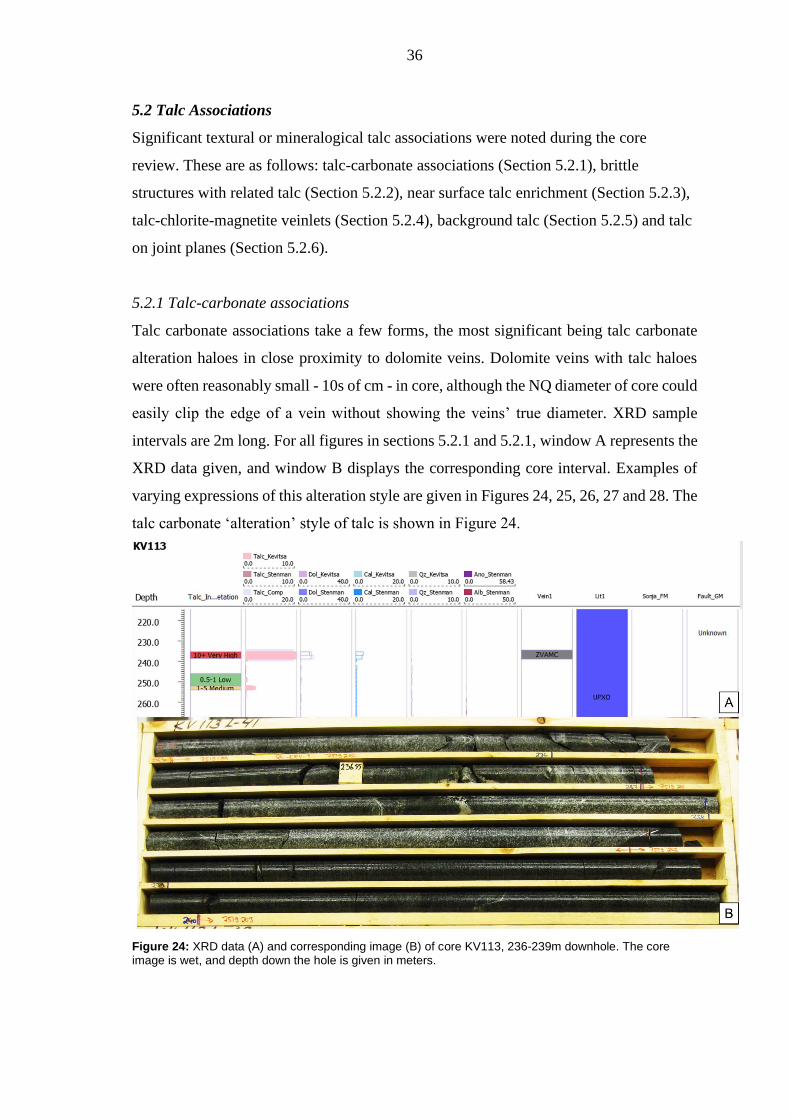
Talc carbonate associations take a few forms, the most significant being talc carbonate
alteration haloes in close proximity to dolomite veins. Dolomite veins with talc haloes
were often reasonably small - 10s of cm - in core, although the NQ diameter of core could
easily clip the edge of a vein without showing the veins’ true diameter. XRD sample
intervals are 2m long. For all figures in sections 5.2.1 and 5.2.1, window A represents the
XRD data given, and window B displays the corresponding core interval. Examples of
varying expressions of this alteration style are given in Figures 24, 25, 26, 27 and 28. The
talc carbonate ‘alteration’ style of talc is shown in Figure 24.
Figure 24: XRD data (A) and corresponding image (B) of core KV113, 236-239m downhole. The core image is wet, and depth down the hole is given in meters.
37
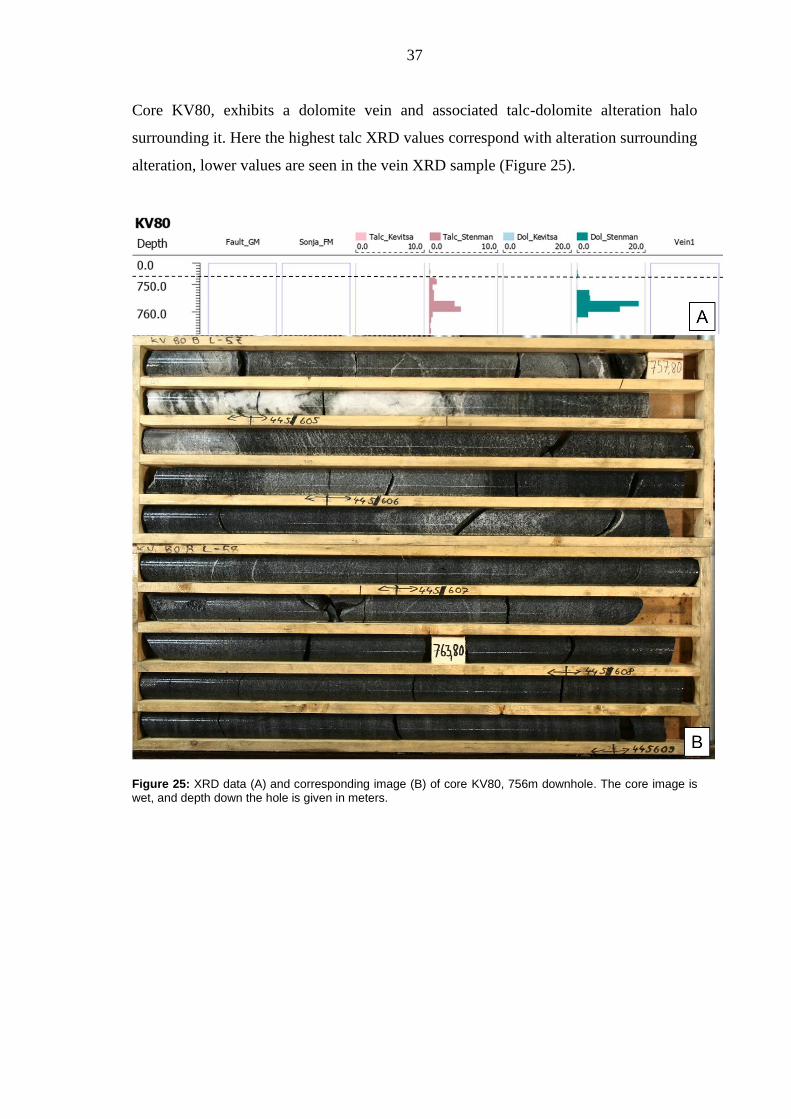
Core KV80, exhibits a dolomite vein and associated talc-dolomite alteration halo
surrounding it. Here the highest talc XRD values correspond with alteration surrounding
alteration, lower values are seen in the vein XRD sample (Figure 25).
Figure 25: XRD data (A) and corresponding image (B) of core KV80, 756m downhole. The core image is wet, and depth down the hole is given in meters.
38
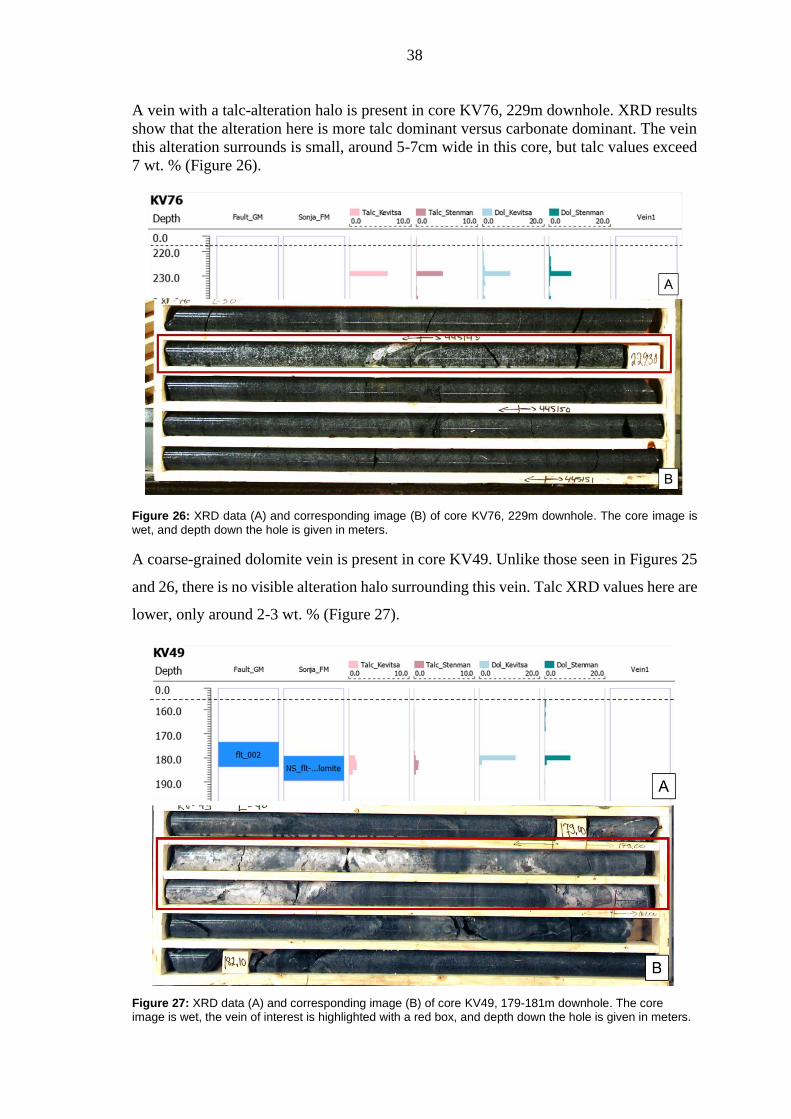
A vein with a talc-alteration halo is present in core KV76, 229m downhole. XRD results
show that the alteration here is more talc dominant versus carbonate dominant. The vein
this alteration surrounds is small, around 5-7cm wide in this core, but talc values exceed
7 wt. % (Figure 26).
Figure 26: XRD data (A) and corresponding image (B) of core KV76, 229m downhole. The core image is
wet, and depth down the hole is given in meters.
A coarse-grained dolomite vein is present in core KV49. Unlike those seen in Figures 25
and 26, there is no visible alteration halo surrounding this vein. Talc XRD values here are
lower, only around 2-3 wt. % (Figure 27).
Figure 27: XRD data (A) and corresponding image (B) of core KV49, 179-181m downhole. The core image is wet, the vein of interest is highlighted with a red box, and depth down the hole is given in meters.
39
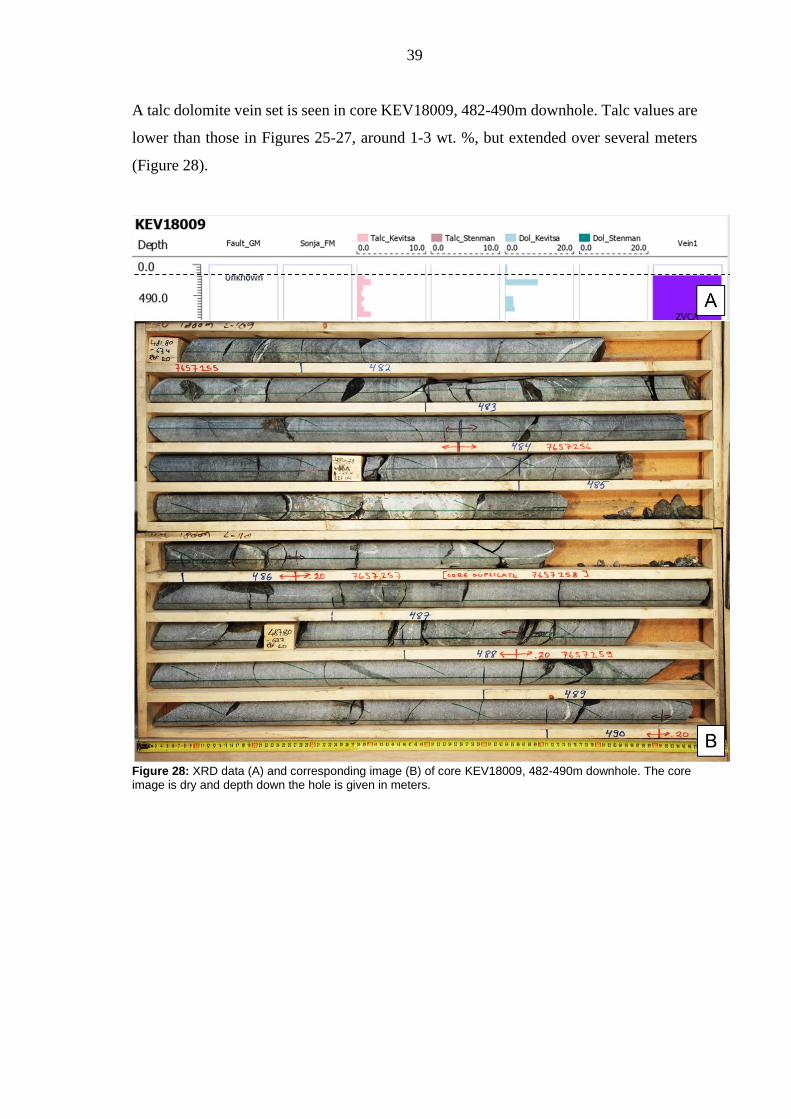
A talc dolomite vein set is seen in core KEV18009, 482-490m downhole. Talc values are
lower than those in Figures 25-27, around 1-3 wt. %, but extended over several meters
(Figure 28).
Figure 28: XRD data (A) and corresponding image (B) of core KEV18009, 482-490m downhole. The core image is dry and depth down the hole is given in meters.
40
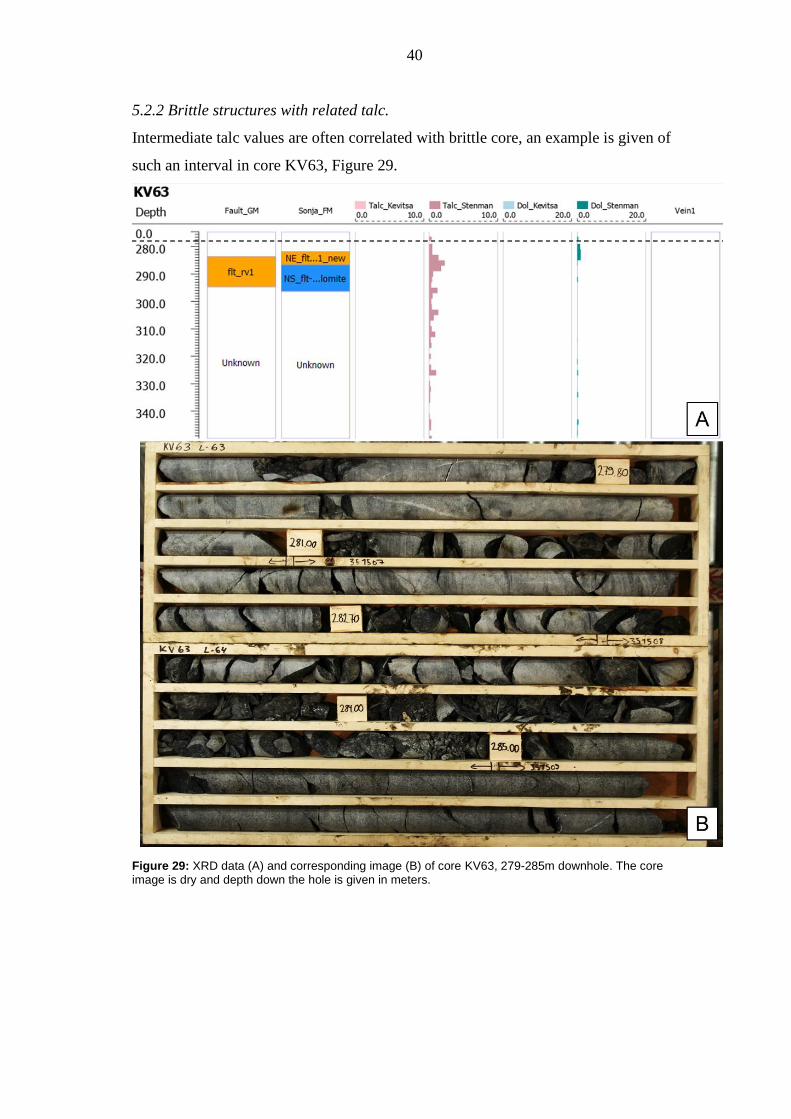
5.2.2 Brittle structures with related talc.
Intermediate talc values are often correlated with brittle core, an example is given of
such an interval in core KV63, Figure 29.
Figure 29: XRD data (A) and corresponding image (B) of core KV63, 279-285m downhole. The core image is dry and depth down the hole is given in meters.
41
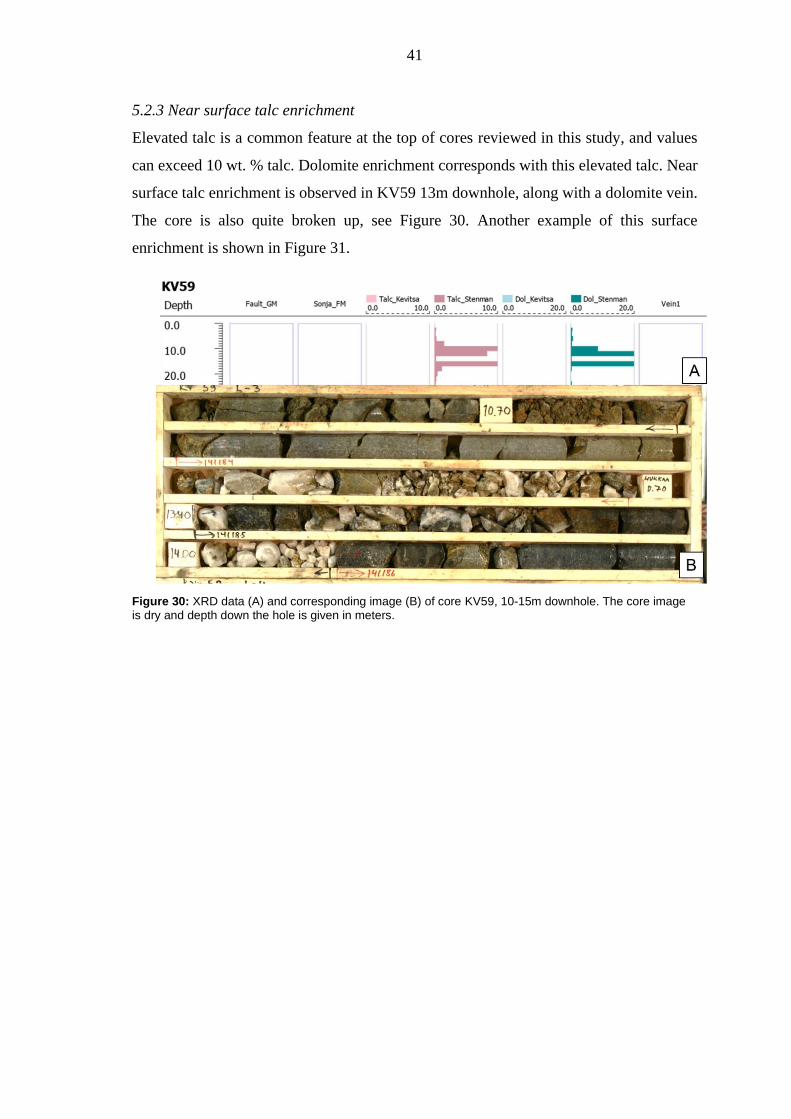
5.2.3 Near surface talc enrichment
Elevated talc is a common feature at the top of cores reviewed in this study, and values
can exceed 10 wt. % talc. Dolomite enrichment corresponds with this elevated talc. Near
surface talc enrichment is observed in KV59 13m downhole, along with a dolomite vein.
The core is also quite broken up, see Figure 30. Another example of this surface
enrichment is shown in Figure 31.
Figure 30: XRD data (A) and corresponding image (B) of core KV59, 10-15m downhole. The core image is dry and depth down the hole is given in meters.
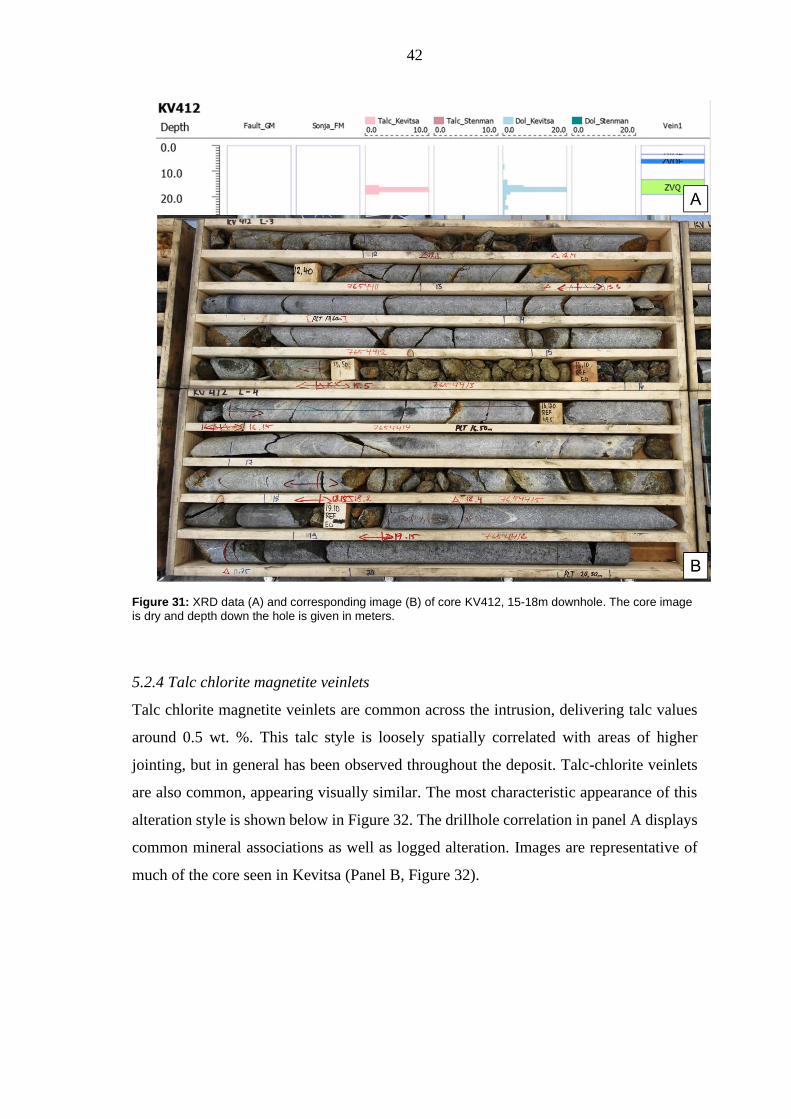
42
Figure 31: XRD data (A) and corresponding image (B) of core KV412, 15-18m downhole. The core image
is dry and depth down the hole is given in meters.
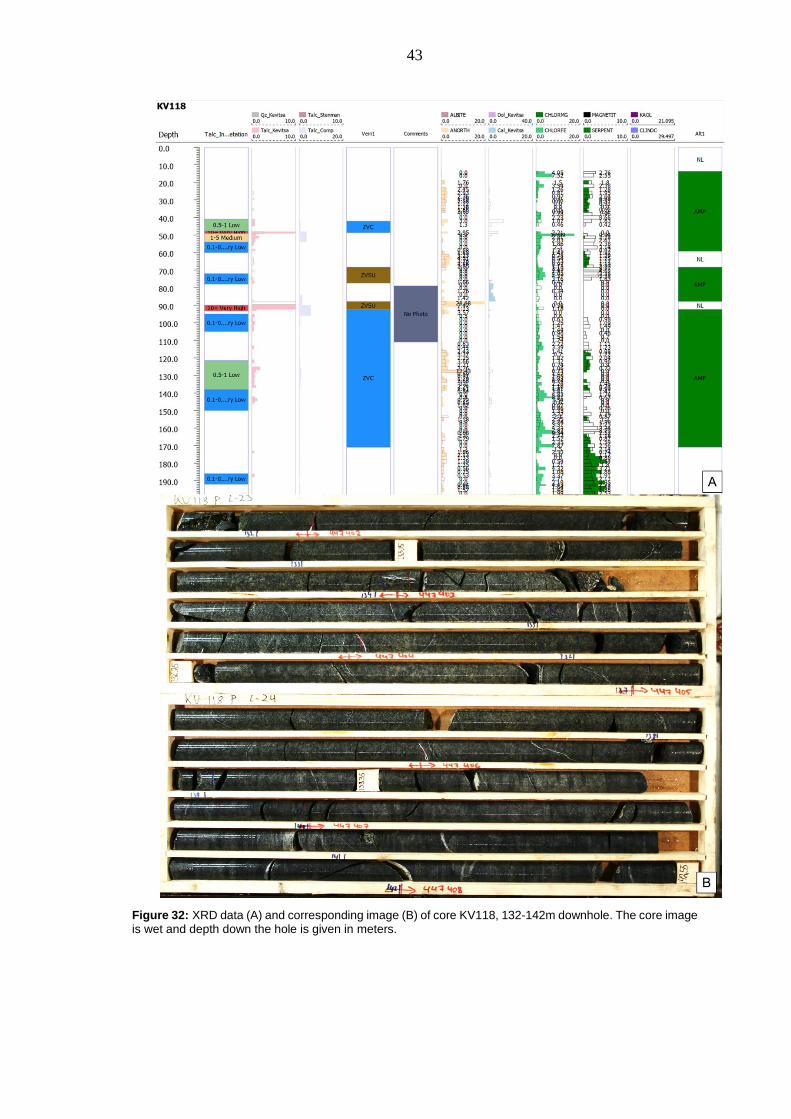
5.2.4 Talc chlorite magnetite veinlets
Talc chlorite magnetite veinlets are common across the intrusion, delivering talc values
around 0.5 wt. %. This talc style is loosely spatially correlated with areas of higher
jointing, but in general has been observed throughout the deposit. Talc-chlorite veinlets
are also common, appearing visually similar. The most characteristic appearance of this
alteration style is shown below in Figure 32. The drillhole correlation in panel A displays
common mineral associations as well as logged alteration. Images are representative of
much of the core seen in Kevitsa (Panel B, Figure 32).
43
Figure 32: XRD data (A) and corresponding image (B) of core KV118, 132-142m downhole. The core image is wet and depth down the hole is given in meters.
44
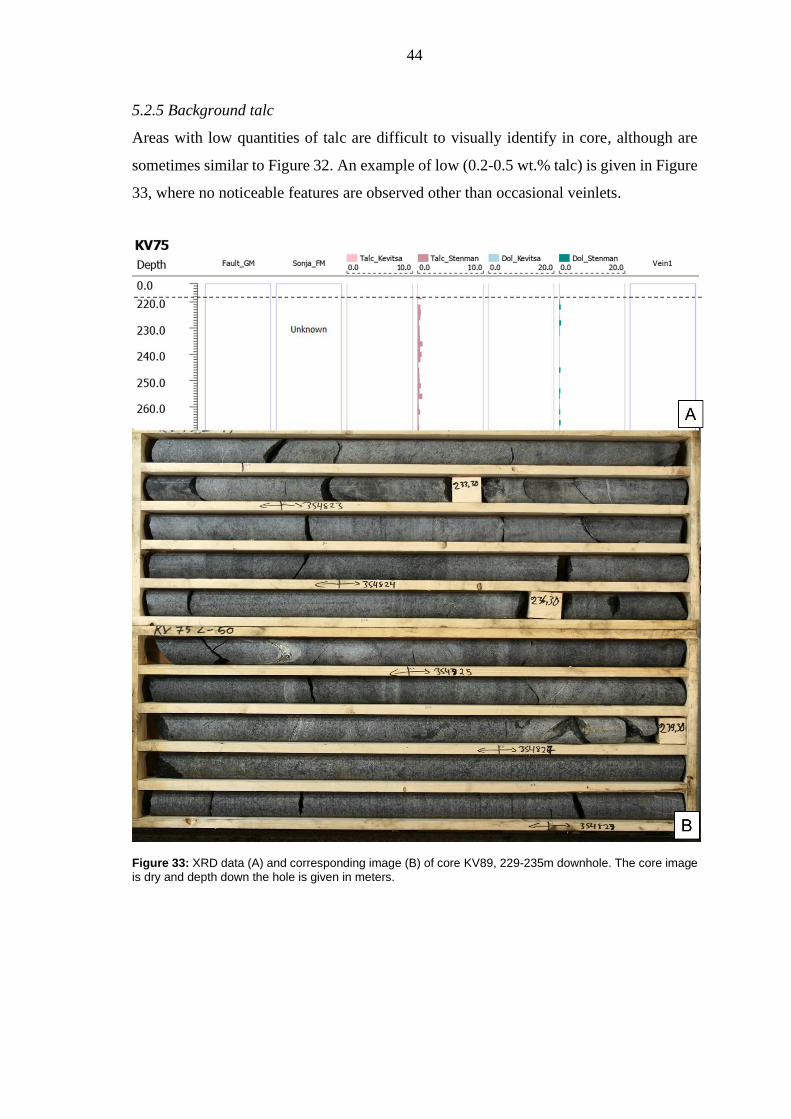
5.2.5 Background talc
Areas with low quantities of talc are difficult to visually identify in core, although are
sometimes similar to Figure 32. An example of low (0.2-0.5 wt.% talc) is given in Figure
33, where no noticeable features are observed other than occasional veinlets.
Figure 33: XRD data (A) and corresponding image (B) of core KV89, 229-235m downhole. The core image
is dry and depth down the hole is given in meters.
45
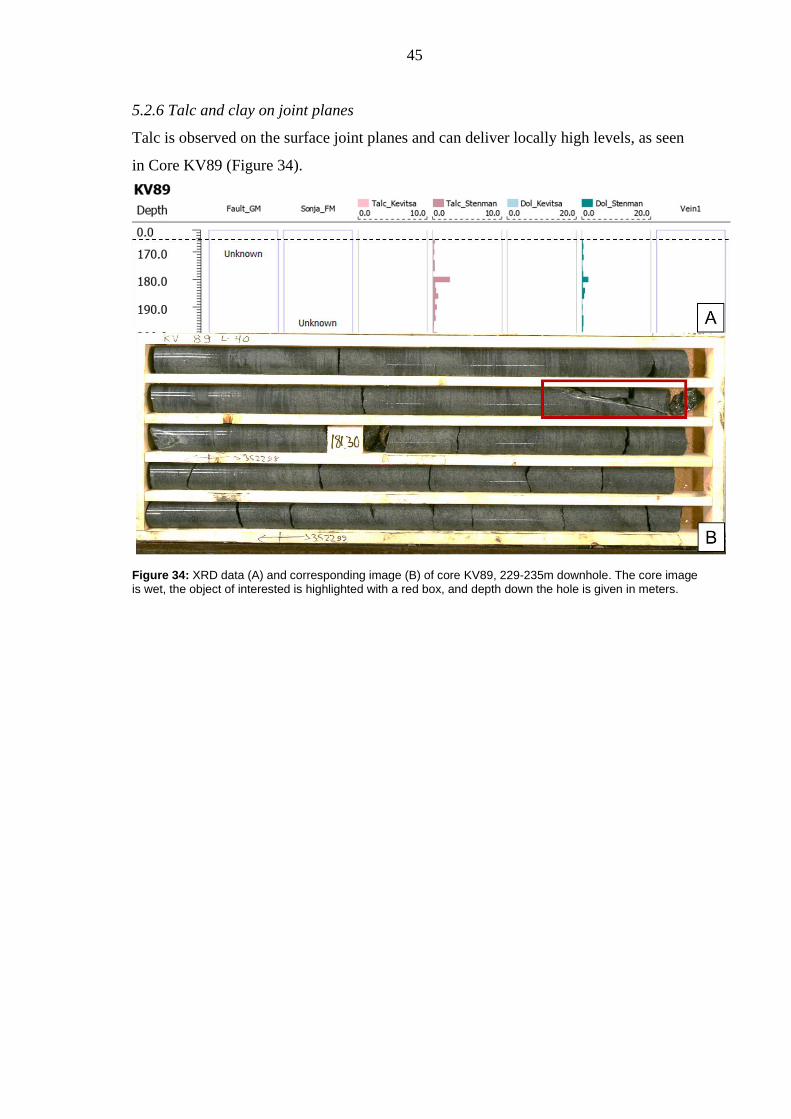
5.2.6 Talc and clay on joint planes
Talc is observed on the surface joint planes and can deliver locally high levels, as seen
in Core KV89 (Figure 34).
Figure 34: XRD data (A) and corresponding image (B) of core KV89, 229-235m downhole. The core image is wet, the object of interested is highlighted with a red box, and depth down the hole is given in meters.
46
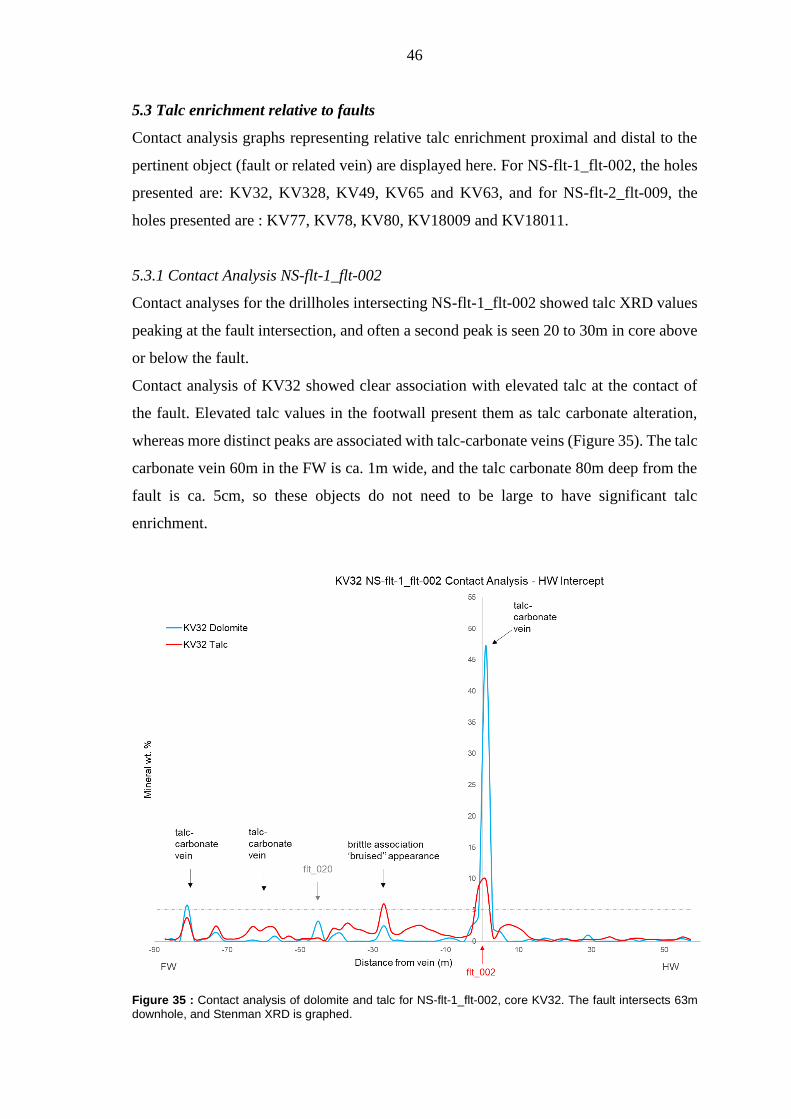
5.3 Talc enrichment relative to faults
Contact analysis graphs representing relative talc enrichment proximal and distal to the
pertinent object (fault or related vein) are displayed here. For NS-flt-1_flt-002, the holes
presented are: KV32, KV328, KV49, KV65 and KV63, and for NS-flt-2_flt-009, the
holes presented are : KV77, KV78, KV80, KV18009 and KV18011.
5.3.1 Contact Analysis NS-flt-1_flt-002
Contact analyses for the drillholes intersecting NS-flt-1_flt-002 showed talc XRD values
peaking at the fault intersection, and often a second peak is seen 20 to 30m in core above
or below the fault.
Contact analysis of KV32 showed clear association with elevated talc at the contact of
the fault. Elevated talc values in the footwall present them as talc carbonate alteration,
whereas more distinct peaks are associated with talc-carbonate veins (Figure 35). The talc
carbonate vein 60m in the FW is ca. 1m wide, and the talc carbonate 80m deep from the
fault is ca. 5cm, so these objects do not need to be large to have significant talc
enrichment.
Figure 35 : Contact analysis of dolomite and talc for NS-flt-1_flt-002, core KV32. The fault intersects 63m
downhole, and Stenman XRD is graphed.
47
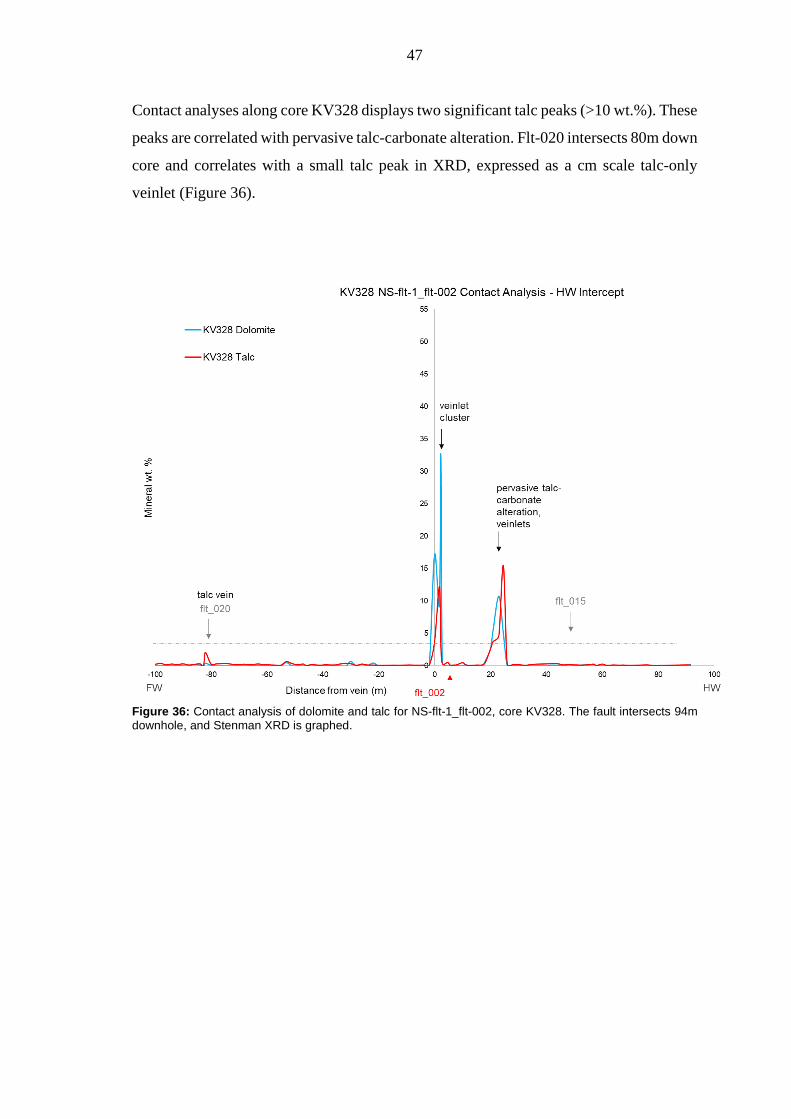
Contact analyses along core KV328 displays two significant talc peaks (>10 wt.%). These
peaks are correlated with pervasive talc-carbonate alteration. Flt-020 intersects 80m down
core and correlates with a small talc peak in XRD, expressed as a cm scale talc-only
veinlet (Figure 36).
Figure 36: Contact analysis of dolomite and talc for NS-flt-1_flt-002, core KV328. The fault intersects 94m downhole, and Stenman XRD is graphed.
48
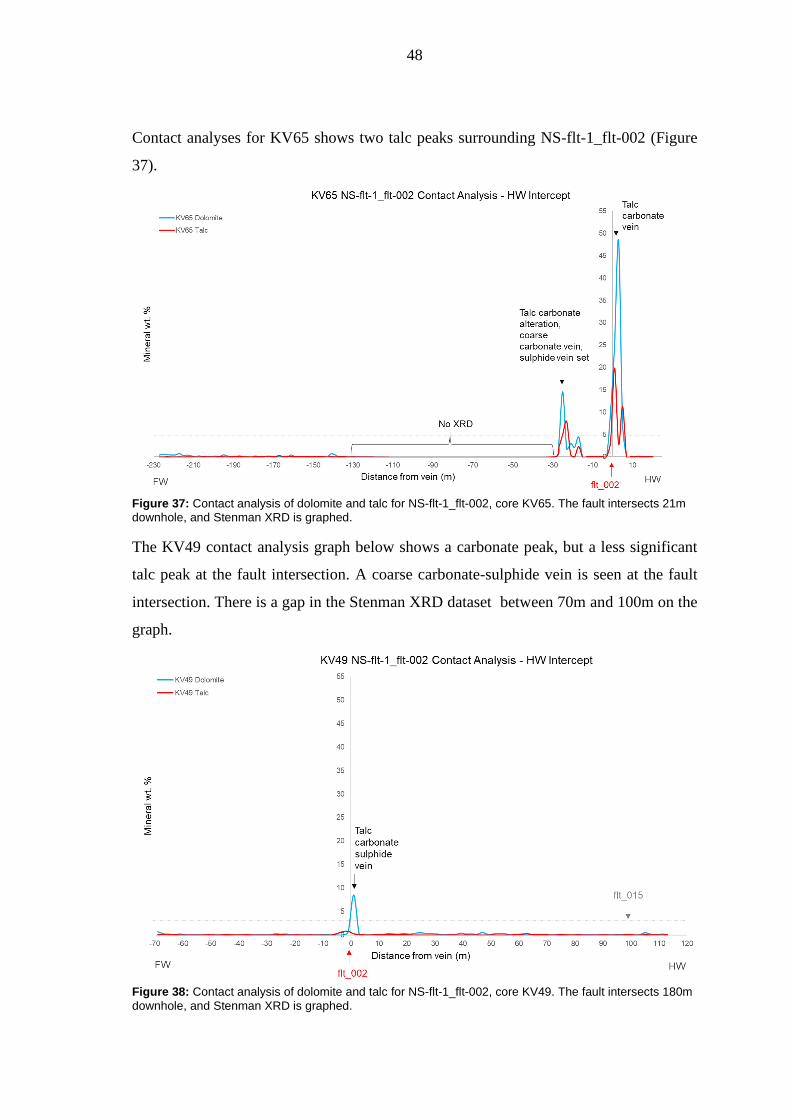
Contact analyses for KV65 shows two talc peaks surrounding NS-flt-1_flt-002 (Figure
37).
Figure 37: Contact analysis of dolomite and talc for NS-flt-1_flt-002, core KV65. The fault intersects 21m downhole, and Stenman XRD is graphed.
The KV49 contact analysis graph below shows a carbonate peak, but a less significant
talc peak at the fault intersection. A coarse carbonate-sulphide vein is seen at the fault
intersection. There is a gap in the Stenman XRD dataset between 70m and 100m on the
graph.
Figure 38: Contact analysis of dolomite and talc for NS-flt-1_flt-002, core KV49. The fault intersects 180m
downhole, and Stenman XRD is graphed.
49
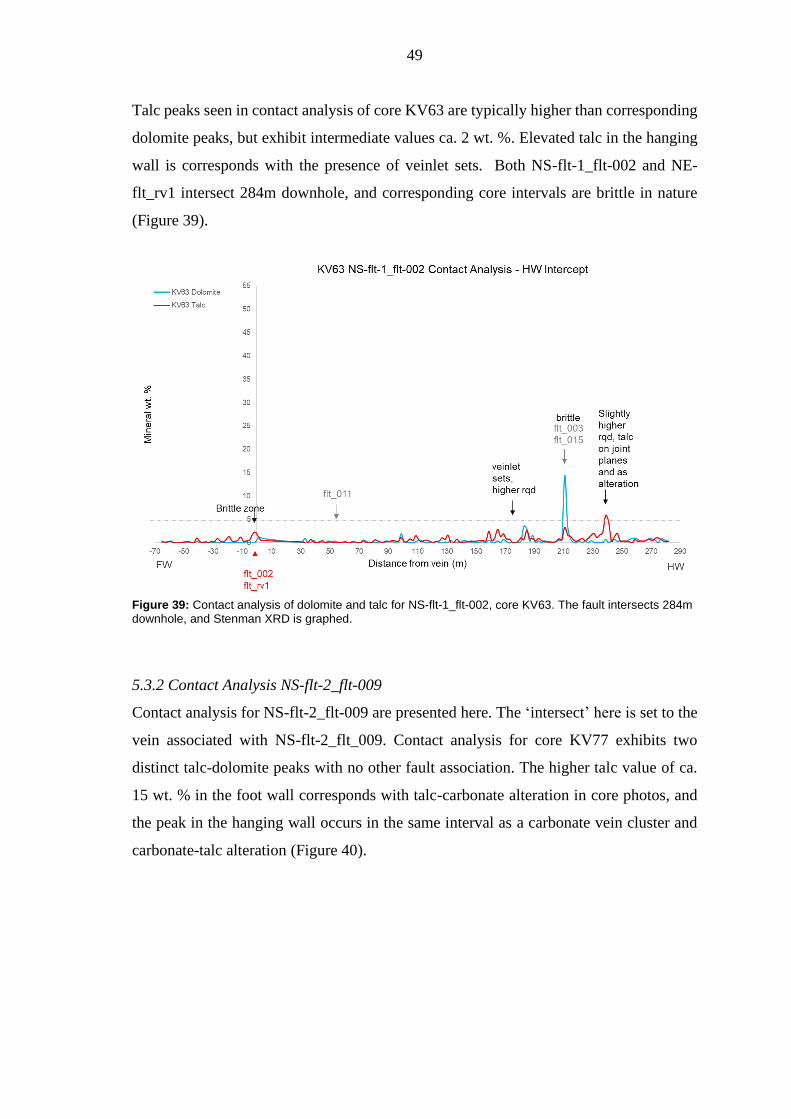
Talc peaks seen in contact analysis of core KV63 are typically higher than corresponding
dolomite peaks, but exhibit intermediate values ca. 2 wt. %. Elevated talc in the hanging
wall is corresponds with the presence of veinlet sets. Both NS-flt-1_flt-002 and NE-
flt_rv1 intersect 284m downhole, and corresponding core intervals are brittle in nature
(Figure 39).
Figure 39: Contact analysis of dolomite and talc for NS-flt-1_flt-002, core KV63. The fault intersects 284m downhole, and Stenman XRD is graphed.
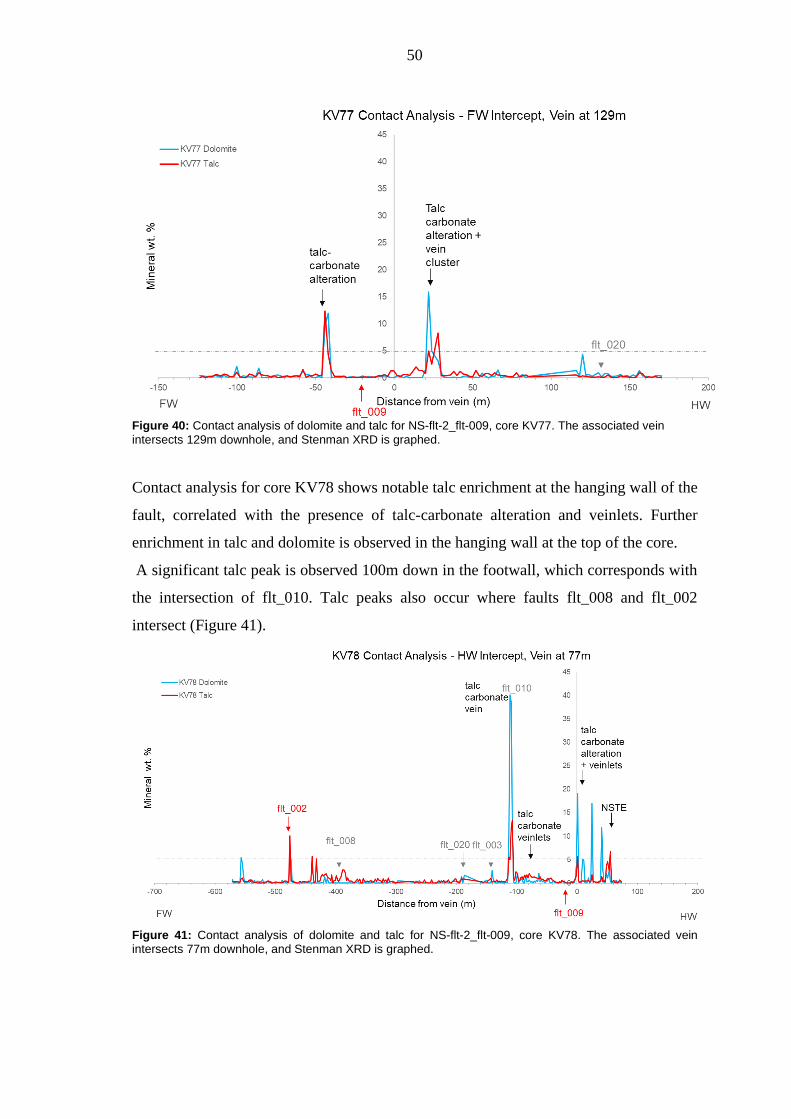
5.3.2 Contact Analysis NS-flt-2_flt-009
Contact analysis for NS-flt-2_flt-009 are presented here. The ‘intersect’ here is set to the
vein associated with NS-flt-2_flt_009. Contact analysis for core KV77 exhibits two
distinct talc-dolomite peaks with no other fault association. The higher talc value of ca.
15 wt. % in the foot wall corresponds with talc-carbonate alteration in core photos, and
the peak in the hanging wall occurs in the same interval as a carbonate vein cluster and
carbonate-talc alteration (Figure 40).
50
Figure 40: Contact analysis of dolomite and talc for NS-flt-2_flt-009, core KV77. The associated vein
intersects 129m downhole, and Stenman XRD is graphed.
Contact analysis for core KV78 shows notable talc enrichment at the hanging wall of the
fault, correlated with the presence of talc-carbonate alteration and veinlets. Further
enrichment in talc and dolomite is observed in the hanging wall at the top of the core.
A significant talc peak is observed 100m down in the footwall, which corresponds with
the intersection of flt_010. Talc peaks also occur where faults flt_008 and flt_002
intersect (Figure 41).
Figure 41: Contact analysis of dolomite and talc for NS-flt-2_flt-009, core KV78. The associated vein intersects 77m downhole, and Stenman XRD is graphed.
51
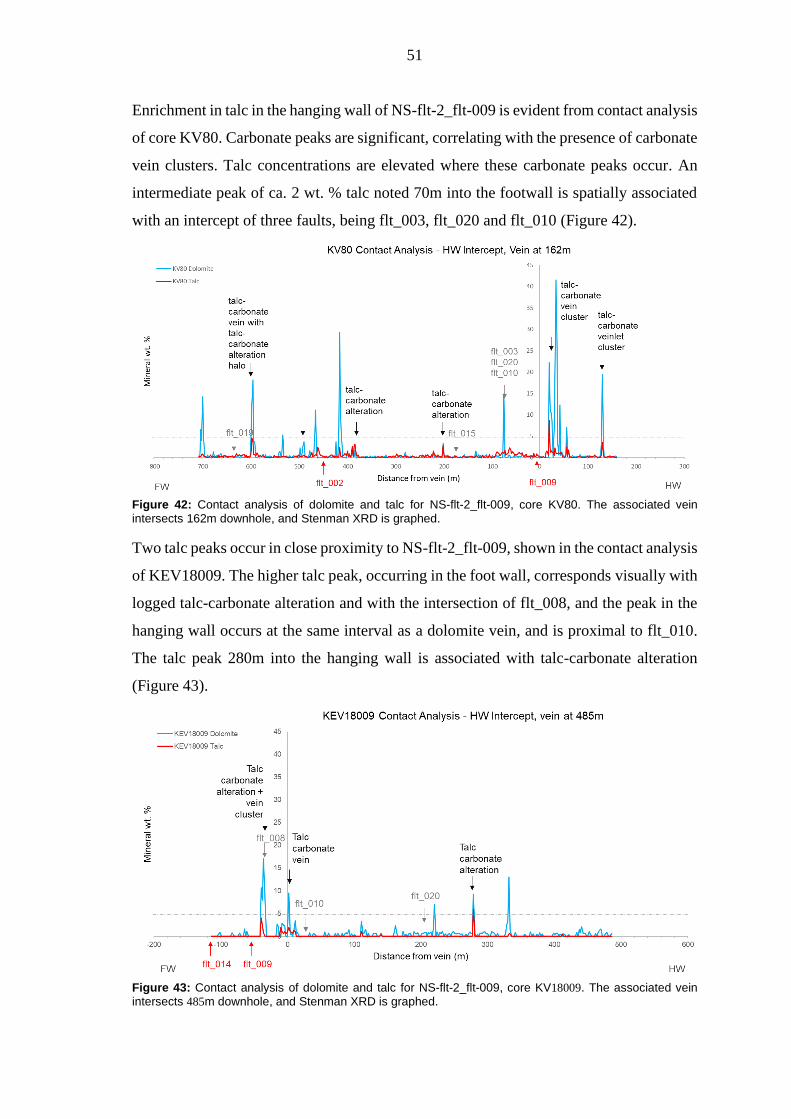
Enrichment in talc in the hanging wall of NS-flt-2_flt-009 is evident from contact analysis
of core KV80. Carbonate peaks are significant, correlating with the presence of carbonate
vein clusters. Talc concentrations are elevated where these carbonate peaks occur. An
intermediate peak of ca. 2 wt. % talc noted 70m into the footwall is spatially associated
with an intercept of three faults, being flt_003, flt_020 and flt_010 (Figure 42).
Figure 42: Contact analysis of dolomite and talc for NS-flt-2_flt-009, core KV80. The associated vein intersects 162m downhole, and Stenman XRD is graphed.
Two talc peaks occur in close proximity to NS-flt-2_flt-009, shown in the contact analysis
of KEV18009. The higher talc peak, occurring in the foot wall, corresponds visually with
logged talc-carbonate alteration and with the intersection of flt_008, and the peak in the
hanging wall occurs at the same interval as a dolomite vein, and is proximal to flt_010.
The talc peak 280m into the hanging wall is associated with talc-carbonate alteration
(Figure 43).
Figure 43: Contact analysis of dolomite and talc for NS-flt-2_flt-009, core KV18009. The associated vein intersects 485m downhole, and Stenman XRD is graphed.
52
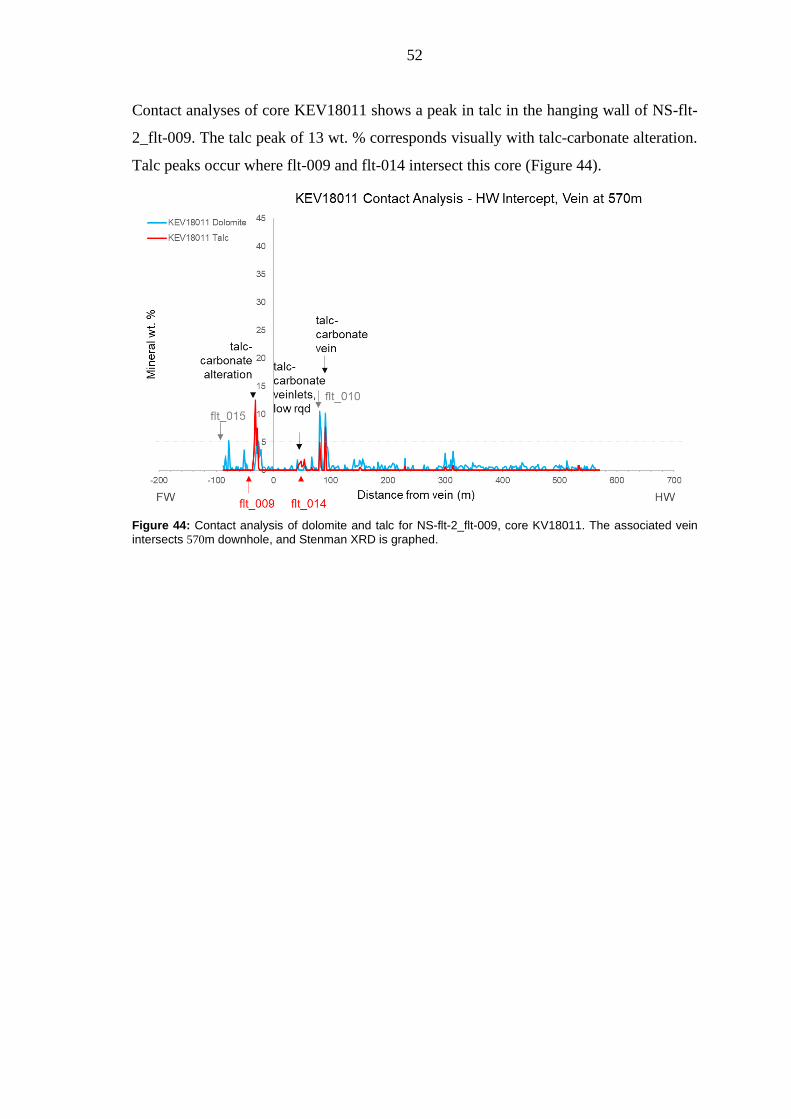
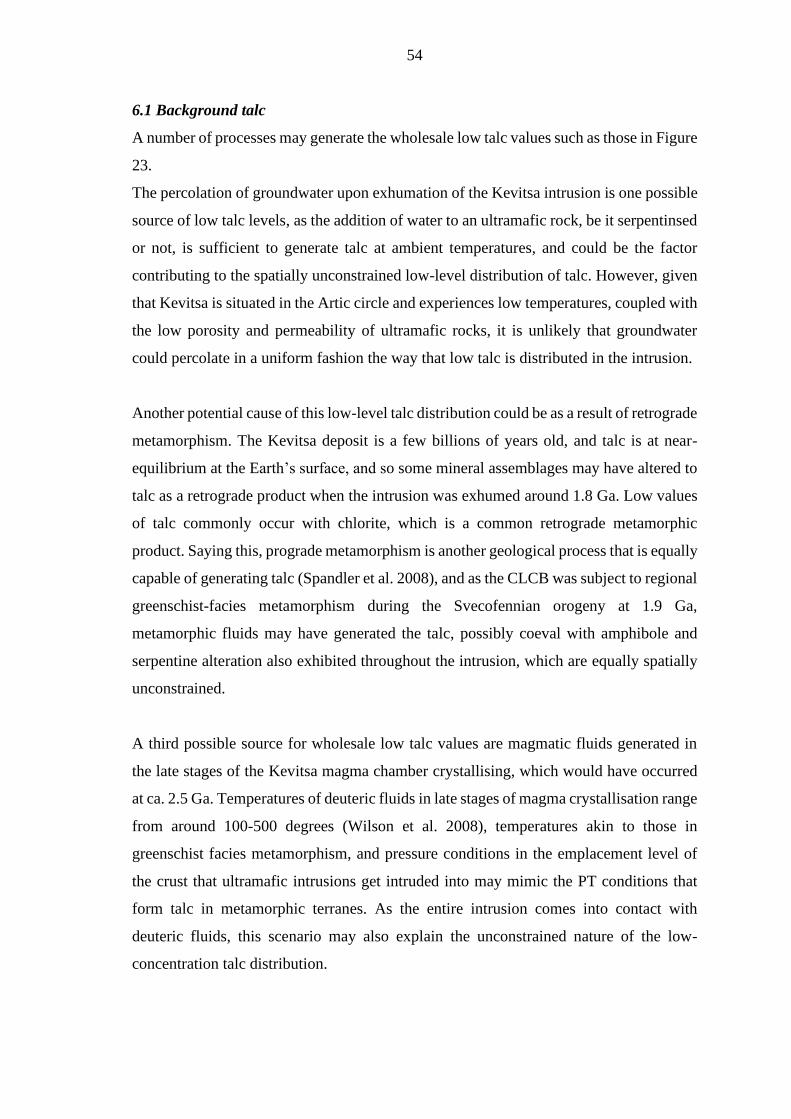
Contact analyses of core KEV18011 shows a peak in talc in the hanging wall of NS-flt-
2_flt-009. The talc peak of 13 wt. % corresponds visually with talc-carbonate alteration.
Talc peaks occur where flt-009 and flt-014 intersect this core (Figure 44).
Figure 44: Contact analysis of dolomite and talc for NS-flt-2_flt-009, core KV18011. The associated vein
intersects 570m downhole, and Stenman XRD is graphed.
53
6. Discussion
Results delivered by the 3D visualisation of XRD data revealed the preferential spatial
distribution of high, medium, and low talc values. Noticeable spatial associations of high
talc values were observed occurring in the same areas as high dolomite values.
Intermediate values showed a spatial association with magnetite which may be related to
serpentine alteration, and low values generally did not show any strong association with
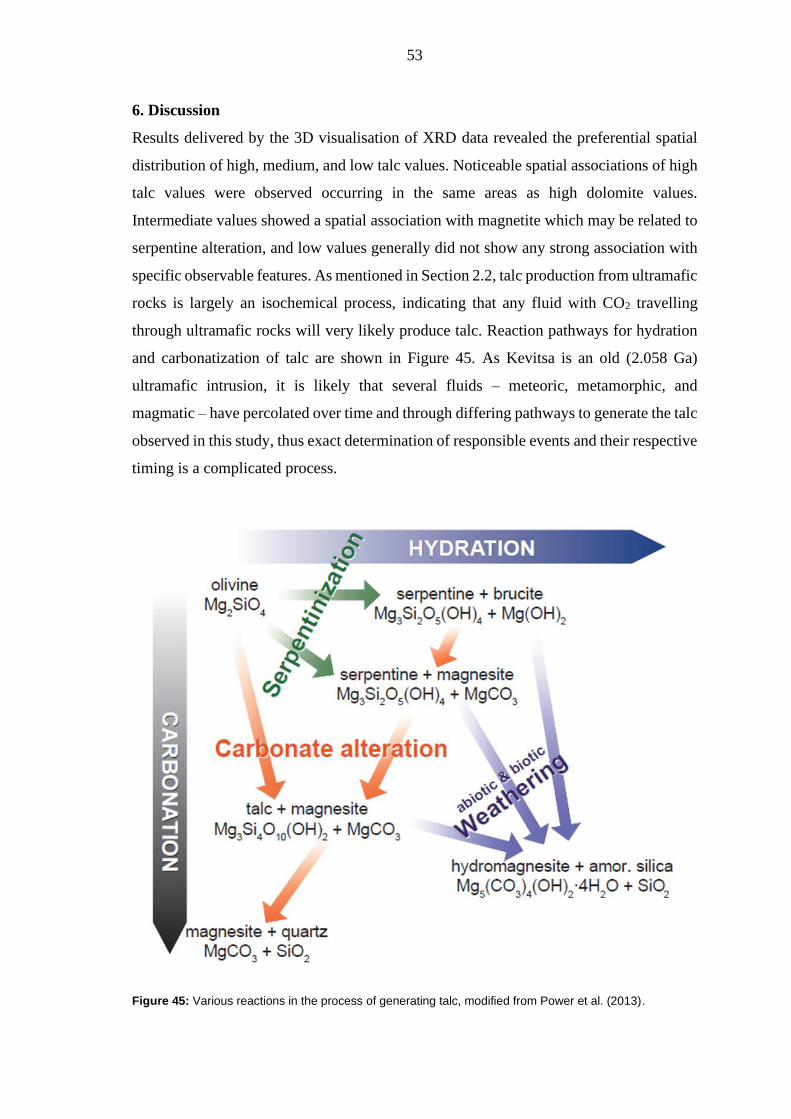
specific observable features. As mentioned in Section 2.2, talc production from ultramafic
rocks is largely an isochemical process, indicating that any fluid with CO2 travelling
through ultramafic rocks will very likely produce talc. Reaction pathways for hydration
and carbonatization of talc are shown in Figure 45. As Kevitsa is an old (2.058 Ga)
ultramafic intrusion, it is likely that several fluids – meteoric, metamorphic, and
magmatic – have percolated over time and through differing pathways to generate the talc
observed in this study, thus exact determination of responsible events and their respective
timing is a complicated process.
Figure 45: Various reactions in the process of generating talc, modified from Power et al. (2013).
54
6.1 Background talc
A number of processes may generate the wholesale low talc values such as those in Figure
23.
The percolation of groundwater upon exhumation of the Kevitsa intrusion is one possible
source of low talc levels, as the addition of water to an ultramafic rock, be it serpentinsed
or not, is sufficient to generate talc at ambient temperatures, and could be the factor
contributing to the spatially unconstrained low-level distribution of talc. However, given
that Kevitsa is situated in the Artic circle and experiences low temperatures, coupled with
the low porosity and permeability of ultramafic rocks, it is unlikely that groundwater
could percolate in a uniform fashion the way that low talc is distributed in the intrusion.
Another potential cause of this low-level talc distribution could be as a result of retrograde
metamorphism. The Kevitsa deposit is a few billions of years old, and talc is at near-
equilibrium at the Earth’s surface, and so some mineral assemblages may have altered to
talc as a retrograde product when the intrusion was exhumed around 1.8 Ga. Low values
of talc commonly occur with chlorite, which is a common retrograde metamorphic
product. Saying this, prograde metamorphism is another geological process that is equally
capable of generating talc (Spandler et al. 2008), and as the CLCB was subject to regional
greenschist-facies metamorphism during the Svecofennian orogeny at 1.9 Ga,
metamorphic fluids may have generated the talc, possibly coeval with amphibole and
serpentine alteration also exhibited throughout the intrusion, which are equally spatially
unconstrained.
A third possible source for wholesale low talc values are magmatic fluids generated in
the late stages of the Kevitsa magma chamber crystallising, which would have occurred
at ca. 2.5 Ga. Temperatures of deuteric fluids in late stages of magma crystallisation range
from around 100-500 degrees (Wilson et al. 2008), temperatures akin to those in
greenschist facies metamorphism, and pressure conditions in the emplacement level of
the crust that ultramafic intrusions get intruded into may mimic the PT conditions that
form talc in metamorphic terranes. As the entire intrusion comes into contact with
deuteric fluids, this scenario may also explain the unconstrained nature of the low-
concentration talc distribution.
55
6.2 Talc-carbonate assemblages
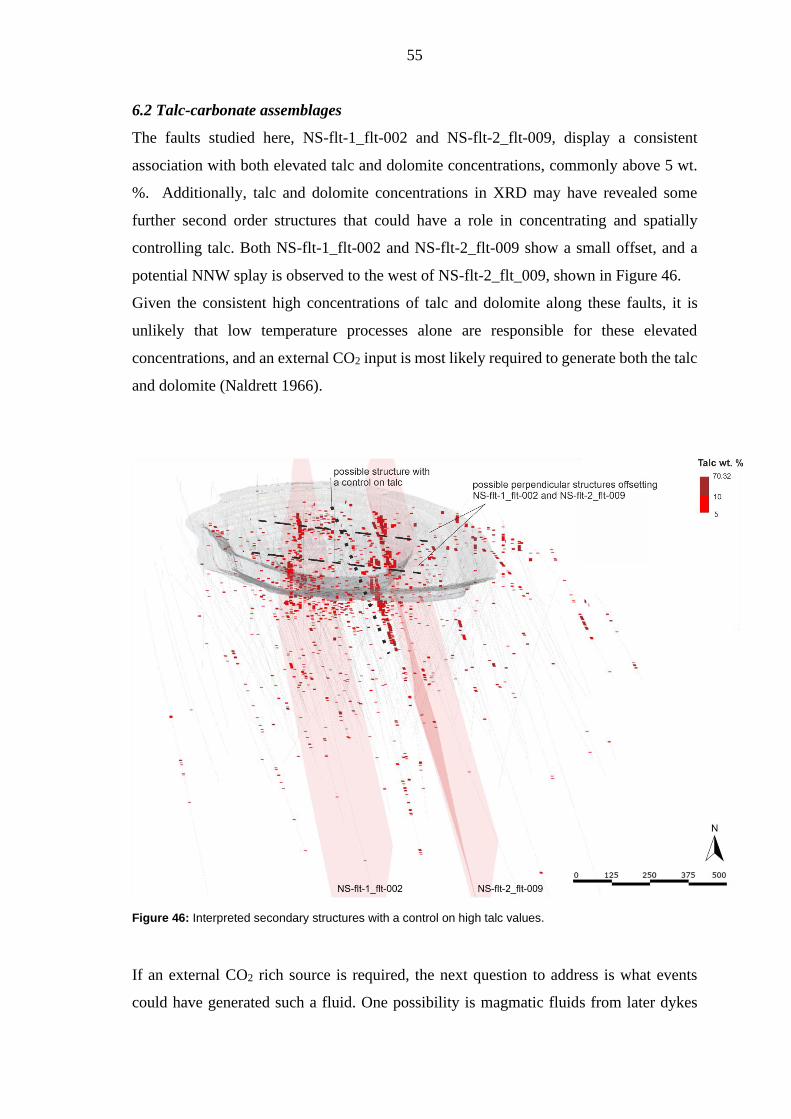
The faults studied here, NS-flt-1_flt-002 and NS-flt-2_flt-009, display a consistent
association with both elevated talc and dolomite concentrations, commonly above 5 wt.
%. Additionally, talc and dolomite concentrations in XRD may have revealed some
further second order structures that could have a role in concentrating and spatially
controlling talc. Both NS-flt-1_flt-002 and NS-flt-2_flt-009 show a small offset, and a
potential NNW splay is observed to the west of NS-flt-2_flt_009, shown in Figure 46.
Given the consistent high concentrations of talc and dolomite along these faults, it is
unlikely that low temperature processes alone are responsible for these elevated
concentrations, and an external CO2 input is most likely required to generate both the talc
and dolomite (Naldrett 1966).
Figure 46: Interpreted secondary structures with a control on high talc values.
If an external CO2 rich source is required, the next question to address is what events
could have generated such a fluid. One possibility is magmatic fluids from later dykes
56
crosscutting Kevitsa. Boliden geologists have interpreted the faults NS-flt-1_flt-002 and
NS-flt-2_flt-009 as potentially metasomatised dykes. If this is the case, CO2 bearing
magmatic fluids could have served as the “separate hydrothermal event” that generated
this extensive carbonate alteration (Naldrett 1966) producing talc–magnesite and
magnesite– quartz assemblages (Power et al. 2013).
However, no primary igneous textures were observed along these faults in the drillholes
studied in this project, so another source for these CO2 rich fluids should be explored.
Metasomatic fluids released by minerals in prograde metamorphism may be an alternative
source. A deep-seated structure identified in geophysical studies (see Koivitso et al. 2015)
could serve as a deeper conduit where CO2 rich fluids could have been channelled,
connecting north-south trending, steeply dipping structures at depth. These fluids may
manifest themselves as the talc-dolomite veins infilling NS-flt-1_flt-002 and NS-flt-2_flt-
009. Fractures and increased porosity around a then-brittle fault plane where fluids
containing dolomite, silica and water were crystallising would serve as a location for talc
calcite and CO2 to precipitate, replacing intercumulus minerals, via a ‘skarnification’
process promoting talc generation (Equation 3, Section 2.2) now observed as talc-
carbonate alteration.
6.3 Brittle talc
NE-flt_rv1 also exhibits elevated talc values between 1-5 wt. % talc, but not to the extent
of NS-flt-1_flt-002 and NS-flt-2_flt-009. The processes resulting in the enhancement of
talc along brittle structures such as NE-flt-rv1 could be a lower temperature process.
Serpentinisation and carbonatisation of ultramafic rocks can occur at low temperatures,
below 50 degrees Celsius, with associated talc (Bjerga et al. 2015). The relationship
between serpentine and talc at Kevitsa is not fully understood, but they appear to have
some correlation. Serpentine is generated by hydrating olivine and pyroxene, which
contain iron and magnesium. Serpentine does not readily accept iron, and so extra iron
goes into mineral phases like magnetite (O’Hanley and Dyar 1993). Serpentine only
requires some CO2 to form talc magnesite and water, and so it is possible that further
hydration of serpentine around brittle zones would generate talc and explain associated
elevated magnetite values. As serpentine alteration is viewed as the first alteration stage
at Kevitsa (LeVaillant et al. 2016), it is likely that serpentine alteration preceded late
brittle structures such as NE-flt-rv1, and the input of meteoric water would locally
enhance talc formation, while also locally producing magnetite and chlorite. The
57
chemical reaction occurring could be similar to Equations 1 and 2 in Section 2.2, much
the same as the reactions generating ‘wholesale talc’, just more concentrated as the brittle
structure allows a greater volume of water to move through the rock in these areas. It is
likely that magnesite is also found with talc on these brittle fault planes, this cannot be
substantiated here as magnesite is not on the script for XRD performed at Kevitsa.
Movement of meteoric water through brittle structures may have further enhanced talc
concentrations along NS-flt-1_flt-002 and NS-flt-2_flt-009.
The near surface talc enrichment (which can reach concentrations exceeding 10 wt. %)
seen in cores, could be the simple product of weathering, as when olivine and
orthopyroxene break down, they generate serpentine chlorite and talc, (e.g. Robb 2005)
which are observed at Kevitsa. So, for near surface talc enrichment, the additional
concentrated input of water from permafrost and rain could elevate surface values.
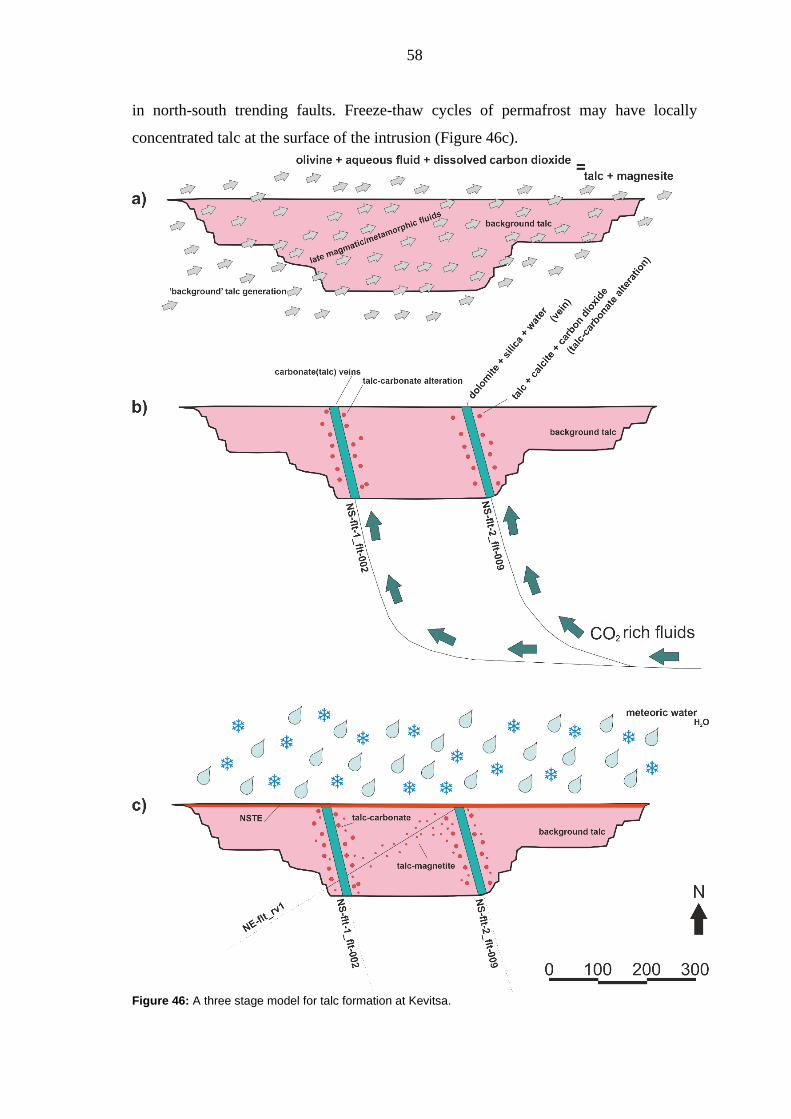
6.4 Multi-stage talc generation
Three dominant talc styles have been observed in this study, the first being pervasive talc-
chlorite alteration delivering low (0.2-0.5 wt. %) talc, the second being talc-dolomite
alteration haloes proximal to dolomite veins, responsible for high talc values in excess of
5 wt. % and the third manifesting as talc on brittle structures, associated with magnetite,
with intermediate (1-5 wt. %) concentrations of talc observed. A model is proposed for
the generation of these three talc styles at Kevitsa incorporating scenarios discussed
above, illustrated in Figure 46. This model proposes that background values of talc (style
1) serve as the first episode of talc formation (likely accompanying serpentine and
amphibole alteration), with the generation attributed to deuteric fluids (generated around
2.05 Ga) or regional greenschist facies metamorphism (Figure 46a). A second stage of
talc generation is observed as talc-carbonate veins and alteration (style 2). North-south
trending faults linked to deeper seated structures identified in Koivitso et al. (2015) may
have served as pathways for metasomatic CO2 fluids generated in the Svecofennian,
generating talc-carbonate assemblages witnessed (Figure 46b).
Low temperature processes may be responsible for talc-chlorite-magnetite generation
(style 3), observed along brittle fractures after exhumation of the Kevitsa intrusion.
Percolation of meteoric fluids along brittle fractures generated talc from olivine and
serpentine via hydration and carbonatisation, and may have upgraded talc concentrations
58
in north-south trending faults. Freeze-thaw cycles of permafrost may have locally
concentrated talc at the surface of the intrusion (Figure 46c).
Figure 46: A three stage model for talc formation at Kevitsa.
59
7. Recommendations
There are currently around 600 thin sections of various rock types and alteration styles of
the Kevitsa deposit, made by the GTK. This dataset presents an excellent opportunity for
a Bachelor’s or Master’s level thesis with a petrographic approach. Some research
stepping-stones include; assessing mineral paragenesis of the alteration minerals, with
focus on the talc and carbonate mineral timings, or, examining intercumulus alteration
replacement minerals, with a focus on talc. Additionally, samples were selected across
the high talc bearing cores during summer 2020, which could also be used in the study.
The incorporation of magnesite into the ‘Kevitsa’ XRD mineral suite may be of value, as
magnesite is one of the reaction products in the process of ultramafic weathering to
produce talc (Naldrett, 1966; Hansen et al., 2005; Power et al., 2013). Including magnesite
in the XRD suite may allow for a more accurate prediction of high talc zones along brittle
structures, as this low temperature process is likely the method generating talc in these
zones. Alternatively, a focused XRD study could be applied with shorter sample intervals,
across vein sets or veins with talc alteration haloes to determine the mineral assemblages
and possible PT conditions, in combination with a hyperspectral study, to substantiate or
disprove mechanisms proposed in the model shown in Figure 46.
Talc zones were identified using 3D seismic data (Malehmir et al., 2012; Koivitso et al.,
2015). A higher resolution 3D seismic survey at depth may serve as a useful predictive
method to identify high talc zones well in advance of the mining process.
8. Conclusions
This project identified three preferred talc distribution styles across the Kevitsa intrusion,
dependent on talc concentrations, and proposed a multistage model for talc generation.
Low concentrations of talc (> 0.5 wt. %) (style 1) found no preferential spatial
distribution, occurring across the mine as a background alteration product, postulated to
be the result of deuteric fluids generated at the late stage of intrusion crystallisation, or
generated in greenschist-facies metamorphism during the Svecofennian orogeny.
Higher talc concentrations (>5 wt. %) have a dominant carbonate (dolomite, magnesite
or calcite) association (style 2). Carbonate veins themselves tend not to contain the
highest talc concentrations, rather, highest talc values are found around alteration haloes
60
surrounding these veins. Highest talc occurrences (5 wt. % and above) occur around
carbonate vein clusters, postulated to be due to the possible fractured nature of the rock
preceding percolation of CO2 bearing fluids, allowing for more dominant talc alteration
to concentrate in fracture spaces and allowing fluids to react with intercumulus minerals.
The generation of this style is attributed to metasomatic CO2 rich fluids, as the second
talc generation event.
Intermediate talc concentrations (1-5 wt. %) were found to be associated with brittle
structures (style 3) and were likely generated through low temperature hydration and
carbonatisation of ultramafic rocks through the percolation of meteoric water, occurring
after exhumation of the intrusion and continuing to the present day. This low temperature
process may have also upgraded talc associated in style 2. Talc and magnetite observe a
spatial relationship, specifically highlighted along brittle structures, attributed to further
hydration of serpentine-group minerals. Near surface talc enrichment is also linked to
meteoric waters, with talc values upgraded through freeze-thaw cycles of permafrost.
A dominant structural association with intermediate to high talc values (1 wt. % and
above) was observed. The structures focused on in this project had significant talc
associations, with shallowly-dipping NE-flt-rv1 associated with talc style 3, and the two
steeply dipping NS trending faults NS-flt-1_flt-002 and NS-flt-2_flt-009 associated with
talc style 2. However, not all faults that are interpreted currently have a strong control on
talc, and not all talc is structurally controlled.
As faults cross-cutting Kevitsa are not insignificant structures, it is likely that structures
similar to these, or continuations of these structures commonly do generate high
concentrations of talc when intersecting other ultramafic intrusions in the CLCB.
Investigating the presence of talc at other deposits such as the Sakatti prosect would add
to the understanding gained from Kevitsa and give further clarity to controls on talc
distribution in ultramafic intrusions.
61
Acknowledgements
Sincerest thanks are given to Loraine Berthet and Dr Sonja Pabst for their continued
support, input, and advice throughout the duration of this project. I have learned a great
deal working with you both, thank you for your guidance. To Dr Petri Peltonen, for your
key ideas and direction, assurance, and unparalleled knowledge of the geology of Kevitsa.
To Dr Jonathan Pownall for his insightful corrections and continual encouragement. To
Boliden for this opportunity, and access to a -quite literal- mines’ wealth of data. And
finally, to family and friends in Finland and abroad, whose support held me through this
project during a challenging global environment.
REFERENCES
Agnico Eagle (2020). Operations. [online] Agnico Eagle Finland Oy. Available at:
http://agnicoeagle.fi/about-us/operation/ [Accessed October 2020].
AngloAmerican, (2020). About Sakatti. [online] AA Sakatti Mining Oy. Available at:
https://finland.angloamerican.com/en/about-sakatti [Accessed October 2020].
Barnes, S-J. and Lightfoot, P.C. (2005). Formation of magmatic nickel-sulfide ore deposits
and processes affecting their copper and platinum-group element contents. In
Hedenquist, J.W., Thompson, J.F.H., Goldfarb, R.J. and Richards, J.P. (eds.) Economic
Geology 100th Anniversary Volume, pp. 179-213.
Bjerga, A.; Konopásek, J.; Pedersen, R.B. (2015). Talc–carbonate alteration of ultramafic
rocks within the Leka Ophiolite Complex, Central Norway. Lithos, pp. 227(), 21–36.
doi:10.1016/j.lithos.2015.03.016
Boliden (2020). Boliden Kevitsa - Boliden. [online] Boliden Kevitsa Mining Oy. Available at:
https://www.boliden.com/operations/mines/boliden-kevitsa [Accessed November 2020].
Cawood, P. A. & Hawkesworth, C. J. (2015). Temporal relations between mineral deposits
and global tectonic cycles: implications for prospectivity. In: Jenkin, G. R. T., Lusty, P. A.
J., McDonald, I., Smith, M. P., Boyce, A. J. & Wilkinson, J. J. (eds) Ore Deposits in an
Evolving Earth. Geological Society, London, Special Publications, pp. 393, 9–21.
Farrokhpay, S., Ndlovu, B. and Bradshaw, D., 2018. Behavior of talc and mica in copper ore
flotation. Applied Clay Science, 160, pp. 270-275. https://doi.org/10.1016/j.clay.2018.02.011
Gervilla, F. and Kojonen, K., 2002. The platinum-group minerals in the upper section of the
Keivitsansarvi Ni–Cu–PGE deposit, northern Finland. The Canadian Mineralogist, 40(2),
pp. 377-394. https://doi.org/10.2113/gscanmin.40.2.377
Gervilla, F., Kojonen, K., Parkkinen, J. & Välimaa, J. (2003), Platinum-group element
mineralogy, geochemistry and 3-D modelling of the Keivitsa Ni-Cu-PGE sulfide deposit,
northern Finland, in: Eliopoulos et. al. eds. Mineral Exploration and Sustainable
Development, Proceedings of the Seventh Biennial Meeting, Athens, Greece, 24-28 August,
2003, Millpress, pp. 583-586.
62
Gregory, J., N. Journet, G. White, and M. Lappalainen, (2011). Kevitsa copper nickel project
in Finland: Technical Report for the Mineral Resources and Reserves of the Kevitsa
Project, 52, First Quantum Minerals Ltd.
Hansen, L., Dipple, G., Gordon, T. and Kellett, D., (2005). Carbonated serpentinite (listwanite)
at Atlin, British Columbia: a geological analogue to carbon dioxide sequestration. The
Canadian Mineralogist, 43(1), pp. 225-239. https://doi.org/10.2113/gscanmin.43.1.225
Hanski, E., Huhma, H., Suominen, I.M., Walker, R.J., (1997). Geochemical and isotopic (Os,
Nd) study of the Keivitsa intrusion and its Cu-Ni deposit, northern Finland. Turku,
Finland, August 11–13. In: Papunen, H. (Ed.), Mineral Deposits: Research and Exploration—
Where Do They Meet? Proceedings of the 4th Biennial SGA Meeting. A.A. Balkema,
Rotterdam, pp. 435–438.
Hanski, E. & Huhma, H. (2005). Central Lapland greenstone belt. In: Lehtinen, M. Nurmi, P.A.
& Rämö, O.T. (eds.) Precambrian geology of Finland – Key to the evolution of the
Fennoscandian Shield. Elsevier, Amsterdam, pp. 139-194.
Herrington, R. (2011). Chapter 3.1; Geological Features and Genetic Models of Mineral
Deposits. In: Darling, P. (2011). SME Mining Engineering Handbook. [Englewood, Colo].
Society for Mining, Metallurgy and Exploration. pp. 83-104.
s930174202460df25.jimcontent.com
Holwell, D.A., Adeyemi, Z., Ward, L.A., Smith, D.J., Graham, S.D., McDonald, I. and Smith,
J.W., 2017. Low temperature alteration of magmatic Ni-Cu-PGE sulfides as a source for
hydrothermal Ni and PGE ores: A quantitative approach using automated
mineralogy. Ore Geology Reviews, 91, pp. 718-740.
https://doi.org/10.1016/j.oregeorev.2017.08.025
Huhma, H., Hanski, E., Kontinen, A., Vuollo, J., Mänttäri, I. and Lahaye, Y., 2018. Sm–Nd and
U–Pb isotope geochemistry of the Palaeoproterozoic mafic magmatism in eastern and
northern Finland. Geological Survey of Finland. Bulletin, 405, pp. 150.
http://tupa.gtk.fi/julkaisu/bulletin/bt_405.pdf
Jigsaw, (2009) Structural investigations at the Kevitsa Ni-Cu-PGE mine and surrounding
areas, Finland. Unpublished confidential report for First Quantium Minerals Ltd.
Kelemen, P.B. and Hirth, G., (2012). Reaction-driven cracking during retrograde
metamorphism: Olivine hydration and carbonation. Earth and Planetary Science
Letters, 345, pp. 81-89. https://doi.org/10.1016/j.epsl.2012.06.018
Koivitso, K. (2012). Kevitsa 3D structural model from the (2D and) 3D seismic data.
Unpublished confidential report for First Quantum Minerals. 9 pages.
Koivitso, E., Malehmir, A., Hellqvist, N., Voipio, T. and Wijns, C., (2015). Building a 3D model
of lithological contacts and near‐mine structures in the Kevitsa mining and exploration
site, Northern Finland: constraints from 2D and 3D reflection seismic data. Geophysical
Prospecting, 63 (Hard Rock Seismic imaging), pp. 754-773.
Kokko, Sini-Maaria (2018). Boliden Summary Report, Resources and Reserves 2018. Kevitsa
Mine, New Boliden.https://www.boliden.com/globalassets/operations/exploration/mineral-
resources-and-mineral-reserves-pdf/resources-and-reserves-kevitsa-2018-12-31.pdf
63
Lamberg, P., Välimaa, J., Parkkinen, J., Kojonen, K. (2005). Structural, geochemical and
magmatic modelling of the early Proterozoic Keivitsa Ni-Cu-PGE deposit in Sodankylä,
northern Finland. In Törmänen, T. & Alapieti, T. (ed.) Platinum-Group Elements – From
Genesis to Beneficiation and Environmental Impact - Extended Abstracts, pp. 160-163. https://www.researchgate.net/publication/267382481_Structural_geochemical_and_magmati
c_modelling_of_the_early_Proterozoic_Keivitsa_Ni-Cu-
PGE_deposit_in_Sodankyla_northern_Finland/citations
Le Vaillant, M., Barnes, S.J., Fiorentini, M.L., Santaguida, F. and Törmänen, T., (2016). Effects
of hydrous alteration on the distribution of base metals and platinum group elements
within the Kevitsa magmatic nickel sulphide deposit. Ore Geology Reviews, 72, pp. 128-
148. https://doi.org/10.1016/j.oregeorev.2015.06.002
Le Vaillant, M., Hill, J. and Barnes, S., (2017). Simplifying Drill-Hole Domains For 3D
Geochemical Modelling: An Example From The Kevitsa Ni-Cu-(PGE) Deposit. Ore
Geology Reviews, 90, pp. 388-398. https://doi.org/10.1016/j.oregeorev.2017.05.020
Lindqvist, T., Skyttä, P., Koivisto, E., Häkkinen, T. and Somervuori, P., (2017). Delineating the
network of brittle structures with geotechnical, structural and reflection seismic data,
Kevitsa open pit, northern Finland. GeoResJ, 13, pp. 159-174.
Lu, Y., Lesher, C.M. and Deng, J., (2019). Geochemistry and genesis of magmatic Ni-Cu-
(PGE) and PGE-(Cu)-(Ni) deposits in China. Ore Geology Reviews, 107, pp.863-887.
https://doi.org/10.1016/j.oregeorev.2019.03.024
Luolavirta, K., K., Hanski, E., Mayer, W., O’Brien, H. and Santaguida, F. (2017): PhD Project:
Magmatic evolution of the Kevitsa intrusion and its relation to the Ni-Cu-(PGE)
mineralization, presentation, pp. 26.
Luolavirta, K. (2018). Magmatic evolution of the Kevitsa igneous complex, northern Finland
and its relation to the associated Ni-Cu-(PGE) mineralization. PhD thesis. University of
Oulu.
Maier, W. and Groves, D., (2011). Temporal and spatial controls on the formation of
magmatic PGE and Ni–Cu deposits. Mineralium Deposita, 46(8), pp. 841-857.
https://doi.org/10.1007/s00126-011-0339-6
Makkonen, H., Halkoaho, T., Konnunaho, J., Rasilainen, K., Kontinen, A. and Eilu, P., (2017).
Ni-(Cu-PGE) deposits in Finland – Geology and exploration potential. Ore Geology
Reviews, 90, pp. 667-696. https://doi.org/10.1016/j.oregeorev.2017.06.008
Malehmir, A., Tryggvason, A., Wijns, C., Koivisto, E., Lindqvist, T., Skyttä, P. and Montonen,
M., (2018). Why 3D seismic data are an asset for exploration and mine planning? Velocity
tomography of weakness zones in the Kevitsa Ni-Cu-PGE mine, northern
Finland. Geophysics, 83(2), pp. B33-B46.
Malehmir, A., Juhlin, C., Wijns, C., Urosevic, M., Valasti, P. and Koivisto, E., (2012). 3D
reflection seismic imaging for open-pit mine planning and deep exploration in the
Kevitsa Ni-Cu-PGE deposit, northern Finland. Geophysics, 77(5), pp. WC95-WC108.
Mutanen, T., (1997), Geology and ore petrology of the Akanvaara and Koitelainen mafic
layered intrusions and the Kevitsa-Satovaara layered complex, northern Finland:
Geological Survey of Finland, Espoo, 233 (Academic dissertation),
http://tupa.gtk.fi/julkaisu/bulletin/bt_395.pdf
64
Mutanen, T. and Huhma, H., (2001). U-Pb geochronology of the Koitelainen, Akanvaara and
Keivitsa layered intrusions and related rocks. In: Vaasjoki, M. (ed.) Radiometric age
determinations from Finnish Lapland and their bearing on the timing of Precambrian
volcanosedimentary sequences. Geological Survey of Finland. Special Paper 33, pp. 229-246
http://tupa.gtk.fi/julkaisu/specialpaper/sp_033.pdf
Naldrett, A., (1966). Talc-Carbonate Alteration of some Serpentinized Ultramafic Rocks
south of Timmins, Ontario. Journal of Petrology, 7(3), pp. 489-499.
https://doi.org/10.1093/petrology/7.3.489
Naldrett, A., (2010a). From The Mantle to The Bank: The Life Of A Ni-Cu-(Pge) Sulfide
Deposit. South African Journal of Geology, 113(1), pp.1-32.
https://doi.org/10.2113/gssajg.113.1-1
Naldrett, A., (2010b). Secular Variation of Magmatic Sulfide Deposits and Their Source
Magmas. Economic Geology, 105(3), pp. 669-688.
doi.org/10.2113/gsecongeo.105.3.669
Naldrett, A., (2011). Fundamentals of Magmatic Sulfide Deposits. In: Li, C., & Ripley, E.
Magmatic Ni-Cu and PGE Deposits: Geology, Geochemistry, and Genesis. Reviews in
Economic Geology, Vol. 17. https://doi.org/10.5382/Rev.17
Nironen, M., (2017). Guide to the Geological Map of Finland – Bedrock 1:1 000 000.
Geological Survey of Finland, Special Paper 60, 41-76.
Niiranen, T., Lahti, I., Nykänen, V. (2015). The Orogenic Gold Potential of the Central
Lapland Greenstone Belt, Northern Fennoscandian Shield. Mineral Deposits of Finland.
pp. 733-752. http://dx.doi.org/10.1016/B978-0-12-410438-9.00028-5
O'Hanley, D.S. and Dyar, M.D., (1993). The composition of lizardite 1T and the formation of
magnetite in serpentinites. American Mineralogist, 78(3-4), pp.391-404.
Pehrsson, S.J., Eglington, B.M., Evans, D.A., Huston, D. and Reddy, S.M., (2016). Metallogeny
and its link to orogenic style during the Nuna supercontinent cycle. Geological Society,
London, Special Publications, 424(1), pp. 83-94.
Power, I. M., Wilson, S. A., & Dipple, G. M. (2013). Serpentinite Carbonation for CO2
Sequestration. Elements, 9(2), pp. 115–121. https://doi.org/10.2113/gselements.9.2.115
Robb, L., (2005). Introduction to ore-forming processes. 1st ed. Oxford: Wiley-Blackwell.
Santaguida, F., Luolavirta, K., Lappalainen, M., Ylinen, J., Voipio, T. and Jones, S., (2015). The
Kevitsa Ni-Cu-PGE Deposit in the Central Lapland Greenstone Belt in Finland. Mineral
Deposits of Finland, pp. 195-210. https://doi.org/10.1016/B978-0-12-410438-9.00008-X
Spandler, C., Hermann, J., Faure, K., Mavrogenes, J.A. and Arculus, R.J., 2008. The importance
of talc and chlorite “hybrid” rocks for volatile recycling through subduction zones;
evidence from the high-pressure subduction mélange of New Caledonia. Contributions to
Mineralogy and Petrology, 155(2), pp.181-198. https://doi.org/10.1007/s00410-007-0236-2
SRK (2019). Technical Report for the Kevitsa Cu-Ni-PGE Mine, Finland: Boliden Kevitsa
Mining Oy. https://www.boliden.com/globalassets/operations/exploration/mineral-resources-
65
and-mineral-reserves-pdf/2019/resources_and_reserves_kevitsa_technical_report_2019-12-
31.pdf
Standing, J., De Luca, K., Outhwaite, M., et al., (2009). Report and recommendations from the
Kevitsa campaign Finland. Unpublished confidential report for First Quantum Minerals Ltd.
118 pages.
Kokko, S. (2018). Structural Model. Unpublished confidential report. Boliden Kevitsa Mining
Oy.
Törmänen, T. and Iljina, M., (2008). Day 2. The Kevitsa intrusion and associated Ni-Cu-PGE
deposit. In: Ojala, J. and Iljina, M., (eds.). Metallogeny and tectonic evolution of the Northern
Fennoscandian Shield : field trip guidebook. 33 IGC excursion No 15, August 15th – 21st
2008., pp. 58-66.
https://www.researchgate.net/profile/Tuomo_Toermaenen/publication/259579422_Stop_2_t
he_kevitsa_intrusion_and_associated_Ni-
CuPGE_deposit/links/5656b7f808ae1ef9297b6b1c.pdf
Wilson, M.R., Kjarsgaard, B.A. and Taylor, B., (2007). Stable isotope composition of magmatic
and deuteric carbonate phases in hypabyssal kimberlite, Lac de Gras field, Northwest
Territories, Canada. Chemical Geology, 242(3-4), pp.435-454 .
https://doi.org/10.1016/j.chemgeo.2007.05.002
Yang, S., Maier, W., Hanski, E., Lappalainen, M., Santaguida, F. and Määttä, S. (2013a). Origin
of ultra-nickeliferous olivine in the Kevitsa Ni–Cu–PGE-mineralized intrusion, northern
Finland. Contributions to Mineralogy and Petrology, 166(1), pp. 81-95.
https://doi.org/10.1007/s00410-013-0866-5.