Embed Size (px)
Citation preview
8/8/2019 Master Thesis - Jonas Sellberg
http://slidepdf.com/reader/full/master-thesis-jonas-sellberg 1/105
Study of
Functional Self-Organized MaterialsDevelopment and Characteristics of Supramolecular
Liquid-Crystalline Organic Semiconductors
Royal Institute of TechnologyMaster Thesis
Jonas Alexander Sellberg
Supervisor:Professor Takashi Kato – The University of Tokyo
Examiner:Professor István Furó – Royal Institute of Technology
2009
8/8/2019 Master Thesis - Jonas Sellberg
http://slidepdf.com/reader/full/master-thesis-jonas-sellberg 2/105
i
Abstract Liquid-crystalline (LC) organic semiconductors are attractive new materials for electronics due to
their good electrical properties and low production cost. By incorporating concepts of
supramolecular chemistry in the design of LC semiconductors, LC phases can be induced tomolecules which do not exhibit LC phases but contain good electronic properties, thereby
broadening the horizon for LC organic semiconductors. In this study, supramolecular LC organic
semiconductors were developed by mixing oligothiophene derivatives with benzoic acids. The
oligothiophene derivatives were made of new cores, including α-bithiophene and α-terthiophene
units directly coupled to imidazolyl moieties. The supramolecular mesogen was bound by strong
unionized H-bonding, proven by characteristic resonance peaks around 2480 cm-1 and 1920 cm-1 in
the IR spectra. The structures of the supramolecular liquid crystals were characterized by polarized
optical microscopy, wide-angle X-ray scattering, and differential scanning calorimetry. The mixtures
of the bithiophene derivative showed SmA phases, while the mixtures of the terthiophene derivative
showed highly ordered smectic phases in addition to the SmA phases. Chiral substituents
destabilized the SmA phases, which acted in favor of the highly ordered smectic phases. No clear
chiral effects could be observed while applying a triangular (AC) electric field, but hydrodynamic
effects of ionic impurities made the sample bright due to dynamic light scattering.
The electronic properties were investigated optically by UV/Vis absorption and photoluminescence
spectroscopy, electrochemically by cyclic voltammetry, and theoretically by DFT (B3LYP 6-31G*)
calculations. The results showed clearly that the supramolecular mesogens act as a superposition of
the molecular components, i.e., the H-bonding does not affect the electronic structure of the π-
conjugated systems. Furthermore, the mixtures did not show reversible oxidations in solution, butthe energy levels estimated from the electrochemical results were in excellent agreement with the
theoretical results. The optical band gap was comparable to the theoretical band gap calculated by
DFT. The semiconducting properties were investigated by the time-of-flight measurement. The
mixtures containing bithiophene derivatives showed ionic carrier mobilities in the order of
10-6 cm2V-1s-1, which are caused by impurities. Complex carrier transport characteristics were
observed for one of the terthiophene mixtures. It showed hole mobilities in the order of 0.01
cm2V-1s-1 at room temperature, but a slower mobility in the order of 0.001 cm2V-1s-1 could also be
observed. These were assigned to different types of hopping mechanisms between the complexes,
caused by the frustrated structure observed in the highly ordered smetic phases. Although the
hopping mechanisms could be assigned, the transport characteristics were difficult to control.
Since impurities on ppm level affect the semiconducting properties drastically, no high-performance
supramolecular LC organic semiconductor has been reported to date. In this study, the ionic
impurities were minimized by distillation after standard purification procedures, including flash
column chromatography and recrystallization. Using molecular components with high thermal
stability indicates a successful approach to future supramolecular LC semiconductor designs.
Continued efforts in optimizing purification methods and controlling transport characteristics should
render it possible to produce supramolecular LC organic semiconductors with high mobility and
reproducibility.
Keywords: Liquid crystals, organic semiconductors, hydrogen-bonded mesogens, supramolecular
self-assembly, nanosegregation, functional materials.

8/8/2019 Master Thesis - Jonas Sellberg
http://slidepdf.com/reader/full/master-thesis-jonas-sellberg 3/105
ii
ContentsAbstract ........................................................................................................................................ i
List of Abbreviations ................................................................................................................... iv
1. Introduction ......................................................................................................................... 1
2. Background .......................................................................................................................... 3
2.1 Liquid Crystals ......................................................................................................................... 3
2.2 Thermotropic Liquid Crystals .................................................................................................. 3
2.3 Lyotropic Liquid Crystals ....................................................................................................... 11
2.4 Non-Conventional Liquid Crystals ......................................................................................... 12
2.4.1 Bent-Core Liquid Crystals .............................................................................................. 12
2.4.2 Polymer Liquid Crystals ................................................................................................. 12
2.4.3 Supramolecular Liquid Crystals ..................................................................................... 12
2.5 Liquid Crystals as Functional Materials ................................................................................. 13
2.5.1 Optical Properties ......................................................................................................... 13
2.5.2 Ionic Properties ............................................................................................................. 14
2.5.3 Electric Properties ......................................................................................................... 15
2.6 Organic Semiconductors ....................................................................................................... 15
2.6.1 Applications and Measuring Techniques ...................................................................... 15
2.6.2 Amorphous Organic Semiconductors ........................................................................... 172.6.3 Crystalline Organic Semiconductors ............................................................................. 17
2.6.4 Liquid-Crystalline Organic Semiconductors .................................................................. 18
3. Methods............................................................................................................................. 22
3.1 Background ........................................................................................................................... 22
3.1.1 Nuclear Magnetic Resonance Spectroscopy ................................................................. 22
3.1.2 Mass Spectroscopy........................................................................................................ 23
3.1.3 Elemental Analysis ........................................................................................................ 23
3.1.4 Infrared Spectroscopy ................................................................................................... 23
3.1.5 Polarized Optical Microscopy........................................................................................ 24
3.1.6 Differential Scanning Calorimetry ................................................................................. 25
3.1.7 X-Ray Diffraction ........................................................................................................... 26
3.1.8 Ultraviolet/Visible Absorption and Photoluminescence Spectroscopy ........................ 26
3.1.9 Circular Dichroism Spectroscopy .................................................................................. 27
3.1.10 Cyclic Voltammetry ....................................................................................................... 28
3.1.11 Density Functional Theory ............................................................................................ 29
3.1.12 Polarization Switching ................................................................................................... 29

8/8/2019 Master Thesis - Jonas Sellberg
http://slidepdf.com/reader/full/master-thesis-jonas-sellberg 4/105
iii
3.1.13 Time-of-Flight Measurement ........................................................................................ 29
3.2 Experimental ......................................................................................................................... 30
3.2.1 Synthesis ....................................................................................................................... 30
3.2.2 Analysis ......................................................................................................................... 34
4. Results and Discussion ........................................................................................................ 37
4.1 Molecular Design .................................................................................................................. 37
4.2 Synthesis ............................................................................................................................... 38
4.2.1 Synthetic Route ............................................................................................................. 38
4.2.2 Supramolecular Mesogens............................................................................................ 41
4.2.3 Structural Evaluation ..................................................................................................... 42
4.3 Phase Characterization of Molecular Components .............................................................. 44
4.4 Supramolecular Characterization ......................................................................................... 45
4.5 Phase Characterization of Supramolecular Mesogens ......................................................... 50
4.5.1 Polarized Optical Microscopy........................................................................................ 50
4.5.2 Differential Scanning Calorimetry ................................................................................. 55
4.5.3 Wide-Angle X-Ray Scattering ........................................................................................ 58
4.6 Electronic Properties ............................................................................................................. 64
4.6.1 UV/Vis Spectroscopy ..................................................................................................... 64
4.6.2 Cyclic Voltammetry ....................................................................................................... 69
4.6.3 Comparison of Experimental Data with Theoretical Calculations ................................ 69
4.6.4 Polarization Switching ................................................................................................... 71
4.7 Semiconducting Properties ................................................................................................... 71
5. Conclusions ........................................................................................................................ 76
6. Acknowledgements ............................................................................................................ 78
7. Concluding Remarks ........................................................................................................... 78
8. References ......................................................................................................................... 79 9. Appendix ............................................................................................................................... I
9.1 NMR Spectra ............................................................................................................................ I
9.2 MS Spectra .............................................................................................................................. V
9.3 CD Spectra .............................................................................................................................. VI
9.4 DFT Calculations .................................................................................................................... VII
8/8/2019 Master Thesis - Jonas Sellberg
http://slidepdf.com/reader/full/master-thesis-jonas-sellberg 5/105
iv
List of AbbreviationsHerein, all abbreviations which are not standard abbreviations are listed. If a prefix, suffix, or part of
a word is between brackets, the abbreviation can be used both with and without the optional part.
(n00) – n:th order scattering
1D – one-dimensional
2D – two-dimensional
AC – alternating current
B(*) – (chiral) soft crystal B
B3LYP – Becke’s three-parameter hybrid Lee-Yang-Parr correlation functional
BJT – bipolar junction transistor
CD – circular dichroism
CMC – critical micelle concentration
Col(h/r/ob) – (hexagonal/rectangular/oblique) columnar
Col(o/d) – (ordered/disordered) columnar
ColH/p – (helical/plastic) columnar
Cr – crystal
Cub(bi) – (bicontinuous) cubic
CV – cyclic voltammetry
DC – direct current
DCM – dichloromethane
DFT – density functional theory
DIAD – diisopropyl azodicarboxylate
DMF – dimethylformamide
DMSO – dimethylsulfoxide
dppp – 1,3-bis(diphenylphosphino)propane
DSC – differential scanning calorimetry
E(*) – (chiral) soft crystal E
ee – enantiomeric excess

8/8/2019 Master Thesis - Jonas Sellberg
http://slidepdf.com/reader/full/master-thesis-jonas-sellberg 6/105
v
EPR – electron paramagnetic resonance
EtOAc – ethyl acetate
(FT)IR – (Fourier transformed) infrared
G(*) – (chiral) soft crystal G/glassy
H(*) – (chiral) soft crystal H
H-bond(ing) – hydrogen bond(ing)
HOMO – highest occupied molecular orbital
Iso – isotropic
ITO – indium tin oxide
IUPAC – International Union of Pure and Applied Chemistry
J(*) – (chiral) soft crystal J
JDOS – joint density of states
K(*) – (chiral) soft crystal K
LC – liquid-crystalline
LCD – liquid crystal display
LEC – light-emitting electrochemical cell
LUMO – lowest unoccupied molecular orbital
M – mesophase
MALDI – matrix-assisted laser desorption/ionization
MS – mass spectroscopy
N(*) – (chiral) nematic
NBS – N-bromosuccinimide
NHE – normal hydrogen electrode
NMR – nuclear magnetic resonance
(O)FET – (organic) field-effect transistor
(O)LED – (organic) light-emitting diode
(O)PVC – (organic) photovoltaic cell
(O)TFT – (organic) thin-film transistor
8/8/2019 Master Thesis - Jonas Sellberg
http://slidepdf.com/reader/full/master-thesis-jonas-sellberg 7/105
vi
ORD – optical rotary dispersion
PL – photoluminescence
POM – polarized optical microscopy
PR-TRMC – pulsed radiolysis microwave conductivity
r.t. – room temperature
RPM – rounds per minute
SAXS – small-angle X-ray scattering
SCE – saturated calomel electrode
SCLC – space-charge-limited current
Sigma-Aldrich – Sigma-Aldrich Co.
Sm – smectic
SmA(*) – (chiral) smectic A
SmB(*) – (chiral) smectic B
SmC(*) – (chiral) smectic C
SmF(*) – (chiral) smectic F
SmI(*) – (chiral) smectic I
SNAr – nucleophilic aromatic substitution
TCI – Tokyo Chemical Industry Co., Ltd.
THF – tetrahydrofuran
TMS – tetramethylsilane
TOF – time-of-flight
TPP – triphenylphosphine
UV – ultraviolet
Vis – visible light
Wako – Wako Pure Chemical Industries, Ltd.
WAXS – wide-angle X-ray scattering
XRD – X-ray diffraction
8/8/2019 Master Thesis - Jonas Sellberg
http://slidepdf.com/reader/full/master-thesis-jonas-sellberg 8/105
1
1. IntroductionLiquid crystals are a mobile state of matter that nonetheless contains order.[1] The order varies with
different liquid-crystalline (LC) phases; some contain positional order in several dimensions, while
others are low viscous fluids containing only orientational order.[2] The high mobility makes liquidcrystals dynamic materials with self-healing properties, which reduces the density of defects[3] and
makes them highly responsive to external conditions and stimuli, such as temperature[4], electric
fields[5], or shearing[6]. These properties make liquid crystals ideal candidates for functional self-
organized materials.[7]
Many studies on functional self-organized materials have been devoted to align functional ordered
structures, which results in anisotropic properties of the material, i.e., the properties of the material
parallel and perpendicular to the direction of alignment are different. Depending on the aligned
structure, the anisotropy can increase conductivity and mobility in one or two dimensions; it can also
make the ordered structures selective.[8-10] The technological interest in organic semiconductors liesin their potential to achieve low-cost and flexible electronic circuitry.[11, 12] The concept of aligning
anisotropic structures can increase the carrier mobility in organic semiconductors by several orders
of magnitude.[8, 13-17] Because the remarkable abilities of liquid crystals to reduce defects and align by
shearing or rubbing[12], LC organic semiconductors have been developed for the last 25 years[18, 19] as
an attractive alternative to amorphous and crystalline organic semiconductors. The former of the
two is cheap and easy to process, but exhibits low carrier mobilities[11, 20, 21], while the latter shows
excellent carrier mobilities, but requires expensive vacuum processing[22]. LC organic semiconductors
can be produced by a low-cost solution process, but can still have high carrier mobilities that are
temperature and electric field independent.
[23]
Furthermore, the selectivity in LC organicsemiconductors is demonstrated in electro-optical applications, where aligned samples can only
absorb and emit polarized light parallel to the alignment.[8]
The aim of this project was to develop new LC semiconductors containing layered LC phases,
materials well suited for two-dimensional (2D) applications such as thin-film transistors[24-26], owing
to their high carrier mobilities within the layered structures and their ease of aligning into large
domains.[13, 27] By incorporating concepts of supramolecular chemistry in designing LC
semiconductors, the horizon for LC organic semiconductors could be broadened. Many molecules
contain good electronic properties, but do not possess LC phases. With supramolecular chemistry,
liquid crystallinity can be induced in such molecules by forming supramolecular complexes. It alsopaves new ways of incorporating several functional molecules into multifunctional materials, such as
ambipolar organic semiconductors consisting of a p-type and an n-type organic semiconductor
bound by intermolecular interactions, e.g., hydrogen bonding (H-bonding). Such potential
applications require extensive research on supramolecular LC organic semiconductors. To date,
however, no LC organic semiconductor consisting of supramolecular complexes which induces liquid
crystallinity has been reported. In this work, development, characteristics, and limitations of LC
organic semiconductors consisting of H-bonded supramolecular complexes were investigated. As a
consequence, the possibilities of controlling the LC phase behavior and its effects on the LC structure
and the electronic and semiconducting properties were explored.

8/8/2019 Master Thesis - Jonas Sellberg
http://slidepdf.com/reader/full/master-thesis-jonas-sellberg 9/105
2
The thesis is organized as follows: Chapter 2 presents background theory on liquid crystals, including
their applications as functional materials, and organic semiconductors. Chapter 3 outlines the
methods used throughout the thesis, including their respective background theory. Chapter 4 details
the results obtained and discusses possible interpretations; conclusions are drawn in Chapter 5.

8/8/2019 Master Thesis - Jonas Sellberg
http://slidepdf.com/reader/full/master-thesis-jonas-sellberg 10/105
3
2. BackgroundIn this chapter, a detailed introduction to liquid crystals, their applications as functional materials,
and organic semiconductors will be presented. A wide variety of liquid crystals and organic
semiconductors will be reviewed, although the emphasis will be towards layered liquid crystals
applied as semiconducting materials in field-effect transistors.
2.1 Liquid Crystals
The LC state was first observed in 1888 by Friedrich Reinitzer and Otto Lehmann.[5] It possesses order
similar to crystalline phases, but exhibits at the same time mobility similar to liquid phases. The
combination of a state that has excellent dynamic properties and the ability to self-assemble into
ordered structures makes liquid crystals an ideal candidate for functional self-organized materials.[7]
The LC state contains several different LC phases (mesophases) that show different degrees of order
and mobility. The order can be divided into orientational order, a property which all LC phases
possess to some extent, and positional order, a property possessed only by the higher ordered
mesophases. An important measure to determine the degree of orientational order is the order
parameter ,
= ⟨3 2−12
⟩ , (1)
where θ is the angle between the director and the molecular axis.[5] The director (n) is the average
direction where all molecules are pointed in a certain volume element of the liquid crystal sample
(see Figure 3), also representing the local optical axis of rod-like molecules. It does not contain any
physical polarity, which means that n and – n are equivalent.[4] In an isotropic liquid, the molecules
point in randomly distributed directions, resulting in an average angle of 48.2° between the averagemolecular axis and any director chosen (one unambiguous director does not exist, since the sample
is isotropic), that gives S = 0. A perfectly aligned sample has an average angle of 0 degrees between
the average molecular axis and the director, resulting in S = 1. For a typical liquid crystal, S ranges
between 0.3 and 0.9, and usually decreases with increasing temperature. The order parameter can
be measured experimentally by diamagnetism, birefringence, Raman scattering, nuclear magnetic
resonance (NMR) spectroscopy, and electron paramagnetic resonance (EPR) spectroscopy.[2]
Liquid crystals are traditionally divided into two types: thermotropic liquid crystals and lyotropic
liquid crystals. This thesis focuses on thermotropic liquid crystals, as they are most relevant to bulk
applications. Therefore, lyotropic liquid crystals are only reviewed briefly in Section 2.3. There alsoexist metallotropic liquid crystals, which consist of organic and inorganic hybrids whose volume
fraction of the inorganic polar block determines the phase behavior. Interested readers are directed
to the study of Martin et al[28], as metallotropic liquid crystals will not be discussed further in this
thesis.
2.2 Thermotropic Liquid Crystals
Thermotropic liquid crystals are liquid crystals whose phase transitions depend on temperature.
They usually consist of small organic molecules, although LC polymers and LC supramolecules also
exist (see Section 2.4). To be able to form mesophases, the mesogen (i.e., the molecule forming the
LC phase) has to contain an anisotropic shape. This means that the mesogen cannot be completelysymmetrical; a molecular axis has to exist.[5] Furthermore, the mesogen has to be a balance between
8/8/2019 Master Thesis - Jonas Sellberg
http://slidepdf.com/reader/full/master-thesis-jonas-sellberg 11/105
4
parts favoring order, since the enthalpy is lowered heavily when they are ordered, and parts favoring
disorder, since the entropy is heavily increased when they are disordered. Therefore, the mesogen
usually consists of a rigid core, inclined to pack into ordered structures, with one or several flexible
chains stretching out from it, that prevent the core to crystallize completely. The core is usually
made of aromatic units, but can also be built up by other rigid units, such as cycloalkanes. The chains
are often simple alkyl chains or alkoxy chains, and the phase transition behavior of a specific core
can be controlled, to a great extent, by varying the chain lengths. Lateral substituents and polar
terminal units changing the polarity, polarizability, and the shape of the core might also be added to
control molecular packing and to stabilize the LC phases.[4]
The phase behavior of a substance can be described by the basic thermodynamic relationship,
Δ = Δ−Δ , (2)
where ∆G is the difference in Gibbs free energy, ∆H is the difference in enthalpy, T is the absolute
temperature, and ∆S is the difference in entropy. Entropy has an absolute value, defined as thereversible heat per temperature associated with warming it from 0 K, but Gibbs free energy and
enthalpy always have to be related to a reference. By choosing a proper reference material, the
Gibbs free energy of the different phases of a substance can be plotted (see Figure 1). The colored
lines represent the Gibbs free energy of each phase, and the one with lowest Gibbs free energy will
be the thermodynamically stable phase at that specific temperature. In this case, cholesteryl
myristate, present in human cell membranes, shows two specific mesophases; the SmA phase (see
Figure 4) and the N* phase (see Figure 7).[5] The LC phases occur at temperatures above the
crystalline (Cr) phase, but at temperatures below the isotropic (Iso) phase, which is equivalent of a
regular liquid. As can be seen in the picture, the fluid LC phases are more similar to liquids than
solids, since the gradient of the lines, i.e., the entropy, is more similar to the gradient of the Isophase than the gradient of the Cr phase. At the melting temperature (T m), the Gibbs free energies of
the Cr phase and the SmA phase are the same, and the two phases are in equilibrium with each
other. This can be described by
Δ = Δ , (3)
where ∆Sm is the difference in entropy between the SmA phase and the Cr phase and ∆Hm is the
endothermic latent heat of melting, i.e., the energy that is needed to break the bonds of the Cr
phase and turn it into the SmA phase. By measuring the latent heats of a substance at the transition
temperatures, ∆S can be calculated and the thermodynamic behavior of the substance evaluated.
8/8/2019 Master Thesis - Jonas Sellberg
http://slidepdf.com/reader/full/master-thesis-jonas-sellberg 12/105
5
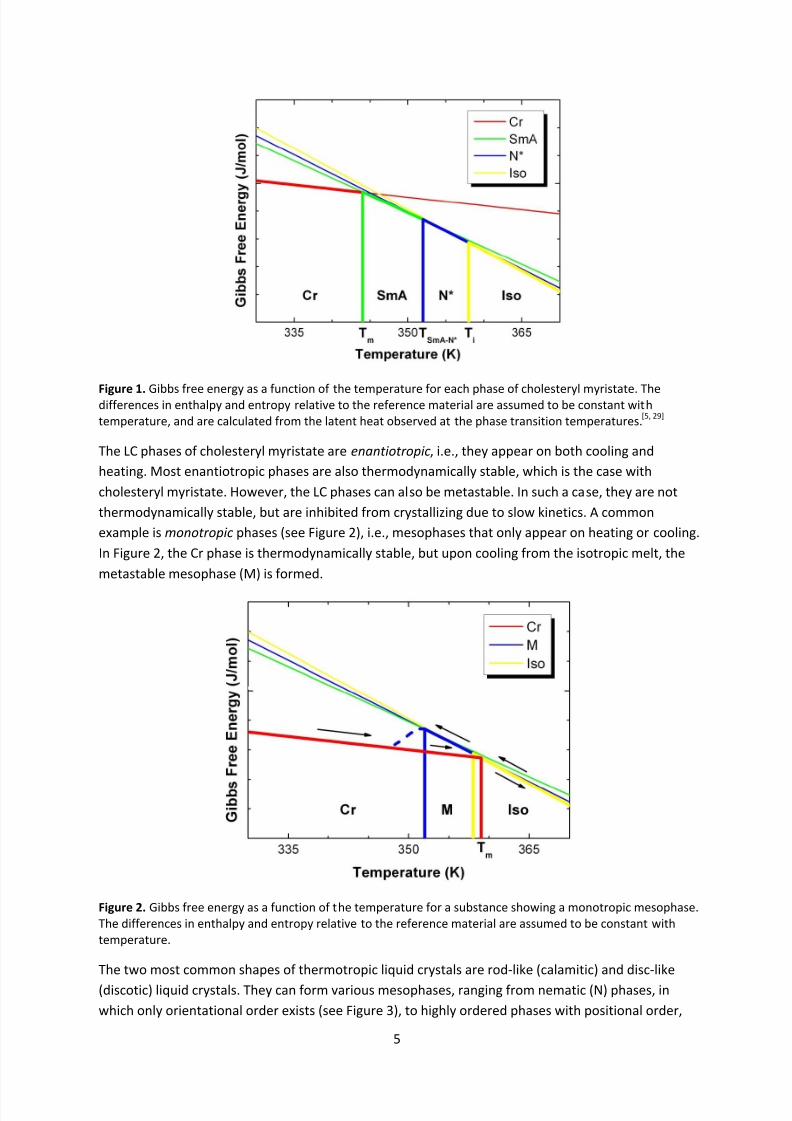
Figure 1. Gibbs free energy as a function of the temperature for each phase of cholesteryl myristate. Thedifferences in enthalpy and entropy relative to the reference material are assumed to be constant withtemperature, and are calculated from the latent heat observed at the phase transition temperatures.[5, 29]
The LC phases of cholesteryl myristate are enantiotropic, i.e., they appear on both cooling and
heating. Most enantiotropic phases are also thermodynamically stable, which is the case with
cholesteryl myristate. However, the LC phases can also be metastable. In such a case, they are not
thermodynamically stable, but are inhibited from crystallizing due to slow kinetics. A common
example is monotropic phases (see Figure 2), i.e., mesophases that only appear on heating or cooling.
In Figure 2, the Cr phase is thermodynamically stable, but upon cooling from the isotropic melt, the
metastable mesophase (M) is formed.
Figure 2. Gibbs free energy as a function of the temperature for a substance showing a monotropic mesophase.The differences in enthalpy and entropy relative to the reference material are assumed to be constant withtemperature.
The two most common shapes of thermotropic liquid crystals are rod-like (calamitic) and disc-like
(discotic) liquid crystals. They can form various mesophases, ranging from nematic (N) phases, in
which only orientational order exists (see Figure 3), to highly ordered phases with positional order,
8/8/2019 Master Thesis - Jonas Sellberg
http://slidepdf.com/reader/full/master-thesis-jonas-sellberg 13/105
6
such as calamitic smectic (Sm) phases, in which the rod-like molecules are ordered into layers (see
Figure 5), or discotic columnar (Col) phases, in which the disc-like molecules are ordered into
columns (see Figure 8).
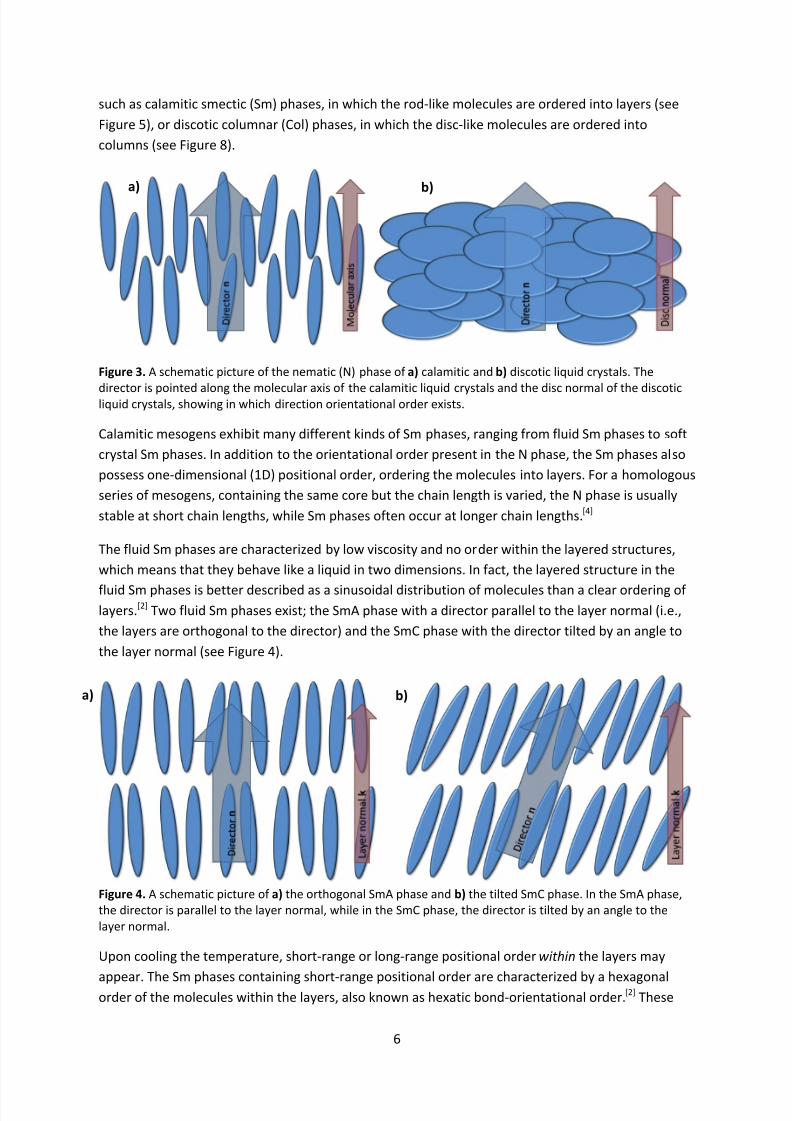
Figure 3. A schematic picture of the nematic (N) phase of a) calamitic and b) discotic liquid crystals. The
director is pointed along the molecular axis of the calamitic liquid crystals and the disc normal of the discoticliquid crystals, showing in which direction orientational order exists.
Calamitic mesogens exhibit many different kinds of Sm phases, ranging from fluid Sm phases to soft
crystal Sm phases. In addition to the orientational order present in the N phase, the Sm phases also
possess one-dimensional (1D) positional order, ordering the molecules into layers. For a homologous
series of mesogens, containing the same core but the chain length is varied, the N phase is usually
stable at short chain lengths, while Sm phases often occur at longer chain lengths.[4]
The fluid Sm phases are characterized by low viscosity and no order within the layered structures,
which means that they behave like a liquid in two dimensions. In fact, the layered structure in the
fluid Sm phases is better described as a sinusoidal distribution of molecules than a clear ordering of layers.[2] Two fluid Sm phases exist; the SmA phase with a director parallel to the layer normal (i.e.,
the layers are orthogonal to the director) and the SmC phase with the director tilted by an angle to
the layer normal (see Figure 4).
Figure 4. A schematic picture of a) the orthogonal SmA phase and b) the tilted SmC phase. In the SmA phase,the director is parallel to the layer normal, while in the SmC phase, the director is tilted by an angle to thelayer normal.
Upon cooling the temperature, short-range or long-range positional order within the layers may
appear. The Sm phases containing short-range positional order are characterized by a hexagonalorder of the molecules within the layers, also known as hexatic bond-orientational order.[2] These
a) b)
a) b)

8/8/2019 Master Thesis - Jonas Sellberg
http://slidepdf.com/reader/full/master-thesis-jonas-sellberg 14/105
7
phases are therefore called the hexatic Sm phases, of which three different types exist; the
orthogonal SmB phase (see Figure 5.a), which is the hexatic equivalent of the fluid SmA phase, and
the tilted SmI and SmF phases, which are the hexatic equivalents of the fluid SmC phase. Two
different tilted phases exist, since the hexagonal order means that the molecules can be tilted to
either a vertex (SmI) of the hexagon or a side (SmF) of the hexagon. There have also been theoretical
predictions of hexatic Sm phases which are tilted neither to a vertex nor a side, but they have not
been confirmed yet.[2]
Figure 5. A schematic picture of a) the hexatic SmB phase and b) the soft crystal B phase. In the SmB phase,short-range hexagonal order of the molecules exists, while in the B phase, long-range hexagonal order of themolecules exists. The bond-orientational order is marked by black lines.
The Sm phases containing long-range positional order show several types of bond-orientational
order. They are sometimes called the soft crystal phases, since they contain long-range positionalorder in all dimensions. Therefore, their names, which formerly contained the Sm prefix, were
changed by the International Union of Pure and Applied Chemistry (IUPAC) to contain only their
alphabetical capital letters.[30] In the orthogonal B phase (see Figure 5.b), the tilted (to vertex) J
phase, and the tilted (to side) G phase, the hexatic bond-orientational order is preserved from the
hexatic Sm phases, but is turned into long-range positional order. Additionally, a herringbone
structure may occur, where the molecules are packed in a rectangular pattern within the layers, in
which rotational motion around the long molecular axis is strongly inhibited.[2] This results in the
orthogonal E phase (see Figure 6), the tilted (to side a) K phase and the tilted (to side b) H phase. For
this type of packing, planar cores, such as terthiophene or other aromatic cores, of the calamitic
mesogens are required. In Table 1, the order characteristics of the most common calamitic phases of
achiral mesogens are summarized.
a) b)
8/8/2019 Master Thesis - Jonas Sellberg
http://slidepdf.com/reader/full/master-thesis-jonas-sellberg 15/105
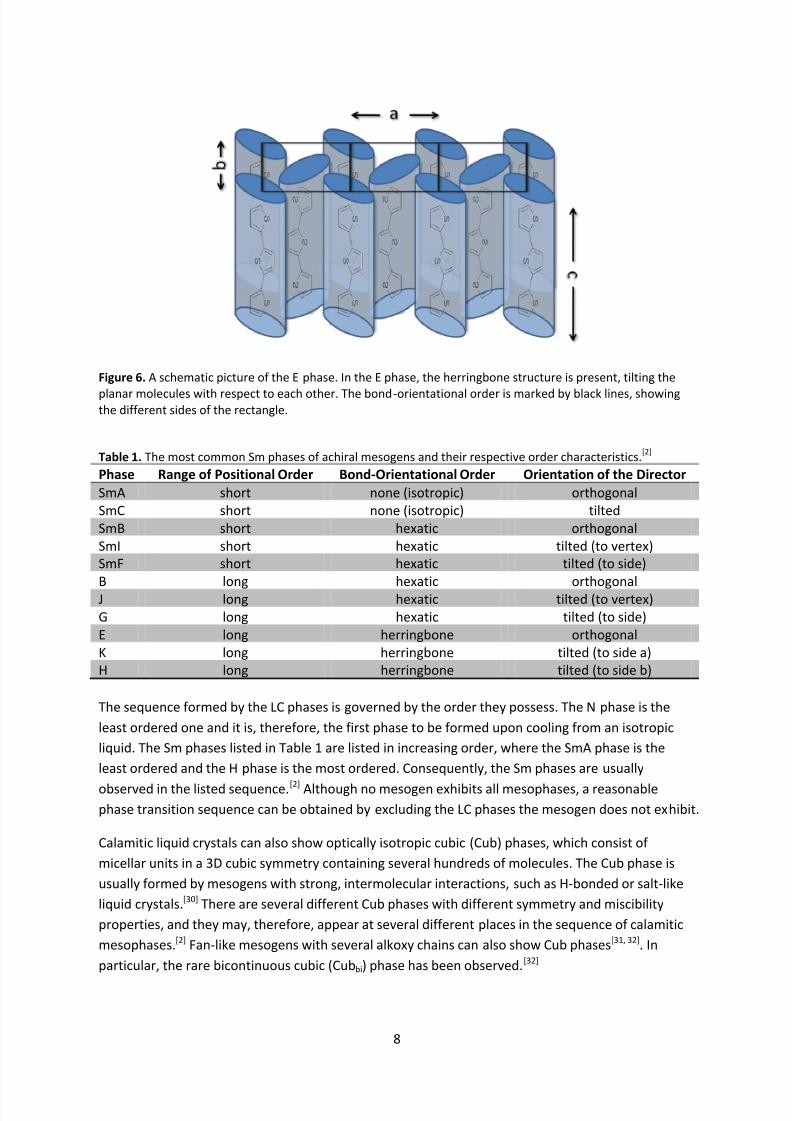
8
Figure 6. A schematic picture of the E phase. In the E phase, the herringbone structure is present, tilting the
planar molecules with respect to each other. The bond-orientational order is marked by black lines, showingthe different sides of the rectangle.
Table 1. The most common Sm phases of achiral mesogens and their respective order characteristics.[2]
Phase Range of Positional Order Bond-Orientational Order Orientation of the Director
SmA short none (isotropic) orthogonalSmC short none (isotropic) tiltedSmB short hexatic orthogonalSmI short hexatic tilted (to vertex)SmF short hexatic tilted (to side)B long hexatic orthogonalJ long hexatic tilted (to vertex)G long hexatic tilted (to side)E long herringbone orthogonalK long herringbone tilted (to side a)H long herringbone tilted (to side b)
The sequence formed by the LC phases is governed by the order they possess. The N phase is the
least ordered one and it is, therefore, the first phase to be formed upon cooling from an isotropic
liquid. The Sm phases listed in Table 1 are listed in increasing order, where the SmA phase is the
least ordered and the H phase is the most ordered. Consequently, the Sm phases are usually
observed in the listed sequence.[2] Although no mesogen exhibits all mesophases, a reasonablephase transition sequence can be obtained by excluding the LC phases the mesogen does not exhibit.
Calamitic liquid crystals can also show optically isotropic cubic (Cub) phases, which consist of
micellar units in a 3D cubic symmetry containing several hundreds of molecules. The Cub phase is
usually formed by mesogens with strong, intermolecular interactions, such as H-bonded or salt-like
liquid crystals.[30] There are several different Cub phases with different symmetry and miscibility
properties, and they may, therefore, appear at several different places in the sequence of calamitic
mesophases.[2] Fan-like mesogens with several alkoxy chains can also show Cub phases[31, 32]. In
particular, the rare bicontinuous cubic (Cubbi) phase has been observed.[32]
8/8/2019 Master Thesis - Jonas Sellberg
http://slidepdf.com/reader/full/master-thesis-jonas-sellberg 16/105
9
So far, only achiral mesogens have been discussed. If the mesogen is chiral, however, the properties
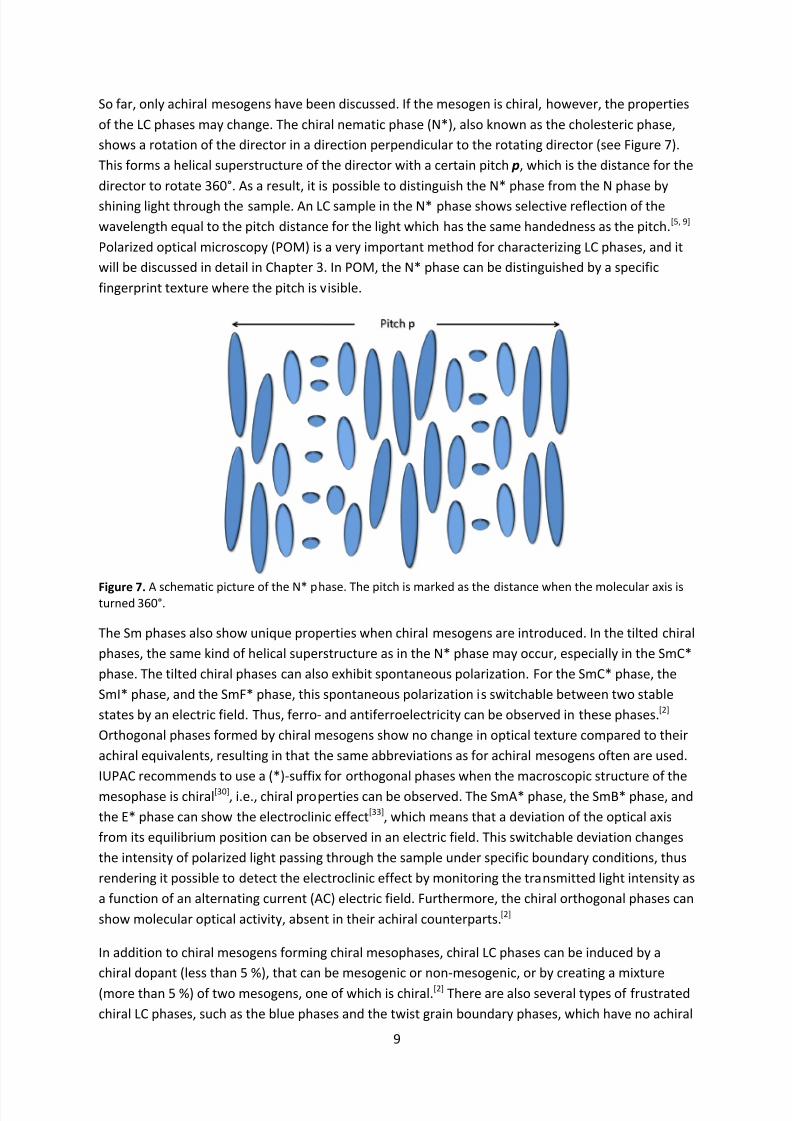
of the LC phases may change. The chiral nematic phase (N*), also known as the cholesteric phase,
shows a rotation of the director in a direction perpendicular to the rotating director (see Figure 7).
This forms a helical superstructure of the director with a certain pitch p, which is the distance for the
director to rotate 360°. As a result, it is possible to distinguish the N* phase from the N phase by
shining light through the sample. An LC sample in the N* phase shows selective reflection of the
wavelength equal to the pitch distance for the light which has the same handedness as the pitch.[5, 9]
Polarized optical microscopy (POM) is a very important method for characterizing LC phases, and it
will be discussed in detail in Chapter 3. In POM, the N* phase can be distinguished by a specific
fingerprint texture where the pitch is visible.
Figure 7. A schematic picture of the N* phase. The pitch is marked as the distance when the molecular axis isturned 360°.
The Sm phases also show unique properties when chiral mesogens are introduced. In the tilted chiral
phases, the same kind of helical superstructure as in the N* phase may occur, especially in the SmC*
phase. The tilted chiral phases can also exhibit spontaneous polarization. For the SmC* phase, the
SmI* phase, and the SmF* phase, this spontaneous polarization is switchable between two stable
states by an electric field. Thus, ferro- and antiferroelectricity can be observed in these phases.[2]
Orthogonal phases formed by chiral mesogens show no change in optical texture compared to their
achiral equivalents, resulting in that the same abbreviations as for achiral mesogens often are used.
IUPAC recommends to use a (*)-suffix for orthogonal phases when the macroscopic structure of the
mesophase is chiral[30], i.e., chiral properties can be observed. The SmA* phase, the SmB* phase, and
the E* phase can show the electroclinic effect[33], which means that a deviation of the optical axis
from its equilibrium position can be observed in an electric field. This switchable deviation changes
the intensity of polarized light passing through the sample under specific boundary conditions, thus
rendering it possible to detect the electroclinic effect by monitoring the transmitted light intensity as
a function of an alternating current (AC) electric field. Furthermore, the chiral orthogonal phases can
show molecular optical activity, absent in their achiral counterparts.[2]
In addition to chiral mesogens forming chiral mesophases, chiral LC phases can be induced by a
chiral dopant (less than 5 %), that can be mesogenic or non-mesogenic, or by creating a mixture
(more than 5 %) of two mesogens, one of which is chiral.[2] There are also several types of frustrated
chiral LC phases, such as the blue phases and the twist grain boundary phases, which have no achiral
8/8/2019 Master Thesis - Jonas Sellberg
http://slidepdf.com/reader/full/master-thesis-jonas-sellberg 17/105
10
equivalents. These phases will not be discussed further in this thesis, since they are not relevant to
this project.
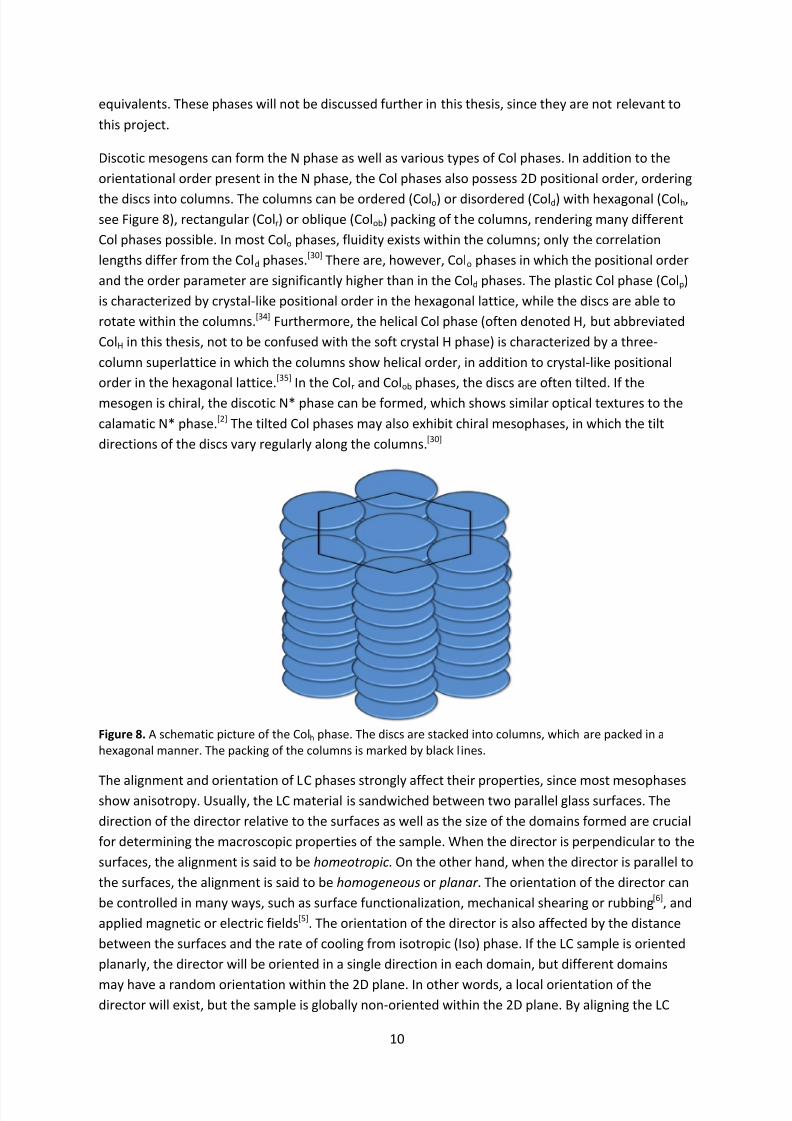
Discotic mesogens can form the N phase as well as various types of Col phases. In addition to the
orientational order present in the N phase, the Col phases also possess 2D positional order, ordering
the discs into columns. The columns can be ordered (Colo) or disordered (Cold) with hexagonal (Colh,see Figure 8), rectangular (Colr) or oblique (Colob) packing of the columns, rendering many different
Col phases possible. In most Colo phases, fluidity exists within the columns; only the correlation
lengths differ from the Cold phases.[30] There are, however, Colo phases in which the positional order
and the order parameter are significantly higher than in the Cold phases. The plastic Col phase (Colp)
is characterized by crystal-like positional order in the hexagonal lattice, while the discs are able to
rotate within the columns.[34] Furthermore, the helical Col phase (often denoted H, but abbreviated
ColH in this thesis, not to be confused with the soft crystal H phase) is characterized by a three-
column superlattice in which the columns show helical order, in addition to crystal-like positional
order in the hexagonal lattice.[35] In the Colr and Colob phases, the discs are often tilted. If the
mesogen is chiral, the discotic N* phase can be formed, which shows similar optical textures to the
calamatic N* phase.[2] The tilted Col phases may also exhibit chiral mesophases, in which the tilt
directions of the discs vary regularly along the columns.[30]
Figure 8. A schematic picture of the Colh phase. The discs are stacked into columns, which are packed in ahexagonal manner. The packing of the columns is marked by black lines.
The alignment and orientation of LC phases strongly affect their properties, since most mesophasesshow anisotropy. Usually, the LC material is sandwiched between two parallel glass surfaces. The
direction of the director relative to the surfaces as well as the size of the domains formed are crucial
for determining the macroscopic properties of the sample. When the director is perpendicular to the
surfaces, the alignment is said to be homeotropic. On the other hand, when the director is parallel to
the surfaces, the alignment is said to be homogeneous or planar . The orientation of the director can
be controlled in many ways, such as surface functionalization, mechanical shearing or rubbing[6], and
applied magnetic or electric fields[5]. The orientation of the director is also affected by the distance
between the surfaces and the rate of cooling from isotropic (Iso) phase. If the LC sample is oriented
planarly, the director will be oriented in a single direction in each domain, but different domains
may have a random orientation within the 2D plane. In other words, a local orientation of thedirector will exist, but the sample is globally non-oriented within the 2D plane. By aligning the LC

8/8/2019 Master Thesis - Jonas Sellberg
http://slidepdf.com/reader/full/master-thesis-jonas-sellberg 18/105
11
sample uniaxially (i.e., in a single direction), the domain size will increase to large-area
monodomains exhibiting different properties in various directions within the plane. The size of the
domains can be controlled by surface alignment layers (such as rubbed polyimide), mechanical
shearing or rubbing, applied magnetic or electric fields, and even by nanoconfinement.[8] The rate of
cooling from the Iso phase also strongly affects the domain size, as lower rates increase the domain
size. The domain sizes may also be increased by annealing at a high temperature within the
mesophase.[2]
2.3 Lyotropic Liquid Crystals
Lyotropic liquid crystals are liquid crystals whose phase transitions depend on temperature and
concentration. For this, a mixture is necessary with a continuous medium (usually water) and an
amphiphile. The amphiphile, or surface active agent (surfactant), has two immiscible parts – a
hydrophilic part with high affinity for water and a hydrophobic part which repels water, usually
consisting of a polar head group and a tail of hydrocarbons, respectively. The LC phases are formed
by nanosegregation between the two immiscible parts, creating spherical micelles (cubic phase),
cylindrical micelles (hexagonal phase), layers (lamellar phase), or other kinds of structures, such as
vesicles or the bicontinuous cubic phase. The micellar phases can also be inversed, which means that
the head group instead of the tail is pointing into the micelle.
An important factor when predicting phase transitions of lyotropic liquid crystals is the volume ratio
between the hydrophobic tail and the hydrophilic head group. This is utilized by the critical packing
parameter ,
=
0 , (4)
where v is the volume occupied by the tail, a0 is the optimal area per head group, and l c is the critical
tail length.[36] Each geometry has an optimal value (or a range of values) for P, and by changing the
concentration of the amphiphile, phase transitions will occur to a geometry with P matching the
volume ratio between the hydrophilic and hydrophobic parts of the system. In this way, the
interactions between miscible parts are maximized, while interactions between immiscible parts are
minimized. As a consequence, the sequence of lyotropic phases can be easily predicted when
changing the concentration, much like thermotropic liquid crystals where the order determines the
sequence of mesophases when changing the temperature. In a hydrophilic medium, such as water,
the sequence is cubic, hexagonal, bicontinuous cubic, lamellar, inversed bicontinuous cubic, inversed
hexagonal, and inversed cubic, when increasing the surfactant concentration. At very lowconcentrations, however, it is most likely that the surfactant first forms spherical micelles, which
occurs at the critical micelle concentration (CMC). This can be followed by a series of lyotropic
phases, in accordance with the sequence mentioned. The lyotropic phases can be either
thermodynamically stable or stabilized by kinetics, similar to thermotropic liquid crystals.
Lyotropic liquid crystals are important in many areas, such as the food and hygiene industry. They
are also biologically important, since they are the main component of cell membranes. Although
they require a solvent, the basic concepts of lyotropic liquid crystals are useful when predicting LC
phases of bulk mixtures or liquid crystals containing immiscible parts, such as ionic liquid crystals.[37]
8/8/2019 Master Thesis - Jonas Sellberg
http://slidepdf.com/reader/full/master-thesis-jonas-sellberg 19/105
12
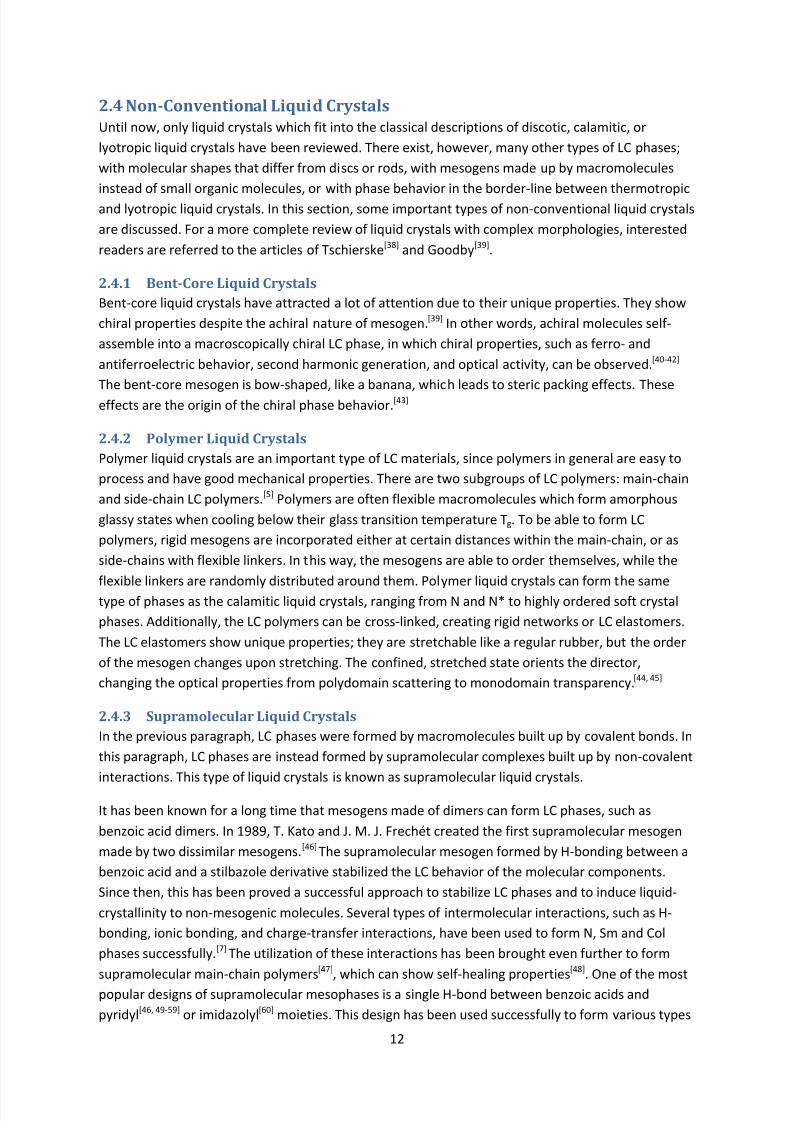
2.4 Non-Conventional Liquid Crystals
Until now, only liquid crystals which fit into the classical descriptions of discotic, calamitic, or
lyotropic liquid crystals have been reviewed. There exist, however, many other types of LC phases;
with molecular shapes that differ from discs or rods, with mesogens made up by macromolecules
instead of small organic molecules, or with phase behavior in the border-line between thermotropic
and lyotropic liquid crystals. In this section, some important types of non-conventional liquid crystals
are discussed. For a more complete review of liquid crystals with complex morphologies, interested
readers are referred to the articles of Tschierske[38] and Goodby[39].
2.4.1 Bent-Core Liquid Crystals
Bent-core liquid crystals have attracted a lot of attention due to their unique properties. They show
chiral properties despite the achiral nature of mesogen.[39] In other words, achiral molecules self-
assemble into a macroscopically chiral LC phase, in which chiral properties, such as ferro- and
antiferroelectric behavior, second harmonic generation, and optical activity, can be observed.[40-42]
The bent-core mesogen is bow-shaped, like a banana, which leads to steric packing effects. These
effects are the origin of the chiral phase behavior.[43]
2.4.2 Polymer Liquid Crystals
Polymer liquid crystals are an important type of LC materials, since polymers in general are easy to
process and have good mechanical properties. There are two subgroups of LC polymers: main-chain
and side-chain LC polymers.[5] Polymers are often flexible macromolecules which form amorphous
glassy states when cooling below their glass transition temperature Tg. To be able to form LC
polymers, rigid mesogens are incorporated either at certain distances within the main-chain, or as
side-chains with flexible linkers. In this way, the mesogens are able to order themselves, while the
flexible linkers are randomly distributed around them. Polymer liquid crystals can form the same
type of phases as the calamitic liquid crystals, ranging from N and N* to highly ordered soft crystal
phases. Additionally, the LC polymers can be cross-linked, creating rigid networks or LC elastomers.
The LC elastomers show unique properties; they are stretchable like a regular rubber, but the order
of the mesogen changes upon stretching. The confined, stretched state orients the director,
changing the optical properties from polydomain scattering to monodomain transparency.[44, 45]
2.4.3 Supramolecular Liquid Crystals
In the previous paragraph, LC phases were formed by macromolecules built up by covalent bonds. In
this paragraph, LC phases are instead formed by supramolecular complexes built up by non-covalent
interactions. This type of liquid crystals is known as supramolecular liquid crystals.
It has been known for a long time that mesogens made of dimers can form LC phases, such as
benzoic acid dimers. In 1989, T. Kato and J. M. J. Frechét created the first supramolecular mesogen
made by two dissimilar mesogens.[46] The supramolecular mesogen formed by H-bonding between a
benzoic acid and a stilbazole derivative stabilized the LC behavior of the molecular components.
Since then, this has been proved a successful approach to stabilize LC phases and to induce liquid-
crystallinity to non-mesogenic molecules. Several types of intermolecular interactions, such as H-
bonding, ionic bonding, and charge-transfer interactions, have been used to form N, Sm and Col
phases successfully.[7] The utilization of these interactions has been brought even further to form
supramolecular main-chain polymers[47], which can show self-healing properties[48]. One of the most
popular designs of supramolecular mesophases is a single H-bond between benzoic acids and
pyridyl[46, 49-59] or imidazolyl[60] moieties. This design has been used successfully to form various types
8/8/2019 Master Thesis - Jonas Sellberg
http://slidepdf.com/reader/full/master-thesis-jonas-sellberg 20/105
13
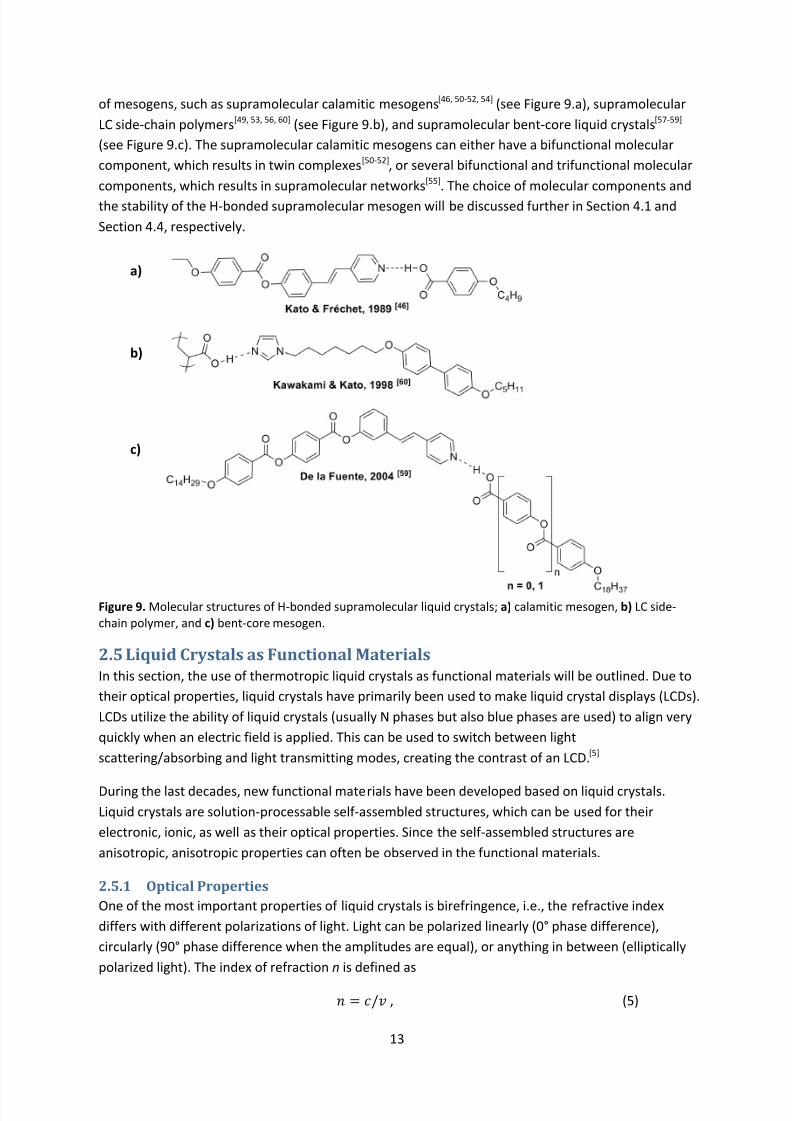
of mesogens, such as supramolecular calamitic mesogens[46, 50-52, 54] (see Figure 9.a), supramolecular
LC side-chain polymers[49, 53, 56, 60] (see Figure 9.b), and supramolecular bent-core liquid crystals[57-59]
(see Figure 9.c). The supramolecular calamitic mesogens can either have a bifunctional molecular
component, which results in twin complexes[50-52], or several bifunctional and trifunctional molecular
components, which results in supramolecular networks[55]. The choice of molecular components and
the stability of the H-bonded supramolecular mesogen will be discussed further in Section 4.1 and
Section 4.4, respectively.
Figure 9. Molecular structures of H-bonded supramolecular liquid crystals; a) calamitic mesogen, b) LC side-chain polymer, and c) bent-core mesogen.
2.5 Liquid Crystals as Functional Materials
In this section, the use of thermotropic liquid crystals as functional materials will be outlined. Due to
their optical properties, liquid crystals have primarily been used to make liquid crystal displays (LCDs).
LCDs utilize the ability of liquid crystals (usually N phases but also blue phases are used) to align very
quickly when an electric field is applied. This can be used to switch between light
scattering/absorbing and light transmitting modes, creating the contrast of an LCD.[5]
During the last decades, new functional materials have been developed based on liquid crystals.Liquid crystals are solution-processable self-assembled structures, which can be used for their
electronic, ionic, as well as their optical properties. Since the self-assembled structures are
anisotropic, anisotropic properties can often be observed in the functional materials.
2.5.1 Optical Properties
One of the most important properties of liquid crystals is birefringence, i.e., the refractive index
differs with different polarizations of light. Light can be polarized linearly (0° phase difference),
circularly (90° phase difference when the amplitudes are equal), or anything in between (elliptically
polarized light). The index of refraction n is defined as
= / , (5)
a)
b)
c)

8/8/2019 Master Thesis - Jonas Sellberg
http://slidepdf.com/reader/full/master-thesis-jonas-sellberg 21/105
14
where c is the velocity of light in vacuum and v is the velocity of light in the specific medium.[5]
Equation (5) shows that when light passes through a medium with a refractive index > 1, the velocity
of the light decreases. If the material shows birefringence, the velocity of the light inside the
medium will be different for light polarized linearly in different directions. As a result, the phase of
the light will change when the light propagates through the birefringent medium. If a calamitic liquid
crystal is aligned planarly, it will show birefringence when light passes through perpendicularly. Thus,
the polarization of the exiting light will depend on the thickness of the LC sample.
In chiral mesophases, such as N*, circular birefringence is observed instead of linear birefringence,
i.e., the refractive index will differ between right circularly polarized light (nR) and left circularly
polarized light (nL). Instead of changing the phase of linearly polarized light, this leads to that the
light is turned by the circularly birefringent medium from one linear polarization to another. The
optical activity of a birefringent medium is defined as the ratio between the angle the linearly
polarized light is turned and the thickness of the sample. N* phases typically have an optical activity
around 300°/mm.[5] Both linear birefringence and circular birefringence can be used in LCDs by
aligning the liquid crystal in a suitable direction and then switching the alignment by applying an
electric field.
LC materials can also be used in non-linear optics. Materials with spontaneous polarization can be
used in second order non-linear optical applications, where the frequency of a fraction of the
incident light is doubled when passing through the non-linear optical medium. This effect is only
observed in media which do not contain inversion symmetry and therefore show spontaneous
polarization, such as SmC*. Other effects, such as the Pockels effect or sum-frequency generation
can also be observed in second order non-linear optical materials. When inversion symmetry is
present, third order non-linear optical effects might still be observed, where three incident light
waves interact to create a light wave with a new frequency. One special case of this effect is the
frequency tripling.[61]
2.5.2 Ionic Properties
Mesogens are traditionally made up by aliphatic and aromatic moieties, which nanosegregate
weakly due to the beneficial interactions (π-π-stacking and London dispersion forces) between the
aromatic cores and the aliphatic chains, respectively. A polar substituent can also form dipole-dipole
interactions, but the parts are still miscible with each other. Since an ionic moiety (together with
respective counter-ion) or another highly polar, hydrophilic part is miscible with neither aliphatic nor
aromatic moieties, adding an ionic moiety to the mesogen leads to nanosegregation of these two
immiscible parts. This phenomenon is similar to what happens in lyotropic liquid crystals, but here
the LC phases are formed without solvent.[37]
Ionic liquid crystals (including non-ionic liquid crystals with hydrophilic parts) have been used to
transport ions, since they show high ionic conductivity in their respective mesophases. The ionic
conductivity can be both anisotropic[6, 62] and selective[10]. The anisotropy originates from the
anisotropy of aligned mesophases, which depends on the positional order of the system. For
example, the SmA phase shows 1D positional order while the Colh phase shows 2D positional order,
as mentioned earlier. The ions will have lower diffusion in the directions where positional order
exists, since it is immiscible with the insulating aliphatic and aromatic moieties. Thus, a higher
conductivity can be measured in the remaining dimension(s), in which the LC phases are liquid-like
(isotropic). The selectivity is highly dependent on the design of the ionic channels/planes; the size of
8/8/2019 Master Thesis - Jonas Sellberg
http://slidepdf.com/reader/full/master-thesis-jonas-sellberg 22/105
15
the cavities as well as the specific interactions between the transported ions and their surroundings
are important. For example, if the LC host can bind to cations without strong and selective binding
sites, the host will show preference for transportation of cations over anions. The dehydration
energies of the cations will dominate the selectivity of different cations, as the size of the cavity
restricts hydrated ions from being transported.[10]
2.5.3 Electric Properties
One main field of research in which the electric properties of liquid crystals are utilized is organic LC
semiconductors, presented in Section 2.6. Beyond that, liquid crystals can be used in various electro-
optical applications, such as LCDs. In these applications, the electric field is utilized to quickly change
the alignment of the LC sample. In addition to the aligning effect of the electric field, liquid crystals
with a semiconducting part, which can conduct electrons or holes, and an ionic part, which conducts
ions, can show electrochromism in bulk state.[63] Electrochromism is the change of color by applying
an electric field, and it occurs by oxidizing or reducing the chromophore so that it changes color.
When applying a voltage, the chromophore is oxidized/reduced by holes/electrons from one of the
electrodes, while the counter ions from the ionic part move to the electrode to form an electrical
double layer, which stabilizes the reduced/oxidized species. Electrochromic materials can be applied
in light-emitting electrochemical cells (LECs) which show electroluminescence, i.e., generates light
from electricity.[64]
2.6 Organic Semiconductors
Organic semiconductors have attracted a lot of attention due to their low cost of production and
disposal[12], combined with the potential to achieve flexible electronic circuitry[11]. In this section,
various types of organic semiconductors and their applications will be reviewed. The transport
characteristics of these materials and the techniques used to measure their carrier mobility will also
be discussed.
2.6.1 Applications and Measuring Techniques
In the mid 1980s, a series of electronic devices were developed almost simultaneously. The
invention of the organic photovoltaic cell[65] (OPVC), light-emitting diode[66] (OLED), and field-effect
transistor[67] (OFET) lead to the starting point of organic electronics. Since then, the emerging
research field has grown constantly and during the last couple of years, the performance of organic
semiconductors has become comparable to that of their inorganic counterparts. Therefore, organic
electronics have become a serious competitor to conventional inorganic electronic devices.
A photovoltaic cell (PVC) transforms light to electric work. The OPVC is made of an organic hetero- junction of p- and n-conducting materials. The materials absorb light, which generates excitons, i.e.,
bound electron-hole pairs. To be useful, the exciton must diffuse to the junction and dissociate into
two free charge carriers before it can recombine. This requires small phase domains with a large
interface area between the p- and n-conducting materials, which has benefited the development of
bulk hetero-junctions.[68] Recently, polymer OPVCs have reached a power-conversion efficiency
above 5 %[69-72], which is close to the top efficiencies of dye-sensitized solar cells with organic dyes[73]
– the standard alternative for cheap solar cells.
A light-emitting diode (LED) is the opposite of a PVC; it transforms electricity to light. Similar to
OPVCs, OLEDs can consist of hetero-junctions of p- and n-conducting materials, but they areoperated at reversed conditions. Therefore, charge recombination is not a problem, but the key
8/8/2019 Master Thesis - Jonas Sellberg
http://slidepdf.com/reader/full/master-thesis-jonas-sellberg 23/105
16
process of which light is created. An alternative approach is to have an ambipolar material in which
both electrons and holes can be transported.[64] OLEDs are the most developed organic electronic
device and have already been released in the market.[74]
A transistor is a device used to switch or amplify electronic signals. It is the key component in
modern electronics, which has led to extensive research in developing stable organic transistors withhigh carrier mobility. Numerous types of transistors exist, but they are usually classified into two
categories: bipolar junction transistors (BJTs) and field-effect transistors (FETs). In organic electronics,
FETs are the most utilized, as they are easier to construct and only require one semiconducting
material (p- or n-type). In OFETs, field-induced charges move along the interface between an organic
semiconductor and a gate dielectric.[22] The terminals between which the field-induced charges are
moving are named source and drain, and the conductivity of the semiconductor is controlled by the
voltage at the gate terminal. There are many different transistor geometries, such as bottom gate,
bottom contacts; bottom gate, top contacts; and top gate, bottom contacts. A special type of FET is
the thin-film transistor (TFT), in which the semiconducting layer is made into a thin film. This type is
suitable for organic semiconductors, as the conducting channel usually does not exceed a few
molecular layers in OFETs[22] and the semiconducting materials often are solution-processable[13].
Alternatively, thin films can be made by deposition.
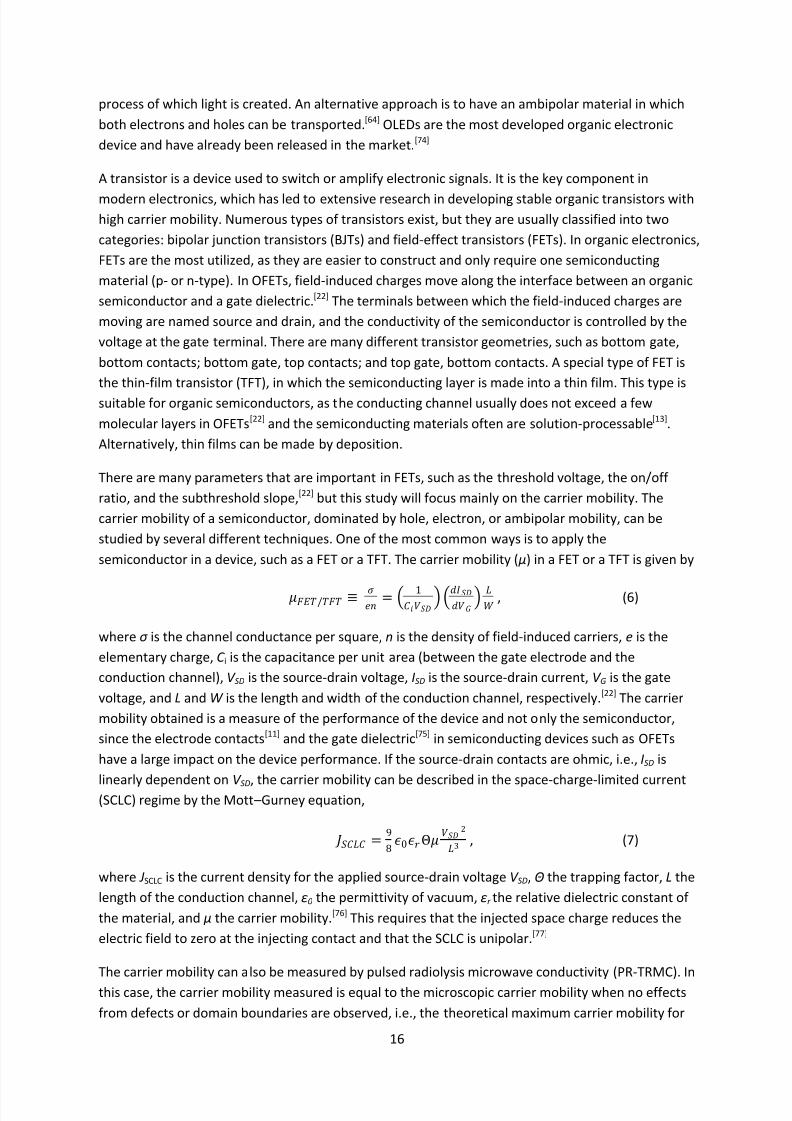
There are many parameters that are important in FETs, such as the threshold voltage, the on/off
ratio, and the subthreshold slope,[22] but this study will focus mainly on the carrier mobility. The
carrier mobility of a semiconductor, dominated by hole, electron, or ambipolar mobility, can be
studied by several different techniques. One of the most common ways is to apply the
semiconductor in a device, such as a FET or a TFT. The carrier mobility ( µ) in a FET or a TFT is given by
/ ≡ = 1 , (6)
where σ is the channel conductance per square, n is the density of field-induced carriers, e is the
elementary charge, C i is the capacitance per unit area (between the gate electrode and the
conduction channel), V SD is the source-drain voltage, ISD is the source-drain current, V G is the gate
voltage, and L and W is the length and width of the conduction channel, respectively.[22] The carrier
mobility obtained is a measure of the performance of the device and not only the semiconductor,
since the electrode contacts[11] and the gate dielectric[75] in semiconducting devices such as OFETs
have a large impact on the device performance. If the source-drain contacts are ohmic, i.e., ISD is
linearly dependent on V SD, the carrier mobility can be described in the space-charge-limited current(SCLC) regime by the Mott –Gurney equation,
=9
80Θ 2
3 , (7)
where JSCLC is the current density for the applied source-drain voltage V SD, Θ the trapping factor, L the
length of the conduction channel, ε0 the permittivity of vacuum, εr the relative dielectric constant of
the material, and μ the carrier mobility.[76] This requires that the injected space charge reduces the
electric field to zero at the injecting contact and that the SCLC is unipolar.[77]
The carrier mobility can also be measured by pulsed radiolysis microwave conductivity (PR-TRMC). In
this case, the carrier mobility measured is equal to the microscopic carrier mobility when no effects
from defects or domain boundaries are observed, i.e., the theoretical maximum carrier mobility for
8/8/2019 Master Thesis - Jonas Sellberg
http://slidepdf.com/reader/full/master-thesis-jonas-sellberg 24/105
17
the material.[78] To evaluate the macroscopic carrier mobility of semiconducting material but with
minimized electrode effects, the time-of-flight (TOF) technique is often used. In TOF measurements,
a pulsed laser excites the surface of the semiconducting material under an applied electric field. This
leads to that the charge carriers travel over the sample, thus inducing a current in the outer circuit.
The current is monitored and the carrier mobility is calculated from the associated transit time by
=
∙ =2
∙ , (8)
where d is the distance between the electrodes, E is the applied electric field, V is the applied
voltage , and τ T is the transit time.[79] The transit time is observed as a kink point in the
photoconductive transient curves, and ideally corresponds to when all the carriers reach the
electrode and the induced current disappears.
2.6.2 Amorphous Organic Semiconductors
The first OFET was made of polythiophene – an amorphous polymer containing α-conjugated
thiophene units.[67] As a consequence, many earlier studies were directed towards amorphous
polymers. Amorphous semiconductors have the advantage that they are easy to process[20], but their
drawback is their low macroscopic carrier mobilities, usually in the order of 10-6-10-3 cm2V-1s-1.[77] In
PR-TRMC studies, the microscopic carrier mobility was found to be in the order of 0.01-0.1 cm2V-1s-1,
indicating that the carrier transport is limited by trapping due to defects and disorder.[77]
Furthermore, the carrier mobilities of amorphous materials are strongly dependent on the electric
field and temperature.[21] They can, therefore, often be accurately described by the Gaussian
disorder model[77], in which carriers jump between the molecules, assisted by thermal and electric
field activation. The molecular orbital energy levels and the transfer integrals (i.e., orbital overlaps)
associated with the carrier transport are assumed to have a Gaussian distribution, caused bydisorder of the local electric field (produced by the molecular dipoles) and the intermolecular
distances, respectively.[80] This results in
= 0 −
2
2 − , = Σ2 ,Σ ≥ 1.5
= 2.25,Σ ≤ 1.5 , (9)
where σ is the width of the Gaussian distribution of the energy levels, Σ is the width of the Gaussian
distribution of the transfer integrals, µ0 is the pre-exponential factor, E is the electric field, k B is the
Boltzmann constant, and T is the absolute temperature. The pre-exponential factor corresponds to
the intrinsic carrier mobility in the absence of disorders. C and α are constants that are determined
by the dimensionality of the system.[80] Because of these properties, amorphous organicsemiconductors have only been utilized as photoreceptors in xerographic applications, working at
low frequency and low current density.[12, 77] Order is necessary to achieve high-performance organic
semiconducting materials.
2.6.3 Crystalline Organic Semiconductors
A couple of years after the invention of the first OFET, OFETs of molecular crystals were
developed.[81, 82] The first one consisted of α-sexithiophene (see Figure 10.a) as semiconducting
material with a macroscopic carrier mobility of 10-3 cm2V-1s-1[81], comparable to the best devices
made of amorphous semiconductors. Within a year, this OFET was refined into an all-organic TFT,
which contained a polymeric film support, an organic insulating layer as dielectric, and α-sexithiophene as semiconductor, with only the electrode contacts made of metal. This device had a
8/8/2019 Master Thesis - Jonas Sellberg
http://slidepdf.com/reader/full/master-thesis-jonas-sellberg 25/105
18
carrier mobility of 0.46 cm2V-1s-1[82], out-performing the amorphous OFETs by far and for the first
time showing characteristics similar to conventional inorganic TFTs made of amorphous silicon.
For a long time, carrier mobilities of this magnitude in OFETs could not be surpassed. Almost a
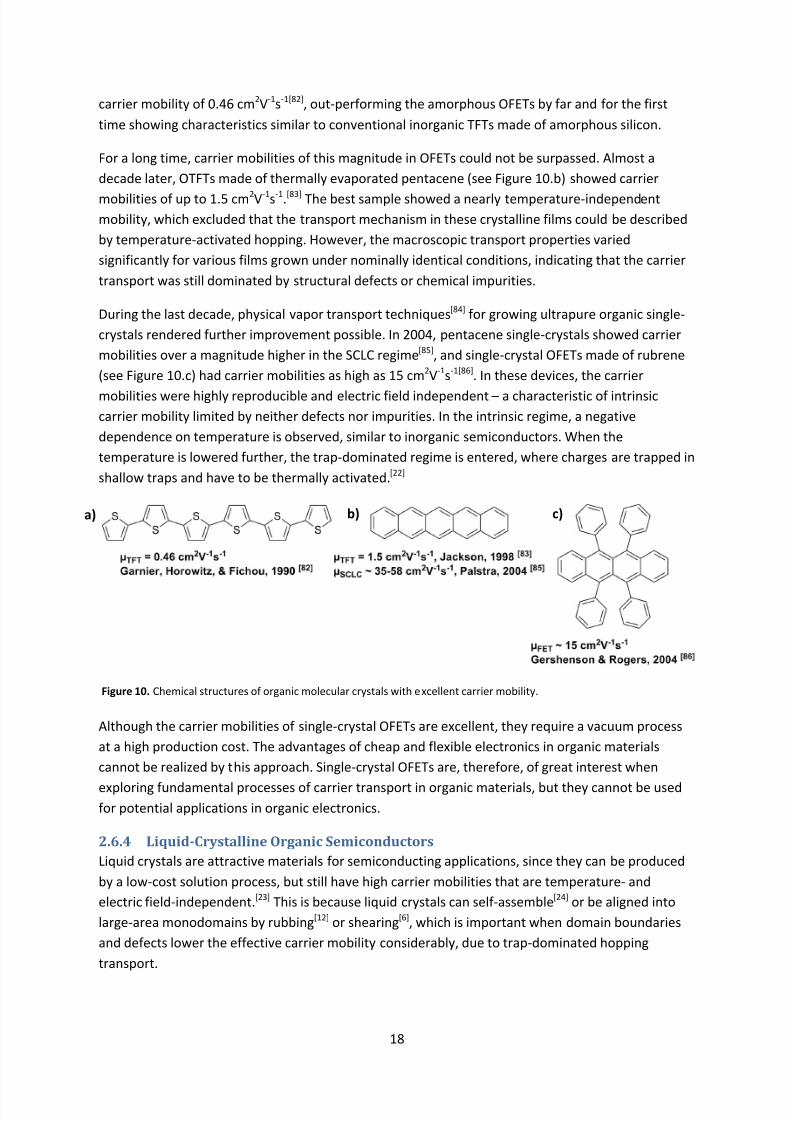
decade later, OTFTs made of thermally evaporated pentacene (see Figure 10.b) showed carrier
mobilities of up to 1.5 cm2V-1s-1.[83] The best sample showed a nearly temperature-independentmobility, which excluded that the transport mechanism in these crystalline films could be described
by temperature-activated hopping. However, the macroscopic transport properties varied
significantly for various films grown under nominally identical conditions, indicating that the carrier
transport was still dominated by structural defects or chemical impurities.
During the last decade, physical vapor transport techniques[84] for growing ultrapure organic single-
crystals rendered further improvement possible. In 2004, pentacene single-crystals showed carrier
mobilities over a magnitude higher in the SCLC regime[85], and single-crystal OFETs made of rubrene
(see Figure 10.c) had carrier mobilities as high as 15 cm2V-1s-1[86]. In these devices, the carrier
mobilities were highly reproducible and electric field independent – a characteristic of intrinsiccarrier mobility limited by neither defects nor impurities. In the intrinsic regime, a negative
dependence on temperature is observed, similar to inorganic semiconductors. When the
temperature is lowered further, the trap-dominated regime is entered, where charges are trapped in
shallow traps and have to be thermally activated.[22]
Although the carrier mobilities of single-crystal OFETs are excellent, they require a vacuum process
at a high production cost. The advantages of cheap and flexible electronics in organic materials
cannot be realized by this approach. Single-crystal OFETs are, therefore, of great interest when
exploring fundamental processes of carrier transport in organic materials, but they cannot be usedfor potential applications in organic electronics.
2.6.4 Liquid-Crystalline Organic Semiconductors
Liquid crystals are attractive materials for semiconducting applications, since they can be produced
by a low-cost solution process, but still have high carrier mobilities that are temperature- and
electric field-independent.[23] This is because liquid crystals can self-assemble[24] or be aligned into
large-area monodomains by rubbing[12] or shearing[6], which is important when domain boundaries
and defects lower the effective carrier mobility considerably, due to trap-dominated hopping
transport.
Figure 10. Chemical structures of organic molecular crystals with excellent carrier mobility.
a) b) c)
8/8/2019 Master Thesis - Jonas Sellberg
http://slidepdf.com/reader/full/master-thesis-jonas-sellberg 26/105
19
In N phases, the carrier mobility is usually in the order of amorphous or isotropic systems, governed
by ionic conduction whose mobility is determined by the viscosity of the phase.[18, 19] In Col and Sm
phases, the carrier mobility is highly anisotropic. It is enhanced within the columns/layers and
suppressed perpendicular to the columns/layers, as the aliphatic chains act as an insulating layer
between the semiconducting cores. For a specific type of semiconducting mesogen, increased order
within the columns/layers results in higher carrier mobility, since the concentration of traps (i.e., the
energy disorder) decreases and the transfer integrals (i.e., the positional order) become larger. For
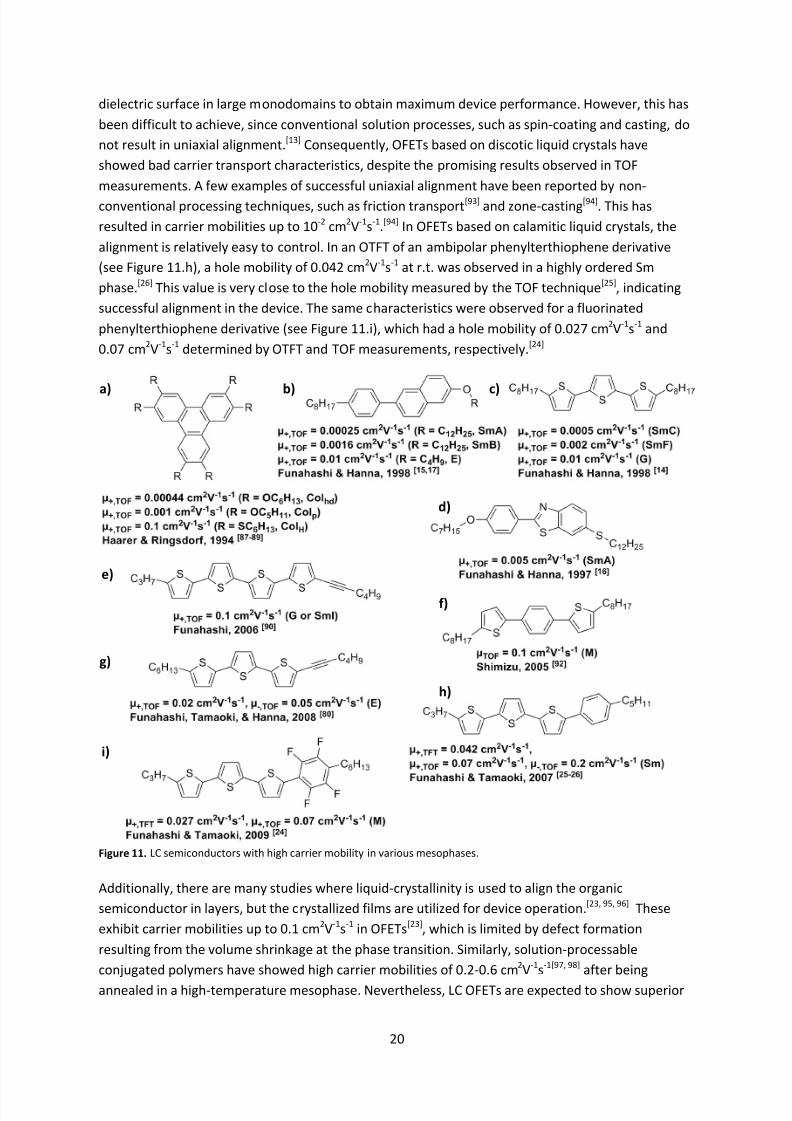
example, in Col phases of triphenylene derivatives (see Figure 11.a), the hole mobility in TOF
measurements was in the order of 10-4 cm2V-1s-1[87] in the Colhd phase, increased to a value in the
order of 10-3 cm2V-1s-1[88] in the Colp phase, and was as high as a value in the order of 0.1 cm2V-1s-1[89]
in the highly ordered ColH phase.[13] The same tendency was observed in Sm phases of a 2-
phenylnaphtalene (see Figure 11.b) and terthiophene (see Figure 11.c) derivatives. The hole mobility
in TOF measurements was in the order of 10-4 cm2V-1s-1 in the SmA and SmC phases, increased to a
value in the order of 10-3 cm2V-1s-1 in the SmB and SmF phases, and increased even further to a value
in the order of 10-2
cm2
V-1
s-1
in the soft crystal E and G phases, respectively.[14, 15, 17]
These values aretypical for semiconducting smectogens (mesogens showing Sm phases). Especially high carrier
mobilities were observed in the fluid Sm phases for a thiobenzothiazole derivative[16] (see Figure
11.d) and in the highly ordered Sm phases for hexynylquaterthiophene[90, 91] (see Figure 11.e) and
dithienylbenzene[92] (see Figure 11.f) derivatives.
The carrier transport in liquid crystals can often be described by the hopping mechanism. A
hexynylterthiophene derivative (see Figure 11.g) exhibited ambipolar carrier transport in the E phase
over a very wide temperature range of -100°C to 100°C.[80] Below room temperature (r.t.), the
electron and hole mobilities were strongly dependent on electric field strength and temperature,
which can be described by the Gaussian disorder model. The energetic disorders (σ ) wereapproximately 50 meV, which is about 50 % of the values observed in amorphous organic
semiconductors. Above room temperature, the electron and hole mobilities were independent of
electric field strength and temperature, since most of the carriers are excited into the transport
states at that temperature.[13] In hopping transport, the carrier mobility is a function of
intermolecular distance and can be described by
∝ −2 , (10)
where r is the intermolecular distance and γ is the decay constant of the molecular orbitals.[12]
Equation (10) can be fitted to the 2-phenylnaphtalene and terthiophene derivatives by estimatingintermolecular distances from X-ray diffraction. From this it can be concluded that the shorter
intermolecular distances in highly ordered Sm phases result in a larger transfer integral, which
enhances carrier hopping. The higher carrier mobility in the Sm phases for the terthiophene
derivative compared to the 2-phenylnaphtalene derivative can be explained by sulfur’s large van der
Waals radii, resulting in a larger intermolecular orbital overlap due to extended molecular orbitals.[13]
Thus, soft crystal phases with large π-conjugated systems are highly preferable for high-performance
LC organic semiconductors.
When applying an LC organic semiconductor in a device, alignment becomes a key issue, as the
macroscopic carrier mobility is highly dependent on the domain size and the orientation of thesample. In OFETs based on discotic liquid crystals, columns should be aligned parallel to the
8/8/2019 Master Thesis - Jonas Sellberg
http://slidepdf.com/reader/full/master-thesis-jonas-sellberg 27/105
20
dielectric surface in large monodomains to obtain maximum device performance. However, this has
been difficult to achieve, since conventional solution processes, such as spin-coating and casting, do
not result in uniaxial alignment.[13] Consequently, OFETs based on discotic liquid crystals have
showed bad carrier transport characteristics, despite the promising results observed in TOF
measurements. A few examples of successful uniaxial alignment have been reported by non-
conventional processing techniques, such as friction transport [93] and zone-casting[94]. This has
resulted in carrier mobilities up to 10-2 cm2V-1s-1.[94] In OFETs based on calamitic liquid crystals, the
alignment is relatively easy to control. In an OTFT of an ambipolar phenylterthiophene derivative
(see Figure 11.h), a hole mobility of 0.042 cm2V-1s-1 at r.t. was observed in a highly ordered Sm
phase.[26] This value is very close to the hole mobility measured by the TOF technique[25], indicating
successful alignment in the device. The same characteristics were observed for a fluorinated
phenylterthiophene derivative (see Figure 11.i), which had a hole mobility of 0.027 cm2V-1s-1 and
0.07 cm2V-1s-1 determined by OTFT and TOF measurements, respectively.[24]
Additionally, there are many studies where liquid-crystallinity is used to align the organic
semiconductor in layers, but the crystallized films are utilized for device operation.[23, 95, 96] These
exhibit carrier mobilities up to 0.1 cm2V-1s-1 in OFETs[23], which is limited by defect formation
resulting from the volume shrinkage at the phase transition. Similarly, solution-processable
conjugated polymers have showed high carrier mobilities of 0.2-0.6 cm2V-1s-1[97, 98] after being
annealed in a high-temperature mesophase. Nevertheless, LC OFETs are expected to show superior
Figure 11. LC semiconductors with high carrier mobility in various mesophases.
a) b) c)
d)
e)
h)
g)
f)
i)

8/8/2019 Master Thesis - Jonas Sellberg
http://slidepdf.com/reader/full/master-thesis-jonas-sellberg 28/105
21
flexibility compared to their crystalline counterparts, which is important for potential applications in
flexible electronics.[13]
8/8/2019 Master Thesis - Jonas Sellberg
http://slidepdf.com/reader/full/master-thesis-jonas-sellberg 29/105
22
3. MethodsIn this chapter, experimental and methods related to this thesis are described. First, theoretical
background of the methods will be briefly presented, followed by the experimental setup of the
synthesis and analysis.
3.1 Background
3.1.1 Nuclear Magnetic Resonance Spectroscopy
NMR spectroscopy is one of the most powerful methods in chemistry to characterize the primary
structure of an unknown molecule. Active nuclei with a total angular momentum I ≠ 0 behave as a
spin but also contain magnetic moment. In other words, they can be regarded as small magnets in a
magnetic field, but they also precess with a specific Larmor frequency,
0 = −0 , (11)
where γ is the gyromagnetic ratio for the specific nuclei and B0 is the magnetic field strength. Thenuclear magnetic moment,
= , (12)
is much smaller than for an electron, but by applying a strong magnetic field B of several tesla, there
will occur an energy difference between spins pointed parallel or antiparallel to the magnetic field.
For I = ½, this results in a small population difference,
= −∆/ = −0/ℏ, (13)
where ℏ is the reduced Planck constant and k B is the Boltzmann constant.[99] When the spins areturned 90°, this population difference will lead to a resonating signal which can be measured. The
frequency of the signal depends on the Larmor frequency and the specific electronic environment of
the spin, and both are directly proportional to the strength of the magnetic field. Therefore, the
magnetic field-independent chemical shift δ is defined as
=−0
0 , (14)
where ω is the resonance frequency for a specific electronic environment and ω0 is the fundamental
resonance frequency of the nuclei, determined as the Larmor frequency for a reference compound.
For 1H, 13C, and 29Si nuclei, tetramethylsilane (TMS) is commonly used as the reference compound.The NMR signal measured, which is a superposition of all these different frequencies in the time
domain, is Fourier transformed into a spectra in the frequency domain.
Spins with identical surroundings will result in identical chemical shifts, thereby increasing the
intensity of the peak in the frequency domain. The intensity of the peak is therefore proportional to
the number of spins building up the signal, and the intensities of different peaks in a spectrum can
be compared as long as the longitudinal spin relaxation (τ 1) for the different spins is taken into
account. The J-coupling J is another important parameter. This coupling arises from the interaction
of different spin states through the chemical bonds of a molecule, which splits the chemical shifts.
For spins with I = ½, such as 1H, the coupling to n equivalent nuclei splits the signal into an n+1
multiplet.
8/8/2019 Master Thesis - Jonas Sellberg
http://slidepdf.com/reader/full/master-thesis-jonas-sellberg 30/105
23
3.1.2 Mass Spectroscopy
Mass spectroscopy (MS) is used to determine the mass composition of a sample. The principle of MS
consists of first ionizing chemical compounds to generate charged molecules or fragments of
molecules, then measuring their mass-to-charge ratio based on their motion in electromagnetic
fields. This is described by Lorentz force law combined with Newton’s second law of motion,
= + × , (15)
where m is the mass of the particle, Q is the charge of the particle, a is the acceleration of the
particle, E is the electric field, and v x B is the cross product of the particle velocity and the magnetic
field. Several types of ionization techniques and analyzers exist. In this thesis, matrix-assisted laser
desorption/ionization (MALDI) with a time-of-flight (TOF) analyzer was used. MALDI is an ionization
technique which is effective for macromolecules, and it is widely used for protein analysis.[100] The
TOF analyzer accelerates the ions in an electric field of known strength and measures the time it
takes for the ions to reach the detector at a known distance. This time will depend on the mass-to-
charge ratio of the particle (heavier particles reach lower speeds). If the particles have the same
charge, their kinetic energies will be identical. As a result, their accelerations will depend only on
their masses.
3.1.3 Elemental Analysis
Elemental analysis is employed to analyze a sample regarding its elemental and sometimes isotopic
composition.[101] It is both qualitative and quantitative, determining both the identity and the
amount of elements present, which makes it a very sensitive technique to determine chemical purity.
Usually, the weights of carbon, hydrogen, nitrogen, and a residual of other elements, such as
halogens, sulfur, and oxygen, are determined by combustion analysis. In this technique, the sample
is burned in an excess of oxygen, producing the combustion products carbon dioxide (CO2), water
(H2O), and nitric oxide (NO), which are collected in various traps and weighed to determine the
composition of the sample.
3.1.4 Infrared Spectroscopy
Infrared (IR) spectroscopy focuses on the absorbance of electromagnetic waves in the IR region of
the electromagnetic spectrum. The absorbance of IR radiation depends on the vibrational and
rotational transitions within the molecule, making it possible to connect specific bonds or functional
groups with the absorbing frequencies. This can be used as a trace of a successful synthesis, or more
specifically, as a proof of functional groups present in the sample.[102]
There are also other types of spectroscopic techniques to evaluate vibrational and rotational
transitions, such as Raman and microwave spectroscopy. Microwave spectroscopy detects pure
rotational transitions, while IR and Raman spectroscopy are used to evaluate the vibrational-
rotational structure of the molecule. IR spectroscopy is generally better in detecting functional
groups with a dipole moment, whilst Raman spectroscopy is widely used to detect functional groups
which are polarizable but do not necessarily have a permanent dipole moment.
In this thesis, Fourier-transform infrared (FTIR) spectroscopy was used. FTIR spectroscopy is when
the IR absorption is Fourier transformed from a superposition of waves in time to an absorption
spectrum in the frequency domain. It is a fast and cheap type of IR spectroscopy compared totraditional methods when monochromatic light is absorbed separately for every frequency.[103]
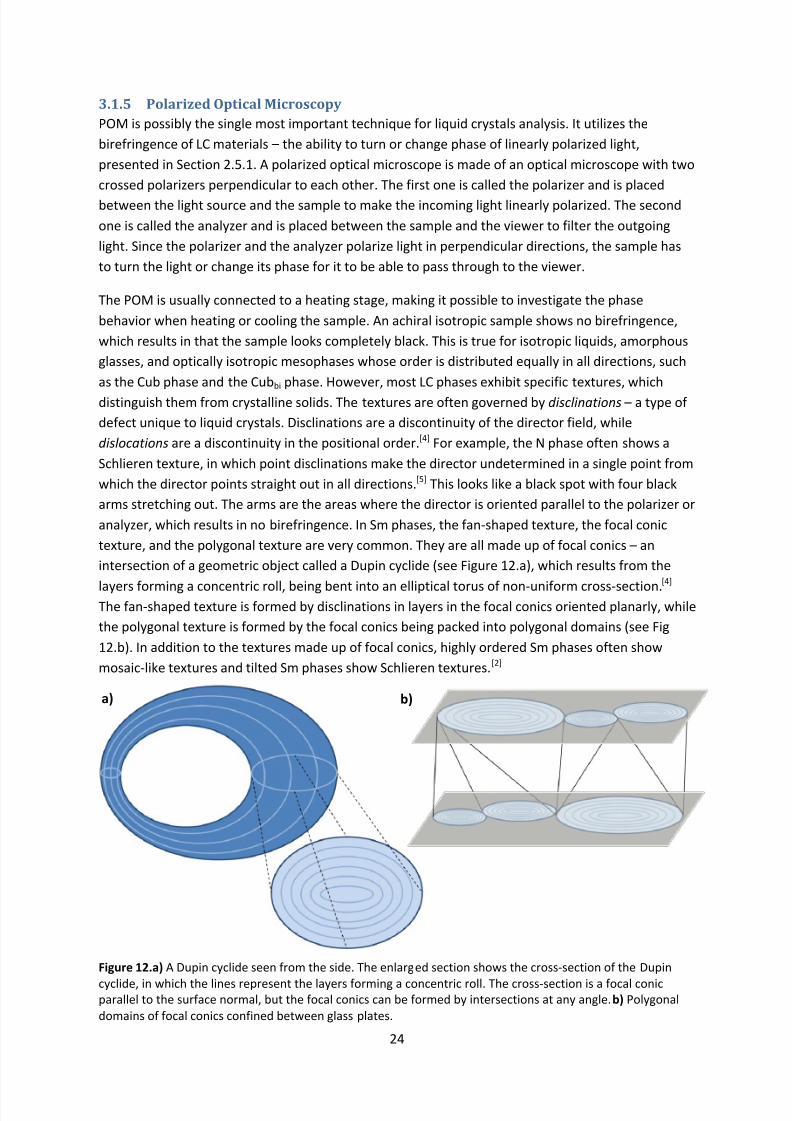
8/8/2019 Master Thesis - Jonas Sellberg
http://slidepdf.com/reader/full/master-thesis-jonas-sellberg 31/105
24
3.1.5 Polarized Optical Microscopy
POM is possibly the single most important technique for liquid crystals analysis. It utilizes the
birefringence of LC materials – the ability to turn or change phase of linearly polarized light,
presented in Section 2.5.1. A polarized optical microscope is made of an optical microscope with two
crossed polarizers perpendicular to each other. The first one is called the polarizer and is placed
between the light source and the sample to make the incoming light linearly polarized. The second
one is called the analyzer and is placed between the sample and the viewer to filter the outgoing
light. Since the polarizer and the analyzer polarize light in perpendicular directions, the sample has
to turn the light or change its phase for it to be able to pass through to the viewer.
The POM is usually connected to a heating stage, making it possible to investigate the phase
behavior when heating or cooling the sample. An achiral isotropic sample shows no birefringence,
which results in that the sample looks completely black. This is true for isotropic liquids, amorphous
glasses, and optically isotropic mesophases whose order is distributed equally in all directions, such
as the Cub phase and the Cubbi phase. However, most LC phases exhibit specific textures, which
distinguish them from crystalline solids. The textures are often governed by disclinations – a type of
defect unique to liquid crystals. Disclinations are a discontinuity of the director field, while
dislocations are a discontinuity in the positional order.[4] For example, the N phase often shows a
Schlieren texture, in which point disclinations make the director undetermined in a single point from
which the director points straight out in all directions.[5] This looks like a black spot with four black
arms stretching out. The arms are the areas where the director is oriented parallel to the polarizer or
analyzer, which results in no birefringence. In Sm phases, the fan-shaped texture, the focal conic
texture, and the polygonal texture are very common. They are all made up of focal conics – an
intersection of a geometric object called a Dupin cyclide (see Figure 12.a), which results from the
layers forming a concentric roll, being bent into an elliptical torus of non-uniform cross-section.[4]
The fan-shaped texture is formed by disclinations in layers in the focal conics oriented planarly, while
the polygonal texture is formed by the focal conics being packed into polygonal domains (see Fig
12.b). In addition to the textures made up of focal conics, highly ordered Sm phases often show
mosaic-like textures and tilted Sm phases show Schlieren textures.[2]
Figure 12.a) A Dupin cyclide seen from the side. The enlarged section shows the cross-section of the Dupin
cyclide, in which the lines represent the layers forming a concentric roll. The cross-section is a focal conicparallel to the surface normal, but the focal conics can be formed by intersections at any angle. b) Polygonaldomains of focal conics confined between glass plates.
a) b)
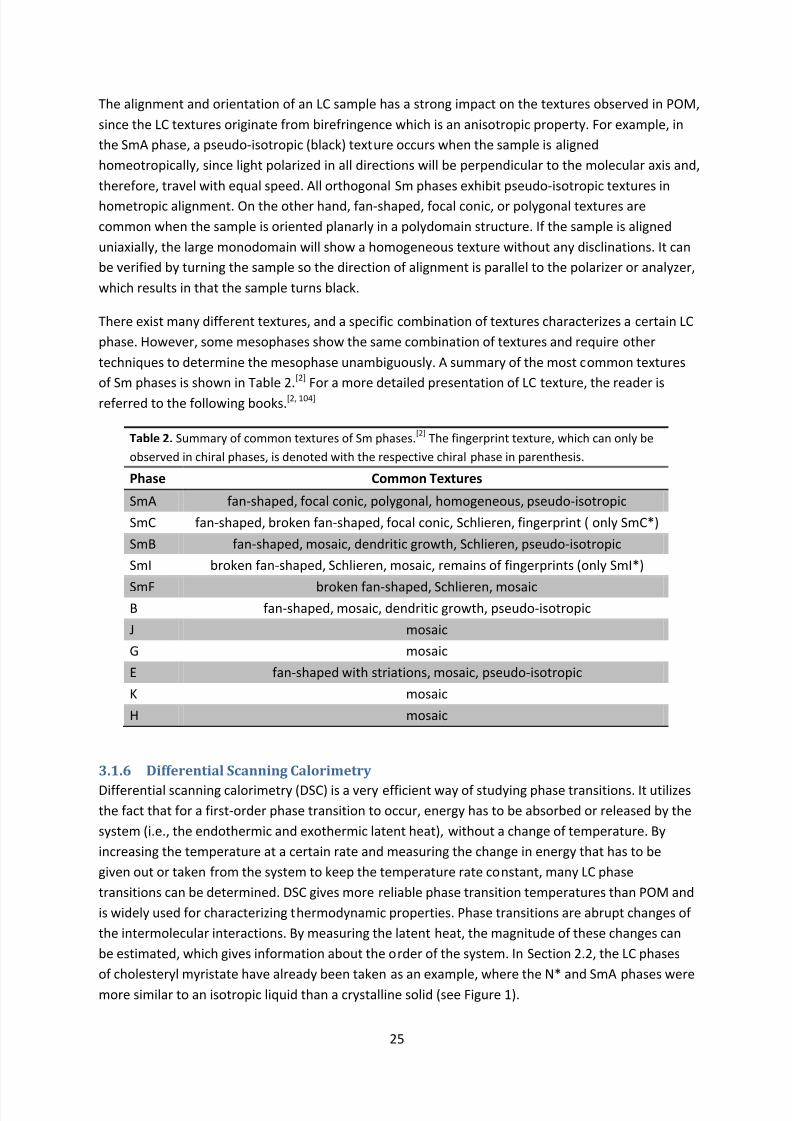
8/8/2019 Master Thesis - Jonas Sellberg
http://slidepdf.com/reader/full/master-thesis-jonas-sellberg 32/105
25
The alignment and orientation of an LC sample has a strong impact on the textures observed in POM,
since the LC textures originate from birefringence which is an anisotropic property. For example, in
the SmA phase, a pseudo-isotropic (black) texture occurs when the sample is aligned
homeotropically, since light polarized in all directions will be perpendicular to the molecular axis and,
therefore, travel with equal speed. All orthogonal Sm phases exhibit pseudo-isotropic textures in
hometropic alignment. On the other hand, fan-shaped, focal conic, or polygonal textures are
common when the sample is oriented planarly in a polydomain structure. If the sample is aligned
uniaxially, the large monodomain will show a homogeneous texture without any disclinations. It can
be verified by turning the sample so the direction of alignment is parallel to the polarizer or analyzer,
which results in that the sample turns black.
There exist many different textures, and a specific combination of textures characterizes a certain LC
phase. However, some mesophases show the same combination of textures and require other
techniques to determine the mesophase unambiguously. A summary of the most common textures
of Sm phases is shown in Table 2.[2] For a more detailed presentation of LC texture, the reader is
referred to the following books.[2, 104]
Table 2. Summary of common textures of Sm phases.[2] The fingerprint texture, which can only be
observed in chiral phases, is denoted with the respective chiral phase in parenthesis.
Phase Common Textures
SmA fan-shaped, focal conic, polygonal, homogeneous, pseudo-isotropic
SmC fan-shaped, broken fan-shaped, focal conic, Schlieren, fingerprint ( only SmC*)
SmB fan-shaped, mosaic, dendritic growth, Schlieren, pseudo-isotropic
SmI broken fan-shaped, Schlieren, mosaic, remains of fingerprints (only SmI*)
SmF broken fan-shaped, Schlieren, mosaicB fan-shaped, mosaic, dendritic growth, pseudo-isotropic
J mosaic
G mosaic
E fan-shaped with striations, mosaic, pseudo-isotropic
K mosaic
H mosaic
3.1.6 Differential Scanning Calorimetry
Differential scanning calorimetry (DSC) is a very efficient way of studying phase transitions. It utilizesthe fact that for a first-order phase transition to occur, energy has to be absorbed or released by the
system (i.e., the endothermic and exothermic latent heat), without a change of temperature. By
increasing the temperature at a certain rate and measuring the change in energy that has to be
given out or taken from the system to keep the temperature rate constant, many LC phase
transitions can be determined. DSC gives more reliable phase transition temperatures than POM and
is widely used for characterizing thermodynamic properties. Phase transitions are abrupt changes of
the intermolecular interactions. By measuring the latent heat, the magnitude of these changes can
be estimated, which gives information about the order of the system. In Section 2.2, the LC phases
of cholesteryl myristate have already been taken as an example, where the N* and SmA phases were
more similar to an isotropic liquid than a crystalline solid (see Figure 1).
8/8/2019 Master Thesis - Jonas Sellberg
http://slidepdf.com/reader/full/master-thesis-jonas-sellberg 33/105
26
3.1.7 X-Ray Diffraction
X-ray diffraction (XRD) is a direct probe of electron density fluctuations, which occurs between
atoms inside a condensed material. When X-rays hit the sample, they will scatter off the electron
density differences. The diffraction of X-rays is strongest in crystalline solids, since the electron
density difference is repeated many times at an identical distance. Crystals are made up by unit cells
– the smallest repeating unit which represents the crystalline material. Elastic Rayleigh scattering of
the atoms in crystals can be thought of as scattering between different crystal planes in the atomic
lattice. Depending on the phase shift between two scattered waves, constructive or destructive
interference will occur. Constructive interference occurs when the phase shift is a multiple of 2π,
which is expressed by Bragg’s law,
= 2 sin, (16)
where λ is the wavelength of the X-rays, d is the spacing between the crystal planes in the atomic
lattice, θ is the angle between the incident ray and the scattering planes, and n is an integer which
determines the order of the scattering.[4]
The distances in the unit cell obtained by XRD are connected to the miller indices (hkl ). They are
parameters of the reciprocal space, in which the interference pattern is directly observed. (100)
represents the distance of the unit cell along the a-axis, (010) represents the distance of the unit cell
along the b-axis, and (001) represents the distance of the unit cell along the c-axis. From Bragg’s law
it follows that when the distances between the scattering atoms decrease, the scattered angle will
increase, and, therefore, the miller indices also increase by an integer (hkl ) representing the distance
11
1
inside the unit cell. It is also evident that higher order scattering (n ≥ 2) of the atomic
distances will also increase the scattering angle (2θ). Since higher order scattering occurs at the
same place as the miller indices with higher numbers, it is usually represented by the miller indices
within the field of liquid crystals, although their reciprocal distances do not represent the distances
inside the unit cell .
Several types of XRD techniques exist: single-crystal XRD, powder XRD, wide-angle X-ray scattering
(WAXS), and small-angle X-ray scattering (SAXS). WAXS and SAXS are used to determine the
crystalline structure of polymers and liquid crystals, while single-crystal XRD and powder XRD are
used for structural characterization of single crystals and powders and microcrystalline materials,
respectively.[4] WAXS and SAXS are principally the same technique, but they map different distances
within the material, where the shorter angle is equivalent to a longer distance, in accordance with
Bragg’s law.
3.1.8 Ultraviolet/Visible Absorption and Photoluminescence Spectroscopy
Ultraviolet and visible light (UV/Vis) absorption and photoluminescence (PL) spectroscopy are
spectroscopic probes of the electronic structure. The two techniques complement each other, since
UV/Vis absorption spectroscopy maps transitions from ground to excited states, while UV/Vis PL
spectroscopy probes transitions from excited to ground states. The first absorption peak gives
valuable information about the optical band gap,
=
=
, (17)

8/8/2019 Master Thesis - Jonas Sellberg
http://slidepdf.com/reader/full/master-thesis-jonas-sellberg 34/105
27
where h is the Planck constant, v abs is the frequency of the absorbed light, c is the speed of light in
vacuum, and λabs is the wavelength of the absorbed light. The optical band gap can be related to the
valence and conduction bands of a molecule in a condensed state or the highest occupied molecular
orbital (HOMO) and the lowest unoccupied molecular orbital (LUMO) of an isolated molecule.
In solution, the UV/Vis absorption of a chromophore at low concentrations follows Lambert-Beer’s
law,
=0 = 10− = 10− , (18)
where T is the transmissivity, I is the light intensity passed through the sample, I0 is the incident light
intensity, A is the absorbance, ε is the molar absorptivity of the chromophore, l is the length of the
sample which the light passes through, and c is the concentration of the sample. The molar
absorptivity of the chromophore is a measure of how strongly each molecule absorbs the UV/Vis
radiation.
In thin films, UV/Vis absorption and PL spectroscopy contain information about the intermolecular
interactions inside the self-assembled structures. The absorption peaks can shift due to aggregation,
but are usually just broadened. The PL peaks can be thermally quenched due to close packing of the
π –conjugated chromophores. If the excited molecule forms an excimer (i.e., forms a dimer of the
excited molecule together with a molecule in the ground state), a red shift in PL to longer
wavelengths takes place, as the excimer stabilizes the energy of the excited state.[105]
3.1.9 Circular Dichroism Spectroscopy
Circular dichroism (CD) spectroscopy is used to study the chirality of a system. It is measured as the
difference in absorbance ( ΔA) between left circularly polarized light ( ALCP) and right circularlypolarized light ( ARCP):
Δ = − (19)
For a system to show CD, it has to absorb the light and be optically active. Therefore, CD is usually
applied in the UV/Vis region, where electronic excitations occur, but it can also be recorded in the IR
region (vibrational CD)[106]. Optical activity comes from the chirality of the system, which can be
generated by chiral molecules, achiral molecules interacting with chiral molecules, or achiral
molecules forming chiral superstructures. If the CD spectrum is measured in solution, Lambert-
Beer’s law applies,
Δ = Δ = − , (20)
where Δε is the molar CD, εLCP is the molar absorptivity of left circularly polarized light, εRCP is the
molar absorptivity of right circularly polarized light, l is the length of the sample which the light
passes through, and c is the concentration of the sample. To measure CD, equal amounts of right
and left circularly polarized light (i.e., linearly polarized light) is shined through the sample. When
one of the circular components is absorbed, the polarization of the light will gradually start to
resemble the circular component which is not absorbed, and the polarization takes an elliptical
shape. Therefore, CD can also be expressed as degrees of ellipticity (see Figure 13), which is
frequently used in the literature.
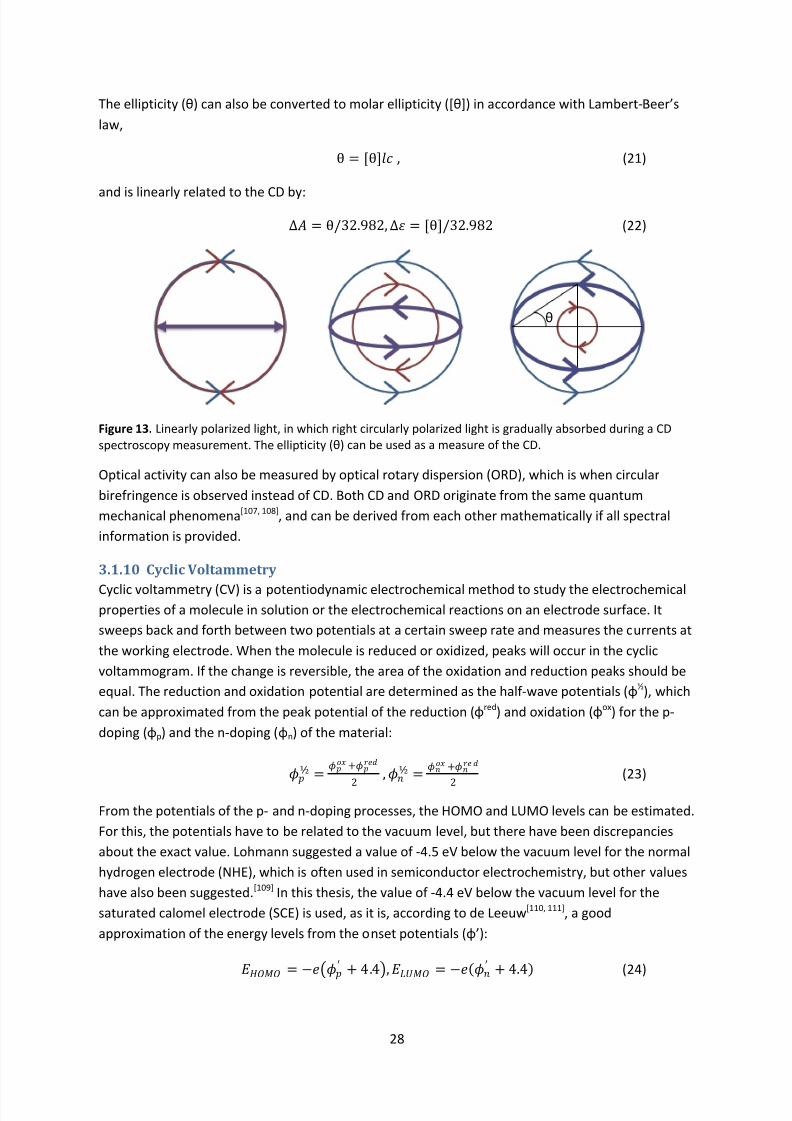
8/8/2019 Master Thesis - Jonas Sellberg
http://slidepdf.com/reader/full/master-thesis-jonas-sellberg 35/105
28
The ellipticity (θ) can also be converted to molar ellipticity (*θ+) in accordance with Lambert-Beer’s
law,
θ = [θ] , (21)
and is linearly related to the CD by:
Δ = θ/32.982,Δ = [θ]/32.982 (22)
Figure 13. Linearly polarized light, in which right circularly polarized light is gradually absorbed during a CDspectroscopy measurement. The ellipticity (θ) can be used as a measure of the CD.
Optical activity can also be measured by optical rotary dispersion (ORD), which is when circular
birefringence is observed instead of CD. Both CD and ORD originate from the same quantum
mechanical phenomena[107, 108], and can be derived from each other mathematically if all spectral
information is provided.
3.1.10 Cyclic Voltammetry
Cyclic voltammetry (CV) is a potentiodynamic electrochemical method to study the electrochemicalproperties of a molecule in solution or the electrochemical reactions on an electrode surface. It
sweeps back and forth between two potentials at a certain sweep rate and measures the currents at
the working electrode. When the molecule is reduced or oxidized, peaks will occur in the cyclic
voltammogram. If the change is reversible, the area of the oxidation and reduction peaks should be
equal. The reduction and oxidation potential are determined as the half-wave potentials (φ½), which
can be approximated from the peak potential of the reduction (φred) and oxidation (φox) for the p-
doping (φp) and the n-doping (φn) of the material:
½ =
+2
,
½ =
+ 2
(23)
From the potentials of the p- and n-doping processes, the HOMO and LUMO levels can be estimated.
For this, the potentials have to be related to the vacuum level, but there have been discrepancies
about the exact value. Lohmann suggested a value of -4.5 eV below the vacuum level for the normal
hydrogen electrode (NHE), which is often used in semiconductor electrochemistry, but other values
have also been suggested.[109] In this thesis, the value of -4.4 eV below the vacuum level for the
saturated calomel electrode (SCE) is used, as it is, according to de Leeuw[110, 111], a good
approximation of the energy levels from the onset potentials (φ’):
=
−′ + 4.4
,
=
−′ + 4.4
(24)
θ
8/8/2019 Master Thesis - Jonas Sellberg
http://slidepdf.com/reader/full/master-thesis-jonas-sellberg 36/105
29
From E HOMO and E LUMO, the E g can then be directly calculated:
= − (25)
3.1.11 Density Functional Theory
Density functional theory (DFT) is a powerful tool to compute ground-state electronic propertiesquantum-mechanically, reducing the computationally heavy many-electron problem to a
computationally more tractable problem of non-interacting electrons moving in a self-consistent
field.[112] This is done by solving the Kohn-Sham equations,
+ − + − + − + = + − + − + − =
= −1
2∇2 + 1
2 ′ − ′ ′ − ′
′ − ′ + 1
2 I
− ≠
= = ∗() , (26)
where T el is the kinetic energy operator, Uel-el is the potential energy operator between electrons,
Uel-nu is the potential energy operator between electrons and nuclei, Unu-nu is the potential energy
operator between nuclei, µ xc is the exchange correlation functional, ρ is the electron density, ψi is
the Kohn-Sham molecular orbitals, and εi is the Kohn-Sham eigenvalues.[113]
3.1.12 Polarization Switching
Polarization switching is an effective method of detecting switching between different polarized
states, such as switching between ferroelectric and antiferroelectric states. The sample is exposed toan alternating voltage (AC voltage) and the current response is measured. If the sample shows a fast
response where reversible peaks occur, the response indicates successful polarization switching.
Furthermore, the peak areas should be constant for a large frequency range.
3.1.13 Time-of-Flight Measurement
The TOF measurement[79] was briefly presented in Section 2.6.1, where the carrier mobility was
calculated from Equation 8. The experimental setup (see Figure 14) consists of a pulse laser, a direct
voltage (DC voltage) source, a sample stage, and a digital oscilloscope. The signal is measured in the
oscilloscope as a potential difference (V ), which is enhanced by a large resistance (R) according to
Ohm’s law,
= , (27)
where I is the photo-induced current. To achieve sufficient signal strength, resistances in the order
of 0.1-10 kΩ have to be used. A too strong resistance, however, will delay the potential response and
distort the observed transient photocurrent. Therefore, the resistance has to be chosen carefully in
order to observe the true kink point. If the transient photocurrents are dispersive, the kink point will
be less pronounced, and resemble a gradual decay instead of a sharp end of the photocurrent. The
penetration dept of the laser irradiation is also important. Equation (8) is only true if the irradiation
depth is much smaller than the sample thickness, i.e., only the sample of the surface is excited. This
is usually not a problem, since the penetration depth of UV light is less than 0.5 µm when it is close
to the absorption maximum of chromophore.[24, 114, 115]
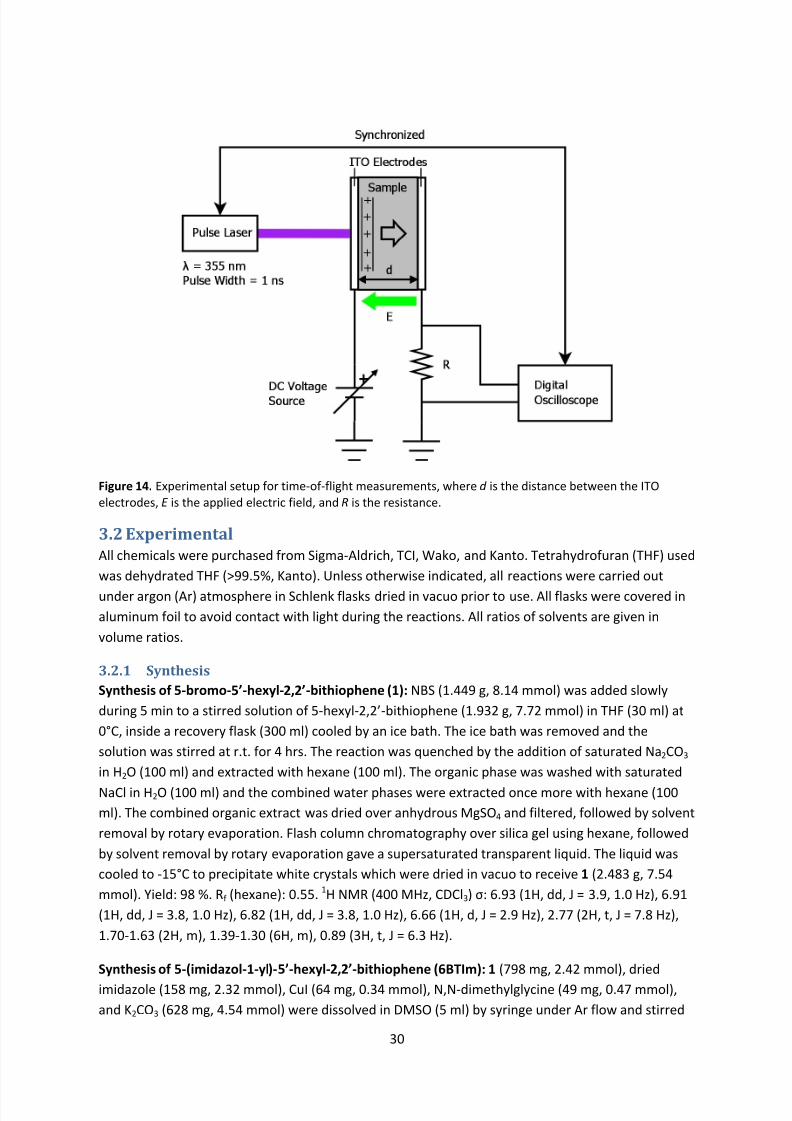
8/8/2019 Master Thesis - Jonas Sellberg
http://slidepdf.com/reader/full/master-thesis-jonas-sellberg 37/105
30
Figure 14. Experimental setup for time-of-flight measurements, where d is the distance between the ITOelectrodes, E is the applied electric field, and R is the resistance.
3.2 Experimental
All chemicals were purchased from Sigma-Aldrich, TCI, Wako, and Kanto. Tetrahydrofuran (THF) used
was dehydrated THF (>99.5%, Kanto). Unless otherwise indicated, all reactions were carried out
under argon (Ar) atmosphere in Schlenk flasks dried in vacuo prior to use. All flasks were covered in
aluminum foil to avoid contact with light during the reactions. All ratios of solvents are given in
volume ratios.
3.2.1 Synthesis
Synthesis of 5-bromo-5’-hexyl-2,2’-bithiophene (1): NBS (1.449 g, 8.14 mmol) was added slowly
during 5 min to a stirred solution of 5-hexyl-2,2’-bithiophene (1.932 g, 7.72 mmol) in THF (30 ml) at
0°C, inside a recovery flask (300 ml) cooled by an ice bath. The ice bath was removed and the
solution was stirred at r.t. for 4 hrs. The reaction was quenched by the addition of saturated Na2CO3
in H2O (100 ml) and extracted with hexane (100 ml). The organic phase was washed with saturated
NaCl in H2O (100 ml) and the combined water phases were extracted once more with hexane (100
ml). The combined organic extract was dried over anhydrous MgSO4 and filtered, followed by solvent
removal by rotary evaporation. Flash column chromatography over silica gel using hexane, followed
by solvent removal by rotary evaporation gave a supersaturated transparent liquid. The liquid was
cooled to -15°C to precipitate white crystals which were dried in vacuo to receive 1 (2.483 g, 7.54
mmol). Yield: 98 %. Rf (hexane): 0.55. 1H NMR (400 MHz, CDCl3) σ: 6.93 (1H, dd, J = 3.9, 1.0 Hz), 6.91
(1H, dd, J = 3.8, 1.0 Hz), 6.82 (1H, dd, J = 3.8, 1.0 Hz), 6.66 (1H, d, J = 2.9 Hz), 2.77 (2H, t, J = 7.8 Hz),
1.70-1.63 (2H, m), 1.39-1.30 (6H, m), 0.89 (3H, t, J = 6.3 Hz).
Synthesis of 5-(imidazol-1-yl)-5’-hexyl-2,2’-bithiophene (6BTIm): 1 (798 mg, 2.42 mmol), dried
imidazole (158 mg, 2.32 mmol), CuI (64 mg, 0.34 mmol), N,N-dimethylglycine (49 mg, 0.47 mmol),
and K2CO3 (628 mg, 4.54 mmol) were dissolved in DMSO (5 ml) by syringe under Ar flow and stirred
8/8/2019 Master Thesis - Jonas Sellberg
http://slidepdf.com/reader/full/master-thesis-jonas-sellberg 38/105
31
at 110°C for 44 hrs. At first, the solution turned bright blue, before it changed to a dark green color
after approximately one hour. The reaction was quenched by the addition of H2O (100 ml) and
extracted with EtOAc (100 ml). The organic phase was washed with H2O (100 ml) and the combined
water phases were extracted two times more with EtOAc (2 x 100 ml). The combined organic extract
was washed with saturated NaCl in H2O (100 ml), dried over anhydrous MgSO4, and filtered,
followed by solvent removal by rotary evaporation. Flash column chromatography over silica gel
using hexane/EtOAc (first 5:1, then increased the polarity to 2:1 and eventually 1:1) and solvent
removal by rotary evaporation was followed by recrystallization in hexane. White crystals with a
slightly brown-colored surfaces precipitated which were filtered and dried in vacuo to receive 6BTIm
(292 mg, 0.92 mmol). Yield: 41 %. Rf (EtOAc): 0.45. 1H NMR (400 MHz, CDCl3) σ: 7.76 (1H, s), 7.18 (2H,
d, J = 9.3 Hz), 6.97 (1H, d, J = 3.4 Hz), 6.94 (1H, d, J = 3.9 Hz), 6.88 (1H, d, J = 3.9 Hz), 6.70 (1H, d, J =
3.4 Hz), 2.80 (2H, t, J = 7.6 Hz), 1.72-1.65 (2H, m), 1.42-1.28 (6H, m), 0.90 (3H, t, J = 7.1 Hz). 13C NMR
(400 MHz, CDCl3) σ: 146.34 (1H, s), 136.85 (1H, s), 136.50 (1H, s), 134.51 (1H, s), 133.42 (1H, s),
130.30 (1H, s), 124.86 (1H, s), 123.89 (1H, s), 121.50 (1H, s), 120.00 (1H, s), 119.34 (1H, s), 31.52 (2H,
s), 30.14 (1H, s), 28.71 (1H, s), 22.53 (1H, s), 14.04 (1H, s). MS (MALDI-TOF): [M]+
= 316.28; [M+H]+
=317.29, 318.28, 319.27, 320.27. Calculated m/z for C17H20N2S2: 316.11 (100.0%), 317.11 (18.4%),
318.10 (9.0%), 319.11 (1.7%), 317.11 (1.6%), 318.11 (1.6%). Calculated m/z for C17H21N2S2: 317.11
(100.0%), 318.12 (18.4%), 319.11 (9.0%), 320.11 (1.7%), 318.11 (1.6%), 319.12 (1.6%). EA: C, 64.45 %;
H, 6.44 %; N, 8.89 %. Calculated weight percentage for C17H20N2S2: C, 64.52 %; H, 6.37 %; N, 8.85 %; S,
20.26 %.
Synthesis of 5-hexyl-2,2’:5’,2’’-terthiophene (2): A solution of 2-bromothiophene (1.601 g, 9.82
mmol) in THF (10 ml) was added drop wise under Ar flow to a stirred solution of Mg (0.212 g, 8.71
mmol) and I2 (0.036 g, 0.29 mmol) in THF (15 ml) inside a 3-necked round-bottom flask. The brown
solution turned clear after adding 2-bromothiophene under Ar flow, followed by the addition of NiCl2(dppp) (0.006 g, 0.01 mmol) under Ar flow to the solution. A solution of 1 (1.899 g, 5.77 mmol)
in THF (15 ml) was added by syringe under Ar flow to the 3-necked round-bottom flask, but the
solution had turned brown again 10 min prior to the addition of 1. The solution was stirred at 50°C
for 5 hrs, then at r.t. for 84 hrs. The reaction was quenched by the addition of H2O (60 ml) and
extracted three times with hexane (3 x 100 ml). The combined organic extract was dried over
anhydrous MgSO4 and filtered, followed by solvent removal by rotary evaporation. Flash column
chromatography over silica gel using hexane/EtOAc (first pure hexane, then increased the polarity to
10:1) followed by solvent removal by rotary evaporation yielded the crude product of 2 as yellow
crystals. Recrystallization in hexane was aborted due to no precipitation. Yield: 30 %. Rf (hexane):
0.45. 1H NMR (400 MHz, CDCl3) σ: 6.93 (1H, dd, J = 3.9, 1.0 Hz), 6.91 (1H, dd, J = 3.8, 1.0 Hz), 6.82 (1H,dd, J = 3.8, 1.0 Hz), 6.66 (1H, d, J = 2.9 Hz), 2.77 (2H, t, J = 7.8 Hz), 1.70-1.63 (2H, m), 1.39-1.30 (6H,
m), 0.89 (3H, t, J = 6.3 Hz).
Synthesis of 5-bromo-5’’-hexyl-2,2’:5’,2’’-terthiophene (3): A solution of NBS (0.883 g, 4.96 mmol)
in THF (50 ml) was added drop wise under Ar flow during 15 min to a stirred solution of 2 (1.533 g,
4.61 mmol) in THF (100 ml) at 0°C, inside a 3-necked round-bottom flask (500 ml) cooled by an ice
bath. The ice bath was removed and the solution was stirred at r.t. for 19 hrs. The reaction was
quenched by the addition of saturated K2CO3 in H2O (100 ml) and extracted with hexane (100 ml).
The organic phase was washed with saturated NaCl in H2O (100 ml) and the combined water phases
were extracted once more with hexane (100 ml). The combined organic extract was dried overanhydrous MgSO4 and filtered, followed by solvent removal by rotary evaporation. Flash column
8/8/2019 Master Thesis - Jonas Sellberg
http://slidepdf.com/reader/full/master-thesis-jonas-sellberg 39/105
32
chromatography over silica gel using hexane and solvent removal by rotary evaporation was
followed by recrystallization in hexane. Green-yellow crystals precipitated which were filtered and
dried in vacuo to receive 3 (1.430 g, 3.48 mmol). Yield: 75 %. Rf (hexane): 0.50. 1H NMR (400 MHz,
CDCl3) σ: 6.99-6.96 (4H, m), 6.89 (1H, d, J = 3.9 Hz), 6.68 (1H, d, J = 3.4 Hz), 2.79 (2H, t, J = 7.6 Hz),
1.71-1.64 (2H, m), 1.42-1.29 (6H, m), 0.89 (3H, t, J = 6.8 Hz).
Synthesis of 5-(imidazol-1-yl)-5’’-hexyl-2,2’:5’,2’’-terthiophene (6TTIm): 3 (1296 mg, 3.15 mmol),
dried imidazole (210 mg, 3.08 mmol), CuI (64 mg, 0.33 mmol), N,N-dimethylglycine (79 mg, 0.77
mmol), and K2CO3 (1056 mg, 7.64 mmol) were dissolved in DMSO (7 ml), which was dried in KOH
prior to usage, by syringe under Ar flow and stirred at 110°C for 44 hrs. At first, the solution turned
bright blue, before it changed to a dark brown color after approximately one hour. The reaction was
quenched by the addition of H2O (200 ml) and extracted with CHCl3 (4 x 150 ml). The combined
organic extract was washed with saturated NaCl in H2O (100 ml), dried over anhydrous MgSO4, and
filtered, followed by solvent removal by rotary evaporation. Flash column chromatography over
silica gel using CHCl3 and solvent removal by rotary evaporation was followed by repeated flash
column chromatography over silica gel using dichloromethane (DCM). The solvent was once again
removed by rotary evaporation and the crude product was recrystallized twice in EtOAc. When
yellow crystals precipitated, small amount of hexane was added to decrease the solubility. The
crystals were filtered and dried in vacuo to receive 6TTIm (429 mg, 1.08 mmol). Yield: 35 %. Rf
(EtOAc): 0.5. 1H NMR (400 MHz, CDCl3) σ: 7.77 (1H, s), 7.20 (2H, d, J = 9.8 Hz), 7.05 (1H, d, J = 3.9 Hz),
7.01-6.99 (3H, m), 6.91 (1H, d, J = 3.9 Hz), 6.70 (1H, d, J = 3.4 Hz), 2.80 (2H, t, J = 7.6 Hz), 1.72-1.65
(2H, m), 1.43-1.29 (6H, m), 0.90 (3H, t, J = 6.8 Hz).13C NMR (400 MHz, CDCl3) σ: 146.05 (1H, s),
137.67 (1H, s), 136.92 (1H, s), 136.82 (1H, s), 134.02 (1H, s), 133.99 (1H, s), 133.74 (1H, s), 130.37 (1H,
s), 124.78 (2H, d, J = 19.0 Hz), 123.58 (2H, d, J = 19.0 Hz), 122.01 (1H, s), 120.00 (1H, s), 119.39 (1H, s),
31.52 (2H, s), 30.16 (1H, s), 28.71 (1H, s), 22.54 (1H, s). MS (MALDI-TOF): [M]+
= 398.27, 399.28,400.27, 401.27, 402.27. Calculated m/z for C21H22N2S3: 398.09 (100.0%), 399.10 (22.7%), 400.09
(13.6%), 401.09 (3.1%), 400.10 (2.5%), 399.09 (2.4%). EA: C, 63.00 %; H, 5.39 %; N, 6.92 %. Calculated
weight percentage for C21H22N2S3: C, 63.28 %; H, 5.56 %; N, 7.03 %; S, 24.13 %.
Synthesis of (R)-ethyl-4-(1-methylheptyloxy)benzoate (4): DIAD (3.842 g, 19.00 mmol) dissolved in
toluene (10 ml) was added drop wise by syringe under Ar flow to a stirred solution of TPP (4.984 g,
19.00 mmol), which was recrystallized in hexane prior to usage, ethyl-4-hydroxybenzoate (2.533 g,
15.24 mmol), and (S)-(+)-2-octanol (2.6 ml, 16.34 mmol) in THF (150 ml). The solution was stirred at
r.t. for 60 hrs, followed by removal of solvent by rotary evaporation. Hexane/EtOAc (150 ml, 7:3) was
added to the organic extract and the solution was stirred for 30 min, upon which precipitation of biproducts occurred. The solution was filtered and the solvent was removed by rotary evaporation.
Flash column chromatography over silica gel using hexane/EtOAc (10:1) followed by solvent removal
by rotary evaporation gave a slightly yellow liquid. The crude product was heated by a dryer in vacuo
to crystallize slightly yellow crystals of 4 (4.194 g, 15.06 mmol). Yield: 99 %. Rf (hexane/EtOAc 8:2):
0.65. 1H NMR (400 MHz, CDCl3) σ: 7.97 (2H, d, J = 9.3 Hz), 6.88 (2H, d, J = 8.8 Hz), 4.44 (1H, q, J = 6.0
Hz), 4.34 (2H, q, J = 7.2 Hz), 1.78-1.70 (1H, m), 1.63-1.53 (1H, m), 1.37 (3H, t, J = 7.1 Hz), 1.35-1.28
(11H, m), 0.88 (3H, t, J = 6.8 Hz).
Synthesis of (R)-4-(1-methylheptyloxy)benzoic acid (8OBA*): A solution of NaOH (2.410 g, 60.25
mmol) in H2O (10 ml) was added to a stirred solution of 4 (4.122 g, 14.81 mmol) in 1,4-dioxane (70ml). EtOH (10 ml) was added to avoid phase separation. The solution was refluxed at 110°C for 5 hrs
8/8/2019 Master Thesis - Jonas Sellberg
http://slidepdf.com/reader/full/master-thesis-jonas-sellberg 40/105
33
then stirred at r.t. for 35 hrs. The solution was neutralized with 5 wt. % HCl and the solvent was
removed by rotary evaporation. Water (100 ml) was added and the solution was extracted three
times with CHCl3 (3 x 100 ml). The combined organic extract was washed twice with saturated NaCl
in H2O (2 x 100 ml) and the combined water phases were extracted once more with CHCl3 (100 ml)
The combined organic extract was dried over anhydrous MgSO4 and filtered, followed by solvent
removal by rotary evaporation. Flash column chromatography over silica gel using hexane/EtOAc
(first 10:1, then increased the polarity to 5:1 and eventually 2:1) followed by solvent removal by
rotary evaporation gave a transparent, highly viscous liquid. The product solution was heated by a
dryer in vacuo to crystallize semi-transparent crystals of 8OBA* (3.387 g, 13.53 mmol). Yield: 91 %. Rf
(hexane/EtOAc 1:1): 0.5. 1H NMR (400 MHz, CDCl3) σ: 8.04 (2H, d, J = 9.3 Hz), 6.91 (2H, d, J = 8.8 Hz),
4.46 (1H, td, J = 12.1, 6.2 Hz), 1.80-1.72 (1H, m), 1.64-1.55 (1H, m), 1.49-1.37 (2H, m), 1.33 (3H, d, J =
5.9 Hz), 1.31-1.29 (6H, m), 0.88 (3H, t, J = 6.8 Hz).13C NMR (400 MHz, CDCl3) σ: 171.71 (1H, s), 162.91
(1H, s), 132.38 (2H, s), 121.03 (1H, s), 115.07 (2H, s), 74.09 (1H, s), 36.31 (1H, s), 31.75 (1H, s), 29.21
(1H, s), 25.42 (1H, s), 22.57 (1H, s), 19.59 (1H, s), 14.06 (1H, s). CD (6·10-5 M in CHCl3): θ = +2.76 mdeg,
*θ+ = +4320°M-1
m-1
, ΔA = 8.37·10-5
, Δε = 1.31 M-1
cm-1
. EA: C, 72.14 %; H, 8.83 %; N, 0.45 %. Calculatedweight percentage for C15H22O3: C, C, 71.97 %; H, 8.86 %; O, 19.17 %.
Further purification of 4-octyloxybenzoic acid (8OBA): 8OBA (342 mg, 1.36 mmol) was recrystallized
in hexane prior to mixing with 6BTIm and 6TTIm, yielding white, needle-like crystals of 8OBA (305
mg, 1.22 mmol). Yield: 89 %.
Further purification of 8OBA*: 8OBA* (1.980 g, 7.91 mmol) was recrystallized in hexane prior to
mixing with 6BTIm and 6TTIm, yielding semi-transparent crystals of 8OBA* (0.952 g, 3.80 mmol).
Yield: 48 %.
Mixing of 6BTIm-8OBA: 6BTIm (90 mg, 0.28 mmol) was distilled at 230°C in vacuo (3 torr). The firstand second fractions were rinsed with acetone and the solvent was removed by rotary evaporation,
obtaining white crystals of 6BTIm (72 mg, 0.23 mmol). Yield: 80 %. 6BTIm (40 mg, 0.13 mmol) and
8OBA (32 mg, 0.13 mmol) were added to a large vial (100 ml) and dissolved in freshly distilled
pyridine (1 ml). The solution was evaporated in vacuo until a thin film of 6BTIm-8OBA was formed
on the bottom of the vial. To remove the last amount of residual pyridine, the mixture was dried in
vacuo at 70°C for 6 hrs.
Mixing of 6BTIm-8OBA*: 6BTIm (90 mg, 0.28 mmol) was distilled at 230°C in vacuo (3 torr). The first
and second fractions were rinsed with acetone and the solvent was removed by rotary evaporation,
obtaining white crystals of 6BTIm (71.6 mg, 0.23 mmol). Yield: 80 %. 6BTIm (31 mg, 0.10 mmol) and
8OBA* (25 mg, 0.10 mmol) were added to a large vial (100 ml) and dissolved in freshly distilled
pyridine (2 ml). The solution was evaporated in vacuo until a thin film of 6BTIm-8OBA* was formed
on the bottom of the vial. To remove the last amount of residual pyridine, the mixture was dried in
vacuo at 70°C for 6 hrs.
Mixing of 6TTIm-8OBA: 6TTIm (367 mg, 0.92 mmol) was distilled at 250°C in vacuo (3 torr). From the
first fraction, bright yellow crystals of 6TTIm (14 mg, 0.04 mmol) were scraped into a large vial (100
ml). 8OBA (9 mg, 0.04 mmol) were added to the vial and dissolved in freshly distilled pyridine (2 ml)
by heating with a dryer. The solution was evaporated in vacuo until a thin film of 6TTIm-8OBA was
8/8/2019 Master Thesis - Jonas Sellberg
http://slidepdf.com/reader/full/master-thesis-jonas-sellberg 41/105
34
formed on the bottom of the vial. To remove the last amount of residual pyridine, the mixture was
dried in vacuo at 70°C for 6 hrs.
Mixing of 6TTIm-8OBA*: 6TTIm (367 mg, 0.92 mmol) was distilled at 250°C in vacuo (3 torr). After
the mixing of 6TTIm-8OBA, the first and second fractions were rinsed with dry DCM and the solvent
was removed by rotary evaporation, obtaining yellow crystals of 6TTIm (total including the crystals
added to 6TTIm-8OBA of 37.7 mg, 0.09 mmol). Total yield: 10 %. 6TTIm (23.5 mg, 0.06 mmol) and
8OBA* (15 mg, 0.06 mmol) were added to a large vial (100 ml) and dissolved in freshly distilled
pyridine (4 ml) by heating with a dryer. The solution was evaporated in vacuo until a thin film of
6TTIm-8OBA* was formed on the bottom of the vial. To remove the last amount of residual pyridine,
the mixture was dried in vacuo at 70°C for 6 hrs.
3.2.2 Analysis
NMR:1H and 13C NMR spectra were conducted on a JEOL JNM-LA400 spectrometer. Solutions
containing 2-20 mg of sample in CDCl3 were prepared and chemical shifts (δ) of the recorded1H and
13C NMR signals were expressed in parts per million (ppm) using tetramethyl silane (δ = 0.00) and
CDCl3 (δ = 77.00) as internal standards, respectively.
Mass spectroscopy: MALDI-TOF mass spectra were collected on an Applied Biosystems Voyager-DE
STR spectrometer using 1,8,9-trihydroxyanthracene as the matrix. Trace amounts of sample was
added to CHCl3 solutions of 1,8,9-trihydroxyanthracene, which in turn were added onto the sample
holder. Several sample spots for each sample were prepared in case the sample spot would contain
impurities. Biospectrometry Workstation software was used to evaluate the recorded spectra.
Elemental analysis: Elemental analysis was performed on an Exeter Analytical Inc. CE-440 Elemental
Analyzer after weighing the samples carefully on a Perkin Elmer AD 6 Autobalance with µg precision.
IR spectroscopy: IR spectra were recorded on a JASCO FT/IR-660 Plus in KBr plates. Background
spectra of the sample holder were measured prior to usage and between 200 and 300 scans were
recorded to reduce the noise level. The recorded spectra were evaluated using JASCO Spectra
Manager v. 2.
POM: POM measurements were performed on Olympus BX-51 microscopes equipped with Mettler
FP82HT hot stages. Samples were studied between glass surfaces, polyimide coated glasses, indium
tin oxide (ITO) cells and blocking cells consisting of SiO2 coated ITO cells.
Polyimide coated glass: Polyimide coated glass was prepared by spin coating a ready-made
polyimide solution onto clean glass plates inside a laminar flow cabinet. The rotation speed was
increased gradually during 5 sec to 1200 rounds per minute (RPM), where it was kept for 60 sec
before increasing to 2000 RPM for another 10 sec. After spin coating, the coated glass plates were
dried first at 100°C for 30 min and then at 180°C for 1 hr.
ITO cells: The ITO cells were bought commercially. They consisted of sandwiched ITO coated glass
plates with electrode distances of 4 µm, 9 µm, and 15 µm. The cells were filled by heating the ITO
cell on a hot stage and injecting the samples by capillary force at an isotropic temperature. When
studying ITO cells under applied voltages, a Linkam 10013 hot stage equipped with a Linkam VTO
232 video recorder was used.
8/8/2019 Master Thesis - Jonas Sellberg
http://slidepdf.com/reader/full/master-thesis-jonas-sellberg 42/105
35
Blocking cells: SiO2 coated ITO cells were prepared by spin coating a layer of SiO2 onto ITO
electrodes and then sandwich them separated by a spacer. A solution of concentrated HCl (34 %, 0.5
g, 5 mmol) dissolved in H2O (4.4 g, 244 mmol) and EtOH (3.6 g, 78 mmol) was added drop wise to a
stirred solution of tetraethyl orthosilicate (5.0 g, 24 mmol) and poly(ethylene glycol) (0.7 g) in EtOH
(3.9 g, 85 mmol, in total: 7.5 g, 163 mmol), which was stirred at r.t. for 1 hr. The solution was spin
coated onto the fabricated ITO electrodes inside a laminar flow cabinet at a speed of 50 RPM for 30
sec, before increasing the speed to 5000 RPM for 60 sec. The SiO2 coated ITO electrodes were dried
for 24 hrs inside the laminar flow cabinet, before they were sandwiched using a two-component
glue and a 12 µm spacer. The sandwiched cells were dried for another 4 hrs inside the laminar flow
cabinet, before the distance between the electrodes was measured on a JASCO V-670 by
interference of UV/Vis light. The distance between the electrodes was calculated from the recorded
interference spectra using JASCO Spectra Manager v. 2. Finally, the electrode contacts were created
by soldering tin from the ITO electrode to the upper side of the glass cell.
DSC: DSC measurements were performed on a NETZSCH DSC204 Phoenix® with a scanning rate of 5
K/min (6BTIm and 6TTIm) and 10 K/min (6BTIm-8OBA*, 6TTIm-8OBA and 6TTIm-8OBA*), and on a
Mettler DSC 30 with a scanning rate of 5 K/min (6BTIm-8OBA). Samples of 2-6 mg were weighed and
put in a DSC sample holder. All measurements were performed under N2 atmosphere and second
heating curves were recorded to erase the thermal history of the samples. The phase transition
peaks were evaluated in Proteus Analysis (except for 6BTIm-8OBA, where included software to the
Mettler DSC 30 was used) to calculate transition temperatures and transition enthalpies. Phase
transition temperatures were taken at the onset of the phase transition peaks.
XRD: XRD measurements were carried out on a Rigaku RINT 2100 diffractometer with a heating
stage using Ni-filtered CuKα radiation. The samples were put on a glass plate with a rough surface
and heated to isotropic temperature prior to measurement. WAXS was performed at 50 kV and 250
mA between 2θ angles of 1-30° with scanning speeds of 0.5-2°/min and sampling widths of 0.010-
0.020°, unless otherwise indicated. The corresponding distances of the maximum values of each
peak were calculated using included software.
UV/Vis absorption spectroscopy: UV/Vis absorption spectra were recorded on a JASCO V-670 fitted
with a Mettler FP82HT hot stage. The solution spectra were carried out in spectrophotometric grade
CHCl3 and heptane in a quartz cuvette, absorbing light below 240 nm, and the thin film spectra were
carried out sandwiched between quartz plates, absorbing light below 190 nm. Background spectra of
the solvent in the quartz cuvette and the quartz plates were measured prior to usage, and a
scanning speed of 200 nm/min, a band width of 0.5 nm, and a data pitch of 0.5 nm for solutions and
1 nm for thin films were used unless otherwise indicated. The recorded spectra were evaluated
using JASCO Spectra Manager v. 2.
UV/Vis PL spectroscopy: UV/Vis PL spectra were recorded on a JASCO FP-6500 equipped with an
HPC-503 hot stage. The solution spectra were carried out in spectrophotometric grade CHCl3 and
heptane in a quartz cuvette, absorbing light below 240 nm, and the thin film spectra were carried
out sandwiched between quartz plates, absorbing light below 190 nm. A scanning speed of 200
nm/min and a data pitch of 0.5 nm for solutions and 0.1 nm for thin films were used unless
otherwise indicated. The excitation wavelength was chosen at the absorption maximum from the
UV/Vis absorption of each sample. The recorded spectra were evaluated using JASCO Spectra
Manager v. 2.

8/8/2019 Master Thesis - Jonas Sellberg
http://slidepdf.com/reader/full/master-thesis-jonas-sellberg 43/105
36
CD spectroscopy: CD spectra in spectrophotometric grade CHCl3 solution were recorded on a JASCO
J-820 spectropolarimeter under N2 atmosphere. The solution spectra were carried out in a quartz
cuvette, which absorbs light below 240 nm. Background spectra of the solvent in the quartz cuvette
were measured prior to usage, and automatic settings including four scans were used during the
measurement. The recorded spectra were evaluated using JASCO Spectra Manager v. 2.
CV: CV in solution was carried out using an ALS CHI 600B electrochemical analyzer and a three-
electrode electrochemical cell containing a working electrode of carbon, a counter electrode of
platinum, and a 0.01 M Ag/AgNO3 reference electrode. The supporting electrolyte was 0.10 M
tetrabutylammonium perchlorate in dry DCM. Solutions containing 1-10 mg of sample (in the order
of 1 mM) were prepared and cyclic voltammograms were recorded under Ar atmosphere at a
scanning rate of 0.1 V/s. All potentials were calibrated with the Fe+/Fe couple using ferrocene as an
internal reference.
DFT calculations: DFT calculations for all the molecular components were carried out using Spartan.
The exchange correlation functional used was Becke’s three-parameter hybrid Lee-Yang-Parrcorrelation functional (B3LYP) at the 6-31 G* (split valence orbitals with included d-orbitals) basis set
level. All molecular components were geometry optimized.
Polarization switching: Polarization switching was performed with a NF Wavefactory WF 1943A 1CH
multifunction synthesizer (1·10-8-1.5·106 Hz) connected through a NF HAS 4011 high speed bipolar
amplifier (DC-1MHz AC, 0-50 VA) to the upper electrode of the sample injected into an ITO cell. The
lower electrode was connected through a resistance to a Tektronix TDS 3044B digital oscilloscope,
synchronized with the amplifier, which monitored the current response of the sample. All
polarization switching measurements were carried out under ambient atmosphere.
TOF: TOF measurements were performed with a Minilite I FN YAG pulse laser (third harmonic
generation of Nd:YAG; λ = 355 nm, pulse width = 1 ns) from Continuum Electro-Optics Inc.,
irradiating the upper surface of the sample. The sample was injected into an ITO cell or blocking cell,
which was mounted on a hot stage controlled by a thermocontroller. The hot stage was connected
to an Advantest R8252 digital electrometer at the upper electrode and connected through a
resistance to a Tektronix TDS 3044B digital oscilloscope at the lower electrode, which was
synchronized with the pulse laser. The transient photocurrents were monitored by the digital
oscilloscope and the transit times (τT) were determined from the kink points of the transient
photocurrent curves. All TOF measurements were carried out under ambient atmosphere.
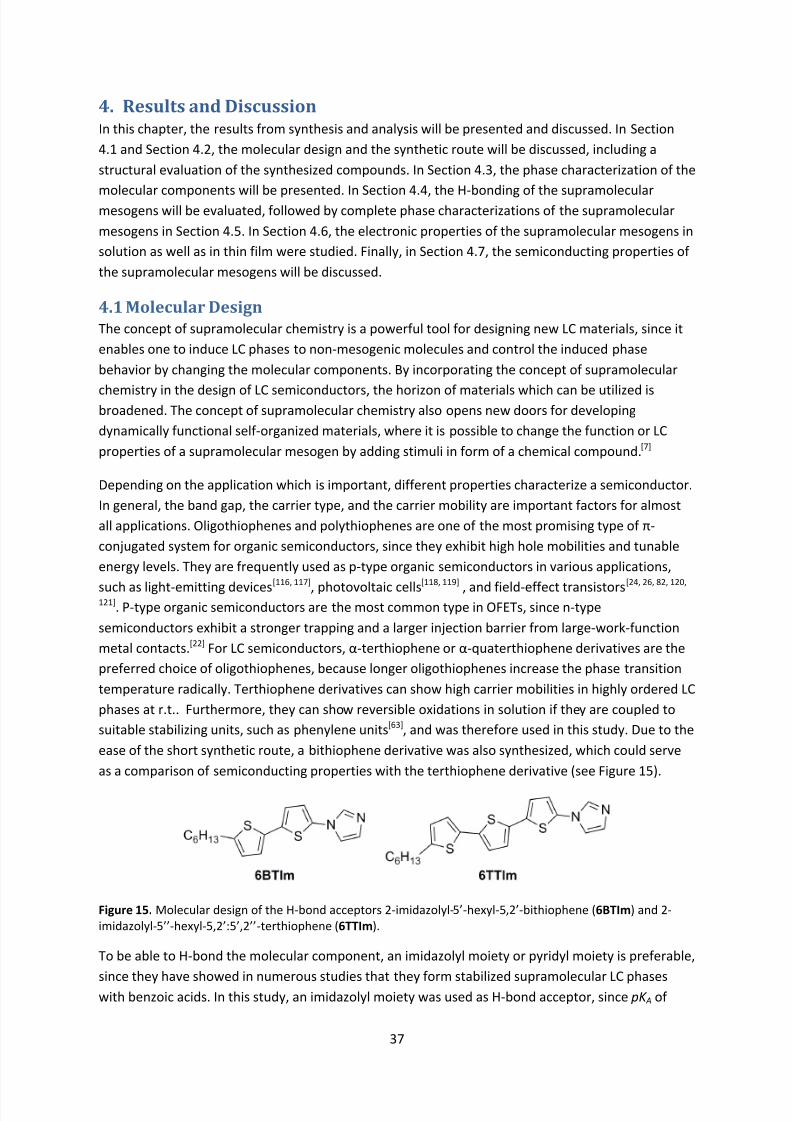
8/8/2019 Master Thesis - Jonas Sellberg
http://slidepdf.com/reader/full/master-thesis-jonas-sellberg 44/105
37
4. Results and DiscussionIn this chapter, the results from synthesis and analysis will be presented and discussed. In Section
4.1 and Section 4.2, the molecular design and the synthetic route will be discussed, including a
structural evaluation of the synthesized compounds. In Section 4.3, the phase characterization of the
molecular components will be presented. In Section 4.4, the H-bonding of the supramolecularmesogens will be evaluated, followed by complete phase characterizations of the supramolecular
mesogens in Section 4.5. In Section 4.6, the electronic properties of the supramolecular mesogens in
solution as well as in thin film were studied. Finally, in Section 4.7, the semiconducting properties of
the supramolecular mesogens will be discussed.
4.1 Molecular Design
The concept of supramolecular chemistry is a powerful tool for designing new LC materials, since it
enables one to induce LC phases to non-mesogenic molecules and control the induced phase
behavior by changing the molecular components. By incorporating the concept of supramolecular
chemistry in the design of LC semiconductors, the horizon of materials which can be utilized isbroadened. The concept of supramolecular chemistry also opens new doors for developing
dynamically functional self-organized materials, where it is possible to change the function or LC
properties of a supramolecular mesogen by adding stimuli in form of a chemical compound.[7]
Depending on the application which is important, different properties characterize a semiconductor.
In general, the band gap, the carrier type, and the carrier mobility are important factors for almost
all applications. Oligothiophenes and polythiophenes are one of the most promising type of π-
conjugated system for organic semiconductors, since they exhibit high hole mobilities and tunable
energy levels. They are frequently used as p-type organic semiconductors in various applications,
such as light-emitting devices[116, 117]
, photovoltaic cells[118, 119]
, and field-effect transistors[24, 26, 82, 120,
121]. P-type organic semiconductors are the most common type in OFETs, since n-type
semiconductors exhibit a stronger trapping and a larger injection barrier from large-work-function
metal contacts.[22] For LC semiconductors, α-terthiophene or α-quaterthiophene derivatives are the
preferred choice of oligothiophenes, because longer oligothiophenes increase the phase transition
temperature radically. Terthiophene derivatives can show high carrier mobilities in highly ordered LC
phases at r.t.. Furthermore, they can show reversible oxidations in solution if they are coupled to
suitable stabilizing units, such as phenylene units[63], and was therefore used in this study. Due to the
ease of the short synthetic route, a bithiophene derivative was also synthesized, which could serve
as a comparison of semiconducting properties with the terthiophene derivative (see Figure 15).
Figure 15. Molecular design of the H-bond acceptors 2-imidazolyl-5’-hexyl-5,2’-bithiophene (6BTIm) and 2-imidazolyl-5’’-hexyl-5,2’:5’,2’’-terthiophene (6TTIm).
To be able to H-bond the molecular component, an imidazolyl moiety or pyridyl moiety is preferable,
since they have showed in numerous studies that they form stabilized supramolecular LC phaseswith benzoic acids. In this study, an imidazolyl moiety was used as H-bond acceptor, since pK A of
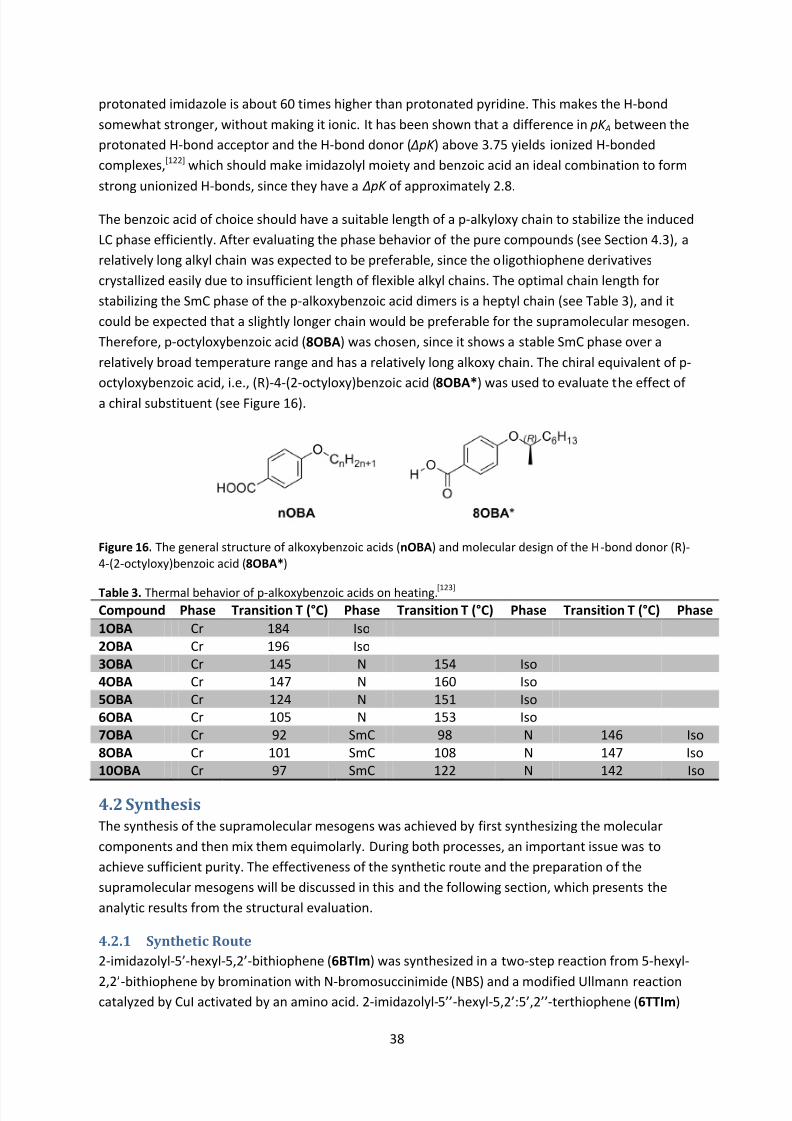
8/8/2019 Master Thesis - Jonas Sellberg
http://slidepdf.com/reader/full/master-thesis-jonas-sellberg 45/105
38
protonated imidazole is about 60 times higher than protonated pyridine. This makes the H-bond
somewhat stronger, without making it ionic. It has been shown that a difference in pK A between the
protonated H-bond acceptor and the H-bond donor ( ∆ pK ) above 3.75 yields ionized H-bonded
complexes,[122] which should make imidazolyl moiety and benzoic acid an ideal combination to form
strong unionized H-bonds, since they have a ∆ pK of approximately 2.8.
The benzoic acid of choice should have a suitable length of a p-alkyloxy chain to stabilize the induced
LC phase efficiently. After evaluating the phase behavior of the pure compounds (see Section 4.3), a
relatively long alkyl chain was expected to be preferable, since the oligothiophene derivatives
crystallized easily due to insufficient length of flexible alkyl chains. The optimal chain length for
stabilizing the SmC phase of the p-alkoxybenzoic acid dimers is a heptyl chain (see Table 3), and it
could be expected that a slightly longer chain would be preferable for the supramolecular mesogen.
Therefore, p-octyloxybenzoic acid (8OBA) was chosen, since it shows a stable SmC phase over a
relatively broad temperature range and has a relatively long alkoxy chain. The chiral equivalent of p-
octyloxybenzoic acid, i.e., (R)-4-(2-octyloxy)benzoic acid (8OBA*) was used to evaluate the effect of
a chiral substituent (see Figure 16).
Figure 16. The general structure of alkoxybenzoic acids (nOBA) and molecular design of the H-bond donor (R)-4-(2-octyloxy)benzoic acid (8OBA*)
Table 3. Thermal behavior of p-alkoxybenzoic acids on heating.[123]
Compound Phase Transition T (°C) Phase Transition T (°C) Phase Transition T (°C) Phase
1OBA Cr 184 Iso2OBA Cr 196 Iso3OBA Cr 145 N 154 Iso4OBA Cr 147 N 160 Iso5OBA Cr 124 N 151 Iso6OBA Cr 105 N 153 Iso7OBA Cr 92 SmC 98 N 146 Iso8OBA Cr 101 SmC 108 N 147 Iso10OBA Cr 97 SmC 122 N 142 Iso
4.2 Synthesis
The synthesis of the supramolecular mesogens was achieved by first synthesizing the molecular
components and then mix them equimolarly. During both processes, an important issue was to
achieve sufficient purity. The effectiveness of the synthetic route and the preparation of the
supramolecular mesogens will be discussed in this and the following section, which presents the
analytic results from the structural evaluation.
4.2.1 Synthetic Route
2-imidazolyl-5’-hexyl-5,2’-bithiophene (6BTIm) was synthesized in a two-step reaction from 5-hexyl-
2,2’-bithiophene by bromination with N-bromosuccinimide (NBS) and a modified Ullmann reactioncatalyzed by CuI activated by an amino acid. 2-imidazolyl-5’’-hexyl-5,2’:5’,2’’-terthiophene (6TTIm)
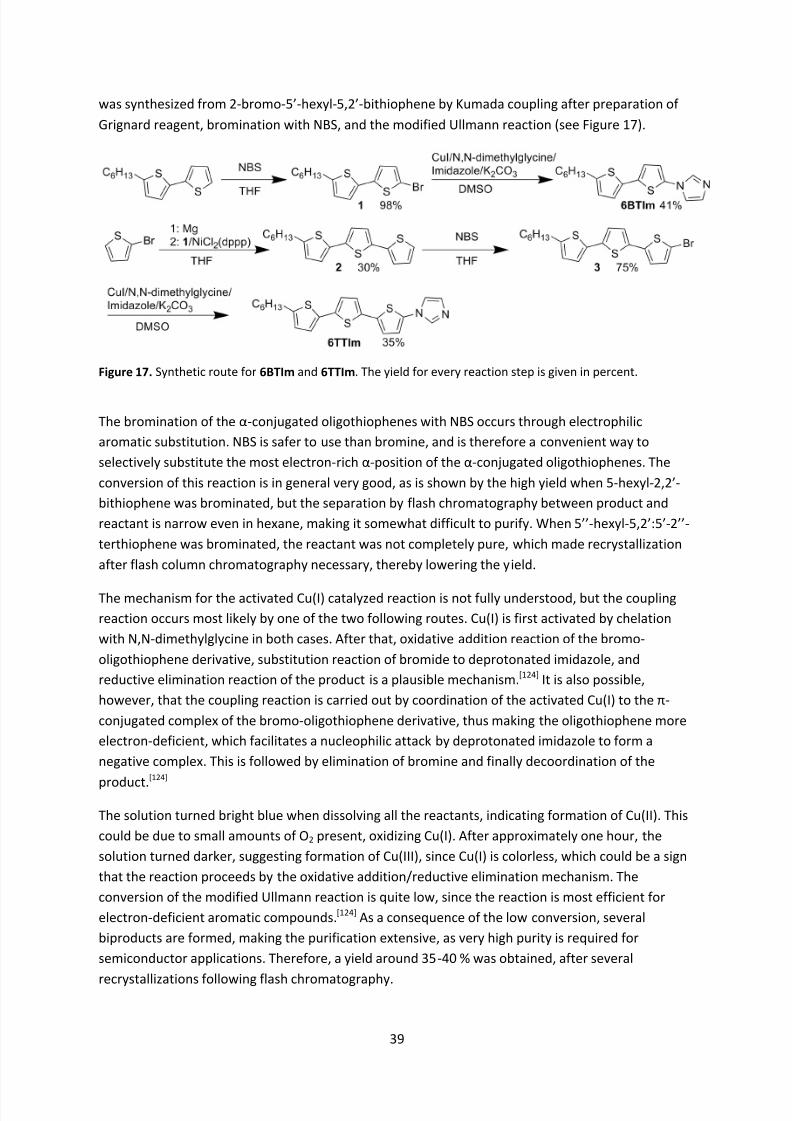
8/8/2019 Master Thesis - Jonas Sellberg
http://slidepdf.com/reader/full/master-thesis-jonas-sellberg 46/105
39
was synthesized from 2-bromo-5’-hexyl-5,2’-bithiophene by Kumada coupling after preparation of
Grignard reagent, bromination with NBS, and the modified Ullmann reaction (see Figure 17).
The bromination of the α-conjugated oligothiophenes with NBS occurs through electrophilic
aromatic substitution. NBS is safer to use than bromine, and is therefore a convenient way to
selectively substitute the most electron-rich α-position of the α-conjugated oligothiophenes. The
conversion of this reaction is in general very good, as is shown by the high yield when 5-hexyl-2,2’-
bithiophene was brominated, but the separation by flash chromatography between product and
reactant is narrow even in hexane, making it somewhat difficult to purify. When 5’’-hexyl-5,2’:5’-2’’-
terthiophene was brominated, the reactant was not completely pure, which made recrystallization
after flash column chromatography necessary, thereby lowering the yield.
The mechanism for the activated Cu(I) catalyzed reaction is not fully understood, but the coupling
reaction occurs most likely by one of the two following routes. Cu(I) is first activated by chelation
with N,N-dimethylglycine in both cases. After that, oxidative addition reaction of the bromo-
oligothiophene derivative, substitution reaction of bromide to deprotonated imidazole, and
reductive elimination reaction of the product is a plausible mechanism.[124] It is also possible,
however, that the coupling reaction is carried out by coordination of the activated Cu(I) to the π-
conjugated complex of the bromo-oligothiophene derivative, thus making the oligothiophene more
electron-deficient, which facilitates a nucleophilic attack by deprotonated imidazole to form a
negative complex. This is followed by elimination of bromine and finally decoordination of the
product.[124]
The solution turned bright blue when dissolving all the reactants, indicating formation of Cu(II). This
could be due to small amounts of O2 present, oxidizing Cu(I). After approximately one hour, the
solution turned darker, suggesting formation of Cu(III), since Cu(I) is colorless, which could be a sign
that the reaction proceeds by the oxidative addition/reductive elimination mechanism. The
conversion of the modified Ullmann reaction is quite low, since the reaction is most efficient for
electron-deficient aromatic compounds.[124] As a consequence of the low conversion, several
biproducts are formed, making the purification extensive, as very high purity is required for
semiconductor applications. Therefore, a yield around 35-40 % was obtained, after several
recrystallizations following flash chromatography.
Figure 17. Synthetic route for 6BTIm and 6TTIm. The yield for every reaction step is given in percent.
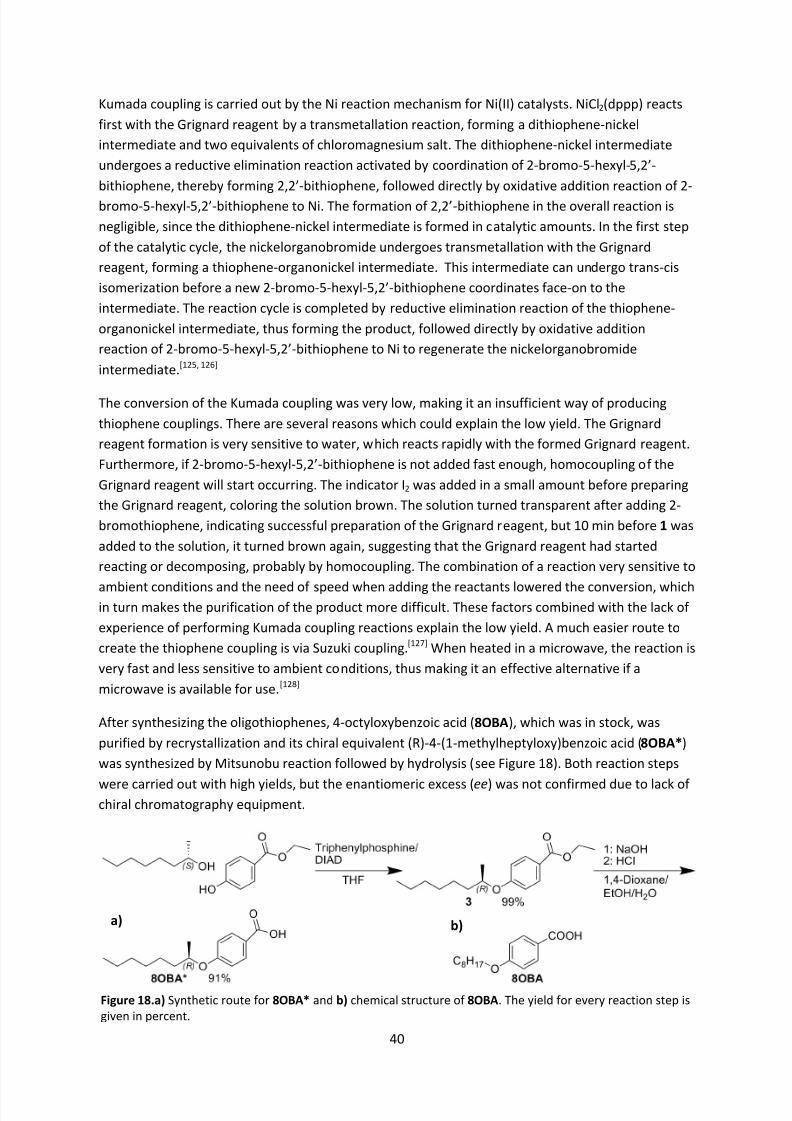
8/8/2019 Master Thesis - Jonas Sellberg
http://slidepdf.com/reader/full/master-thesis-jonas-sellberg 47/105
40
Kumada coupling is carried out by the Ni reaction mechanism for Ni(II) catalysts. NiCl2(dppp) reacts
first with the Grignard reagent by a transmetallation reaction, forming a dithiophene-nickel
intermediate and two equivalents of chloromagnesium salt. The dithiophene-nickel intermediate
undergoes a reductive elimination reaction activated by coordination of 2-bromo-5-hexyl-5,2’-
bithiophene, thereby forming 2,2’-bithiophene, followed directly by oxidative addition reaction of 2-
bromo-5-hexyl-5,2’-bithiophene to Ni. The formation of 2,2’-bithiophene in the overall reaction is
negligible, since the dithiophene-nickel intermediate is formed in catalytic amounts. In the first step
of the catalytic cycle, the nickelorganobromide undergoes transmetallation with the Grignard
reagent, forming a thiophene-organonickel intermediate. This intermediate can undergo trans-cis
isomerization before a new 2-bromo-5-hexyl-5,2’-bithiophene coordinates face-on to the
intermediate. The reaction cycle is completed by reductive elimination reaction of the thiophene-
organonickel intermediate, thus forming the product, followed directly by oxidative addition
reaction of 2-bromo-5-hexyl-5,2’-bithiophene to Ni to regenerate the nickelorganobromide
intermediate.[125, 126]
The conversion of the Kumada coupling was very low, making it an insufficient way of producing
thiophene couplings. There are several reasons which could explain the low yield. The Grignard
reagent formation is very sensitive to water, which reacts rapidly with the formed Grignard reagent.
Furthermore, if 2-bromo-5-hexyl-5,2’-bithiophene is not added fast enough, homocoupling of the
Grignard reagent will start occurring. The indicator I2 was added in a small amount before preparing
the Grignard reagent, coloring the solution brown. The solution turned transparent after adding 2-
bromothiophene, indicating successful preparation of the Grignard reagent, but 10 min before 1 was
added to the solution, it turned brown again, suggesting that the Grignard reagent had started
reacting or decomposing, probably by homocoupling. The combination of a reaction very sensitive to
ambient conditions and the need of speed when adding the reactants lowered the conversion, whichin turn makes the purification of the product more difficult. These factors combined with the lack of
experience of performing Kumada coupling reactions explain the low yield. A much easier route to
create the thiophene coupling is via Suzuki coupling.[127] When heated in a microwave, the reaction is
very fast and less sensitive to ambient conditions, thus making it an effective alternative if a
microwave is available for use.[128]
After synthesizing the oligothiophenes, 4-octyloxybenzoic acid (8OBA), which was in stock, was
purified by recrystallization and its chiral equivalent (R)-4-(1-methylheptyloxy)benzoic acid (8OBA*)
was synthesized by Mitsunobu reaction followed by hydrolysis (see Figure 18). Both reaction steps
were carried out with high yields, but the enantiomeric excess (ee) was not confirmed due to lack of chiral chromatography equipment.
Figure 18.a) Synthetic route for 8OBA* and b) chemical structure of 8OBA. The yield for every reaction step isgiven in percent.
a) b)
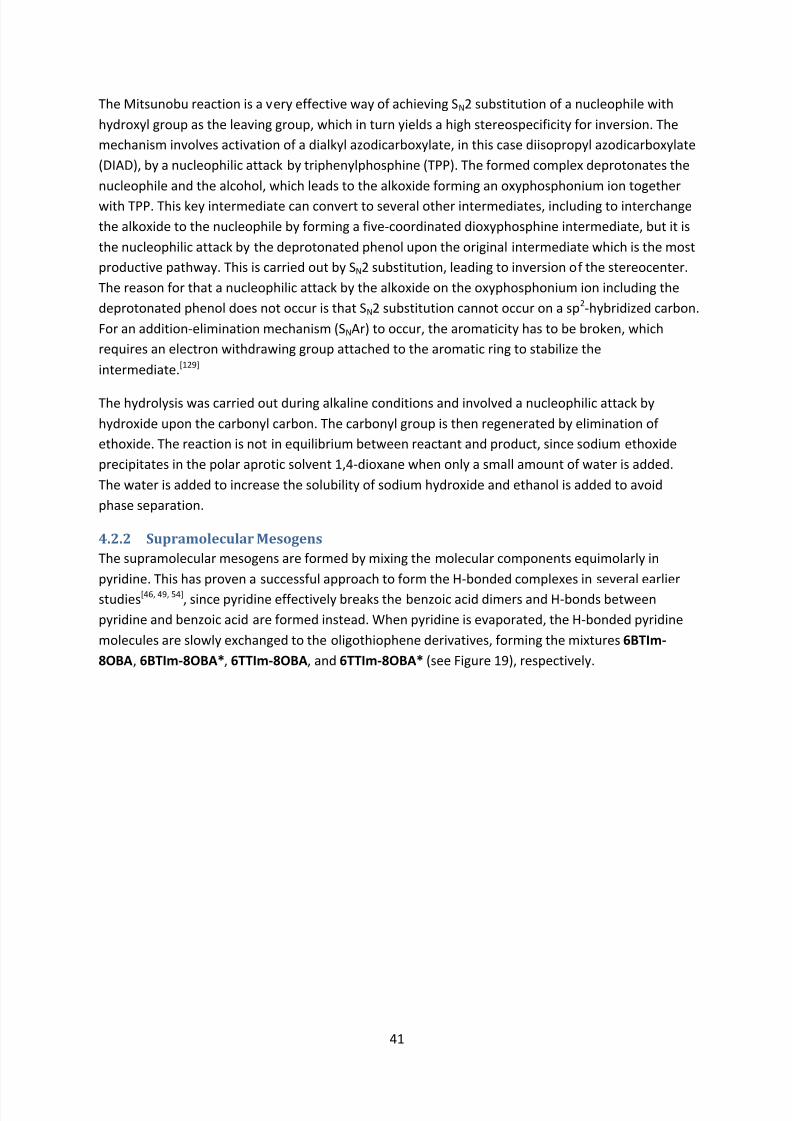
8/8/2019 Master Thesis - Jonas Sellberg
http://slidepdf.com/reader/full/master-thesis-jonas-sellberg 48/105
41
The Mitsunobu reaction is a very effective way of achieving SN2 substitution of a nucleophile with
hydroxyl group as the leaving group, which in turn yields a high stereospecificity for inversion. The
mechanism involves activation of a dialkyl azodicarboxylate, in this case diisopropyl azodicarboxylate
(DIAD), by a nucleophilic attack by triphenylphosphine (TPP). The formed complex deprotonates the
nucleophile and the alcohol, which leads to the alkoxide forming an oxyphosphonium ion together
with TPP. This key intermediate can convert to several other intermediates, including to interchange
the alkoxide to the nucleophile by forming a five-coordinated dioxyphosphine intermediate, but it is
the nucleophilic attack by the deprotonated phenol upon the original intermediate which is the most
productive pathway. This is carried out by SN2 substitution, leading to inversion of the stereocenter.
The reason for that a nucleophilic attack by the alkoxide on the oxyphosphonium ion including the
deprotonated phenol does not occur is that SN2 substitution cannot occur on a sp2-hybridized carbon.
For an addition-elimination mechanism (SNAr) to occur, the aromaticity has to be broken, which
requires an electron withdrawing group attached to the aromatic ring to stabilize the
intermediate.[129]
The hydrolysis was carried out during alkaline conditions and involved a nucleophilic attack by
hydroxide upon the carbonyl carbon. The carbonyl group is then regenerated by elimination of
ethoxide. The reaction is not in equilibrium between reactant and product, since sodium ethoxide
precipitates in the polar aprotic solvent 1,4-dioxane when only a small amount of water is added.
The water is added to increase the solubility of sodium hydroxide and ethanol is added to avoid
phase separation.
4.2.2 Supramolecular Mesogens
The supramolecular mesogens are formed by mixing the molecular components equimolarly in
pyridine. This has proven a successful approach to form the H-bonded complexes in several earlier
studies[46, 49, 54], since pyridine effectively breaks the benzoic acid dimers and H-bonds between
pyridine and benzoic acid are formed instead. When pyridine is evaporated, the H-bonded pyridine
molecules are slowly exchanged to the oligothiophene derivatives, forming the mixtures 6BTIm-
8OBA, 6BTIm-8OBA*, 6TTIm-8OBA, and 6TTIm-8OBA* (see Figure 19), respectively.
8/8/2019 Master Thesis - Jonas Sellberg
http://slidepdf.com/reader/full/master-thesis-jonas-sellberg 49/105
42
Figure 19. Complexation of a) 6BTIm-8OBA, b) 6BTIm-8OBA*, c) 6TTIm-8OBA, and d) 6TTIm-8OBA*.
First of all, however, the oligothiophene derivatives were purified once more to minimize the
presence of impurities. It has been shown that impurities on ppm level in organic semiconductors
strongly affect the properties of the semiconductors, such as their carrier mobility.[130] In general, it
has been found that organic semiconductors are most effectively purified from impurities by
purification techniques utilizing phase transitions, such as recrystallization, distillation, or
sublimation. Recrystallization had already been carried out for all the molecular components, and to
increase the purity of the oligothiophenes further, distillation was, therefore, carried out at high
temperatures in vacuo. The actual pressure was measured by a manometer, showing pressures
around 3 torr. After the distillation, the compounds were directly mixed with their respective
benzoic acid in pyridine. The pyridine was evaporated in vacuo at r.t. until a film was formed. Finally,
the mixtures were dried in vacuo at 80°C for 6 hrs to remove the last amount of residual pyridine.
Optimally, the pyridine should be evaporated slowly at ambient pressure to ensure a homogeneous
mixture of the two components. However, due to the poor stability of 6BTIm and 6TTIm in air and
sun light, the evaporation process was carried out under vacuum in a vacuum oven covered by
aluminum foil. Since small amounts of the compounds were synthesized and a very high purity was
required, mixtures around 20-50 mg were prepared. To reduce the uncertainty in the weighing of the compounds, the mixtures should preferably be prepared on a 100 mg scale. Both 6BTIm and
6TTIm were resynthesized at the end of the project, which renders it possible to create new
mixtures at a larger scale, if interest in the results would be strengthened by this first study of the
new cores.
4.2.3 Structural Evaluation
The purity and the primary structure of the molecular components were determined by 1H and 13C
NMR spectroscopy, MALDI-TOF MS, elemental analysis, and CD (see Appendix for spectra). After
regular purification methods, all end products were pure in 1H and 13C NMR spectroscopy, except for
peaks from TMS and CDCl3. In the case of 6TTIm, a residual peak of water was also seen in the1
HNMR spectrum despite drying the sample prior to analysis. This is probably due to the high humidity
8/8/2019 Master Thesis - Jonas Sellberg
http://slidepdf.com/reader/full/master-thesis-jonas-sellberg 50/105
43
and strong interactions between the imidazolyl moiety and H-bond donors. However, in the
presence of a benzoic acid, which is a stronger H-bond donor than water, the residual water should
be effectively evaporated in vacuum and the high humidity should therefore not affect the
preparation of the supramolecular mesogens.
6BTIm and 6TTIm were also characterized by MALDI-TOF MS, in which the predicted weight of theionized cations ([M]+) could be observed as well as the protonated cations ([M+H]+). In addition to
these species, a high molecular weight complex between the matrix 1,8,9-trihydroxyanthracene and
the compounds could be observed, once again indicating strong H-bond characteristics of 6BTIm and
6TTIm in presence of H-bond donors.
Although 1H and 13C NMR spectroscopy and MALDI-TOF MS showed that the synthesis of 6BTIm,
6TTIm, and 8OBA* had been successful, elemental analysis revealed various results of the purity.
6BTIm had a high level of purity with less than 0.1 % error from the calculated values. 6TTIm had
lower purity with less than 0.3 % error from the calculated values, which might be due to the lower
stability of 6TTIm or the high affinity for water absorption seen in 1H NMR. The nitrogen-free 8OBA* had a large error of 0.45 % N, which might have been caused by several reasons. Prior to weighing
the sample, an unknown solvent was used by mistake to rinse the spetula used for weighing the
sample. This solvent might have been acetonitrile or dimethylformamide (DMF), which contains N,
thereby explaining the large amount of residual N. It could also be a sign that biproducts from the
Mitsunobu reaction (derivatives from TPP or DIAD) are still present in the product due to insufficient
purification. Therefore, 8OBA* was recrystallized once more to minimize the level of impurities.
After distillation, the structure of 6BTIm and 6TTIm was confirmed by 1H NMR spectroscopy to
check that no decomposition had occurred. In both cases, the distilled product had a brighter color;
6BTIm turning almost white from being clearly brown colored on the surface, and 6TTIm turningbright yellow from being darker shade of yellow prior to distillation. This is probably due to the
reduction of impurities, which change the color of the samples by forming complexes with them.
One example of this is reversible oxidation, where oxygen binds to aromatic molecules, thus
resulting in a dark brown color. Both compounds showed clean 1H NMR spectra, except for solvent
peaks due to insufficient drying. Amazingly, the fractions left in the round bottom flasks were also
pure in 1H NMR, although the color of both samples had darkened. This indicates that 6BTIm and
6TTIm are thermally stable, a key property to achieve high purity in the supramolecular mesogens. It
also shows that NMR spectroscopy, MALDI-TOF MS, and even elemental analysis cannot detect the
low amount of purities which cause these color changes. These analytical methods are, therefore,
insufficient to confirm the purity required for organic semiconductors, which leaves their
performance in semiconducting applications as the ultimate test. Additionally, their stability can be
investigated under high electric fields, since impurities will render charge injection from the
electrodes possible and create large background currents.
The chirality of 8OBA* was characterized by CD spectroscopy. 8OBA* showed a maximum in
ellipticity θ = 2.76 mdeg in a 6·10-5 M CHCl3 solution at 254 nm, which corresponds to a molar
ellipticity *θ+ = +43.2°M-1cm-1 and a molar CD Δε = 1.31 M-1cm-1. This shows that the solution is chiral,
but to evaluate the degree of stereospecificity of the synthetic route, ee is necessary. The ee can be
estimated from the optical activity in CD or ORD if it is related to a reference compound, but it has
been difficult to find a suitable reference. A benzenetrisamide derivative with three stereocenters in
the same position as in 8OBA*(with respect to the three chromophores) showed a maximum in
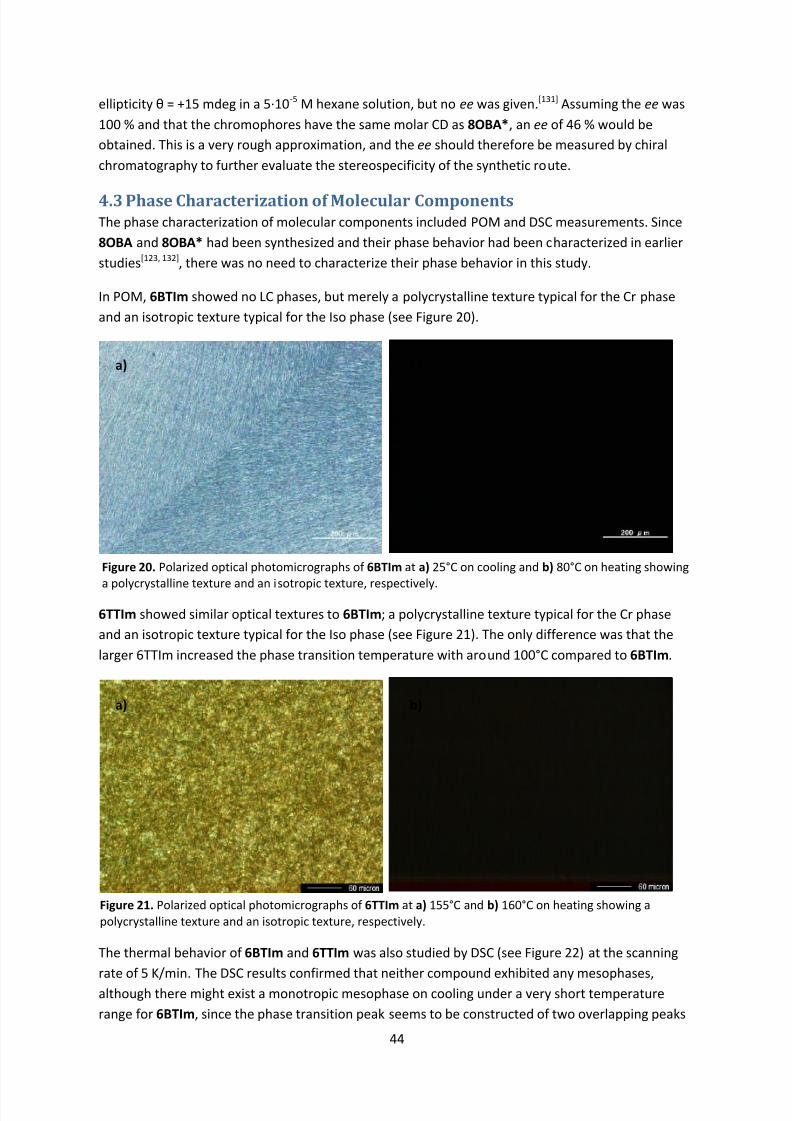
8/8/2019 Master Thesis - Jonas Sellberg
http://slidepdf.com/reader/full/master-thesis-jonas-sellberg 51/105
44
ellipticity θ = 15 mdeg in a 5·10-5 M hexane solution, but no ee was given.[131] Assuming the ee was
100 % and that the chromophores have the same molar CD as 8OBA*, an ee of 46 % would be
obtained. This is a very rough approximation, and the ee should therefore be measured by chiral
chromatography to further evaluate the stereospecificity of the synthetic route.
4.3 Phase Characterization of Molecular ComponentsThe phase characterization of molecular components included POM and DSC measurements. Since
8OBA and 8OBA* had been synthesized and their phase behavior had been characterized in earlier
studies[123, 132], there was no need to characterize their phase behavior in this study.
In POM, 6BTIm showed no LC phases, but merely a polycrystalline texture typical for the Cr phase
and an isotropic texture typical for the Iso phase (see Figure 20).
6TTIm showed similar optical textures to 6BTIm; a polycrystalline texture typical for the Cr phase
and an isotropic texture typical for the Iso phase (see Figure 21). The only difference was that the
larger 6TTIm increased the phase transition temperature with around 100°C compared to 6BTIm.
The thermal behavior of 6BTIm and 6TTIm was also studied by DSC (see Figure 22) at the scanning
rate of 5 K/min. The DSC results confirmed that neither compound exhibited any mesophases,
although there might exist a monotropic mesophase on cooling under a very short temperature
range for 6BTIm, since the phase transition peak seems to be constructed of two overlapping peaks
Figure 20. Polarized optical photomicrographs of 6BTIm at a) 25°C on cooling and b) 80°C on heating showing
a polycrystalline texture and an isotropic texture, respectively.
Figure 21. Polarized optical photomicrographs of 6TTIm at a) 155°C and b) 160°C on heating showing apolycrystalline texture and an isotropic texture, respectively.
a) b)
a) b)

8/8/2019 Master Thesis - Jonas Sellberg
http://slidepdf.com/reader/full/master-thesis-jonas-sellberg 52/105
45
with peak values separated by 0.9°C. The hypothetical mesophase could not be confirmed in POM,
however, and both compounds are therefore considered to be non-mesogenic. The endothermic
latent heats of melting were 143 J/g and 65 J/g and the exothermic latent heats of crystallization
were 113 J/g and 63 J/g for 6BTIm and 6TTIm, respectively, which implies that a recrystallization
occurred on heating for 6BTIm, lowering the enthalpy of the crystalline phase (Cr’) even further.
6TTIm showed an increase in heat capacity below 100°C, and especially below 50°C, suggesting that
6TTIm turns into a more glassy state at low temperatures.
The thermal behavior of the molecular components is summarized in Table 4. None exhibited any LC
phases, except for 8OBA showing a SmC phase over a narrow temperature range and an N phase
over a broader temperature range. The core made up by an imidazolyl moiety directly coupled to a
bithiophene or terthiophene unit needs longer flexible chains than a hexyl chain to form
mesophases, as 6TTIm is definitely non-mesogenic and 6BTIm might show a monotropic mesophase
on cooling under a temperature range of less than 1°C. This is probably due to the strong
electrostatic interactions between imidazolyl moieties, stacking the molecules antiparallel,
combined with π-π-stacking of the aromatic cores, which oligothiophenes often display. To
characterize the packing of the cores further, single-crystal XRD could be performed to solve the unit
cell of the Cr phases. This might serve as guidance when characterizing the structure of the LC
phases formed by the supramolecular mesogens.
Table 4. Thermal behavior of molecular components on heating. The transition temperatures of 8OBA and 8OBA* were taken from literature.[123, 132] The transition temperatures of 6BTIm and 6TTIm were taken at the onset of thephase transition peaks.
Compound Phase Transition T (°C) Phase Transition T (°C) Phase Transition T (°C) Phase
6BTIm Cr 63 Iso6TTIm Cr 158 Iso8OBA Cr 101 SmC 108 N 147 Iso8OBA* Cr 66 Iso
4.4 Supramolecular CharacterizationFTIR spectroscopy was carried out at r.t. after complexation to check if H-bonding was successful.
The spectra of the supramolecular mesogens were compared with the FTIR spectra of the molecular
Figure 22. DSC thermograms of a) 6BTIm and b) 6TTIm at a scanning rate of 5 K/min. The phase transitiontemperatures were taken at the onset of the phase transition peaks.
a) b)
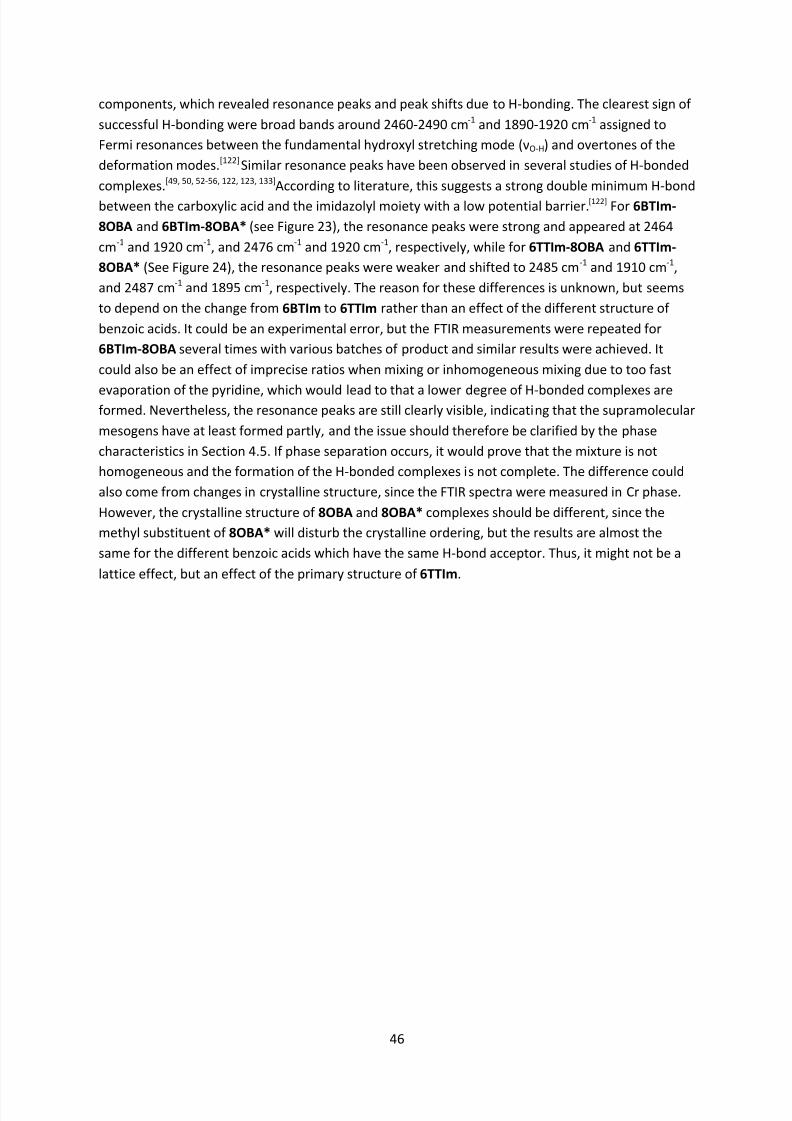
8/8/2019 Master Thesis - Jonas Sellberg
http://slidepdf.com/reader/full/master-thesis-jonas-sellberg 53/105
46
components, which revealed resonance peaks and peak shifts due to H-bonding. The clearest sign of
successful H-bonding were broad bands around 2460-2490 cm-1 and 1890-1920 cm-1 assigned to
Fermi resonances between the fundamental hydroxyl stretching mode (νO-H) and overtones of the
deformation modes.[122] Similar resonance peaks have been observed in several studies of H-bonded
complexes.[49, 50, 52-56, 122, 123, 133]According to literature, this suggests a strong double minimum H-bond
between the carboxylic acid and the imidazolyl moiety with a low potential barrier.[122] For 6BTIm-
8OBA and 6BTIm-8OBA* (see Figure 23), the resonance peaks were strong and appeared at 2464
cm-1 and 1920 cm-1, and 2476 cm-1 and 1920 cm-1, respectively, while for 6TTIm-8OBA and 6TTIm-
8OBA* (See Figure 24), the resonance peaks were weaker and shifted to 2485 cm-1 and 1910 cm-1,
and 2487 cm-1 and 1895 cm-1, respectively. The reason for these differences is unknown, but seems
to depend on the change from 6BTIm to 6TTIm rather than an effect of the different structure of
benzoic acids. It could be an experimental error, but the FTIR measurements were repeated for
6BTIm-8OBA several times with various batches of product and similar results were achieved. It
could also be an effect of imprecise ratios when mixing or inhomogeneous mixing due to too fast
evaporation of the pyridine, which would lead to that a lower degree of H-bonded complexes areformed. Nevertheless, the resonance peaks are still clearly visible, indicating that the supramolecular
mesogens have at least formed partly, and the issue should therefore be clarified by the phase
characteristics in Section 4.5. If phase separation occurs, it would prove that the mixture is not
homogeneous and the formation of the H-bonded complexes is not complete. The difference could
also come from changes in crystalline structure, since the FTIR spectra were measured in Cr phase.
However, the crystalline structure of 8OBA and 8OBA* complexes should be different, since the
methyl substituent of 8OBA* will disturb the crystalline ordering, but the results are almost the
same for the different benzoic acids which have the same H-bond acceptor. Thus, it might not be a
lattice effect, but an effect of the primary structure of 6TTIm.
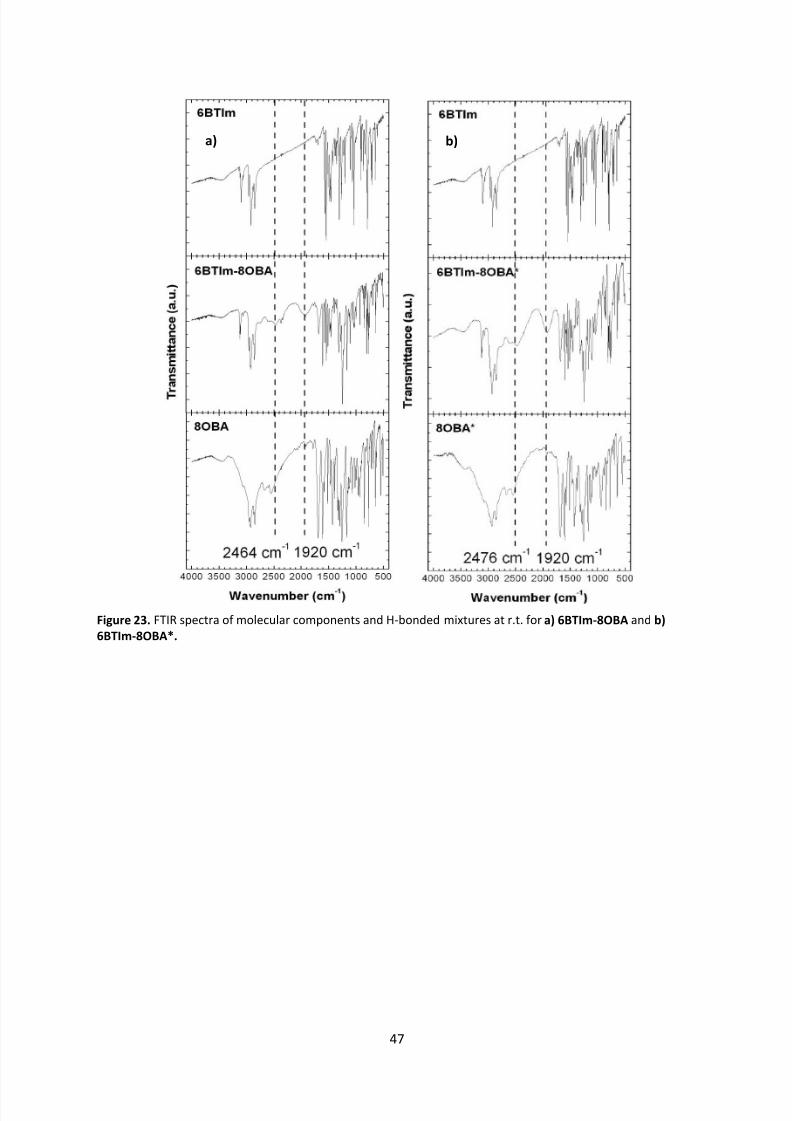
8/8/2019 Master Thesis - Jonas Sellberg
http://slidepdf.com/reader/full/master-thesis-jonas-sellberg 54/105
47
Figure 23. FTIR spectra of molecular components and H-bonded mixtures at r.t. for a) 6BTIm-8OBA and b)
6BTIm-8OBA*.
a) b)
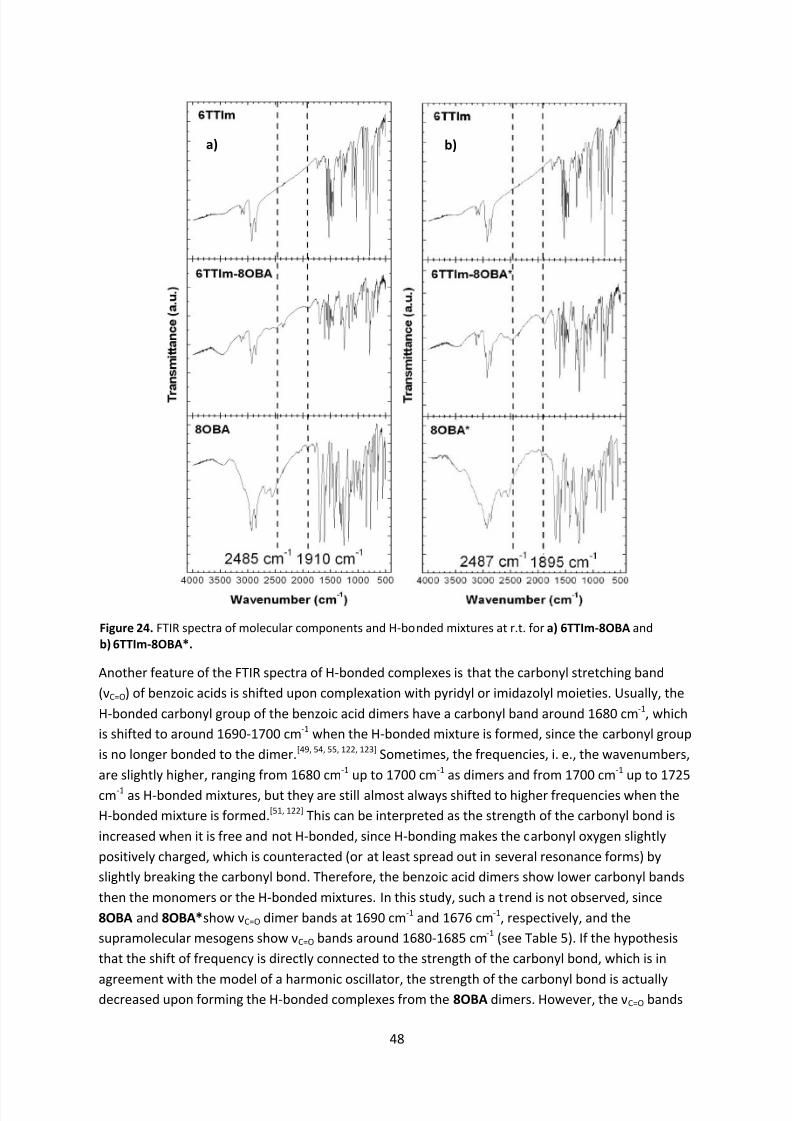
8/8/2019 Master Thesis - Jonas Sellberg
http://slidepdf.com/reader/full/master-thesis-jonas-sellberg 55/105
48
Another feature of the FTIR spectra of H-bonded complexes is that the carbonyl stretching band
(νC=O) of benzoic acids is shifted upon complexation with pyridyl or imidazolyl moieties. Usually, the
H-bonded carbonyl group of the benzoic acid dimers have a carbonyl band around 1680 cm-1, which
is shifted to around 1690-1700 cm-1 when the H-bonded mixture is formed, since the carbonyl group
is no longer bonded to the dimer.[49, 54, 55, 122, 123] Sometimes, the frequencies, i. e., the wavenumbers,
are slightly higher, ranging from 1680 cm-1 up to 1700 cm-1 as dimers and from 1700 cm-1 up to 1725
cm-1 as H-bonded mixtures, but they are still almost always shifted to higher frequencies when the
H-bonded mixture is formed.[51, 122] This can be interpreted as the strength of the carbonyl bond is
increased when it is free and not H-bonded, since H-bonding makes the carbonyl oxygen slightly
positively charged, which is counteracted (or at least spread out in several resonance forms) by
slightly breaking the carbonyl bond. Therefore, the benzoic acid dimers show lower carbonyl bands
then the monomers or the H-bonded mixtures. In this study, such a trend is not observed, since
8OBA and 8OBA*show νC=O dimer bands at 1690 cm-1 and 1676 cm-1, respectively, and the
supramolecular mesogens show νC=O bands around 1680-1685 cm-1 (see Table 5). If the hypothesis
that the shift of frequency is directly connected to the strength of the carbonyl bond, which is in
agreement with the model of a harmonic oscillator, the strength of the carbonyl bond is actuallydecreased upon forming the H-bonded complexes from the 8OBA dimers. However, the νC=O bands
Figure 24. FTIR spectra of molecular components and H-bonded mixtures at r.t. for a) 6TTIm-8OBA andb) 6TTIm-8OBA*.
a) b)

8/8/2019 Master Thesis - Jonas Sellberg
http://slidepdf.com/reader/full/master-thesis-jonas-sellberg 56/105
49
for the supramolecular mesogens have almost exactly the same frequencies although the νC=O bands
for the benzoic acid dimers differ with 14 cm-1, indicating that a new H-bonded complex indeed has
been formed.
Table 5. Peak positions of selected peaks from the FTIR spectra of 6BTIm-8OBA, 6BTIm-8OBA*, 6TTIm-8OBA,
6TTIm-8OBA*, 8OBA, and 8OBA*.6BTIm-8OBA 6BTIm-8OBA* 6TTIm-8OBA 6TTIm-8OBA* 8OBA 8OBA*
νO-H 2464 cm-1 2476 cm-1 2485 cm-1 2487 cm-1 2670 cm-1 2664 cm-1 1920 cm-1 1920 cm-1 1910 cm-1 1895 cm-1 2560 cm-1 2547 cm-1
νC=O 1680 cm-1 1682 cm-1 1685 cm-1 1685 cm-1 1690 cm-1 1676 cm-1
A key factor for the formation of supramolecular mesogens is the stability of the H-bonds. In
temperature dependent FTIR studies, the stability of the H-bond has been investigated in various
mesophases as well as in the isotropic phase. The carbonyl stretching band of the benzoic acid
dimers occurs as already mentioned around 1680-1700 cm-1 in the Cr phase, but when the
temperature is increased and reaches the Cr-N transition temperature, a carbonyl band around
1730-1740 cm-1 starts occurring, attributable to the non-H-bonded benzoic acid monomer.[54, 134] The
amount of benzoic acid existing as the monomer increases from 1.4 % to 6.2 % in the N phase, when
it increases to around 10 % at the N-Iso transition and shows a steady increase with temperature
thereafter. [134] In the H-bonded complexes with pyridyl and imidazolyl moieties, however, the
breaking of H-bonds is reduced in the mesophases. Carbonyl bands around 1685-1705 cm-1 are
present in the mesophases and the ratio of the high frequency part (1700-1705 cm-1) of the
deconvoluted band increases upon increasing the temperature, but the carbonyl band around 1720-
1730 cm-1 attributable to monomeric benzoic acid is negligible until the isotropization temperature
(Ti) is reached.
[50, 54, 123]
For an H-bonded polymeric complex between pyridyl moieties and carboxylgroups connected to alkyl linkers, the amount of monomeric carboxylic acid estimated by peak
deconvolution was 2 % in the glassy (G) phase, but increased to 18 % in the Sm phase and 31 % in
the Iso phase.[133] However, for that H-bonded polymeric complex, the H-bond was not situated
inside the mesogen, but at a distance, connected to the mesogen by a linker. By comparing the
different systems, the fact that the H-bond forms a supramolecular mesogen, seems to actually
further stabilize the H-bond. In general, it is therefore concluded that H-bonds between imidazolyl or
pyridyl moieties with benzoic acids seem to be stable in various mesophases. Although the
intermolecular H-bond is a dynamic interaction between molecules, the formation of the H-bonded
complexes is basically unity in LC phases where order is contained to some extent, but break up
partly when the disordered Iso phase is formed. This indicates that the H-bonds in the complexes arestronger than the H-bonds in the dimers, since the formation of one H-bond is enough to stabilize
the supramolecular mesogen, but dimers formed by two H-bonds still break up partly into
monomers. Therefore, temperature dependent FTIR has not been performed, since time was limited
and focus was to investigate the characteristics of the supramolecular mesogens as organic
semiconductors, not as H-bonded complexes.

8/8/2019 Master Thesis - Jonas Sellberg
http://slidepdf.com/reader/full/master-thesis-jonas-sellberg 57/105
50
4.5 Phase Characterization of Supramolecular Mesogens
In this section, the structure of the self-assembled LC phases will be investigated. To characterize LC
phases, three methods are widely used: POM, DSC, and XRD. The three techniques complement
each other, thereby rendering it possible to determine LC phases effectively. Depending on the
length scale of the LC structures, WAXS or SAXS are used as standard XRD techniques. The results
will be presented and discussed in the following order: POM, DSC, and WAXS.
4.5.1 Polarized Optical Microscopy
In POM, 6BTIm-8OBA and 6BTIm-8OBA* exhibited fluid Sm phases that were pseudo-isotropic when
aligned homeotropically between glass surfaces (see Figure 25). The mixtures showed fan-shaped
textures inside 9 µm ITO cells (see Figure 26), which is a typical optical behavior of SmA. The fans
appear dark where the director is pointed in either the polarizer direction or analyzer direction, and
the dark areas shift as the sample is rotated. Upon annealing the isotropic melt of 6BTIm-8OBA and
cooling it with a rate of 0.1 K/min, large domains of several hundreds of µm were formed (see Figure
26.a). The samples showed no signs of phase separation inside the ITO cells, indicating that the
formation of supramolecular mesogens indeed was successful, as suspected from the IR spectra.
Figure 25. Polarized optical photomicrographs of a) 6BTIm-8OBA at 70°C on cooling and b) 6BTIm-8OBA* atr.t. on cooling showing pseudo-isotropic textures between glass surfaces. The inset of b) shows the LC sampleviewed in a Bertrand lens. The observed cross is typical for homeotropically aligned orthogonal mesophases.
a) b)
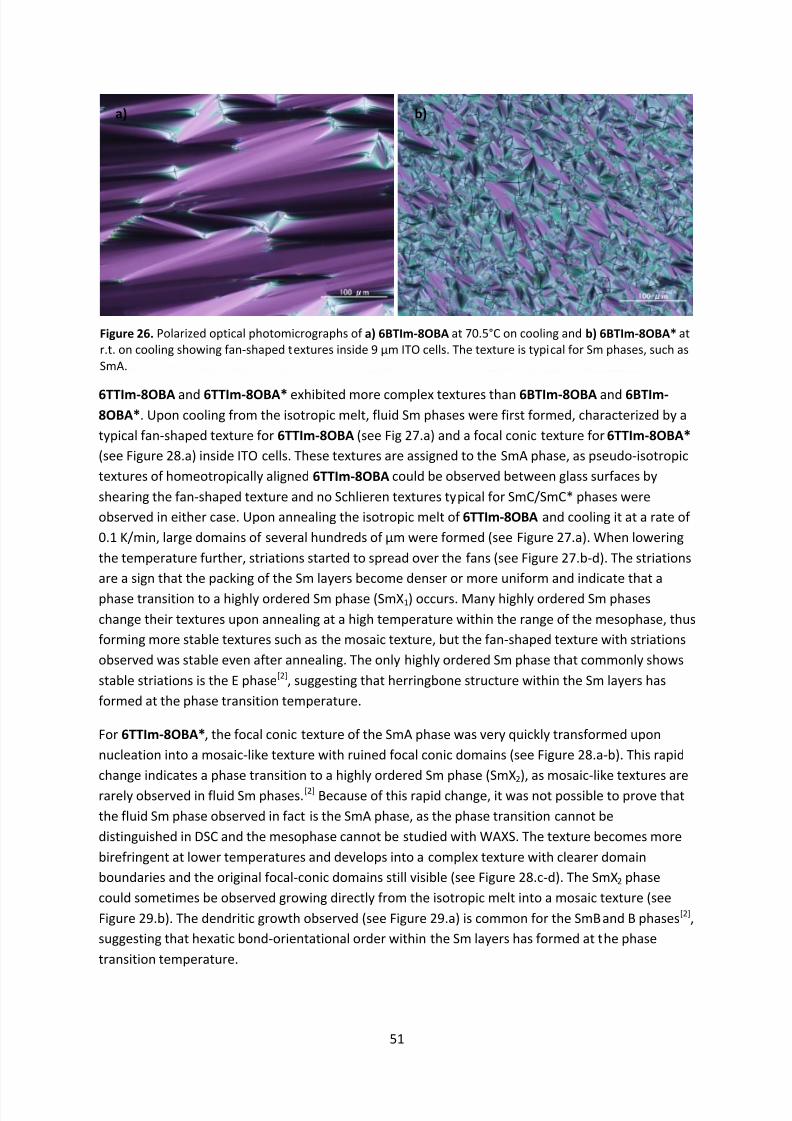
8/8/2019 Master Thesis - Jonas Sellberg
http://slidepdf.com/reader/full/master-thesis-jonas-sellberg 58/105
51
6TTIm-8OBA and 6TTIm-8OBA* exhibited more complex textures than 6BTIm-8OBA and 6BTIm-8OBA*. Upon cooling from the isotropic melt, fluid Sm phases were first formed, characterized by a
typical fan-shaped texture for 6TTIm-8OBA (see Fig 27.a) and a focal conic texture for 6TTIm-8OBA*
(see Figure 28.a) inside ITO cells. These textures are assigned to the SmA phase, as pseudo-isotropic
textures of homeotropically aligned 6TTIm-8OBA could be observed between glass surfaces by
shearing the fan-shaped texture and no Schlieren textures typical for SmC/SmC* phases were
observed in either case. Upon annealing the isotropic melt of 6TTIm-8OBA and cooling it at a rate of
0.1 K/min, large domains of several hundreds of µm were formed (see Figure 27.a). When lowering
the temperature further, striations started to spread over the fans (see Figure 27.b-d). The striations
are a sign that the packing of the Sm layers become denser or more uniform and indicate that a
phase transition to a highly ordered Sm phase (SmX1) occurs. Many highly ordered Sm phases
change their textures upon annealing at a high temperature within the range of the mesophase, thus
forming more stable textures such as the mosaic texture, but the fan-shaped texture with striations
observed was stable even after annealing. The only highly ordered Sm phase that commonly shows
stable striations is the E phase[2], suggesting that herringbone structure within the Sm layers has
formed at the phase transition temperature.
For 6TTIm-8OBA*, the focal conic texture of the SmA phase was very quickly transformed upon
nucleation into a mosaic-like texture with ruined focal conic domains (see Figure 28.a-b). This rapid
change indicates a phase transition to a highly ordered Sm phase (SmX2), as mosaic-like textures are
rarely observed in fluid Sm phases.[2] Because of this rapid change, it was not possible to prove that
the fluid Sm phase observed in fact is the SmA phase, as the phase transition cannot be
distinguished in DSC and the mesophase cannot be studied with WAXS. The texture becomes more
birefringent at lower temperatures and develops into a complex texture with clearer domain
boundaries and the original focal-conic domains still visible (see Figure 28.c-d). The SmX2 phase
could sometimes be observed growing directly from the isotropic melt into a mosaic texture (see
Figure 29.b). The dendritic growth observed (see Figure 29.a) is common for the SmB and B phases[2],
suggesting that hexatic bond-orientational order within the Sm layers has formed at the phase
transition temperature.
Figure 26. Polarized optical photomicrographs of a) 6BTIm-8OBA at 70.5°C on cooling and b) 6BTIm-8OBA* atr.t. on cooling showing fan-shaped textures inside 9 µm ITO cells. The texture is typical for Sm phases, such asSmA.
a) b)
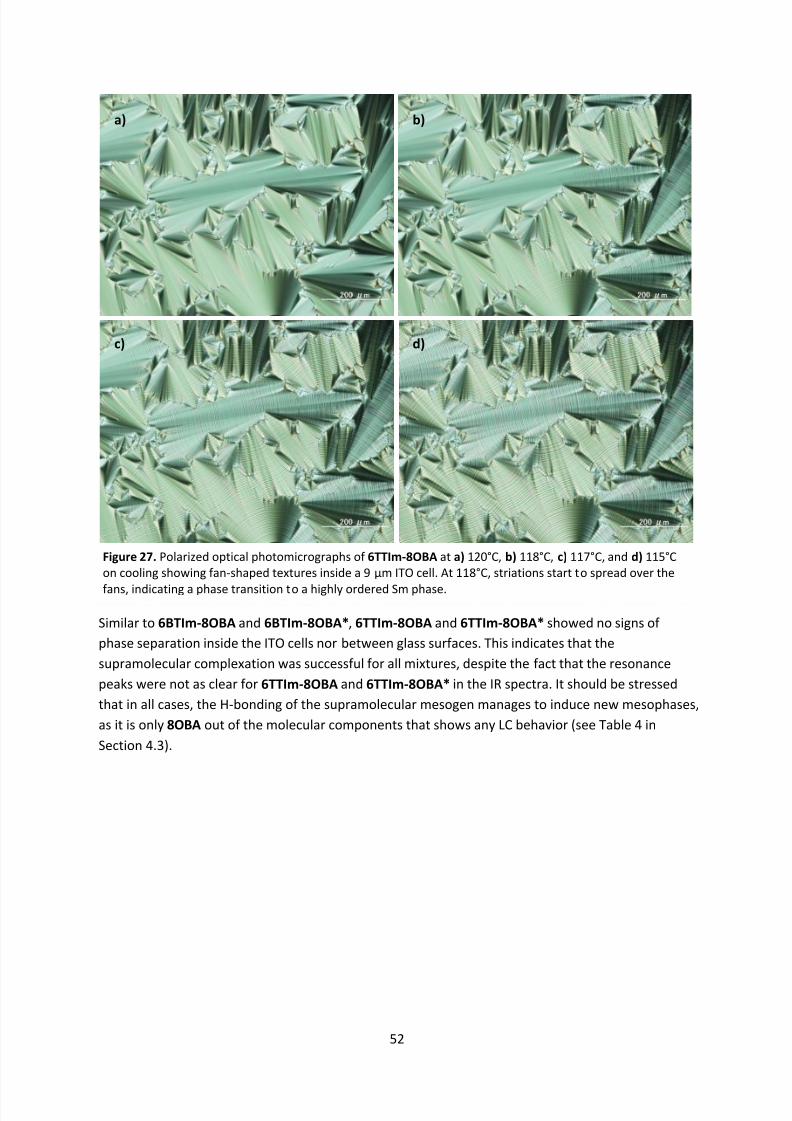
8/8/2019 Master Thesis - Jonas Sellberg
http://slidepdf.com/reader/full/master-thesis-jonas-sellberg 59/105
52
Similar to 6BTIm-8OBA and 6BTIm-8OBA*, 6TTIm-8OBA and 6TTIm-8OBA* showed no signs of
phase separation inside the ITO cells nor between glass surfaces. This indicates that the
supramolecular complexation was successful for all mixtures, despite the fact that the resonance
peaks were not as clear for 6TTIm-8OBA and 6TTIm-8OBA* in the IR spectra. It should be stressed
that in all cases, the H-bonding of the supramolecular mesogen manages to induce new mesophases,
as it is only 8OBA out of the molecular components that shows any LC behavior (see Table 4 in
Section 4.3).
Figure 27. Polarized optical photomicrographs of 6TTIm-8OBA at a) 120°C, b) 118°C, c) 117°C, and d) 115°Con cooling showing fan-shaped textures inside a 9 µm ITO cell. At 118°C, striations start to spread over the
fans, indicating a phase transition to a highly ordered Sm phase.
a) b)
c) d)
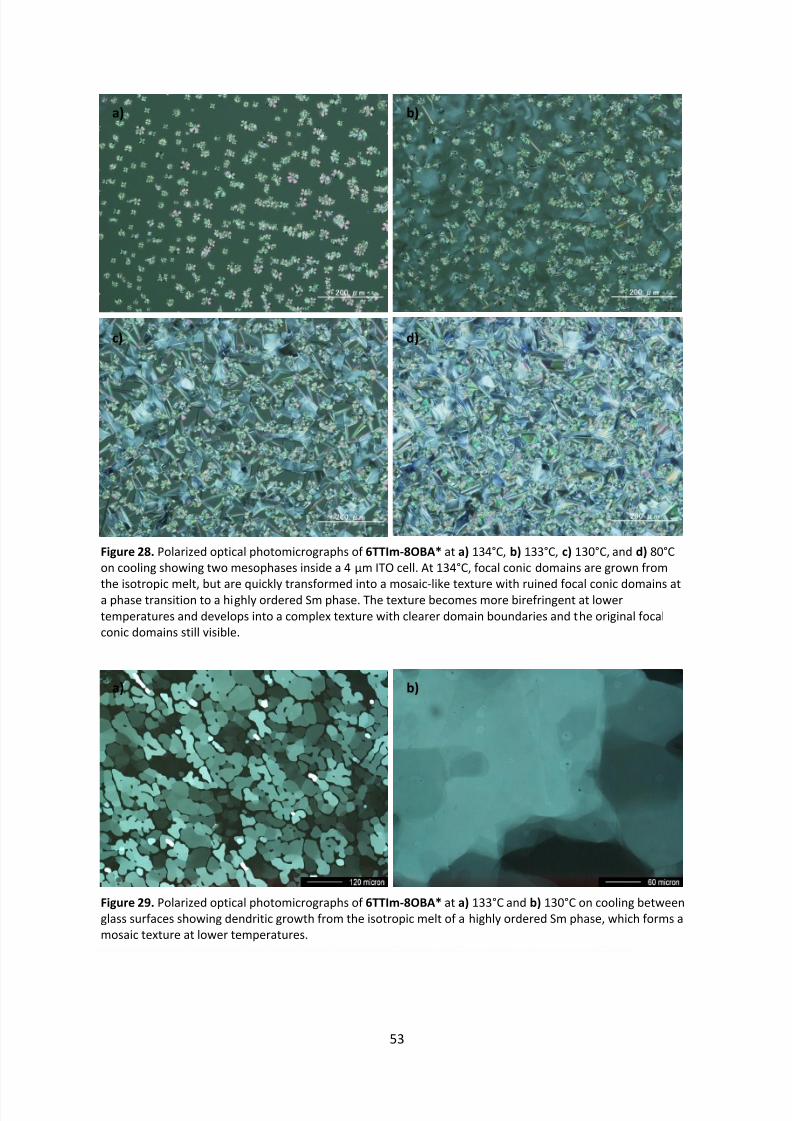
8/8/2019 Master Thesis - Jonas Sellberg
http://slidepdf.com/reader/full/master-thesis-jonas-sellberg 60/105
53
Figure 28. Polarized optical photomicrographs of 6TTIm-8OBA* at a) 134°C, b) 133°C, c) 130°C, and d) 80°Con cooling showing two mesophases inside a 4 µm ITO cell. At 134°C, focal conic domains are grown from
the isotropic melt, but are quickly transformed into a mosaic-like texture with ruined focal conic domains ata phase transition to a highly ordered Sm phase. The texture becomes more birefringent at lowertemperatures and develops into a complex texture with clearer domain boundaries and the original focalconic domains still visible.
Figure 29. Polarized optical photomicrographs of 6TTIm-8OBA* at a) 133°C and b) 130°C on cooling betweenglass surfaces showing dendritic growth from the isotropic melt of a highly ordered Sm phase, which forms amosaic texture at lower temperatures.
a) b)
c) d)
a) b)

8/8/2019 Master Thesis - Jonas Sellberg
http://slidepdf.com/reader/full/master-thesis-jonas-sellberg 61/105
54
The exact structures of SmX1 and SmX2 will be discussed further when the WAXS results are
presented, accompanied by a possible structure of the mesophases. It is not excluded that the two
mesophases actually are the same. In general, unknown mesophases can be determined by a
miscibility test with a similar compound exhibiting a reference phase at a temperature range
overlapping with the unknown mesophase. If the unknown phase is continuously miscible with a
reference phase over the entire concentration range, then they are equivalent. On the other hand, if
they are not miscible, no conclusion can be drawn.[2] A time saving variant of the miscibility test is
the contact preparation, in which two samples are melted and recrystallized to achieve a contact
region where the sample concentration is varied between 100 % of the unidentified compound to
100 % of the reference compound. By varying the temperature, the whole phase diagram of the two
compounds can therefore be simulated.[2] This method requires, however, a reference sample with
very specific properties, which has to be synthesized or bought commercially. It also assumes that
the phases exhibited by the supramolecular mesogens are common Sm phases observed by
conventional mesogens. The more complex structure of the supramolecular mesogen might in fact
cause an unclassified mesophase, unique for the new type of mesogen. Nevertheless, contactpreparation should be able to confirm if SmX1 and SmX2 are the same phase or not, and should be
performed during further characterization to determine the exact structure of the mesophases.
Again, the project time available was short, limiting the amount of time spent on phase
characterization as several other types of properties had to be analyzed as well.
When applying a strong DC or AC voltage, the textures of some of the mixtures changed. 6BTIm-
8OBA* showed a fan-shaped texture after applying a DC voltage of 100 V (see Figure 30), where
especially the texture of the domain boundaries and the point disclinations had changed. The effect
was also visible for 6BTIm-8OBA, but it was more difficult to capture since the sample crystallized at
r.t. and the sample had to be transferred to another POM after applying the voltage. In both casesthe texture change was reversible, i.e., when heating up the sample to Iso phase and cooling again
the original texture appeared. This texture change was assigned to hydrodynamic effects due to
ionic impurities.[5] If ions are present in the LC sample while applying an electric field, they will move
towards the electrode with opposite bias. The viscosity in the LC sample, however, is lower when the
ions travel parallel to the molecular axis, forcing the LC molecules to turn around when the ions
move. When studying 6BTIm-8OBA* in an electric field, the movement started in domain
boundaries or defects and spread to the center of the domains when the electric field was increased
further. At strong electric fields, this flow became turbulent, causing dynamic scattering.[5, 135]
Dynamic scattering was observed for 6BTIm-8OBA* inside a 4 µm ITO cell when applying AC voltages
(rectangular and triangular waves) of ±60 V with a frequency of 0.1-0.5 Hz. From this behavior instrong electric fields, conclusions can be drawn regarding the application of the supramolecular
mesogens as semiconductors. The samples were stable at strong electric fields, which is an
improvement compared to earlier studies in Kato laboratory where supramolecular mesogens were
synthesized. This indicates that the amount of ionic impurities have been decreased by the
distillation and extra recrystallization of the molecular components. However, the stability decreases
with increased temperature, indicating that the stability depends on the movement of ions which in
turn depends on the viscosity. The ionic impurities cause charge injection at the electrodes, which
leads to high dark currents and degradation of the sample. Therefore, the samples will most likely
not show stable transient photocurrents of holes or electrons, but show ionic carrier mobilities at
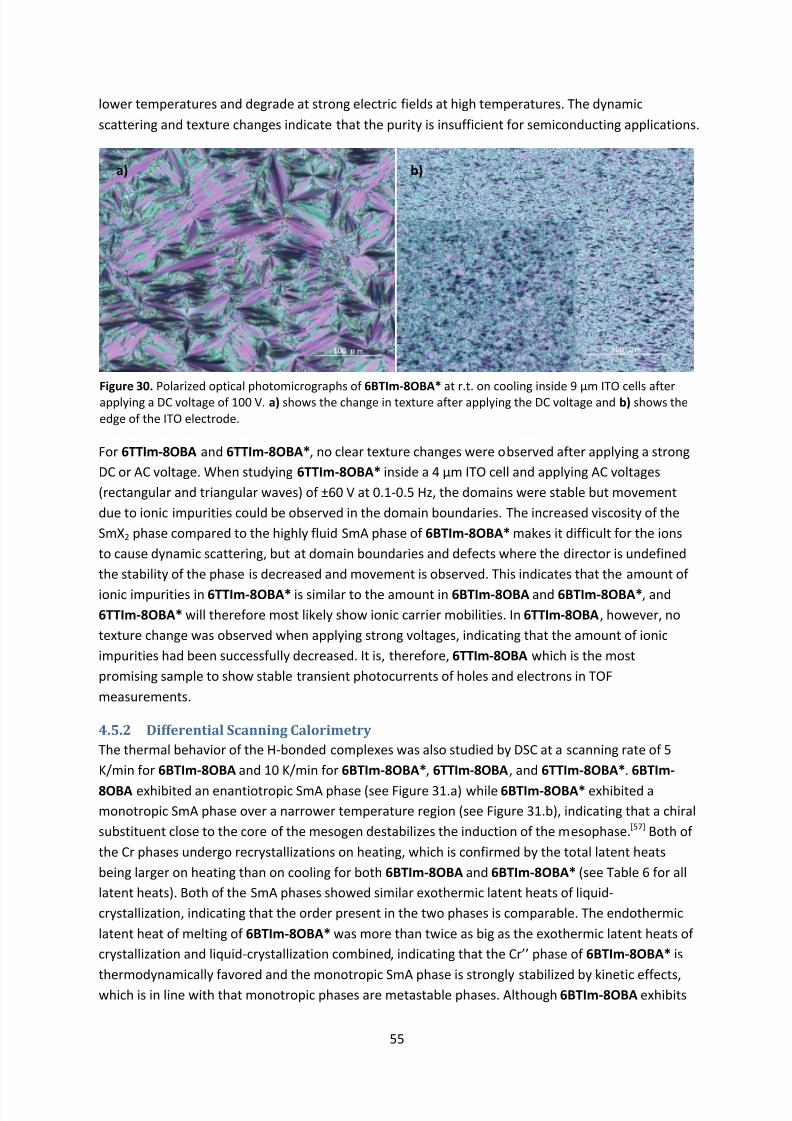
8/8/2019 Master Thesis - Jonas Sellberg
http://slidepdf.com/reader/full/master-thesis-jonas-sellberg 62/105
55
lower temperatures and degrade at strong electric fields at high temperatures. The dynamic
scattering and texture changes indicate that the purity is insufficient for semiconducting applications.
For 6TTIm-8OBA and 6TTIm-8OBA*, no clear texture changes were observed after applying a strong
DC or AC voltage. When studying 6TTIm-8OBA* inside a 4 µm ITO cell and applying AC voltages
(rectangular and triangular waves) of ±60 V at 0.1-0.5 Hz, the domains were stable but movement
due to ionic impurities could be observed in the domain boundaries. The increased viscosity of the
SmX2 phase compared to the highly fluid SmA phase of 6BTIm-8OBA* makes it difficult for the ions
to cause dynamic scattering, but at domain boundaries and defects where the director is undefined
the stability of the phase is decreased and movement is observed. This indicates that the amount of
ionic impurities in 6TTIm-8OBA* is similar to the amount in 6BTIm-8OBA and 6BTIm-8OBA*, and6TTIm-8OBA* will therefore most likely show ionic carrier mobilities. In 6TTIm-8OBA, however, no
texture change was observed when applying strong voltages, indicating that the amount of ionic
impurities had been successfully decreased. It is, therefore, 6TTIm-8OBA which is the most
promising sample to show stable transient photocurrents of holes and electrons in TOF
measurements.
4.5.2 Differential Scanning Calorimetry
The thermal behavior of the H-bonded complexes was also studied by DSC at a scanning rate of 5
K/min for 6BTIm-8OBA and 10 K/min for 6BTIm-8OBA*, 6TTIm-8OBA, and 6TTIm-8OBA*. 6BTIm-
8OBA exhibited an enantiotropic SmA phase (see Figure 31.a) while 6BTIm-8OBA* exhibited amonotropic SmA phase over a narrower temperature region (see Figure 31.b), indicating that a chiral
substituent close to the core of the mesogen destabilizes the induction of the mesophase.[57] Both of
the Cr phases undergo recrystallizations on heating, which is confirmed by the total latent heats
being larger on heating than on cooling for both 6BTIm-8OBA and 6BTIm-8OBA* (see Table 6 for all
latent heats). Both of the SmA phases showed similar exothermic latent heats of liquid-
crystallization, indicating that the order present in the two phases is comparable. The endothermic
latent heat of melting of 6BTIm-8OBA* was more than twice as big as the exothermic latent heats of
crystallization and liquid-crystallization combined, indicating that the Cr’’ phase of 6BTIm-8OBA* is
thermodynamically favored and the monotropic SmA phase is strongly stabilized by kinetic effects,
which is in line with that monotropic phases are metastable phases. Although 6BTIm-8OBA exhibits
Figure 30. Polarized optical photomicrographs of 6BTIm-8OBA* at r.t. on cooling inside 9 µm ITO cells afterapplying a DC voltage of 100 V. a) shows the change in texture after applying the DC voltage and b) shows theedge of the ITO electrode.
a) b)
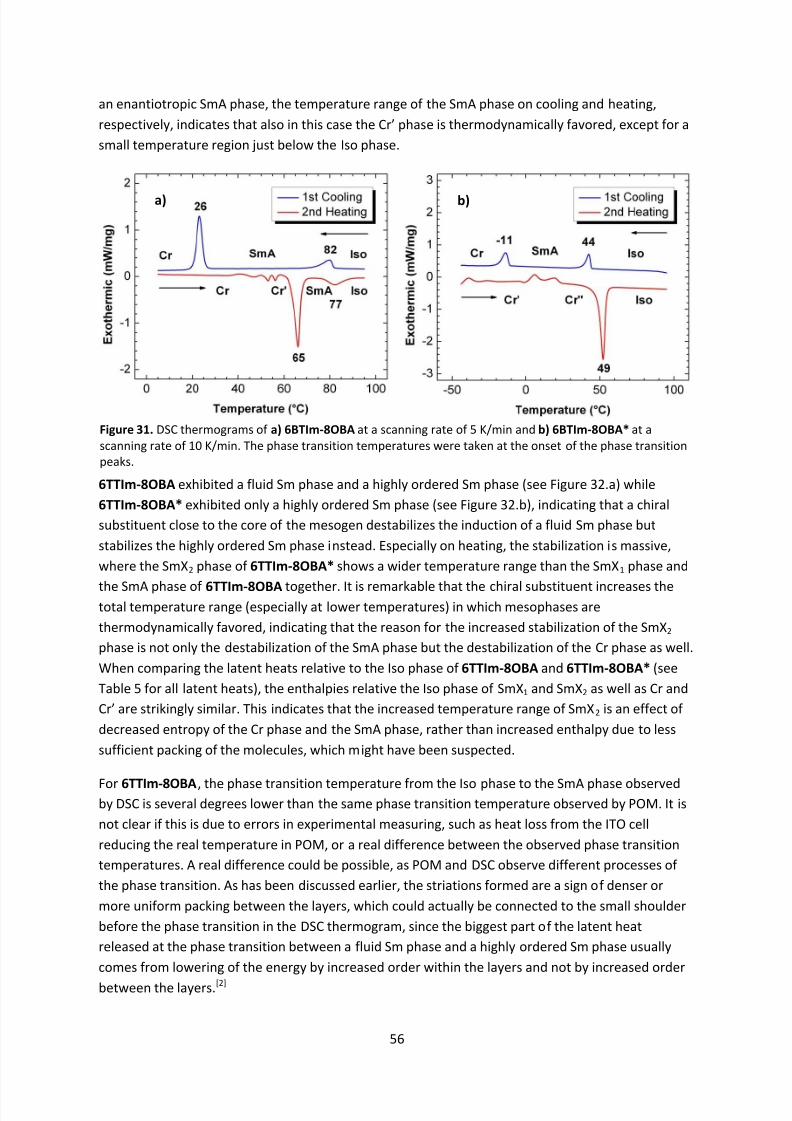
8/8/2019 Master Thesis - Jonas Sellberg
http://slidepdf.com/reader/full/master-thesis-jonas-sellberg 63/105
56
an enantiotropic SmA phase, the temperature range of the SmA phase on cooling and heating,
respectively, indicates that also in this case the Cr’ phase is thermodynamically favored, except for a
small temperature region just below the Iso phase.
6TTIm-8OBA exhibited a fluid Sm phase and a highly ordered Sm phase (see Figure 32.a) while
6TTIm-8OBA* exhibited only a highly ordered Sm phase (see Figure 32.b), indicating that a chiral
substituent close to the core of the mesogen destabilizes the induction of a fluid Sm phase but
stabilizes the highly ordered Sm phase instead. Especially on heating, the stabilization is massive,
where the SmX2 phase of 6TTIm-8OBA* shows a wider temperature range than the SmX1 phase and
the SmA phase of 6TTIm-8OBA together. It is remarkable that the chiral substituent increases thetotal temperature range (especially at lower temperatures) in which mesophases are
thermodynamically favored, indicating that the reason for the increased stabilization of the SmX2
phase is not only the destabilization of the SmA phase but the destabilization of the Cr phase as well.
When comparing the latent heats relative to the Iso phase of 6TTIm-8OBA and 6TTIm-8OBA* (see
Table 5 for all latent heats), the enthalpies relative the Iso phase of SmX1 and SmX2 as well as Cr and
Cr’ are strikingly similar. This indicates that the increased temperature range of SmX2 is an effect of
decreased entropy of the Cr phase and the SmA phase, rather than increased enthalpy due to less
sufficient packing of the molecules, which might have been suspected.
For 6TTIm-8OBA, the phase transition temperature from the Iso phase to the SmA phase observedby DSC is several degrees lower than the same phase transition temperature observed by POM. It is
not clear if this is due to errors in experimental measuring, such as heat loss from the ITO cell
reducing the real temperature in POM, or a real difference between the observed phase transition
temperatures. A real difference could be possible, as POM and DSC observe different processes of
the phase transition. As has been discussed earlier, the striations formed are a sign of denser or
more uniform packing between the layers, which could actually be connected to the small shoulder
before the phase transition in the DSC thermogram, since the biggest part of the latent heat
released at the phase transition between a fluid Sm phase and a highly ordered Sm phase usually
comes from lowering of the energy by increased order within the layers and not by increased order
between the layers.[2]
Figure 31. DSC thermograms of a) 6BTIm-8OBA at a scanning rate of 5 K/min and b) 6BTIm-8OBA* at ascanning rate of 10 K/min. The phase transition temperatures were taken at the onset of the phase transitionpeaks.
a) b)

8/8/2019 Master Thesis - Jonas Sellberg
http://slidepdf.com/reader/full/master-thesis-jonas-sellberg 64/105
57
There are some clear differences between the terthiophene mixtures and the bithiophene mixtures,
except for the obvious presence of highly ordered Sm phases. The SmA phase of 6TTIm-8OBA has
around twice as large endothermic latent heat of isotropization and exothermic latent heat of liquid-
crystallization as the SmA phases of 6BTIm-8OBA and 6BTIm-8OBA*, indicating that the degree of
order in the SmA phase of 6TTIm-8OBA is much larger. This does not necessarily have to mean that
they are different types of phases, but it can be interpreted as the layer distance becomes more
uniform (less fluctuations) and the order parameter becomes larger for the SmA phase of 6TTIm-
8OBA compared to the SmA phases of 6BTIm-8OBA and 6BTIm-8OBA*. Furthermore, 6TTIm-8OBA
and 6TTIm-8OBA* do not exhibit proper crystallization peaks, but seem to undergo glass transitionsinto glassy (G) states instead. However, a proper glass transition should have the shape of a sigmoid
curve, i.e., as a step transition, where the heat capacity of the material increases in the glassy state,
and not as a peak. For 6TTIm-8OBA and 6TTIm-8OBA*, a small peak at 23°C and 24°C , respectively,
can be observed when the materials turn into their glassy states, at the same time as the heat
capacity of the material increases slightly. In fact, 6TTIm-8OBA* exhibits two small peaks at 24°C and
11°C when turning into G. The peaks are broad and their transition temperatures are therefore given
at the maximum of the phase transition peaks. The exothermic latent heats of the phase transition
are only 4 J/g for 6TTIm-8OBA and less than 1 J/g for both peaks of 6TTIm-8OBA*, thus ruling out
the possibility of a regular crystallization. The reason for this unconventional behavior is unknown,
but one possibility is that one or a few parts of the supramolecular mesogen crystallizes at the sametime as the other parts undergo a glass transition and keep the order of the highly ordered Sm phase.
This would explain the small crystallization peak, which is heavily broadened due to the slower
dynamics of the glassy state, but at the same time explain why the heat capacity increases and no
regular crystallization peak occurs. This would also explain why 6TTIm-8OBA* exhibits two peaks, as
different parts of the supramolecular mesogen might crystallize at different temperatures. The
glassy states of 6TTIm-8OBA and 6TTIm-8OBA* could also explain the weakened resonance peaks
observed in FTIR spectra, as the less ordered glassy state with slower dynamics might affect ν O-H
differently than the Cr phases observed for 6BTIm-8OBA and 6BTIm-8OBA*. Time-dependent FTIR
measurements would resolve this issue.
Figure 32. DSC thermograms of a) 6TTIm-8OBA at a scanning rate of 10 K/min and b) 6TTIm-8OBA* at ascanning rate of 10 K/min. The phase transition temperatures were taken at the onset of the phase transition
peaks, except for the glass transitions when the peak value was used.
a) b)
8/8/2019 Master Thesis - Jonas Sellberg
http://slidepdf.com/reader/full/master-thesis-jonas-sellberg 65/105
58
Table 6. Thermal behavior of H-bond acceptors and H-bonded complexes with the exothermic latent heats(∆ ) in square brackets. The transition temperatures (Ttrans) were taken at the onset of the phase transitionpeaks, except for the glass transitions when the peak value was used. The phase transitions are only valid from leftto right.
Compound Phase Ttrans (°C)
[
∆
(J/g)]
Phase Ttrans (°C)
[
∆
(J/g)]
Phase Ttrans (°C)
[
∆
(J/g)]
Phase Ttrans (°C)
[
∆
(J/g)]
Phase
6BTIm Cr 63 [-143] Iso 24 [113] Cr6TTIm Cr 158 [-65] Iso 158 [63] Cr6BTIm-
8OBA Cr’ 65 [-57] SmA 77 [-11] Iso 82 [12] SmA 26 [44] Cr6BTIm-
8OBA* Cr’’ 49 [-59] Iso 44 [10] SmA -11 [12] Cr6TTIm-
8OBA Cr’ 94 [-16] SmX1 102 [-12] SmA 150 [-21] IsoIso 151 [21] SmA 112 [13] SmX1 23 [4] G
6TTIm-
8OBA* Cr 58 [-16] SmX2 123 [-34] Iso 133 [33] SmX2 24 [<1] G
4.5.3 Wide-Angle X-Ray Scattering
The repetitive distances within and between the Sm layers were characterized by WAXS. The
diffraction patterns of 6BTIm-8OBA at 73°C on heating and 6BTIm-8OBA* at r.t. on cooling (see
Figure 33) were typical for SmA phases, showing clear peaks from the layer spacings but no clear
peaks from order within the layers . At wide angles, there was a broad band centered around 4.4 Å
(around 20°) in each spectrum, originating from the average intermolecular distance of the
supramolecular mesogens within the layers. This band can sometimes be divided into diffuse peaks
corresponding to short spacings of the aromatic cores or interchain distances of the flexible
chains.[136] For 6BTIm-8OBA and 6BTIm-8OBA*, however, no diffuse peaks can be distinguished as
the various distances seem to overlap and the diffraction is very short-range due to the liquid-like
positional order within the layers. The observed bands appear at too long distances to confirm π-
interactions between the bithiophene units, as efficient π-interactions between oligothiophene units
occur at distances of 3.8-4.0 Å.[25, 31, 90] The intensity of the band appears stronger for 6BTIm-8OBA*,
but this might be an effect of the different measuring conditions, as fast scan had to be used to
avoid crystallization.
The layer spacing observed was 37.4 Å and 37.6 Å for 6BTIm-8OBA and 6BTIm-8OBA*, respectively.
The second order (200) diffraction from the layer spacing was visible for 6BTIm-8OBA*, indicating
that the layer spacing was more uniform in 6BTIm-8OBA* than in 6BTIm-8OBA. The difference in
temperature, however, could explain why 6BTIm-8OBA* appears more ordered, when the latent
heats relative to the Iso phase determined by DSC are very similar for both SmA phases. The
experimental layer spacing is comparable to DFT B3LYP (6-31 G*) calculations estimating a layer
spacing of 38.4 Å and 36.9 Å for 6BTIm-8OBA and 6BTIm-8OBA*, respectively. The molecular lengths
were calculated separately and the layer spacing was estimated to d6BTIm/6TTIm + dN- -H-O[137] +
d8OBA/8OBA*. The experimental layer spacing agrees very well with the theoretical layer spacing,
indicating that the phases are orthogonal and a monolayered structure is formed. A key question is if
the supramolecular mesogens are packed parallel, antiparallel, or randomly pointing up and downwithin the layers. Imidazole derivatives usually have a large dipole moment localized in the imidazole
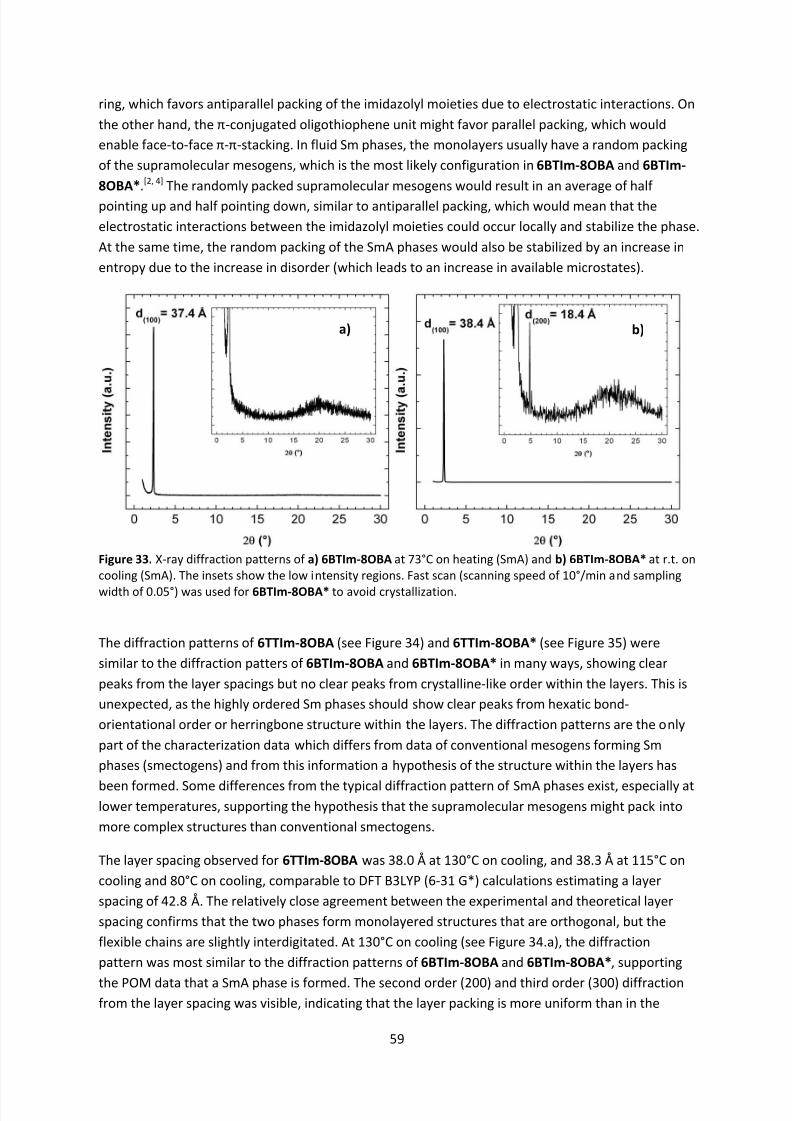
8/8/2019 Master Thesis - Jonas Sellberg
http://slidepdf.com/reader/full/master-thesis-jonas-sellberg 66/105
59
ring, which favors antiparallel packing of the imidazolyl moieties due to electrostatic interactions. On
the other hand, the π-conjugated oligothiophene unit might favor parallel packing, which would
enable face-to-face π-π-stacking. In fluid Sm phases, the monolayers usually have a random packing
of the supramolecular mesogens, which is the most likely configuration in 6BTIm-8OBA and 6BTIm-
8OBA*.[2, 4] The randomly packed supramolecular mesogens would result in an average of half
pointing up and half pointing down, similar to antiparallel packing, which would mean that the
electrostatic interactions between the imidazolyl moieties could occur locally and stabilize the phase.
At the same time, the random packing of the SmA phases would also be stabilized by an increase in
entropy due to the increase in disorder (which leads to an increase in available microstates).
The diffraction patterns of 6TTIm-8OBA (see Figure 34) and 6TTIm-8OBA* (see Figure 35) were
similar to the diffraction patters of 6BTIm-8OBA and 6BTIm-8OBA* in many ways, showing clear
peaks from the layer spacings but no clear peaks from crystalline-like order within the layers. This is
unexpected, as the highly ordered Sm phases should show clear peaks from hexatic bond-
orientational order or herringbone structure within the layers. The diffraction patterns are the only
part of the characterization data which differs from data of conventional mesogens forming Sm
phases (smectogens) and from this information a hypothesis of the structure within the layers has
been formed. Some differences from the typical diffraction pattern of SmA phases exist, especially atlower temperatures, supporting the hypothesis that the supramolecular mesogens might pack into
more complex structures than conventional smectogens.
The layer spacing observed for 6TTIm-8OBA was 38.0 Å at 130°C on cooling, and 38.3 Å at 115°C on
cooling and 80°C on cooling, comparable to DFT B3LYP (6-31 G*) calculations estimating a layer
spacing of 42.8 Å. The relatively close agreement between the experimental and theoretical layer
spacing confirms that the two phases form monolayered structures that are orthogonal, but the
flexible chains are slightly interdigitated. At 130°C on cooling (see Figure 34.a), the diffraction
pattern was most similar to the diffraction patterns of 6BTIm-8OBA and 6BTIm-8OBA*, supporting
the POM data that a SmA phase is formed. The second order (200) and third order (300) diffractionfrom the layer spacing was visible, indicating that the layer packing is more uniform than in the
Figure 33. X-ray diffraction patterns of a) 6BTIm-8OBA at 73°C on heating (SmA) and b) 6BTIm-8OBA* at r.t. oncooling (SmA). The insets show the low intensity regions. Fast scan (scanning speed of 10°/min and sampling
width of 0.05°) was used for 6BTIm-8OBA* to avoid crystallization.
a) b)
8/8/2019 Master Thesis - Jonas Sellberg
http://slidepdf.com/reader/full/master-thesis-jonas-sellberg 67/105
60
bithiophene mixtures. This is in line with the DSC data, as the latent heats relative to the Iso phase
were twice as large compared to 6BTIm-8OBA and 6BTIm-8OBA*. At wide angles, the broad band
had moved to wider angles, being centered around 3.8 Å (around 23°), indicating that the π-
interactions between the terthiophene units are stronger than the π-interactions between the
bithiophene units. No diffuse peaks can be distinguished, however, since the diffraction still seems
to be very short-range due to the liquid-like positional order within the layers. When lowering the
temperature to 115°C and 80°C (see Figure 34.b-c), where striations occur in POM, the fourth order
(400) and fifth order (500) diffraction from the layer spacing became visible, indicating that the layer
spacing is highly uniform within the domains. However, the broadness of the peaks, especially at
lower temperatures, indicates that a distribution of layer spacing exists between different domains.
The distribution is shifted towards shorter layer distances at lower temperatures, indicating a denser
packing with the flexible chains more interdigitated, although the peak value of the diffraction peaks
does not change and the observed layer spacing is therefore the same. At wide angles, the broad
band is still centered around 3.8 Å, but diffuse peaks have occurred. The strongest one at 3.8 Å has
become narrower, indicating that the intermolecular π-interactions between the terthiophene units,i.e., the positional order within the layers, have become slightly more long-range. The diffuse peaks
are still far from crystalline, however, and they are better resembled by the amorphous peaks of
glasses than the peaks observed within the layers of highly ordered Sm phases. Another diffuse peak
is observed at 5.7 Å (around 15°), assigned to the interchain distances between the flexible alkyl and
alkoxy chains.
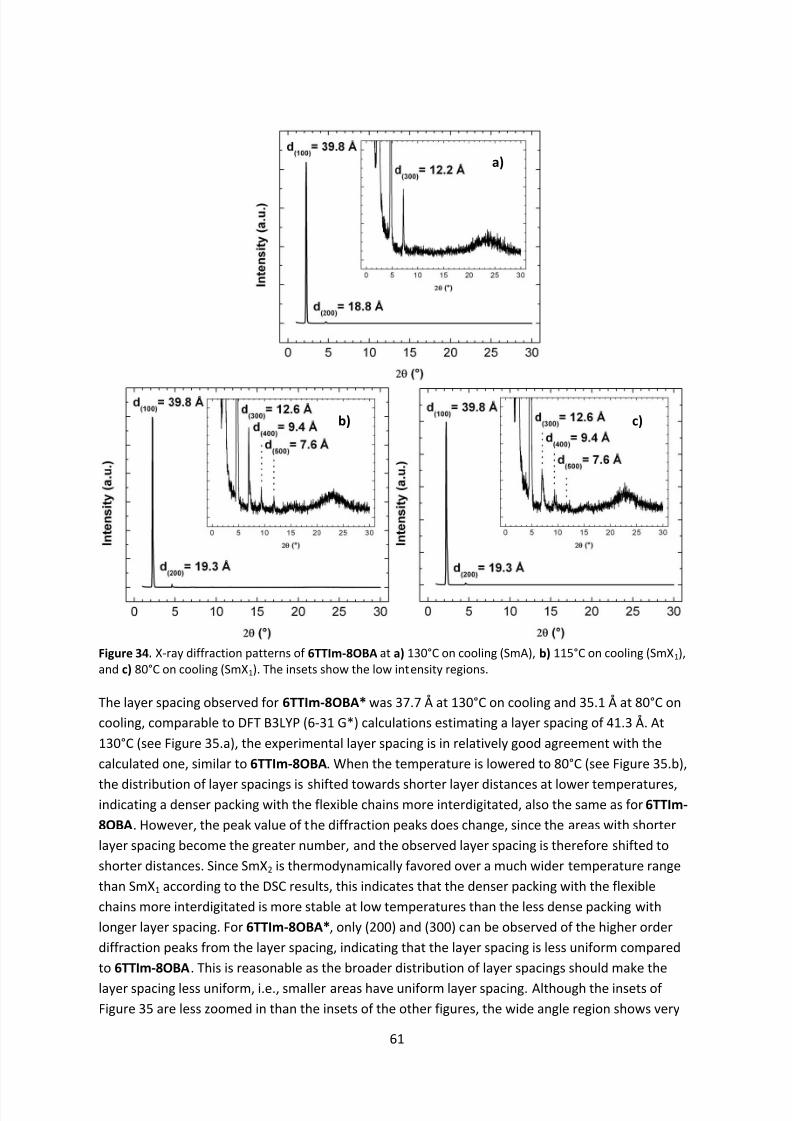
8/8/2019 Master Thesis - Jonas Sellberg
http://slidepdf.com/reader/full/master-thesis-jonas-sellberg 68/105
61
The layer spacing observed for 6TTIm-8OBA* was 37.7 Å at 130°C on cooling and 35.1 Å at 80°C on
cooling, comparable to DFT B3LYP (6-31 G*) calculations estimating a layer spacing of 41.3 Å. At
130°C (see Figure 35.a), the experimental layer spacing is in relatively good agreement with the
calculated one, similar to 6TTIm-8OBA. When the temperature is lowered to 80°C (see Figure 35.b),
the distribution of layer spacings is shifted towards shorter layer distances at lower temperatures,indicating a denser packing with the flexible chains more interdigitated, also the same as for 6TTIm-
8OBA. However, the peak value of the diffraction peaks does change, since the areas with shorter
layer spacing become the greater number, and the observed layer spacing is therefore shifted to
shorter distances. Since SmX2 is thermodynamically favored over a much wider temperature range
than SmX1 according to the DSC results, this indicates that the denser packing with the flexible
chains more interdigitated is more stable at low temperatures than the less dense packing with
longer layer spacing. For 6TTIm-8OBA*, only (200) and (300) can be observed of the higher order
diffraction peaks from the layer spacing, indicating that the layer spacing is less uniform compared
to 6TTIm-8OBA. This is reasonable as the broader distribution of layer spacings should make the
layer spacing less uniform, i.e., smaller areas have uniform layer spacing. Although the insets of Figure 35 are less zoomed in than the insets of the other figures, the wide angle region shows very
Figure 34. X-ray diffraction patterns of 6TTIm-8OBA at a) 130°C on cooling (SmA), b) 115°C on cooling (SmX1),and c) 80°C on cooling (SmX1). The insets show the low intensity regions.
a)
b) c)
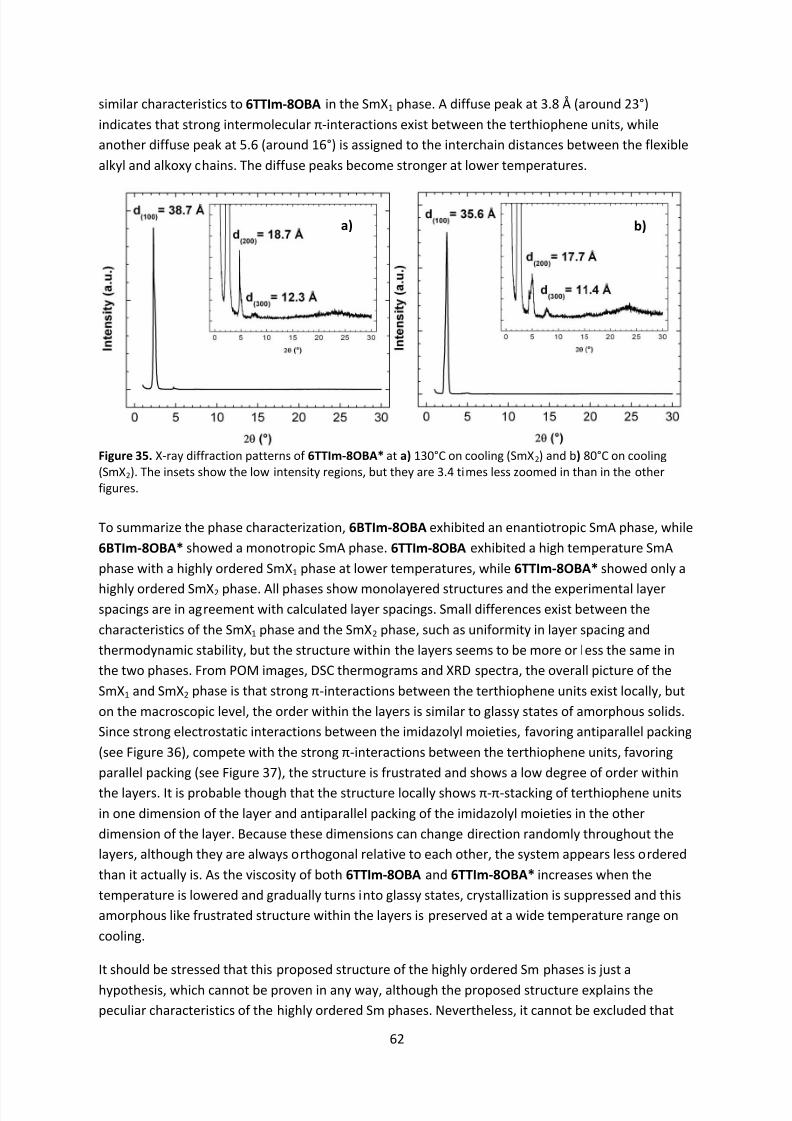
8/8/2019 Master Thesis - Jonas Sellberg
http://slidepdf.com/reader/full/master-thesis-jonas-sellberg 69/105
62
similar characteristics to 6TTIm-8OBA in the SmX1 phase. A diffuse peak at 3.8 Å (around 23°)
indicates that strong intermolecular π-interactions exist between the terthiophene units, while
another diffuse peak at 5.6 (around 16°) is assigned to the interchain distances between the flexible
alkyl and alkoxy chains. The diffuse peaks become stronger at lower temperatures.
To summarize the phase characterization, 6BTIm-8OBA exhibited an enantiotropic SmA phase, while
6BTIm-8OBA* showed a monotropic SmA phase. 6TTIm-8OBA exhibited a high temperature SmA
phase with a highly ordered SmX1 phase at lower temperatures, while 6TTIm-8OBA* showed only a
highly ordered SmX2 phase. All phases show monolayered structures and the experimental layerspacings are in agreement with calculated layer spacings. Small differences exist between the
characteristics of the SmX1 phase and the SmX2 phase, such as uniformity in layer spacing and
thermodynamic stability, but the structure within the layers seems to be more or less the same in
the two phases. From POM images, DSC thermograms and XRD spectra, the overall picture of the
SmX1 and SmX2 phase is that strong π-interactions between the terthiophene units exist locally, but
on the macroscopic level, the order within the layers is similar to glassy states of amorphous solids.
Since strong electrostatic interactions between the imidazolyl moieties, favoring antiparallel packing
(see Figure 36), compete with the strong π-interactions between the terthiophene units, favoring
parallel packing (see Figure 37), the structure is frustrated and shows a low degree of order within
the layers. It is probable though that the structure locally shows π-π-stacking of terthiophene units
in one dimension of the layer and antiparallel packing of the imidazolyl moieties in the other
dimension of the layer. Because these dimensions can change direction randomly throughout the
layers, although they are always orthogonal relative to each other, the system appears less ordered
than it actually is. As the viscosity of both 6TTIm-8OBA and 6TTIm-8OBA* increases when the
temperature is lowered and gradually turns into glassy states, crystallization is suppressed and this
amorphous like frustrated structure within the layers is preserved at a wide temperature range on
cooling.
It should be stressed that this proposed structure of the highly ordered Sm phases is just a
hypothesis, which cannot be proven in any way, although the proposed structure explains the
peculiar characteristics of the highly ordered Sm phases. Nevertheless, it cannot be excluded that
Figure 35. X-ray diffraction patterns of 6TTIm-8OBA* at a) 130°C on cooling (SmX2) and b) 80°C on cooling(SmX2). The insets show the low intensity regions, but they are 3.4 times less zoomed in than in the otherfigures.
a) b)

8/8/2019 Master Thesis - Jonas Sellberg
http://slidepdf.com/reader/full/master-thesis-jonas-sellberg 70/105
63
there is another proposed structure which better fits the observed characteristics of the SmX1 phase
and the SmX2 phase. Single-crystal XRD studies of the Cr phases of 6TTIm-8OBA and 6TTIm-8OBA*
might hint what structure the SmX1 and SmX2 phases actually take, which would shed light on this
puzzling issue.
Figure 36. Schematic picture of antiparallel packing in 6TTIm-8OBA, stabilized by electrostatic interactions
between the imidazolyl moieties. The electric dipole moments are marked above each imidazolyl moiety.
Figure 37. Schematic picture of parallel packing in 6TTIm-8OBA, stabilized by π-interactions between theterthiophene units.
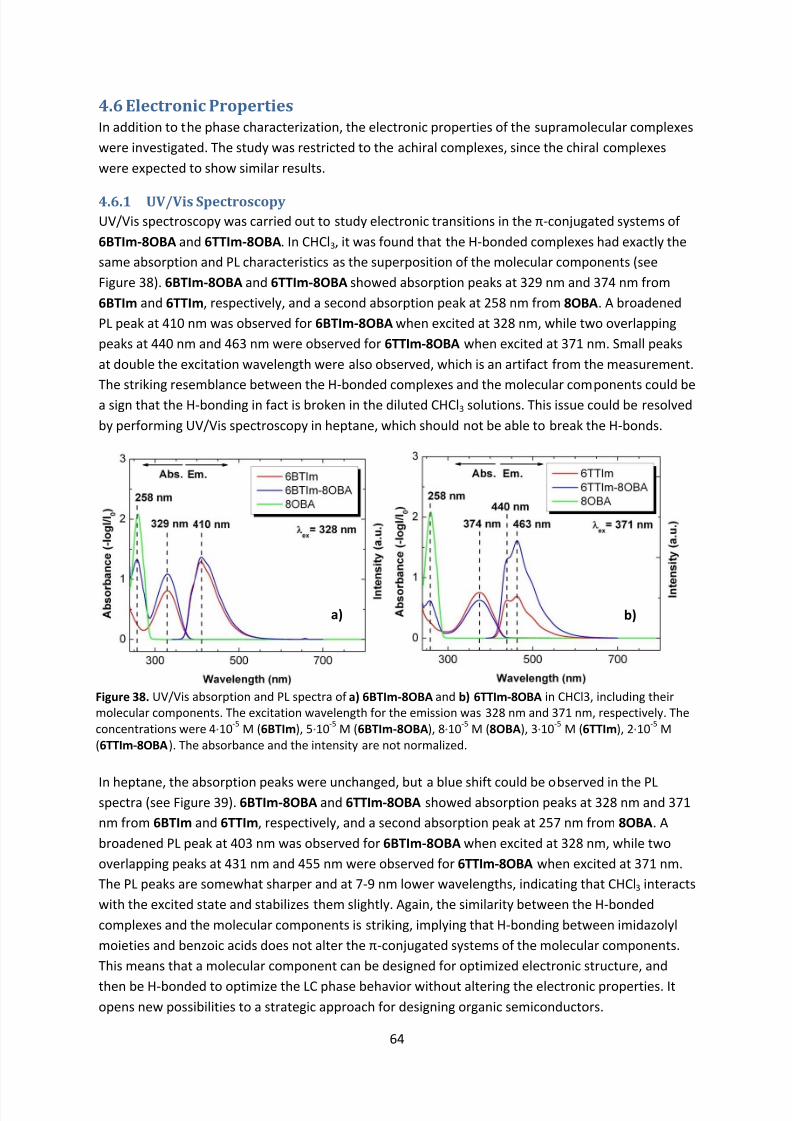
8/8/2019 Master Thesis - Jonas Sellberg
http://slidepdf.com/reader/full/master-thesis-jonas-sellberg 71/105
64
4.6 Electronic Properties
In addition to the phase characterization, the electronic properties of the supramolecular complexes
were investigated. The study was restricted to the achiral complexes, since the chiral complexes
were expected to show similar results.
4.6.1 UV/Vis Spectroscopy
UV/Vis spectroscopy was carried out to study electronic transitions in the π-conjugated systems of
6BTIm-8OBA and 6TTIm-8OBA. In CHCl3, it was found that the H-bonded complexes had exactly the
same absorption and PL characteristics as the superposition of the molecular components (see
Figure 38). 6BTIm-8OBA and 6TTIm-8OBA showed absorption peaks at 329 nm and 374 nm from
6BTIm and 6TTIm, respectively, and a second absorption peak at 258 nm from 8OBA. A broadened
PL peak at 410 nm was observed for 6BTIm-8OBA when excited at 328 nm, while two overlapping
peaks at 440 nm and 463 nm were observed for 6TTIm-8OBA when excited at 371 nm. Small peaks
at double the excitation wavelength were also observed, which is an artifact from the measurement.
The striking resemblance between the H-bonded complexes and the molecular components could be
a sign that the H-bonding in fact is broken in the diluted CHCl3 solutions. This issue could be resolved
by performing UV/Vis spectroscopy in heptane, which should not be able to break the H-bonds.
In heptane, the absorption peaks were unchanged, but a blue shift could be observed in the PLspectra (see Figure 39). 6BTIm-8OBA and 6TTIm-8OBA showed absorption peaks at 328 nm and 371
nm from 6BTIm and 6TTIm, respectively, and a second absorption peak at 257 nm from 8OBA. A
broadened PL peak at 403 nm was observed for 6BTIm-8OBA when excited at 328 nm, while two
overlapping peaks at 431 nm and 455 nm were observed for 6TTIm-8OBA when excited at 371 nm.
The PL peaks are somewhat sharper and at 7-9 nm lower wavelengths, indicating that CHCl3 interacts
with the excited state and stabilizes them slightly. Again, the similarity between the H-bonded
complexes and the molecular components is striking, implying that H-bonding between imidazolyl
moieties and benzoic acids does not alter the π-conjugated systems of the molecular components.
This means that a molecular component can be designed for optimized electronic structure, and
then be H-bonded to optimize the LC phase behavior without altering the electronic properties. Itopens new possibilities to a strategic approach for designing organic semiconductors.
Figure 38. UV/Vis absorption and PL spectra of a) 6BTIm-8OBA and b) 6TTIm-8OBA in CHCl3, including theirmolecular components. The excitation wavelength for the emission was 328 nm and 371 nm, respectively. Theconcentrations were 4·10-5 M (6BTIm), 5·10-5 M (6BTIm-8OBA), 8·10-5 M (8OBA), 3·10-5 M (6TTIm), 2·10-5 M(6TTIm-8OBA). The absorbance and the intensity are not normalized.
a) b)
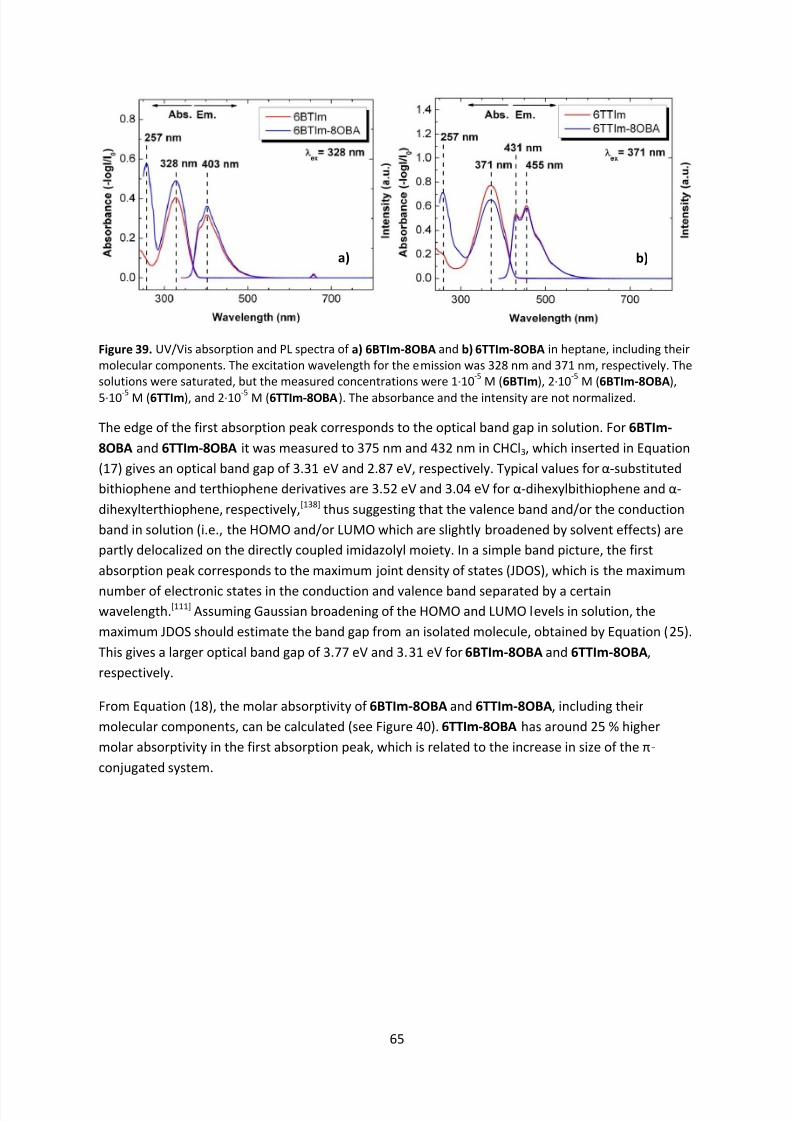
8/8/2019 Master Thesis - Jonas Sellberg
http://slidepdf.com/reader/full/master-thesis-jonas-sellberg 72/105
65
Figure 39. UV/Vis absorption and PL spectra of a) 6BTIm-8OBA and b) 6TTIm-8OBA in heptane, including theirmolecular components. The excitation wavelength for the emission was 328 nm and 371 nm, respectively. Thesolutions were saturated, but the measured concentrations were 1·10-5 M (6BTIm), 2·10-5 M (6BTIm-8OBA),
5·10-5 M (6TTIm), and 2·10-5 M (6TTIm-8OBA). The absorbance and the intensity are not normalized.
The edge of the first absorption peak corresponds to the optical band gap in solution. For 6BTIm-
8OBA and 6TTIm-8OBA it was measured to 375 nm and 432 nm in CHCl3, which inserted in Equation
(17) gives an optical band gap of 3.31 eV and 2.87 eV, respectively. Typical values for α-substituted
bithiophene and terthiophene derivatives are 3.52 eV and 3.04 eV for α-dihexylbithiophene and α-
dihexylterthiophene, respectively,[138] thus suggesting that the valence band and/or the conduction
band in solution (i.e., the HOMO and/or LUMO which are slightly broadened by solvent effects) are
partly delocalized on the directly coupled imidazolyl moiety. In a simple band picture, the first
absorption peak corresponds to the maximum joint density of states (JDOS), which is the maximum
number of electronic states in the conduction and valence band separated by a certainwavelength.[111] Assuming Gaussian broadening of the HOMO and LUMO levels in solution, the
maximum JDOS should estimate the band gap from an isolated molecule, obtained by Equation (25).
This gives a larger optical band gap of 3.77 eV and 3.31 eV for 6BTIm-8OBA and 6TTIm-8OBA,
respectively.
From Equation (18), the molar absorptivity of 6BTIm-8OBA and 6TTIm-8OBA, including their
molecular components, can be calculated (see Figure 40). 6TTIm-8OBA has around 25 % higher
molar absorptivity in the first absorption peak, which is related to the increase in size of the π-
conjugated system.
a) b)
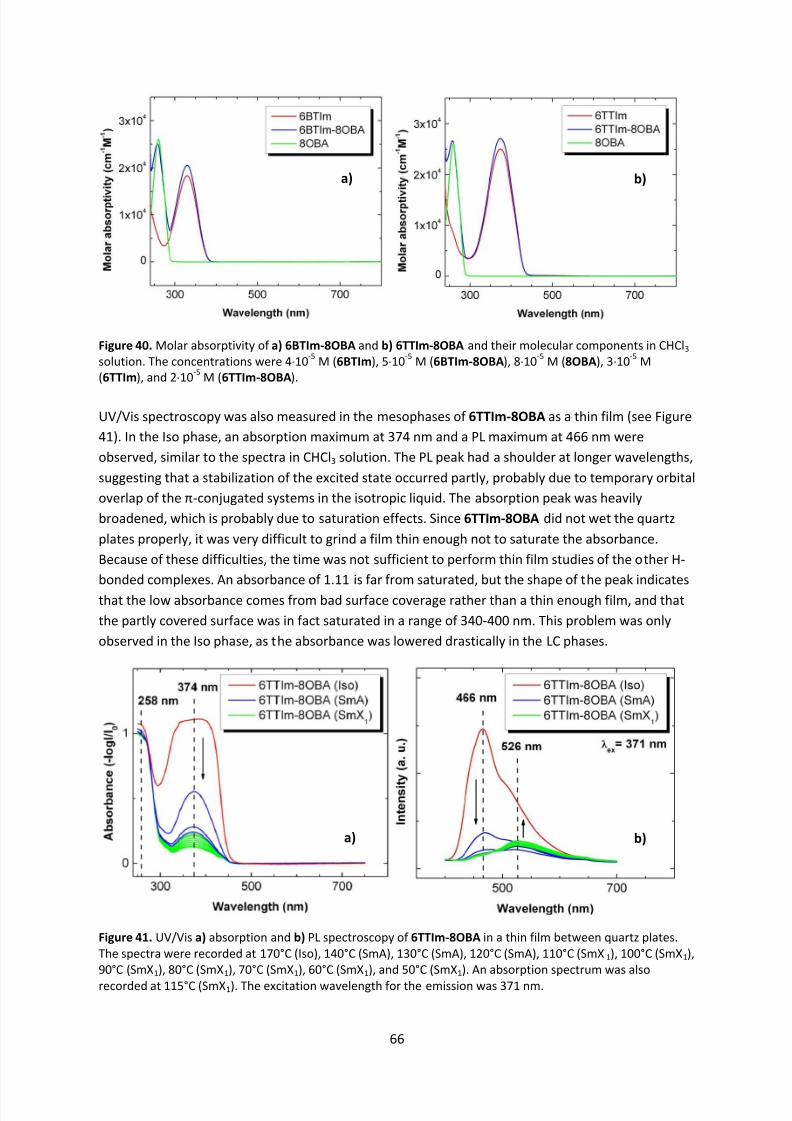
8/8/2019 Master Thesis - Jonas Sellberg
http://slidepdf.com/reader/full/master-thesis-jonas-sellberg 73/105
66
UV/Vis spectroscopy was also measured in the mesophases of 6TTIm-8OBA as a thin film (see Figure
41). In the Iso phase, an absorption maximum at 374 nm and a PL maximum at 466 nm were
observed, similar to the spectra in CHCl3 solution. The PL peak had a shoulder at longer wavelengths,
suggesting that a stabilization of the excited state occurred partly, probably due to temporary orbital
overlap of the π-conjugated systems in the isotropic liquid. The absorption peak was heavily
broadened, which is probably due to saturation effects. Since 6TTIm-8OBA did not wet the quartz
plates properly, it was very difficult to grind a film thin enough not to saturate the absorbance.
Because of these difficulties, the time was not sufficient to perform thin film studies of the other H-
bonded complexes. An absorbance of 1.11 is far from saturated, but the shape of the peak indicates
that the low absorbance comes from bad surface coverage rather than a thin enough film, and that
the partly covered surface was in fact saturated in a range of 340-400 nm. This problem was only
observed in the Iso phase, as the absorbance was lowered drastically in the LC phases.
Figure 41. UV/Vis a) absorption and b) PL spectroscopy of 6TTIm-8OBA in a thin film between quartz plates.The spectra were recorded at 170°C (Iso), 140°C (SmA), 130°C (SmA), 120°C (SmA), 110°C (SmX1), 100°C (SmX1),90°C (SmX1), 80°C (SmX1), 70°C (SmX1), 60°C (SmX1), and 50°C (SmX1). An absorption spectrum was also
recorded at 115°C (SmX1). The excitation wavelength for the emission was 371 nm.
Figure 40. Molar absorptivity of a) 6BTIm-8OBA and b) 6TTIm-8OBA and their molecular components in CHCl3 solution. The concentrations were 4·10-5 M (6BTIm), 5·10-5 M (6BTIm-8OBA), 8·10-5 M (8OBA), 3·10-5 M(6TTIm), and 2·10-5 M (6TTIm-8OBA).
a) b)
a) b)
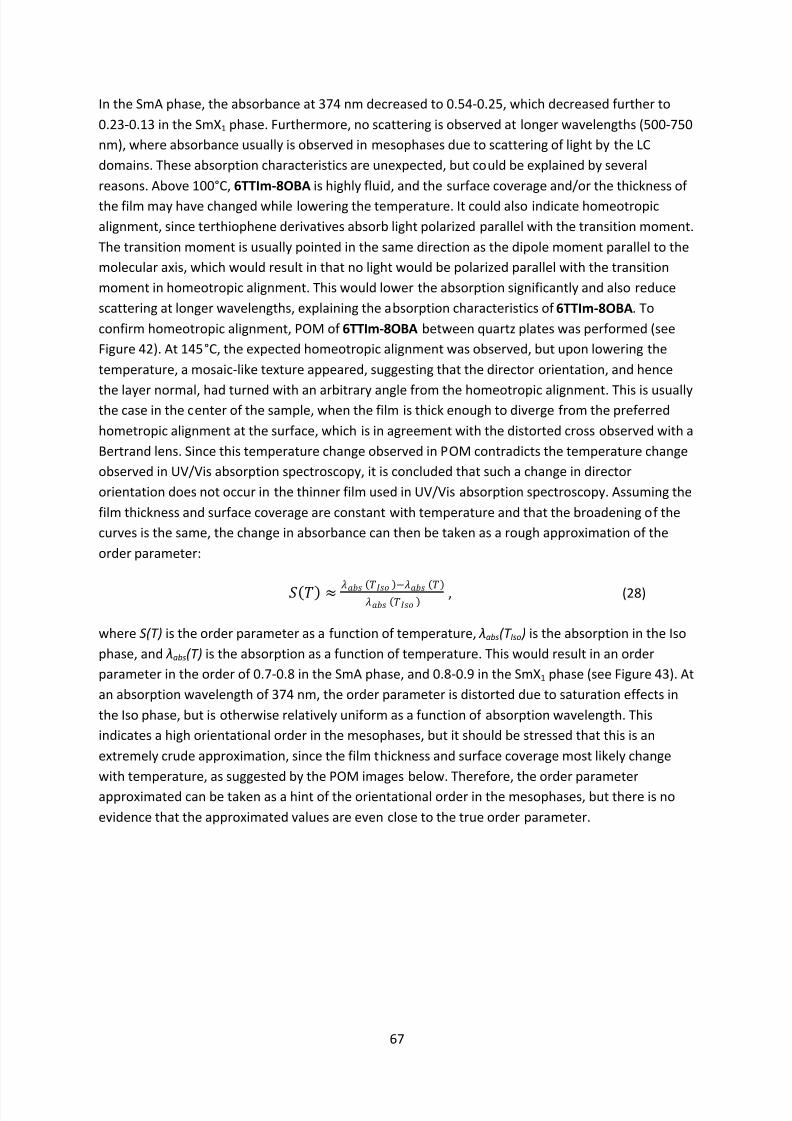
8/8/2019 Master Thesis - Jonas Sellberg
http://slidepdf.com/reader/full/master-thesis-jonas-sellberg 74/105
67
In the SmA phase, the absorbance at 374 nm decreased to 0.54-0.25, which decreased further to
0.23-0.13 in the SmX1 phase. Furthermore, no scattering is observed at longer wavelengths (500-750
nm), where absorbance usually is observed in mesophases due to scattering of light by the LC
domains. These absorption characteristics are unexpected, but could be explained by several
reasons. Above 100°C, 6TTIm-8OBA is highly fluid, and the surface coverage and/or the thickness of
the film may have changed while lowering the temperature. It could also indicate homeotropic
alignment, since terthiophene derivatives absorb light polarized parallel with the transition moment.
The transition moment is usually pointed in the same direction as the dipole moment parallel to the
molecular axis, which would result in that no light would be polarized parallel with the transition
moment in homeotropic alignment. This would lower the absorption significantly and also reduce
scattering at longer wavelengths, explaining the absorption characteristics of 6TTIm-8OBA. To
confirm homeotropic alignment, POM of 6TTIm-8OBA between quartz plates was performed (see
Figure 42). At 145°C, the expected homeotropic alignment was observed, but upon lowering the
temperature, a mosaic-like texture appeared, suggesting that the director orientation, and hence
the layer normal, had turned with an arbitrary angle from the homeotropic alignment. This is usuallythe case in the center of the sample, when the film is thick enough to diverge from the preferred
hometropic alignment at the surface, which is in agreement with the distorted cross observed with a
Bertrand lens. Since this temperature change observed in POM contradicts the temperature change
observed in UV/Vis absorption spectroscopy, it is concluded that such a change in director
orientation does not occur in the thinner film used in UV/Vis absorption spectroscopy. Assuming the
film thickness and surface coverage are constant with temperature and that the broadening of the
curves is the same, the change in absorbance can then be taken as a rough approximation of the
order parameter:
≈ − , (28)
where S(T) is the order parameter as a function of temperature, λabs(T Iso ) is the absorption in the Iso
phase, and λabs(T) is the absorption as a function of temperature. This would result in an order
parameter in the order of 0.7-0.8 in the SmA phase, and 0.8-0.9 in the SmX1 phase (see Figure 43). At
an absorption wavelength of 374 nm, the order parameter is distorted due to saturation effects in
the Iso phase, but is otherwise relatively uniform as a function of absorption wavelength. This
indicates a high orientational order in the mesophases, but it should be stressed that this is an
extremely crude approximation, since the film thickness and surface coverage most likely change
with temperature, as suggested by the POM images below. Therefore, the order parameter
approximated can be taken as a hint of the orientational order in the mesophases, but there is no
evidence that the approximated values are even close to the true order parameter.
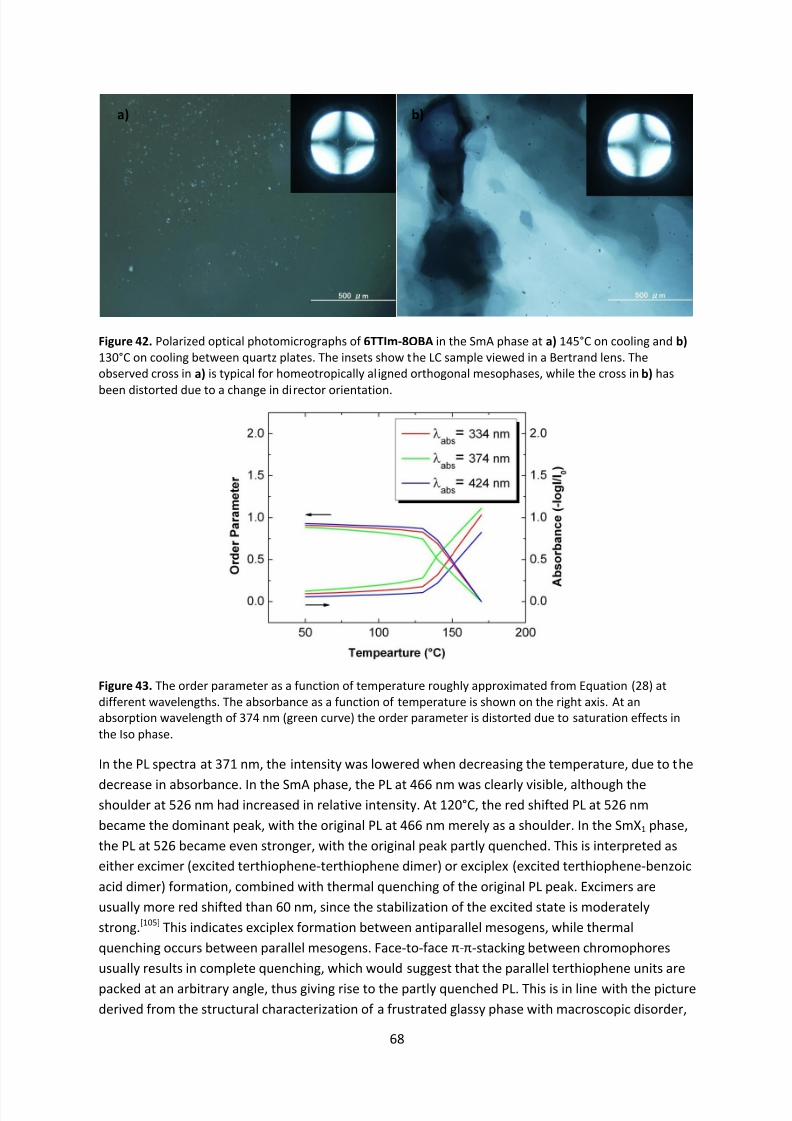
8/8/2019 Master Thesis - Jonas Sellberg
http://slidepdf.com/reader/full/master-thesis-jonas-sellberg 75/105
68
Figure 42. Polarized optical photomicrographs of 6TTIm-8OBA in the SmA phase at a) 145°C on cooling and b) 130°C on cooling between quartz plates. The insets show the LC sample viewed in a Bertrand lens. Theobserved cross in a) is typical for homeotropically aligned orthogonal mesophases, while the cross in b) has
been distorted due to a change in director orientation.
Figure 43. The order parameter as a function of temperature roughly approximated from Equation (28) atdifferent wavelengths. The absorbance as a function of temperature is shown on the right axis. At anabsorption wavelength of 374 nm (green curve) the order parameter is distorted due to saturation effects inthe Iso phase.
In the PL spectra at 371 nm, the intensity was lowered when decreasing the temperature, due to the
decrease in absorbance. In the SmA phase, the PL at 466 nm was clearly visible, although theshoulder at 526 nm had increased in relative intensity. At 120°C, the red shifted PL at 526 nm
became the dominant peak, with the original PL at 466 nm merely as a shoulder. In the SmX1 phase,
the PL at 526 became even stronger, with the original peak partly quenched. This is interpreted as
either excimer (excited terthiophene-terthiophene dimer) or exciplex (excited terthiophene-benzoic
acid dimer) formation, combined with thermal quenching of the original PL peak. Excimers are
usually more red shifted than 60 nm, since the stabilization of the excited state is moderately
strong.[105] This indicates exciplex formation between antiparallel mesogens, while thermal
quenching occurs between parallel mesogens. Face-to-face π-π-stacking between chromophores
usually results in complete quenching, which would suggest that the parallel terthiophene units are
packed at an arbitrary angle, thus giving rise to the partly quenched PL. This is in line with the picture
derived from the structural characterization of a frustrated glassy phase with macroscopic disorder,
a) b)
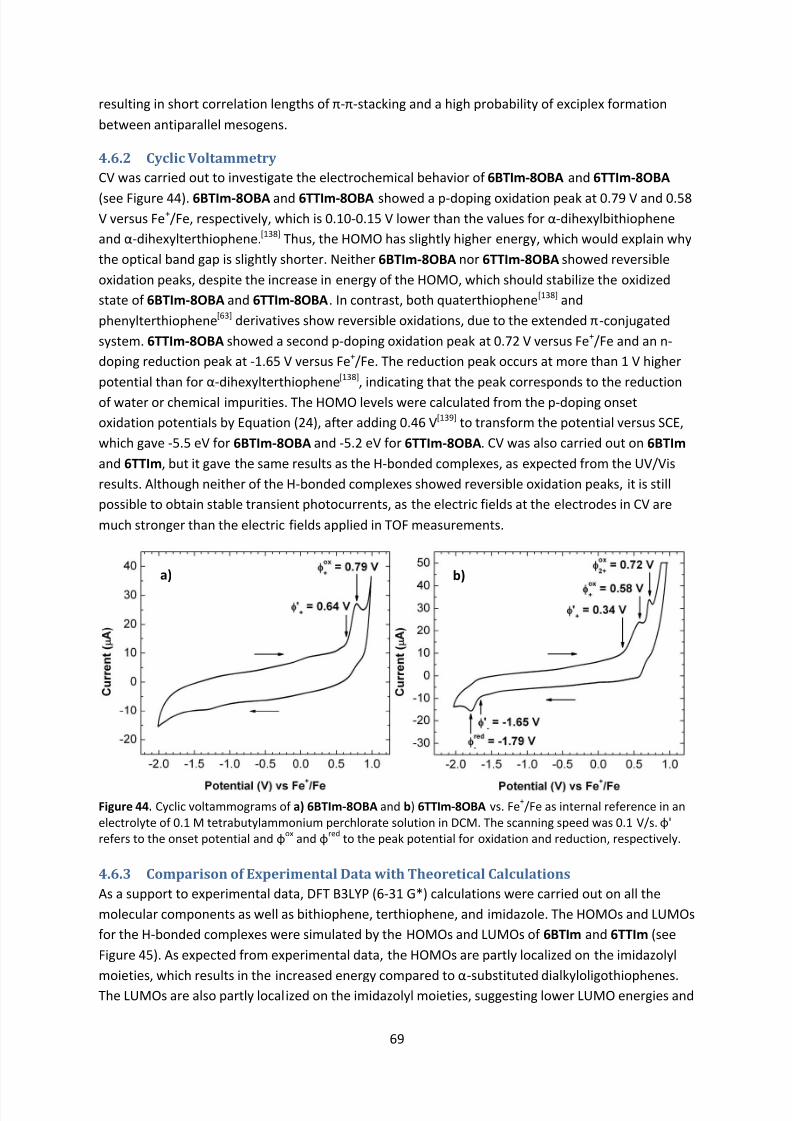
8/8/2019 Master Thesis - Jonas Sellberg
http://slidepdf.com/reader/full/master-thesis-jonas-sellberg 76/105
69
resulting in short correlation lengths of π-π-stacking and a high probability of exciplex formation
between antiparallel mesogens.
4.6.2 Cyclic Voltammetry
CV was carried out to investigate the electrochemical behavior of 6BTIm-8OBA and 6TTIm-8OBA
(see Figure 44). 6BTIm-8OBA and 6TTIm-8OBA showed a p-doping oxidation peak at 0.79 V and 0.58V versus Fe+/Fe, respectively, which is 0.10-0.15 V lower than the values for α-dihexylbithiophene
and α-dihexylterthiophene.[138] Thus, the HOMO has slightly higher energy, which would explain why
the optical band gap is slightly shorter. Neither 6BTIm-8OBA nor 6TTIm-8OBA showed reversible
oxidation peaks, despite the increase in energy of the HOMO, which should stabilize the oxidized
state of 6BTIm-8OBA and 6TTIm-8OBA. In contrast, both quaterthiophene[138] and
phenylterthiophene[63] derivatives show reversible oxidations, due to the extended π-conjugated
system. 6TTIm-8OBA showed a second p-doping oxidation peak at 0.72 V versus Fe+/Fe and an n-
doping reduction peak at -1.65 V versus Fe+/Fe. The reduction peak occurs at more than 1 V higher
potential than for α-dihexylterthiophene[138], indicating that the peak corresponds to the reduction
of water or chemical impurities. The HOMO levels were calculated from the p-doping onset
oxidation potentials by Equation (24), after adding 0.46 V[139] to transform the potential versus SCE,
which gave -5.5 eV for 6BTIm-8OBA and -5.2 eV for 6TTIm-8OBA. CV was also carried out on 6BTIm
and 6TTIm, but it gave the same results as the H-bonded complexes, as expected from the UV/Vis
results. Although neither of the H-bonded complexes showed reversible oxidation peaks, it is still
possible to obtain stable transient photocurrents, as the electric fields at the electrodes in CV are
much stronger than the electric fields applied in TOF measurements.
4.6.3 Comparison of Experimental Data with Theoretical Calculations
As a support to experimental data, DFT B3LYP (6-31 G*) calculations were carried out on all the
molecular components as well as bithiophene, terthiophene, and imidazole. The HOMOs and LUMOs
for the H-bonded complexes were simulated by the HOMOs and LUMOs of 6BTIm and 6TTIm (see
Figure 45). As expected from experimental data, the HOMOs are partly localized on the imidazolyl
moieties, which results in the increased energy compared to α-substituted dialkyloligothiophenes.The LUMOs are also partly localized on the imidazolyl moieties, suggesting lower LUMO energies and
Figure 44. Cyclic voltammograms of a) 6BTIm-8OBA and b) 6TTIm-8OBA vs. Fe+/Fe as internal reference in anelectrolyte of 0.1 M tetrabutylammonium perchlorate solution in DCM. The scanning speed was 0.1 V/s. φ'
refers to the onset potential and φox and φ
red to the peak potential for oxidation and reduction, respectively.
a) b)
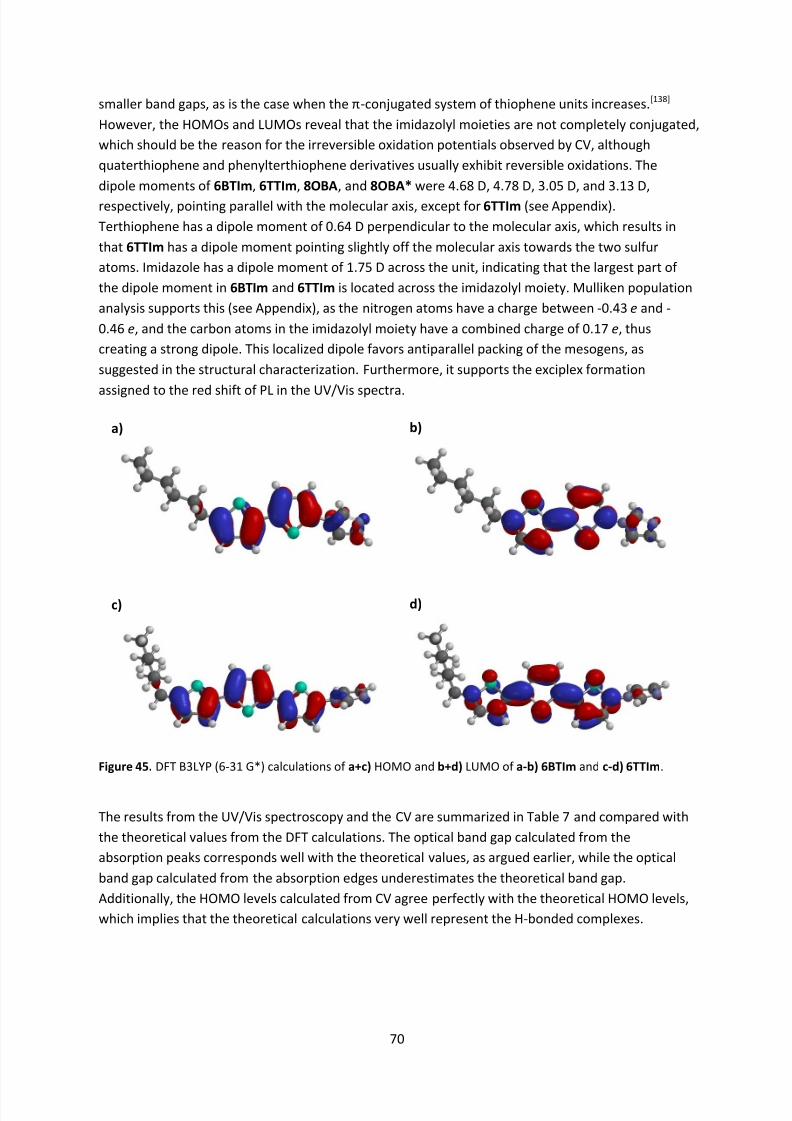
8/8/2019 Master Thesis - Jonas Sellberg
http://slidepdf.com/reader/full/master-thesis-jonas-sellberg 77/105
70
smaller band gaps, as is the case when the π-conjugated system of thiophene units increases.[138]
However, the HOMOs and LUMOs reveal that the imidazolyl moieties are not completely conjugated,
which should be the reason for the irreversible oxidation potentials observed by CV, although
quaterthiophene and phenylterthiophene derivatives usually exhibit reversible oxidations. The
dipole moments of 6BTIm, 6TTIm, 8OBA, and 8OBA* were 4.68 D, 4.78 D, 3.05 D, and 3.13 D,
respectively, pointing parallel with the molecular axis, except for 6TTIm (see Appendix).
Terthiophene has a dipole moment of 0.64 D perpendicular to the molecular axis, which results in
that 6TTIm has a dipole moment pointing slightly off the molecular axis towards the two sulfur
atoms. Imidazole has a dipole moment of 1.75 D across the unit, indicating that the largest part of
the dipole moment in 6BTIm and 6TTIm is located across the imidazolyl moiety. Mulliken population
analysis supports this (see Appendix), as the nitrogen atoms have a charge between -0.43 e and -
0.46 e, and the carbon atoms in the imidazolyl moiety have a combined charge of 0.17 e, thus
creating a strong dipole. This localized dipole favors antiparallel packing of the mesogens, as
suggested in the structural characterization. Furthermore, it supports the exciplex formation
assigned to the red shift of PL in the UV/Vis spectra.
Figure 45. DFT B3LYP (6-31 G*) calculations of a+c) HOMO and b+d) LUMO of a-b) 6BTIm and c-d) 6TTIm.
The results from the UV/Vis spectroscopy and the CV are summarized in Table 7 and compared with
the theoretical values from the DFT calculations. The optical band gap calculated from the
absorption peaks corresponds well with the theoretical values, as argued earlier, while the optical
band gap calculated from the absorption edges underestimates the theoretical band gap.
Additionally, the HOMO levels calculated from CV agree perfectly with the theoretical HOMO levels,
which implies that the theoretical calculations very well represent the H-bonded complexes.
a) b)
c) d)

8/8/2019 Master Thesis - Jonas Sellberg
http://slidepdf.com/reader/full/master-thesis-jonas-sellberg 78/105
71
4.6.4 Polarization Switching
Polarization switching was carried out to check if any of the supramolecular complexes possessed
chiral properties, such as spontaneous polarization or the electroclinic effect. If the phases were
chiral, it would be likely that switching between polarized states would be observable. However, no
such effects were observed, which strengthens the assignment of the mesophases of 6BTIm-8OBA*
and 6TTIm-8OBA* as SmA and SmX2 phases, respectively. The lack of chiral properties is probably
due to the orthogonal character of the mesophases, but it should not be excluded that it could be a
sign of low ee of 8OBA*.
4.7 Semiconducting Properties
The semiconducting properties of the H-bonded complexes were explored by the TOF technique.
Before distillation, all samples decomposed when applying the DC voltage, thus resulting in large
background currents between 10-1000 µA followed by bubble formation and irreversible texture
changes in the films. Blocking cells were tested without significant improvement of sample stability.
For 6BTIm-8OBA and 6BTIm-8OBA* after distillation, high background currents of 1-5 µA were still
observed when applying the DC voltage, which made it very difficult to obtain high quality
photocurrent curves. The background currents came from electrochemical double layer formation
and charge injection by ionic impurities, which resulted in carrier mobilities dominated by ionic
carrier mobility[130] in the order of 10-6 cm2V-1s-1 (see Figure 46). 6TTIm-8OBA* showed similar
background current characteristics, but stable photocurrents could not be obtained at all and the
samples decomposed above 80 V. This is in line with the conclusions drawn in POM under applied
electric fields, where 6BTIm-8OBA, 6BTIm-8OBA*, as well as 6TTIm-8OBA* observed texture
changes associated with ionic mobility.
Table 7. Table of electronic properties for 6BTIm-8OBA and 6TTIm-8OBA calculated from UV/Vis spectroscopy, CV,and DFT calculations. HOMO levels were calculated from the onset potential in CV by Equation (24). The opticalband gap was calculated from UV/Vis spectroscopy by Equation (17).
Compound φ'+ (V vs. SCE)
/ HOMO (eV)
λ edge (nm)
/ Eg (eV)
λ peak (nm)
/ Eg (eV)
Eg,DFT (eV) HOMODFT (eV) LUMODFT (eV)
6BTIm-8OBA 1.10 / -5.50 375 / 3.31 329 / 3.77 4.02 -5.51 -1.506TTIm-8OBA 0.80 / -5.20 432 / 2.87 374 / 3.31 3.38 -5,24 -1.85
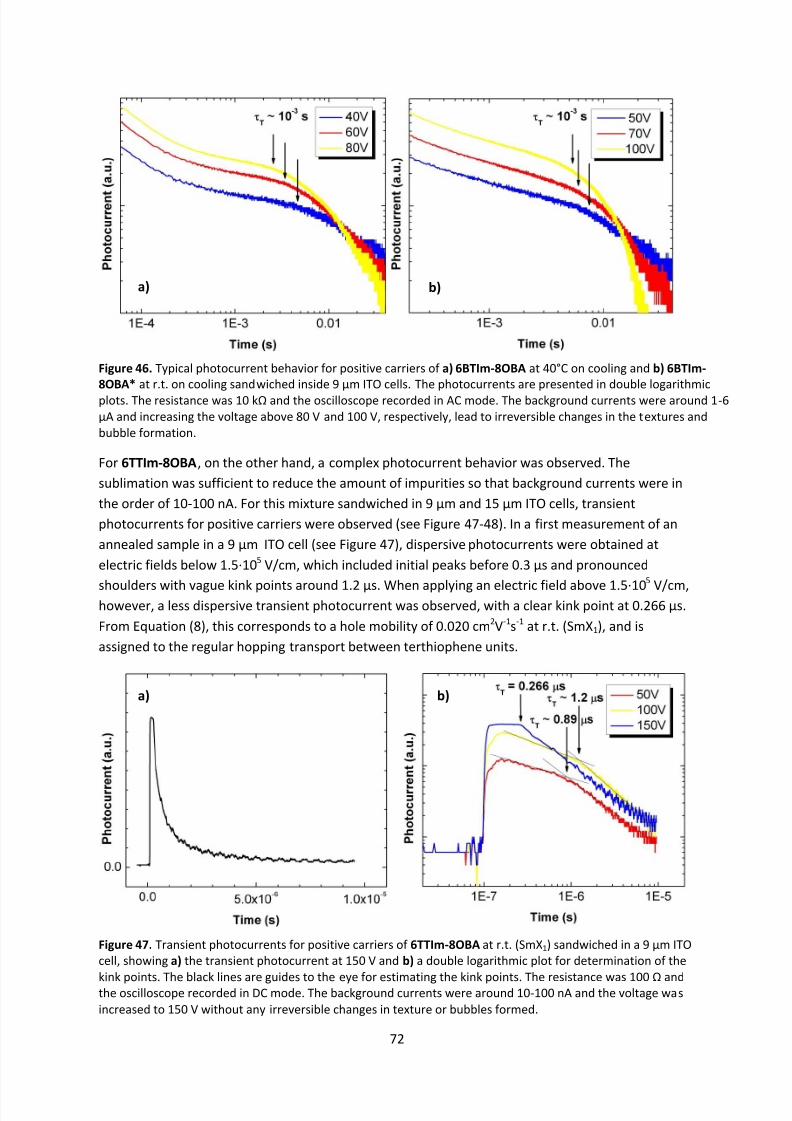
8/8/2019 Master Thesis - Jonas Sellberg
http://slidepdf.com/reader/full/master-thesis-jonas-sellberg 79/105
72
For 6TTIm-8OBA, on the other hand, a complex photocurrent behavior was observed. The
sublimation was sufficient to reduce the amount of impurities so that background currents were in
the order of 10-100 nA. For this mixture sandwiched in 9 µm and 15 µm ITO cells, transient
photocurrents for positive carriers were observed (see Figure 47-48). In a first measurement of an
annealed sample in a 9 µm ITO cell (see Figure 47), dispersive photocurrents were obtained at
electric fields below 1.5·105 V/cm, which included initial peaks before 0.3 µs and pronounced
shoulders with vague kink points around 1.2 µs. When applying an electric field above 1.5·105
V/cm,however, a less dispersive transient photocurrent was observed, with a clear kink point at 0.266 µs.
From Equation (8), this corresponds to a hole mobility of 0.020 cm2V-1s-1 at r.t. (SmX1), and is
assigned to the regular hopping transport between terthiophene units.
Figure 47. Transient photocurrents for positive carriers of 6TTIm-8OBA at r.t. (SmX1) sandwiched in a 9 µm ITOcell, showing a) the transient photocurrent at 150 V and b) a double logarithmic plot for determination of the
kink points. The black lines are guides to the eye for estimating the kink points. The resistance was 100 Ω andthe oscilloscope recorded in DC mode. The background currents were around 10-100 nA and the voltage wasincreased to 150 V without any irreversible changes in texture or bubbles formed.
Figure 46. Typical photocurrent behavior for positive carriers of a) 6BTIm-8OBA at 40°C on cooling and b) 6BTIm-
8OBA* at r.t. on cooling sandwiched inside 9 µm ITO cells. The photocurrents are presented in double logarithmicplots. The resistance was 10 kΩ and the oscilloscope recorded in AC mode. The background currents were around 1-6µA and increasing the voltage above 80 V and 100 V, respectively, lead to irreversible changes in the textures andbubble formation.
a) b)
a) b)
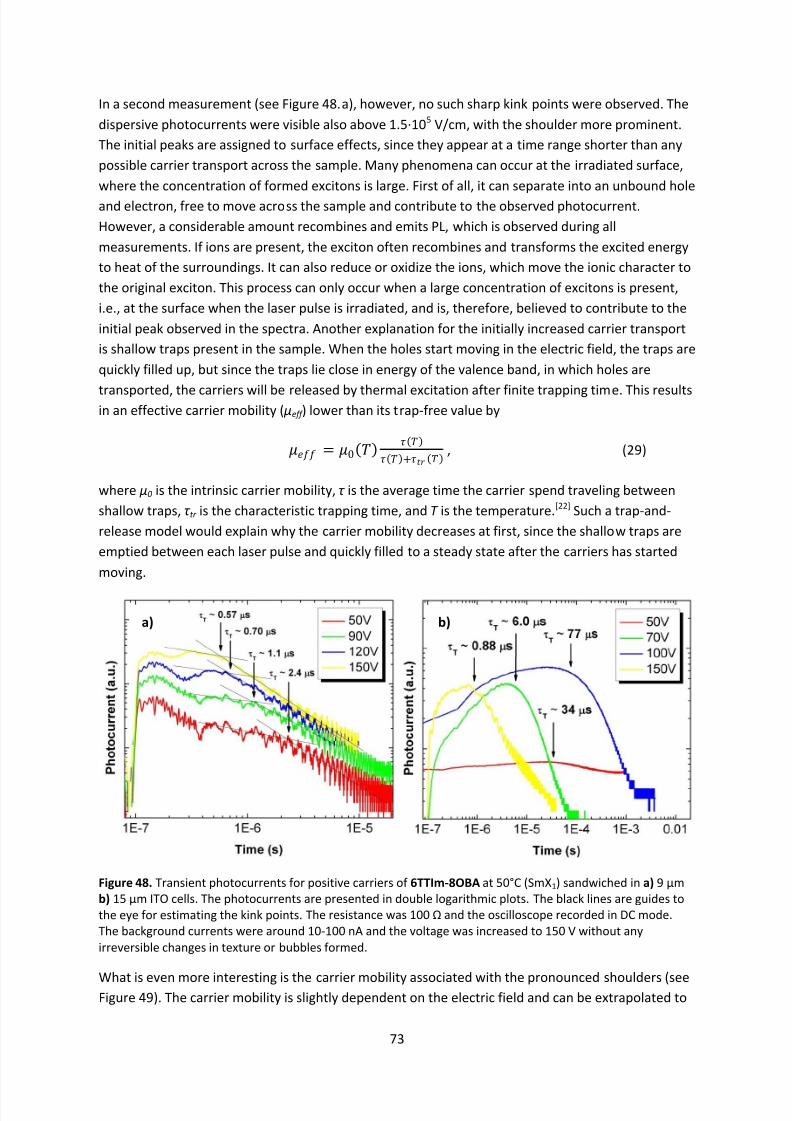
8/8/2019 Master Thesis - Jonas Sellberg
http://slidepdf.com/reader/full/master-thesis-jonas-sellberg 80/105
73
In a second measurement (see Figure 48.a), however, no such sharp kink points were observed. The
dispersive photocurrents were visible also above 1.5·105 V/cm, with the shoulder more prominent.
The initial peaks are assigned to surface effects, since they appear at a time range shorter than any
possible carrier transport across the sample. Many phenomena can occur at the irradiated surface,
where the concentration of formed excitons is large. First of all, it can separate into an unbound hole
and electron, free to move across the sample and contribute to the observed photocurrent.
However, a considerable amount recombines and emits PL, which is observed during all
measurements. If ions are present, the exciton often recombines and transforms the excited energy
to heat of the surroundings. It can also reduce or oxidize the ions, which move the ionic character to
the original exciton. This process can only occur when a large concentration of excitons is present,
i.e., at the surface when the laser pulse is irradiated, and is, therefore, believed to contribute to the
initial peak observed in the spectra. Another explanation for the initially increased carrier transport
is shallow traps present in the sample. When the holes start moving in the electric field, the traps are
quickly filled up, but since the traps lie close in energy of the valence band, in which holes are
transported, the carriers will be released by thermal excitation after finite trapping time. This resultsin an effective carrier mobility ( µeff ) lower than its trap-free value by
= 0 + , (29)
where µ0 is the intrinsic carrier mobility, τ is the average time the carrier spend traveling between
shallow traps, τ tr is the characteristic trapping time, and T is the temperature.[22] Such a trap-and-
release model would explain why the carrier mobility decreases at first, since the shallow traps are
emptied between each laser pulse and quickly filled to a steady state after the carriers has started
moving.
Figure 48. Transient photocurrents for positive carriers of 6TTIm-8OBA at 50°C (SmX1) sandwiched in a) 9 µmb) 15 µm ITO cells. The photocurrents are presented in double logarithmic plots. The black lines are guides tothe eye for estimating the kink points. The resistance was 100 Ω and the oscilloscope recorded in DC mode.
The background currents were around 10-100 nA and the voltage was increased to 150 V without anyirreversible changes in texture or bubbles formed.
What is even more interesting is the carrier mobility associated with the pronounced shoulders (seeFigure 49). The carrier mobility is slightly dependent on the electric field and can be extrapolated to
a) b)

8/8/2019 Master Thesis - Jonas Sellberg
http://slidepdf.com/reader/full/master-thesis-jonas-sellberg 81/105
74
zero electric field by Equation (9), if the Gaussian disorder model is assumed to be valid, which gives
a zero-field mobility of 0.0024 cm2V-1s-1 at 50°C (SmX1). The hole mobility is several times lower than
the regular hopping transport observed in the first measurement, thus indicating that a second type
of hopping transport is present. This behavior is assigned to hopping transport between exciplexes,
since UV/Vis spectroscopy indicates that a high amount of exciplexes are formed after exciting the
sample. The frustrated glassy structure already proposed would allow antiparallel mesogens to
conduct by the exciplex hopping transport, while parallel mesogens transport holes by the faster,
regular hopping transport, thereby enabling such a complex transport behavior to be observed.
There are no methods available which could directly prove the proposed transport mechanism, but
the structural characterization together with the performed spectroscopic results indicate that a
second transport mechanism would be plausible. The assigned hopping transport of the observed
transient photocurrents is summarized in Table 8.
In a measurement of an annealed sample in a 15 µm ITO cell, the observed photocurrents were
highly unstable (see Figure 48.b). At low electric fields strengths, the sample showed a strong signal
that fluctuated over an order of magnitude. At a stronger electric field, the transient photocurrent
resembled the carrier mobility obtained by regular hopping transport for a short time, before the
signal was severely weakened. This indicates that the transient photocurrents observed are unstable
and that it is difficult to control the complex transport characteristics. It becomes even more evident
at elevated temperatures. In the SmA phase and the temperature region where the SmX1 phase is
thermodynamically favored, no clear photocurrents were visible at all, suggesting that the decrease
in viscosity makes effective carrier transport impossible. This could be explained by the increased
disorder, which lowers the transfer integrals and makes the exciplex formation more localized. Thus,
recombination becomes dominant and PL governs the laser irradiated sample. The limited range of
effect carrier transport may indicate that the transient photocurrents occur in a crystal phaseinitiated by the strong electric field, as reversible texture changes sometimes were visible after the
TOF measurement.
Figure 49. Estimated hole mobility as a function of the square root of the electric field in the secondmeasurement of 6TTIm-8OBA in a 9 µm ITO cell at 50°C. The hole mobilities are fitted to a line (adjusted R2 =0.787) with intercept 0.00237 and slope 1.80·10-5.

8/8/2019 Master Thesis - Jonas Sellberg
http://slidepdf.com/reader/full/master-thesis-jonas-sellberg 82/105
75
Table 8. Table of photocurrent characteristics for 6TTIm-8OBA in ITO cells.
Temperature (°C) Thickness of
Cell (µm)
Applied
Voltage (V)
Electric
Field (V/cm)
Transient
Time(µs)
Hole Mobility
(cm2V-1s-1)
Suggested
Hopping
Mechanism25 9 50 5.56·104 0.89 0.018 Regular25 9 100 1.11·105 1.2 0.0068 Exciplex25 9 150 1.67·105 0.266 0.0203 Regular50 9 50 5.56·104 2.4 0.0068 Exciplex50 9 90 1.00·105 1.2 0.0075 Exciplex50 9 120 1.33·105 0.7 0.0096 Exciplex50 9 150 1.67·105 0.57 0.0095 Exciplex50 15 150 1.00·105 0.88 0.017 Regular
To resolve the complex issue of carrier transport in H-bonded complexes, additional studies of a
variety of complexes are needed. It would be especially interesting to study the transport
characteristics of an H-bonded complex, in which the donor as well as the acceptor are
semiconducting. H-bonded complexes of one p-type and one n-type semi conductor could
potentially be applied as high-performance heterojunctions, as the interface area would be vast and
the diffusion length of excitons would be minimal. If the carrier transport can be controlled, the
future is bright for supramolecular liquid crystals as advanced functional materials.
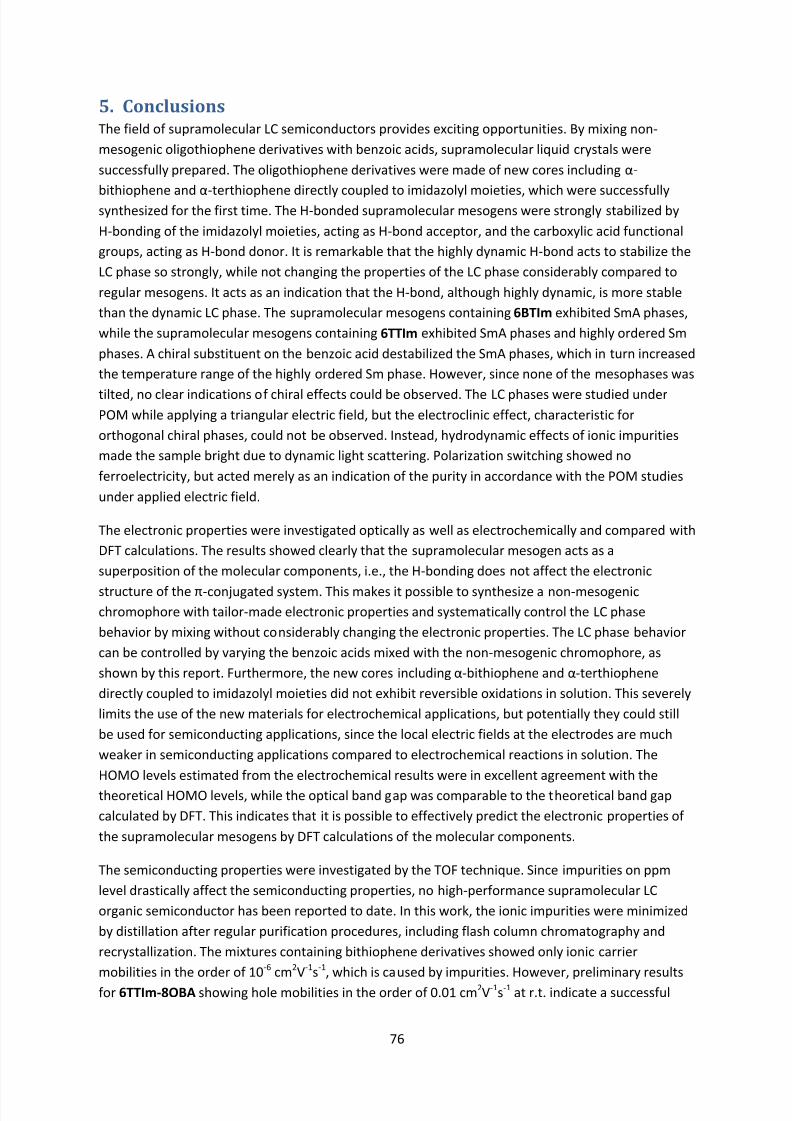
8/8/2019 Master Thesis - Jonas Sellberg
http://slidepdf.com/reader/full/master-thesis-jonas-sellberg 83/105
76
5. ConclusionsThe field of supramolecular LC semiconductors provides exciting opportunities. By mixing non-
mesogenic oligothiophene derivatives with benzoic acids, supramolecular liquid crystals were
successfully prepared. The oligothiophene derivatives were made of new cores including α-
bithiophene and α-terthiophene directly coupled to imidazolyl moieties, which were successfullysynthesized for the first time. The H-bonded supramolecular mesogens were strongly stabilized by
H-bonding of the imidazolyl moieties, acting as H-bond acceptor, and the carboxylic acid functional
groups, acting as H-bond donor. It is remarkable that the highly dynamic H-bond acts to stabilize the
LC phase so strongly, while not changing the properties of the LC phase considerably compared to
regular mesogens. It acts as an indication that the H-bond, although highly dynamic, is more stable
than the dynamic LC phase. The supramolecular mesogens containing 6BTIm exhibited SmA phases,
while the supramolecular mesogens containing 6TTIm exhibited SmA phases and highly ordered Sm
phases. A chiral substituent on the benzoic acid destabilized the SmA phases, which in turn increased
the temperature range of the highly ordered Sm phase. However, since none of the mesophases was
tilted, no clear indications of chiral effects could be observed. The LC phases were studied underPOM while applying a triangular electric field, but the electroclinic effect, characteristic for
orthogonal chiral phases, could not be observed. Instead, hydrodynamic effects of ionic impurities
made the sample bright due to dynamic light scattering. Polarization switching showed no
ferroelectricity, but acted merely as an indication of the purity in accordance with the POM studies
under applied electric field.
The electronic properties were investigated optically as well as electrochemically and compared with
DFT calculations. The results showed clearly that the supramolecular mesogen acts as a
superposition of the molecular components, i.e., the H-bonding does not affect the electronic
structure of the π-conjugated system. This makes it possible to synthesize a non-mesogenicchromophore with tailor-made electronic properties and systematically control the LC phase
behavior by mixing without considerably changing the electronic properties. The LC phase behavior
can be controlled by varying the benzoic acids mixed with the non-mesogenic chromophore, as
shown by this report. Furthermore, the new cores including α-bithiophene and α-terthiophene
directly coupled to imidazolyl moieties did not exhibit reversible oxidations in solution. This severely
limits the use of the new materials for electrochemical applications, but potentially they could still
be used for semiconducting applications, since the local electric fields at the electrodes are much
weaker in semiconducting applications compared to electrochemical reactions in solution. The
HOMO levels estimated from the electrochemical results were in excellent agreement with the
theoretical HOMO levels, while the optical band gap was comparable to the theoretical band gap
calculated by DFT. This indicates that it is possible to effectively predict the electronic properties of
the supramolecular mesogens by DFT calculations of the molecular components.
The semiconducting properties were investigated by the TOF technique. Since impurities on ppm
level drastically affect the semiconducting properties, no high-performance supramolecular LC
organic semiconductor has been reported to date. In this work, the ionic impurities were minimized
by distillation after regular purification procedures, including flash column chromatography and
recrystallization. The mixtures containing bithiophene derivatives showed only ionic carrier
mobilities in the order of 10-6 cm2V-1s-1, which is caused by impurities. However, preliminary results
for 6TTIm-8OBA showing hole mobilities in the order of 0.01 cm2V-1s-1 at r.t. indicate a successful
8/8/2019 Master Thesis - Jonas Sellberg
http://slidepdf.com/reader/full/master-thesis-jonas-sellberg 84/105
77
approach to future supramolecular LC semiconductor designs, although the results were difficult to
reproduce.
A hypothesis for the structure of the highly ordered Sm phases was presented. The lack of clear
peaks in the wide angle region of the WAXS spectra implied that only local order with short
correlation lengths exists within the layers. This could be explained by the frustration betweenimidazolyl moieties favoring antiparallel packing and terthiophene units favoring parallel packing,
thus forming a glassy state at lower temperatures with complex electro-optical characteristics. In
UV/Vis spectroscopy on thin films of 6TTIm-8OBA, thermal quenching and exciplex formation were
visible simultaneously. In TOF measurements of 6TTIm-8OBA, regular hopping transport was
competing with hopping transport between exciplexes, thereby resulting in a hole mobility in the
order of 0.001 cm2V-1s-1 at 50°C. At higher temperatures, neither regular hopping transport nor
exciplex hopping transport could be observed, since recombination was favored. A strategy for
controlling the transport characteristics of supramolecular complexes is necessary to develop high-
performance supramolecular LC organic semiconductors.
To summarize, this work indicates that supramolecular LC organic semiconductors can be created by
mixing oligothiophene derivatives containing imidazolyl moieties with benzoic acids. The LC phase
behavior and the electronic properties can be controlled by carefully choosing molecular
components. To meet the demand of high purity, sublimation or distillation is required, which makes
thermal stability of the molecular components a necessity. Continued efforts in optimizing
purification methods and controlling transport characteristics should render it possible to produce
supramolecular LC organic semiconductors with high mobility and reproducibility.

8/8/2019 Master Thesis - Jonas Sellberg
http://slidepdf.com/reader/full/master-thesis-jonas-sellberg 85/105
78
6. AcknowledgementsFirst of all, I would like to thank Prof. Takashi Kato for letting me work in his laboratory and alwaysencouraging me to improve as a scientist and Prof. István Furó for setting up the exchange project. Iwould also like to express my gratitude to Mr. Atsushi Seki and Prof. Masahiro Funahashi forinvaluable guidance. In the weekly meetings, I would like to thank Dr. Emi Uchida, Dr. Yuki Hirai, Ms.
Sanami Yazaki, Ms. Yoshiko Shoji, Ms. Aya Matsui, Mr. Shogo Yamane, Ms. Midori Nuita, Mr. ZhangZheng, and Mr. Junji Sakuda for helpful discussions. I would also like to thank everybody else in Katolaboratory for making my stay in Japan special.
I am deeply grateful to Stiftelsen Marcus och Amalia Wallenbergs Minnesfond , Paulssons
Minnesfond , and Stenhagens Fond for supporting my stay in Japan. Finally, I would like to thank mymum for proof reading and I-Chun for supporting me every day of the project, come rain or comeshine. Thank you.
7. Concluding Remarks
All cited text in this thesis has been credited to their authors. All data is my original and have notbeen manipulated. All figures have been made by me.
8/8/2019 Master Thesis - Jonas Sellberg
http://slidepdf.com/reader/full/master-thesis-jonas-sellberg 86/105
79
8. References[1] T. Kato, Science, 2002, 295, 2414-2418.[2] I. Dierking, Textures of Liquid Crystals, Wiley-VCH, Weinheim, 2003.[3] H. Maeda, M. Funahashi, J. Hanna, Molecular Crystals and Liquid Crystals Science &
Technology, Section A, 2000, 346, 183-192.
[4] I. W. Hamley, Introduction to Soft Matter , Revised ed., John Wiley & Sons, Chichester, 2007.[5] P. J. Collings, Liquid Crystals: Nature's Delicate Phase of Matter , 2nd ed., Princeton University
Press, Princeton and Oxford, 2002.[6] M. Yoshio, T. Kagata, K. Hoshino, T. Mukai, H. Ohno, T. Kato, Journal of the American
Chemical Society , 2006, 128, 5570-5577.[7] T. Kato, N. Mizoshita, K. Kishimoto, Angewandte Chemie-International Edition, 2006, 45, 38-
68.[8] Z. Zheng, K.-H. Yim, M. S. M. Saifullah, M. E. Welland, R. H. Friend, J.-S. Kim, W. T. S. Huck,
Nano Letters, 2007, 7 , 987-992.[9] D. J. Broer, J. Lub, G. N. Mol, Nature, 1995, 378, 467-469.[10] N. Sakai, Y. Kamikawa, M. Nishii, T. Matsuoka, T. Kato, S. Matile, Journal of the American
Chemical Society , 2006, 128, 2218-2219.[11] D. Braga, G. Horowitz, Advanced Materials, 2009, 21, 1473-1486.[12] M. Funahashi, Transworld Research Network, Recent Development of Applied Physics, 2003,
6, 839-857.[13] M. Funahashi, Polymer Journal , 2009, 41, 459-469.[14] M. Funahashi, J. Hanna, Applied Physics Letters, 2000, 76, 2574-2576.[15] M. Funahashi, J. Hanna, Applied Physics Letters, 1997, 71, 602-604.[16] M. Funahashi, J. Hanna, Physical Review Letters, 1997, 78, 2184-2187.[17] M. Funahashi, J. Hanna, Applied Physics Letters, 1998, 73, 3733-3735.[18] K.-i. Okamoto, S. Nakajima, M. Ueda, A. Itaya, S. Kusabayashi, Bulletin of the Chemical
Society of Japan, 1983, 56, 3830-3832.
[19] Y. Shimizu, K. Shigeta, S. Kusabayashi, Molecular Crystals and Liquid Crystals, 1986, 140, 105-117.
[20] G. Horowitz, Advanced Materials, 1998, 10, 365-377.[21] M. Vanderauweraer, F. C. Deschryver, P. M. Borsenberger, H. Bässler, Advanced Materials,
1994, 6, 199-213.[22] M. E. Gershenson, V. Podzorov, A. F. Morpurgo, Reviews of Modern Physics, 2006, 78, 973-
989.[23] A. van Breemen, P. T. Herwig, C. H. T. Chlon, J. Sweelssen, H. F. M. Schoo, S. Setayesh, W. M.
Hardeman, C. A. Martin, D. M. de Leeuw, J. J. P. Valeton, C. W. M. Bastiaansen, D. J. Broer, A.R. Popa-Merticaru, S. C. J. Meskers, Journal of the American Chemical Society , 2006, 128,2336-2345.
[24] F. P. Zhang, M. Funahashi, N. Tamaoki, Organic Electronics, 2009, 10, 73-84.[25] M. Funahashi, F. P. Zhang, N. Tamaoki, Advanced Materials, 2007, 19, 353-358.[26] F. Zhang, M. Funahashi, N. Tamaoki, Applied Physics Letters, 2007, 91.[27] A. Ohno, A. Haruyama, K. Kurotaki, J.-i. Hanna, Journal of Applied Physics, 2007, 102, 083711.[28] J. D. Martin, C. L. Keary, T. A. Thornton, M. P. Novotnak, J. W. Knutson, J. C. W. Folmer,
Nature Materials, 2006, 5, 271-275.[29] K. S. Kunihisa, T. Shinoda, Bulletin of the Chemical Society of Japan, 1975, 48, 3506-3511.[30] M. Barón, Pure and Applied Chemistry , 2001, 73, 845-895.[31] T. Yasuda, H. Ooi, J. Morita, Y. Akama, K. Minoura, M. Funahashi, T. Shimomuro, T. Kato,
Advanced Functional Materials, 2009, 19, 411-419.[32] T. Ichikawa, M. Yoshio, A. Hamasaki, T. Mukai, H. Ohno, T. Kato, Journal of the American
Chemical Society , 2007, 129, 10662-10663.
8/8/2019 Master Thesis - Jonas Sellberg
http://slidepdf.com/reader/full/master-thesis-jonas-sellberg 87/105
80
[33] N. Kapernaum, D. M. Walba, E. Korblova, C. H. Zhu, C. Jones, Y. Q. Shen, N. A. Clark, F.Giesselmann, Chemphyschem, 2009, 10, 890-892.
[34] B. Glüsen, W. Heitz, A. Kettner, J. H. Wendorff, Liquid Crystals, 1996, 20, 627-633.[35] E. Fontes, P. A. Heiney, W. H. de Jeu, Physical Review Letters, 1988, 61, 1202-1205.[36] K. Holmberg, B. Jönsson, B. Kronberg, B. Lindman, Surfactants and Polymers in Aqueous
Solution, 2nd ed., John Wiley & Sons, Chichester, 2002.[37] P. Fuchs, C. Tschierske, K. Raith, K. Das, S. Diele, Angewandte Chemie International Edition, 2002, 41, 628-631.
[38] C. Tschierske, Current Opinion in Colloid & Interface Science, 2002, 7 , 69-80.[39] J. W. Goodby, Current Opinion in Solid State & Materials Science, 1999, 4, 361-368.[40] T. Niori, T. Sekine, J. Watanabe, F. T., T. H., Journal of Materials Chemistry , 1996, 6, 1231-
1233.[41] D. Shen, A. Pegenau, S. Diele, I. Wirth, C. Tschierske, Journal of the American Chemical
Society , 2000, 122, 1593-1601.[42] T. Niori, J. Yamamoto, H. Yokoyama, Molecular Crystals and Liquid Crystals, 2004, 411, 283-
291.
[43] D. R. Link, G. Natale, R. Shao, J. E. Maclennan, N. A. Clark, E. Körblova, D. M. Walba, Science, 1997, 278, 1924-1927.[44] H. Finkelmann, H. J. Kock, G. Rehage, Makromolekulare Chemie - Rapid Communications,
1981, 2, 317-322.[45] R. Zentel, Advanced Materials, 1989, 1, 321-329.[46] T. Kato, J. M. J. Fréchet, Journal of the American Chemical Society , 1989, 111, 8533-8534.[47] L. Brunsveld, B. J. B. Folmer, E. W. Meijer, R. P. Sijbesma, Chemical Reviews, 2001, 101, 4071-
4098.[48] P. Cordier, F. Tournilhac, C. Soulie-Ziakovic, L. Leibler, Nature, 2008, 451, 977-980.[49] T. Kato, H. Kihara, T. Uryu, A. Fujishima, J. M. J. Fréchet, Macromolecules, 1992, 25, 6836-
6841.
[50] T. Kato, P. G. Wilson, A. Fujishima, J. M. J. Fréchet, Chemistry Letters, 1990, 2003-2006.[51] T. Kato, A. Fujishima, J. M. J. Fréchet, Chemistry Letters, 1990, 919-922.[52] T. Kato, H. Adachi, A. Fujishima, J. M. J. Fréchet, Chemistry Letters, 1992, 265-268.[53] U. Kumar, T. Kato, J. M. J. Fréchet, Journal of the American Chemical Society , 1992, 114,
6630-6639.[54] T. Kato, T. Uryu, F. Kaneuchi, C. Jin, J. M. J. Fréchet, Liquid Crystals, 1993, 14, 1311-1317.[55] H. Kihara, T. Kato, T. Uryu, J. M. J. Fréchet, Chemistry of Materials, 1996, 8, 961-968.[56] T. Kato, H. Kihara, S. Ujiie, T. Uryu, J. M. J. Frechet, Macromolecules, 1996, 29, 8734-8739.[57] N. Gimeno, M. B. Ros, J. L. Serrano, M. R. De la Fuente, Chemistry of Materials, 2008, 20,
1262-1271.[58] A. Perez, N. Gimeno, F. Vera, M. B. Ros, J. L. Serrano, M. R. De la Fuente, European Journal of
Organic Chemistry , 2008, 826-833.[59] M. Gimeno, M. B. Ros, J. L. Serrano, M. R. de la Fuente, Angewandte Chemie-International
Edition, 2004, 43, 5235-5238.[60] T. Kawakami, T. Kato, Macromolecules, 1998, 31, 4475-4479.[61] F. Sahlén, Synthesis, Structural Characterization and Non-Linear Optical Properties of Side-
Chain Liquid Crystalline Polymers, PhD thesis, Royal Institute of Technology, 1996.[62] H. Shimura, M. Yoshio, K. Hoshino, T. Mukai, H. Ohno, T. Kato, Journal of the American
Chemical Society , 2008, 130, 1759-1765.[63] S. Yazaki, M. Funahashi, T. Kato, Journal of the American Chemical Society , 2008, 130, 13206-
13207.[64] J. C. deMello, N. Tessler, S. C. Graham, R. H. Friend, Physical Review B, 1998, 57 , 12951-
12963.[65] C. W. Tang, Applied Physics Letters, 1986, 48, 183-185.[66] C. W. Tang, S. A. VanSlyke, Applied Physics Letters, 1987, 51, 913-915.
8/8/2019 Master Thesis - Jonas Sellberg
http://slidepdf.com/reader/full/master-thesis-jonas-sellberg 88/105
81
[67] A. Tsumura, H. Koezuka, T. Ando, Applied Physics Letters, 1986, 49, 1210-1212.[68] M. Grätzel, Nature, 2001, 414, 338-344.[69] E. Wang, L. Wang, L. Lan, C. Luo, W. Zhuang, J. Peng, Y. Cao, Applied Physics Letters, 2008, 92,
033307.[70] M. D. Irwin, D. B. Buchholz, A. W. Hains, R. P. H. Chang, T. J. Marks, Proceedings of the
National Academy of Sciences, 2008, 105, 2783-2787.[71] J. Hou, H.-Y. Chen, S. Zhang, G. Li, Y. Yang, Journal of the American Chemical Society , 2008,130, 16144-16145.
[72] J. Peet, J. Y. Kim, N. E. Coates, W. L. Ma, D. Moses, A. J. Heeger, G. C. Bazan, Nature
Materials, 2007, 6, 497-500.[73] J.-H. Yum, D. P. Hagberg, S.-J. Moon, K. M. Karlsson, T. Marinado, L. Sun, A. Hagfeldt, M. K.
Nazeeruddin, M. Grätzel, Angewandte Chemie International Edition, 2009, 48, 1576-1580.[74] Y. Yang, F. Wudl, Advanced Materials, 2009, 21, 1401-1403.[75] A. F. Stassen, R. W. I. d. Boer, N. N. Iosad, A. F. Morpurgo, Applied Physics Letters, 2004, 85,
3899-3901.[76] O. D. Jurchescu, Molecular Organic Semiconductors for Electronic Devices, PhD thesis,
University of Groningen, 2006.[77] D. Hertel, H. Bässler, Chemphyschem, 2008, 9, 666-688.[78] W. Pisula, M. Zorn, J. Y. Chang, K. Müllen, R. Zentel, Macromolecular Rapid Communications,
2009, 30, 1179-1202.[79] R. G. Kepler, Physical Review , 1960, 119, 1226-1229.[80] M. Funahashi, F. Zhang, N. Tamaoki, J. Hanna, Chemphyschem, 2008, 9, 1465-1473.[81] G. Horowitz, D. Fichou, X. Z. Peng, Z. G. Xu, F. Garnier, Solid State Communications, 1989, 72,
381-384.[82] F. Garnier, G. Horowitz, X. H. Peng, D. Fichou, Advanced Materials, 1990, 2, 592-594.[83] S. F. Nelson, Y.-Y. Lin, D. J. Gundlach, T. N. Jackson, Applied Physics Letters, 1998, 72, 1854-
1856.
[84] R. A. Laudise, C. Kloc, P. G. Simpkins, T. Siegrist, Journal of Crystal Growth, 1998, 187 , 449-454.[85] O. D. Jurchescu, J. Baas, T. T. M. Palstra, Applied Physics Letters, 2004, 84, 3061-3063.[86] V. C. Sundar, J. Zaumseil, V. Podzorov, E. Menard, R. L. Willett, T. Someya, M. E. Gershenson,
J. A. Rogers, Science, 2004, 303, 1644-1646.[87] N. Boden, R. J. Bushby, J. Clements, B. Movaghar, K. J. Donovan, T. Kreouzis, Physical Review
B, 1995, 52, 13274-13280.[88] D. Adam, F. Closs, T. Frey, D. Funhoff, D. Haarer, H. Ringsdorf, P. Schuhmacher, K.
Siemensmeyer, Physical Review Letters, 1993, 70, 457-460.[89] D. Adam, P. Schuhmacher, J. Simmerer, L. Haussling, K. Siemensmeyer, K. H. Etzbach, H.
Ringsdorf, D. Haarer, Nature, 1994, 371, 141-143.
[90] M. Funahashi,Molecular Crystals and Liquid Crystals
, 2006,
458, 3-10.[91] M. Funahashi, J. I. Hanna, Advanced Materials, 2005, 17 , 594-598.
[92] K. Oikawa, H. Monobe, J. Takahashi, K. Tsuchiya, B. Heinrich, D. Guillon, Y. Shimizu, Chemical
Communications, 2005, 5337-5339.[93] A. M. v. d. Craats, N. Stutzmann, O. Bunk, M. M. Nielsen, M. Watson, K. Müllen, H. D. Chanzy,
H. Sirringhaus, R. H. Friend, Advanced Materials, 2003, 15, 495-499.[94] W. Pisula, A. Menon, M. Stepputat, I. Lieberwirth, U. Kolb, A. Tracz, H. Sirringhaus, T. Pakula,
K. Müllen, Advanced Materials, 2005, 17 , 684-689.[95] F. Garnier, R. Hajlaoui, A. El Kassmi, G. Horowitz, L. Laigre, W. Porzio, M. Armanini, F.
Provasoli, Chemistry of Materials, 1998, 10, 3334-3339.[96] K. Oikawa, H. Monobe, K. Nakayama, T. Kimoto, K. Tsuchiya, B. Heinrich, D. Guillon, Y.
Shimizu, M. Yokoyama, Advanced Materials, 2007, 19, 1864-1868.
8/8/2019 Master Thesis - Jonas Sellberg
http://slidepdf.com/reader/full/master-thesis-jonas-sellberg 89/105
82
[97] D. H. Kim, B. L. Lee, H. Moon, H. M. Kang, E. J. Jeong, J. I. Park, K. M. Han, S. Lee, B. W. Yoo, B.W. Koo, J. Y. Kim, W. H. Lee, K. Cho, H. A. Becerril, Z. Bao, Journal of the American Chemical
Society , 2009, 131, 6124-6132.[98] I. McCulloch, M. Heeney, C. Bailey, K. Genevicius, I. MacDonald, M. Shkunov, D. Sparrowe, S.
Tierney, R. Wagner, W. Zhang, M. L. Chabinyc, R. J. Kline, M. D. McGehee, M. F. Toney,
Nature Materials, 2006, 5, 328-333.[99] M. H. Levitt, Spin Dynamics, 1st ed., John Wiley & Sons, Chichester, 2001.[100] M. Karas, R. Kruger, Chemical Reviews, 2003, 103, 427-440.[101] A. C. Aiken, P. F. DeCarlo, J. L. Jimenez, Analytical Chemistry , 2007, 79, 8350-8358.[102] J. Clayden, N. Greeved, S. Warren, P. Wothers, Organic Chemistry , Oxford University Press,
Oxford, 2001.[103] D. R. Scheuing, Fourier Transform Infrared Spectroscopy in Colloid and Interface Science, ACS
Symposium Series, Vol. 447 , American Chemical Society, Washington, DC, 1991.[104] D. Demus, J. W. Goodby, G. W. Gray, H.-W. Spiess, V. Vill, Handbook of Liquid Crystals, Wiley-
VCH, Weinheim, 1998.[105] Y. Sagara, T. Kato, Angewandte Chemie-International Edition, 2008, 47 , 5175-5178.
[106] V. P. Nicu, J. N. , E. J. Baerends, The Journal of Physical Chemistry A, 2008, 112, 6978-6991.[107] J. Schellman, H. P. Jensen, Chemical Reviews, 1987, 87 , 1359-1399.[108] J. A. Schellman, Chemical Reviews, 1975, 75, 323-331.[109] R. Memming, Semiconductor Electrochemistry , Wiley-VCH, Weinheim, 2002.[110] D. M. de Leeuw, M. M. J. Simenon, A. R. Brown, R. E. F. Einerhand, Synthetic Metals, 1997,
87 , 53-59.[111] Y. Li, Y. Cao, J. Gao, D. Wang, G. Yu, A. J. Heeger, Synthetic Metals, 1999, 99, 243-248.[112] J. P. Perdew, A. Ruzsinszky, L. A. Constantin, J. Sun, G. b. I. Csonka, Journal of Chemical
Theory and Computation, 2009, 5, 902-908.[113] F. Jensen, Introduction to Computational Chemistry , John Wiley & Sons, Chichester, 2006.[114] M. Funahashi, N. Tamaoki, Chemistry of Materials, 2007, 19, 608-617.
[115] M. Funahashi, N. Tamaoki, Molecular Crystals and Liquid Crystals, 2007, 475, 123-135.[116] S. A. Lee, Y. Yoshida, M. Fukuyama, S. Hotta, Synthetic Metals, 1999, 106, 39-43.[117] H. Yanagi, T. Morikawa, S. Hotta, K. Yase, Advanced Materials, 2001, 13, 313-317.[118] C.-Q. Ma, M. Fonrodona, M. C. Schikora, M. M. Wienk, R. A. J. Janssen, P. Bäuerle, Advanced
Functional Materials, 2008, 18, 3323-3331.[119] J. Sakai, T. Taima, K. Saito, Organic Electronics, 2008, 9, 582-590.[120] Q. Xia, M. Burkhardt, M. Halik, Organic Electronics, 2008, 9, 1061-1068.[121] Q. J. Cai, M. B. Chan-Park, Q. Zhou, Z. S. Lu, C. M. Li, B. S. Ong, Organic Electronics, 2008, 9,
936-943.[122] S. L. Johnson, K. A. Rumon, The Journal of Physical Chemistry , 1965, 69, 74-86.[123] T. Kato, J. M. J. Fréchet, P. G. Wilson, T. Saito, T. Uryu, A. Fujishima, C. Jin, F. Kaneuchi,
Chemistry of Materials, 1993,
5, 1094-1100.[124] H. Zhang, Q. Cai, D. Ma, Journal of Organic Chemistry , 2005, 70, 5164-5173.
[125] K. Tamao, K. Sumitani, M. Kumada, Journal of the American Chemical Society , 1972, 94,4374-4376.
[126] K. Tamao, Journal of Organometallic Chemistry , 2002, 653, 23 –26.[127] N. Miyaura, A. Suzuki, Chemical Reviews, 1995, 95, 2457-2483.[128] J. H. Yum, D. P. Hagberg, S. J. Moon, K. M. Karlsson, T. Marinado, L. C. Sun, A. Hagfeldt, M. K.
Nazeeruddin, M. Gratzel, Angewandte Chemie-International Edition, 2009, 48, 1576-1580.[129] K. C. Kumara Swamy, N. N. Bhuvan Kumar, E. Balaraman, K. V. P. Pavan Kumar, Chemical
Reviews, 2009, 109, 2551-2651.[130] M. Funahashi, J. Hanna, Chemical Physics Letters, 2004, 397 , 319-323.[131] I. Paraschiv, K. de Lange, M. Giesbers, B. van Lagen, F. C. Grozema, R. D. Abellon, L. D. A.
Siebbeles, E. J. R. Sudhölter, H. Zuilhof, A. T. M. Marcelis, Journal of Materials Chemistry , 2008, 18, 5475-5481.
8/8/2019 Master Thesis - Jonas Sellberg
http://slidepdf.com/reader/full/master-thesis-jonas-sellberg 90/105
83
[132] R. A. Lewthwaite, J. W. Goodby, K. J. Toyne, Liquid Crystals, 1994, 16, 299-313.[133] T. Kato, N. Hirota, A. Fujishima, J. M. J. Fréchet, Journal of Polymer Science Part A: Polymer
Chemistry , 1996, 34, 57-62.[134] T. Kato, C. Jin, F. Kaneuchi, T. Uryu, Bulletin of the Chemical Society of Japan, 1993, 66, 3581-
3584.
[135] G. H. Heilmeier, L. A. Zanoni, L. A. Barton, Proceedings of the IEEE , 1968, 56, 1162-1171.[136] V. A. Mallia, M. Funahashi, N. Tamaoki, Journal of Physical Organic Chemistry , 2007, 20, 878-883.
[137] P. Gilli, L. Pretto, V. Bertolasi, G. Gilli, Accounts of Chemical Research, 2009, 42, 33-44.[138] A. Facchetti, M.-H. Yoon, C. L. Stern, G. R. Hutchison, M. A. Ratner, T. J. Marks, Journal of the
American Chemical Society , 2004, 126, 13480-13501.[139] I. Chávez, A. Alvarez-Carena, E. Molins, A. Roig, W. Maniukiewicz, A. Arancibia, V. Arancibia,
H. Brand, J. M. Manríquez, Journal of Organometallic Chemistry , 2000, 601, 126-132.
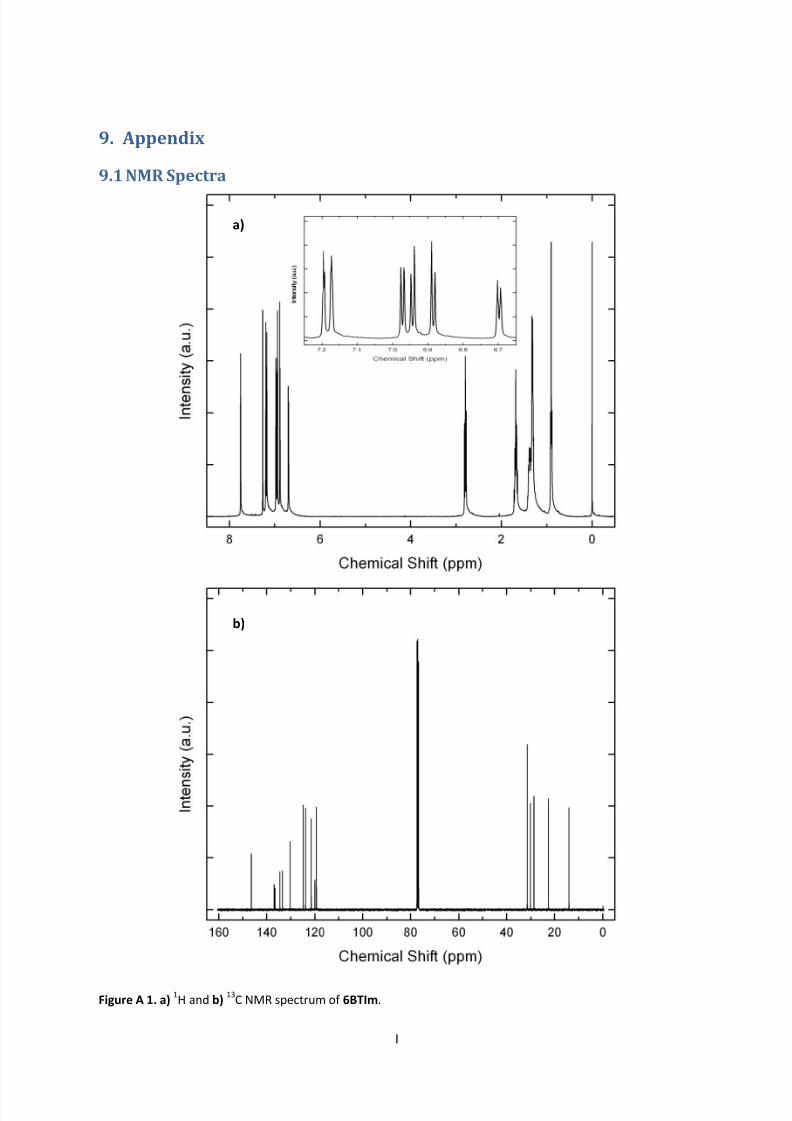
8/8/2019 Master Thesis - Jonas Sellberg
http://slidepdf.com/reader/full/master-thesis-jonas-sellberg 91/105
I
9. Appendix
9.1 NMR Spectra
Figure A 1. a)1H and b) 13C NMR spectrum of 6BTIm.
a)
b)
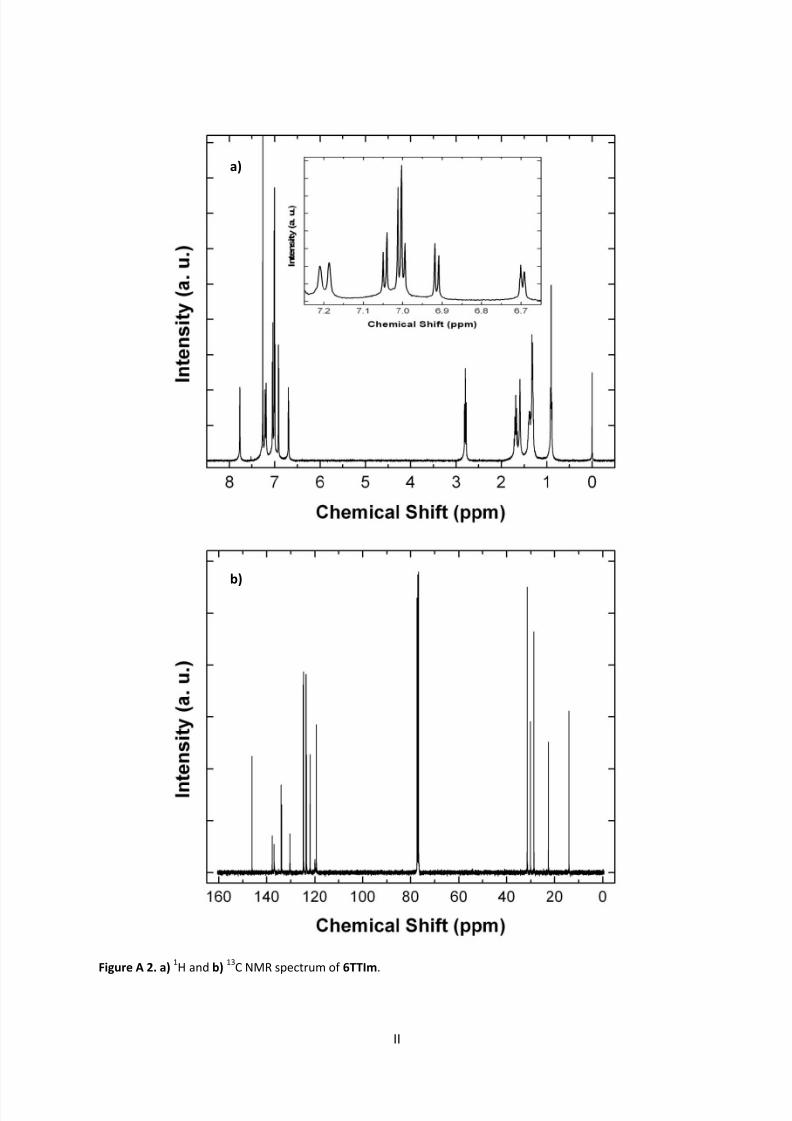
8/8/2019 Master Thesis - Jonas Sellberg
http://slidepdf.com/reader/full/master-thesis-jonas-sellberg 92/105
II
Figure A 2. a)1H and b) 13C NMR spectrum of 6TTIm.
a)
b)
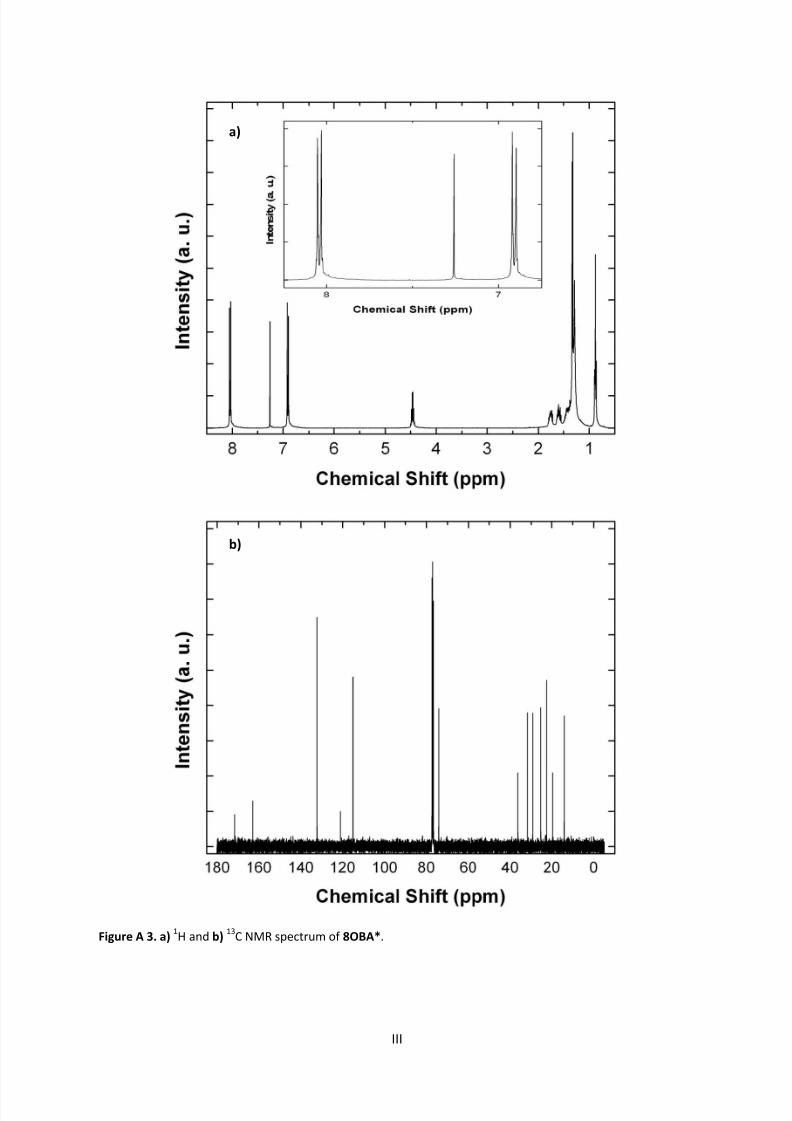
8/8/2019 Master Thesis - Jonas Sellberg
http://slidepdf.com/reader/full/master-thesis-jonas-sellberg 93/105
III
Figure A 3. a)1H and b) 13C NMR spectrum of 8OBA*.
a)
b)
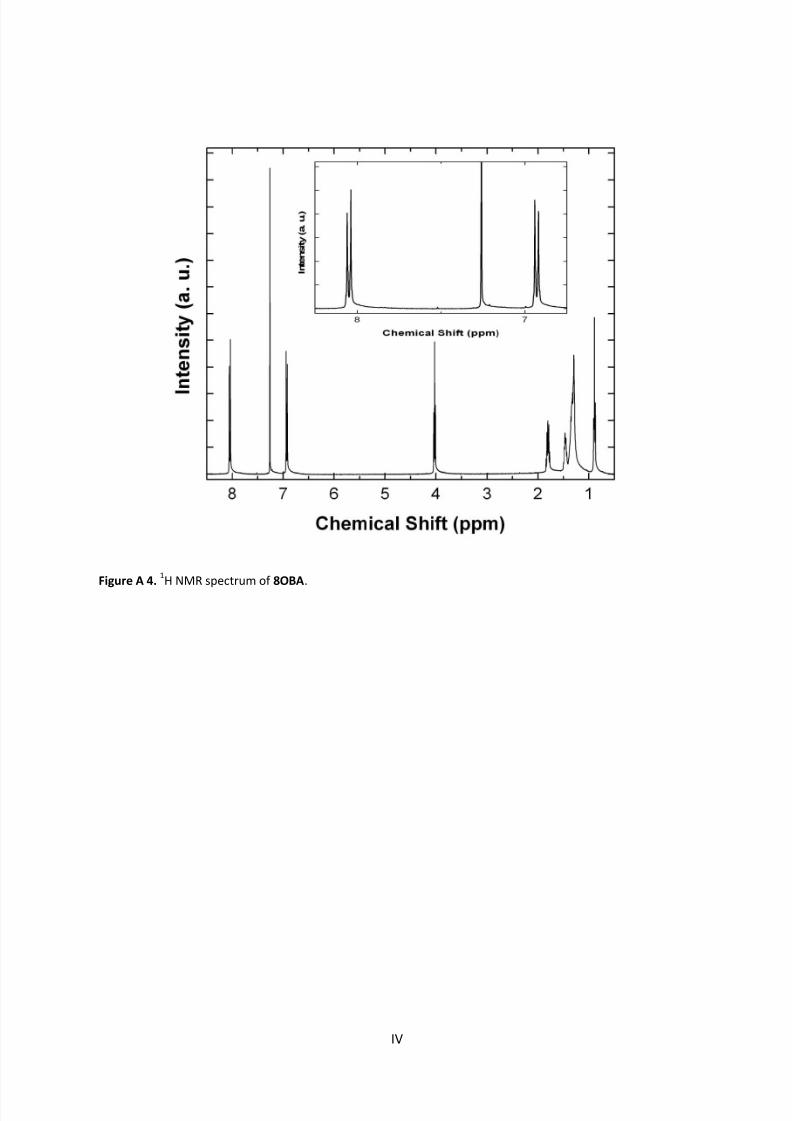
8/8/2019 Master Thesis - Jonas Sellberg
http://slidepdf.com/reader/full/master-thesis-jonas-sellberg 94/105
IV
Figure A 4.1H NMR spectrum of 8OBA.
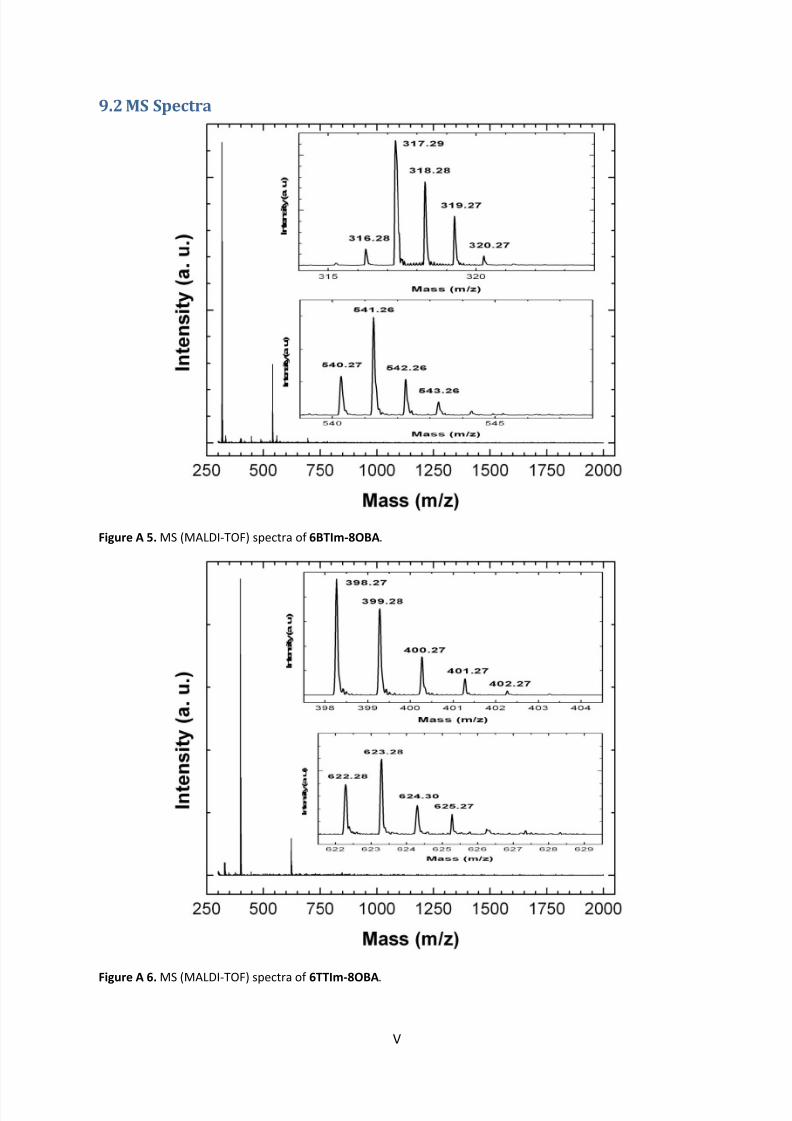
8/8/2019 Master Thesis - Jonas Sellberg
http://slidepdf.com/reader/full/master-thesis-jonas-sellberg 95/105
V
9.2 MS Spectra
Figure A 5. MS (MALDI-TOF) spectra of 6BTIm-8OBA.
Figure A 6. MS (MALDI-TOF) spectra of 6TTIm-8OBA.
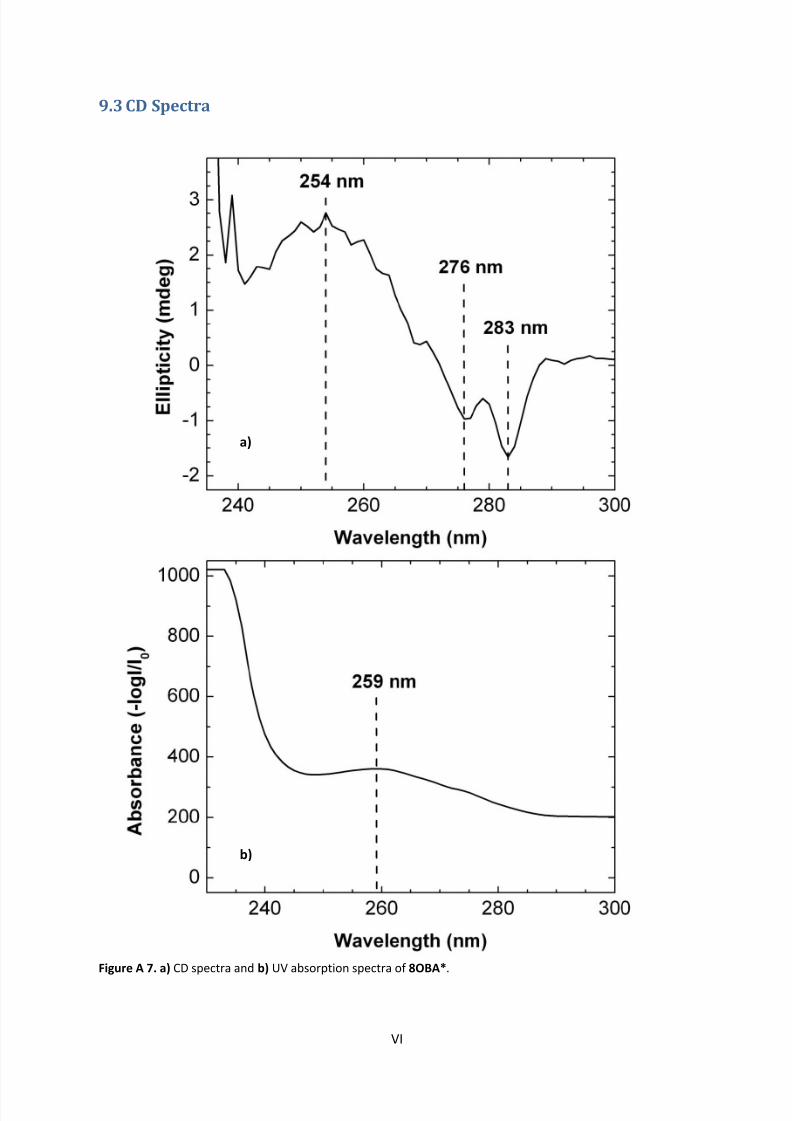
8/8/2019 Master Thesis - Jonas Sellberg
http://slidepdf.com/reader/full/master-thesis-jonas-sellberg 96/105
VI
9.3 CD Spectra
Figure A 7. a) CD spectra and b) UV absorption spectra of 8OBA*.
a)
b)

8/8/2019 Master Thesis - Jonas Sellberg
http://slidepdf.com/reader/full/master-thesis-jonas-sellberg 97/105
VII
9.4 DFT Calculations
Figure A 8. DFT B3LYP (6-31 G*) calculations including dipole moments (yellow arrows) of a) 6BTIm, b) 6TTIm,
c) 8OBA, and d) 8OBA*.
Figure A 9. DFT B3LYP (6-31 G*) calculations of a+c) HOMO and b+d) LUMO of a-b) 8OBA and c-d) 8OBA*.
6BTIm-8OBA:
Molecular Wt.(amu) = 316.493000 Dipole (debye) = 4.67794792E HOMO (eV) = -5.51066039 E LUMO (eV) = -1.49538311 E (eV) = -42605.4030
a) b)
c) d)
a) b)
c) d)
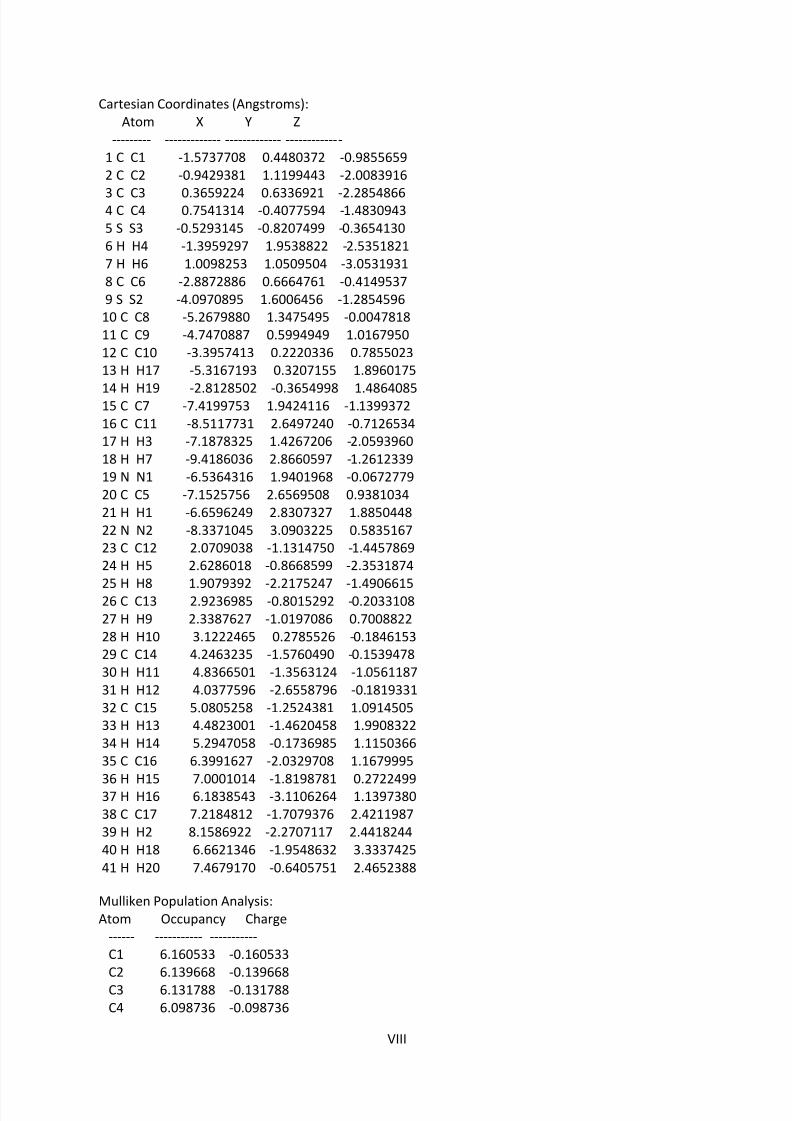
8/8/2019 Master Thesis - Jonas Sellberg
http://slidepdf.com/reader/full/master-thesis-jonas-sellberg 98/105
VIII
Cartesian Coordinates (Angstroms):Atom X Y Z
--------- ------------- ------------- -------------1 C C1 -1.5737708 0.4480372 -0.98556592 C C2 -0.9429381 1.1199443 -2.0083916
3 C C3 0.3659224 0.6336921 -2.28548664 C C4 0.7541314 -0.4077594 -1.48309435 S S3 -0.5293145 -0.8207499 -0.36541306 H H4 -1.3959297 1.9538822 -2.53518217 H H6 1.0098253 1.0509504 -3.05319318 C C6 -2.8872886 0.6664761 -0.41495379 S S2 -4.0970895 1.6006456 -1.2854596
10 C C8 -5.2679880 1.3475495 -0.004781811 C C9 -4.7470887 0.5994949 1.016795012 C C10 -3.3957413 0.2220336 0.785502313 H H17 -5.3167193 0.3207155 1.8960175
14 H H19 -2.8128502 -0.3654998 1.486408515 C C7 -7.4199753 1.9424116 -1.139937216 C C11 -8.5117731 2.6497240 -0.712653417 H H3 -7.1878325 1.4267206 -2.059396018 H H7 -9.4186036 2.8660597 -1.261233919 N N1 -6.5364316 1.9401968 -0.067277920 C C5 -7.1525756 2.6569508 0.938103421 H H1 -6.6596249 2.8307327 1.885044822 N N2 -8.3371045 3.0903225 0.583516723 C C12 2.0709038 -1.1314750 -1.445786924 H H5 2.6286018 -0.8668599 -2.3531874
25 H H8 1.9079392 -2.2175247 -1.490661526 C C13 2.9236985 -0.8015292 -0.203310827 H H9 2.3387627 -1.0197086 0.700882228 H H10 3.1222465 0.2785526 -0.184615329 C C14 4.2463235 -1.5760490 -0.153947830 H H11 4.8366501 -1.3563124 -1.056118731 H H12 4.0377596 -2.6558796 -0.181933132 C C15 5.0805258 -1.2524381 1.091450533 H H13 4.4823001 -1.4620458 1.990832234 H H14 5.2947058 -0.1736985 1.115036635 C C16 6.3991627 -2.0329708 1.1679995
36 H H15 7.0001014 -1.8198781 0.272249937 H H16 6.1838543 -3.1106264 1.139738038 C C17 7.2184812 -1.7079376 2.421198739 H H2 8.1586922 -2.2707117 2.441824440 H H18 6.6621346 -1.9548632 3.333742541 H H20 7.4679170 -0.6405751 2.4652388
Mulliken Population Analysis:Atom Occupancy Charge
------ ----------- -----------C1 6.160533 -0.160533C2 6.139668 -0.139668C3 6.131788 -0.131788C4 6.098736 -0.098736
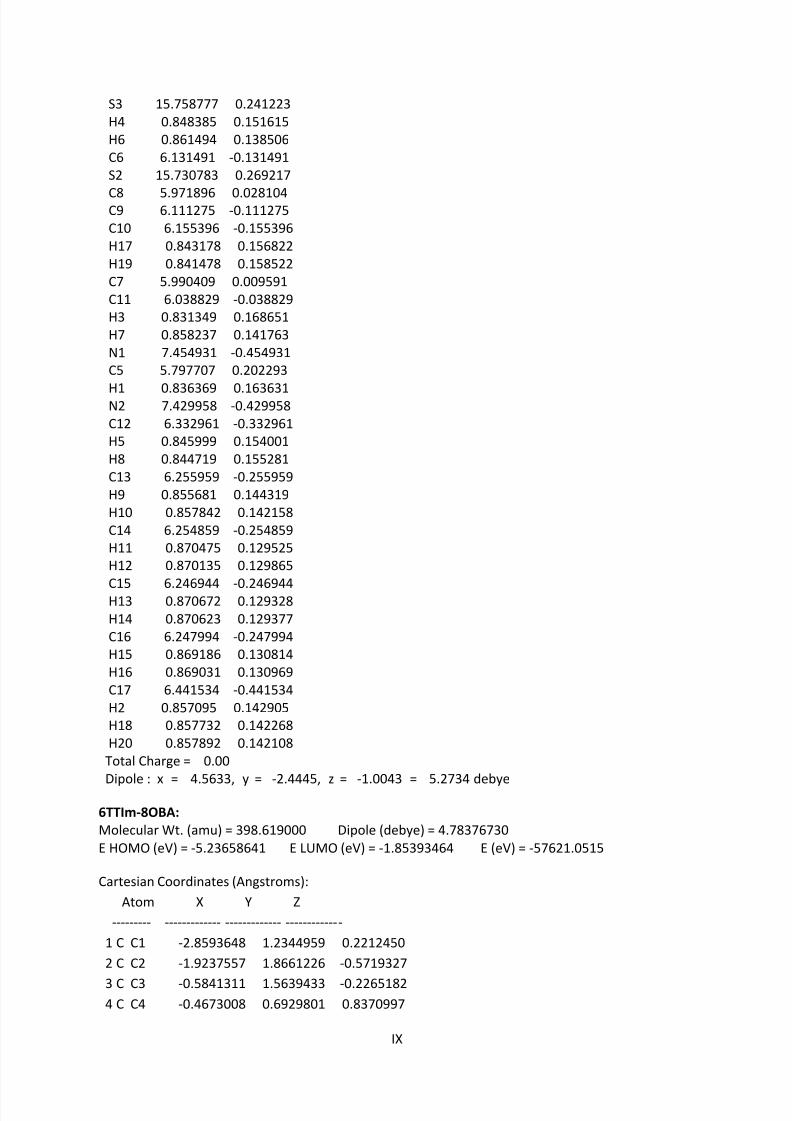
8/8/2019 Master Thesis - Jonas Sellberg
http://slidepdf.com/reader/full/master-thesis-jonas-sellberg 99/105
IX
S3 15.758777 0.241223H4 0.848385 0.151615H6 0.861494 0.138506C6 6.131491 -0.131491S2 15.730783 0.269217
C8 5.971896 0.028104C9 6.111275 -0.111275C10 6.155396 -0.155396H17 0.843178 0.156822H19 0.841478 0.158522C7 5.990409 0.009591C11 6.038829 -0.038829H3 0.831349 0.168651H7 0.858237 0.141763N1 7.454931 -0.454931C5 5.797707 0.202293
H1 0.836369 0.163631N2 7.429958 -0.429958C12 6.332961 -0.332961H5 0.845999 0.154001H8 0.844719 0.155281C13 6.255959 -0.255959H9 0.855681 0.144319H10 0.857842 0.142158C14 6.254859 -0.254859H11 0.870475 0.129525H12 0.870135 0.129865
C15 6.246944 -0.246944H13 0.870672 0.129328H14 0.870623 0.129377C16 6.247994 -0.247994H15 0.869186 0.130814H16 0.869031 0.130969C17 6.441534 -0.441534H2 0.857095 0.142905H18 0.857732 0.142268H20 0.857892 0.142108
Total Charge = 0.00
Dipole : x = 4.5633, y = -2.4445, z = -1.0043 = 5.2734 debye6TTIm-8OBA:
Molecular Wt. (amu) = 398.619000 Dipole (debye) = 4.78376730E HOMO (eV) = -5.23658641 E LUMO (eV) = -1.85393464 E (eV) = -57621.0515
Cartesian Coordinates (Angstroms):
Atom X Y Z
--------- ------------- ------------- -------------
1 C C1 -2.8593648 1.2344959 0.2212450
2 C C2 -1.9237557 1.8661226 -0.5719327
3 C C3 -0.5841311 1.5639433 -0.22651824 C C4 -0.4673008 0.6929801 0.8370997
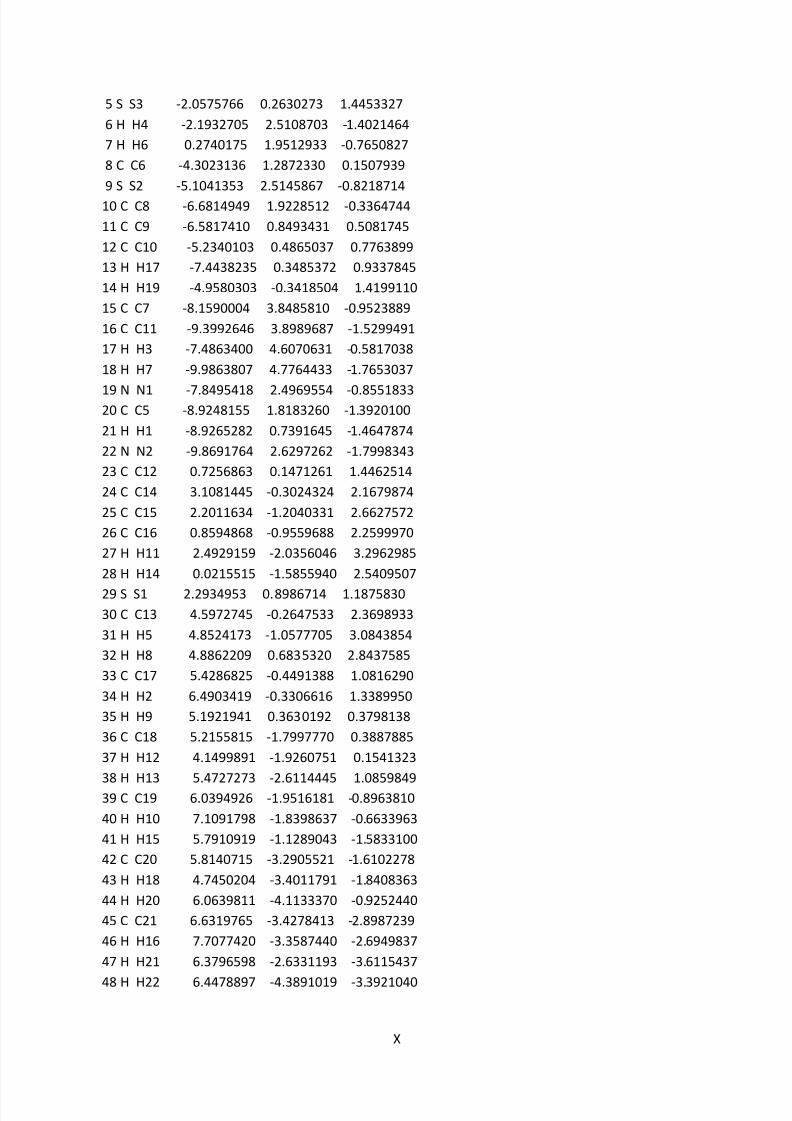
8/8/2019 Master Thesis - Jonas Sellberg
http://slidepdf.com/reader/full/master-thesis-jonas-sellberg 100/105
X
5 S S3 -2.0575766 0.2630273 1.4453327
6 H H4 -2.1932705 2.5108703 -1.4021464
7 H H6 0.2740175 1.9512933 -0.7650827
8 C C6 -4.3023136 1.2872330 0.1507939
9 S S2 -5.1041353 2.5145867 -0.8218714
10 C C8 -6.6814949 1.9228512 -0.3364744
11 C C9 -6.5817410 0.8493431 0.5081745
12 C C10 -5.2340103 0.4865037 0.7763899
13 H H17 -7.4438235 0.3485372 0.9337845
14 H H19 -4.9580303 -0.3418504 1.4199110
15 C C7 -8.1590004 3.8485810 -0.9523889
16 C C11 -9.3992646 3.8989687 -1.5299491
17 H H3 -7.4863400 4.6070631 -0.5817038
18 H H7 -9.9863807 4.7764433 -1.7653037
19 N N1 -7.8495418 2.4969554 -0.855183320 C C5 -8.9248155 1.8183260 -1.3920100
21 H H1 -8.9265282 0.7391645 -1.4647874
22 N N2 -9.8691764 2.6297262 -1.7998343
23 C C12 0.7256863 0.1471261 1.4462514
24 C C14 3.1081445 -0.3024324 2.1679874
25 C C15 2.2011634 -1.2040331 2.6627572
26 C C16 0.8594868 -0.9559688 2.2599970
27 H H11 2.4929159 -2.0356046 3.2962985
28 H H14 0.0215515 -1.5855940 2.5409507
29 S S1 2.2934953 0.8986714 1.187583030 C C13 4.5972745 -0.2647533 2.3698933
31 H H5 4.8524173 -1.0577705 3.0843854
32 H H8 4.8862209 0.6835320 2.8437585
33 C C17 5.4286825 -0.4491388 1.0816290
34 H H2 6.4903419 -0.3306616 1.3389950
35 H H9 5.1921941 0.3630192 0.3798138
36 C C18 5.2155815 -1.7997770 0.3887885
37 H H12 4.1499891 -1.9260751 0.1541323
38 H H13 5.4727273 -2.6114445 1.0859849
39 C C19 6.0394926 -1.9516181 -0.8963810
40 H H10 7.1091798 -1.8398637 -0.6633963
41 H H15 5.7910919 -1.1289043 -1.5833100
42 C C20 5.8140715 -3.2905521 -1.6102278
43 H H18 4.7450204 -3.4011791 -1.8408363
44 H H20 6.0639811 -4.1133370 -0.9252440
45 C C21 6.6319765 -3.4278413 -2.8987239
46 H H16 7.7077420 -3.3587440 -2.6949837
47 H H21 6.3796598 -2.6331193 -3.6115437
48 H H22 6.4478897 -4.3891019 -3.3921040

8/8/2019 Master Thesis - Jonas Sellberg
http://slidepdf.com/reader/full/master-thesis-jonas-sellberg 101/105
XI
Mulliken Population Analysis:Atom Occupancy Charge
------ ----------- -----------C1 6.151534 -0.151534C2 6.145163 -0.145163
C3 6.145111 -0.145111C4 6.140901 -0.140901S3 15.733029 0.266971H4 0.844353 0.155647H6 0.843830 0.156170C6 6.135878 -0.135878S2 15.728183 0.271817C8 5.969119 0.030881C9 6.111617 -0.111617C10 6.155577 -0.155577H17 0.842032 0.157968
H19 0.840625 0.159375C7 5.990468 0.009532C11 6.038397 -0.038397H3 0.830533 0.169467H7 0.857471 0.142529N1 7.456491 -0.456491C5 5.797558 0.202442H1 0.835842 0.164158N2 7.429254 -0.429254C12 6.160590 -0.160590C14 6.092944 -0.092944
C15 6.135603 -0.135603C16 6.136698 -0.136698H11 0.861308 0.138692H14 0.848647 0.151353S1 15.759986 0.240014C13 6.331969 -0.331969H5 0.846989 0.153011H8 0.841975 0.158025C17 6.264855 -0.264855H2 0.864760 0.135240H9 0.856896 0.143104
C18 6.252346 -0.252346H12 0.852778 0.147222H13 0.875292 0.124708C19 6.246754 -0.246754H10 0.873847 0.126153H15 0.871145 0.128855C20 6.247885 -0.247885H18 0.867132 0.132868H20 0.870250 0.129750C21 6.441614 -0.441614H16 0.859031 0.140969H21 0.858105 0.141895H22 0.857635 0.142365
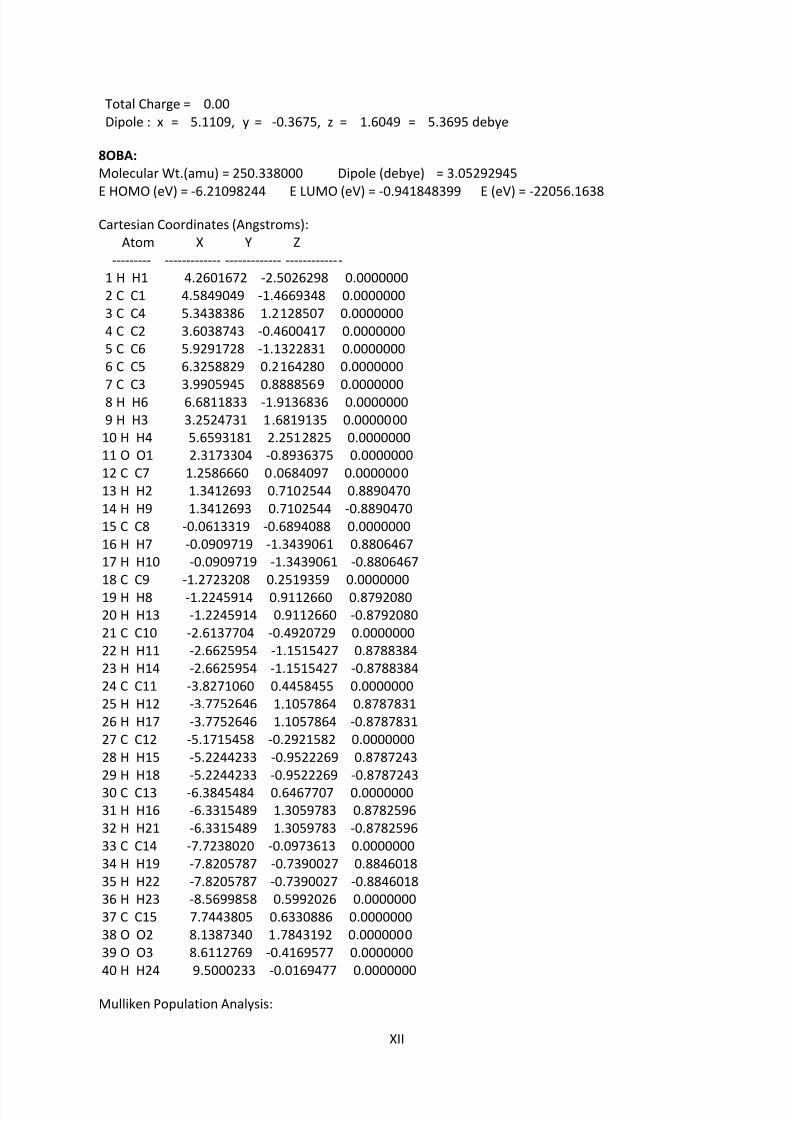
8/8/2019 Master Thesis - Jonas Sellberg
http://slidepdf.com/reader/full/master-thesis-jonas-sellberg 102/105
XII
Total Charge = 0.00Dipole : x = 5.1109, y = -0.3675, z = 1.6049 = 5.3695 debye
8OBA:
Molecular Wt.(amu) = 250.338000 Dipole (debye) = 3.05292945
E HOMO (eV) = -6.21098244 E LUMO (eV) = -0.941848399 E (eV) = -22056.1638
Cartesian Coordinates (Angstroms):Atom X Y Z
--------- ------------- ------------- -------------1 H H1 4.2601672 -2.5026298 0.00000002 C C1 4.5849049 -1.4669348 0.00000003 C C4 5.3438386 1.2128507 0.00000004 C C2 3.6038743 -0.4600417 0.00000005 C C6 5.9291728 -1.1322831 0.00000006 C C5 6.3258829 0.2164280 0.00000007 C C3 3.9905945 0.8888569 0.00000008 H H6 6.6811833 -1.9136836 0.00000009 H H3 3.2524731 1.6819135 0.0000000
10 H H4 5.6593181 2.2512825 0.000000011 O O1 2.3173304 -0.8936375 0.000000012 C C7 1.2586660 0.0684097 0.000000013 H H2 1.3412693 0.7102544 0.889047014 H H9 1.3412693 0.7102544 -0.889047015 C C8 -0.0613319 -0.6894088 0.000000016 H H7 -0.0909719 -1.3439061 0.880646717 H H10 -0.0909719 -1.3439061 -0.880646718 C C9 -1.2723208 0.2519359 0.000000019 H H8 -1.2245914 0.9112660 0.879208020 H H13 -1.2245914 0.9112660 -0.879208021 C C10 -2.6137704 -0.4920729 0.000000022 H H11 -2.6625954 -1.1515427 0.878838423 H H14 -2.6625954 -1.1515427 -0.878838424 C C11 -3.8271060 0.4458455 0.000000025 H H12 -3.7752646 1.1057864 0.878783126 H H17 -3.7752646 1.1057864 -0.878783127 C C12 -5.1715458 -0.2921582 0.000000028 H H15 -5.2244233 -0.9522269 0.878724329 H H18 -5.2244233 -0.9522269 -0.878724330 C C13 -6.3845484 0.6467707 0.000000031 H H16 -6.3315489 1.3059783 0.878259632 H H21 -6.3315489 1.3059783 -0.878259633 C C14 -7.7238020 -0.0973613 0.000000034 H H19 -7.8205787 -0.7390027 0.884601835 H H22 -7.8205787 -0.7390027 -0.884601836 H H23 -8.5699858 0.5992026 0.000000037 C C15 7.7443805 0.6330886 0.000000038 O O2 8.1387340 1.7843192 0.000000039 O O3 8.6112769 -0.4169577 0.000000040 H H24 9.5000233 -0.0169477 0.0000000
Mulliken Population Analysis:
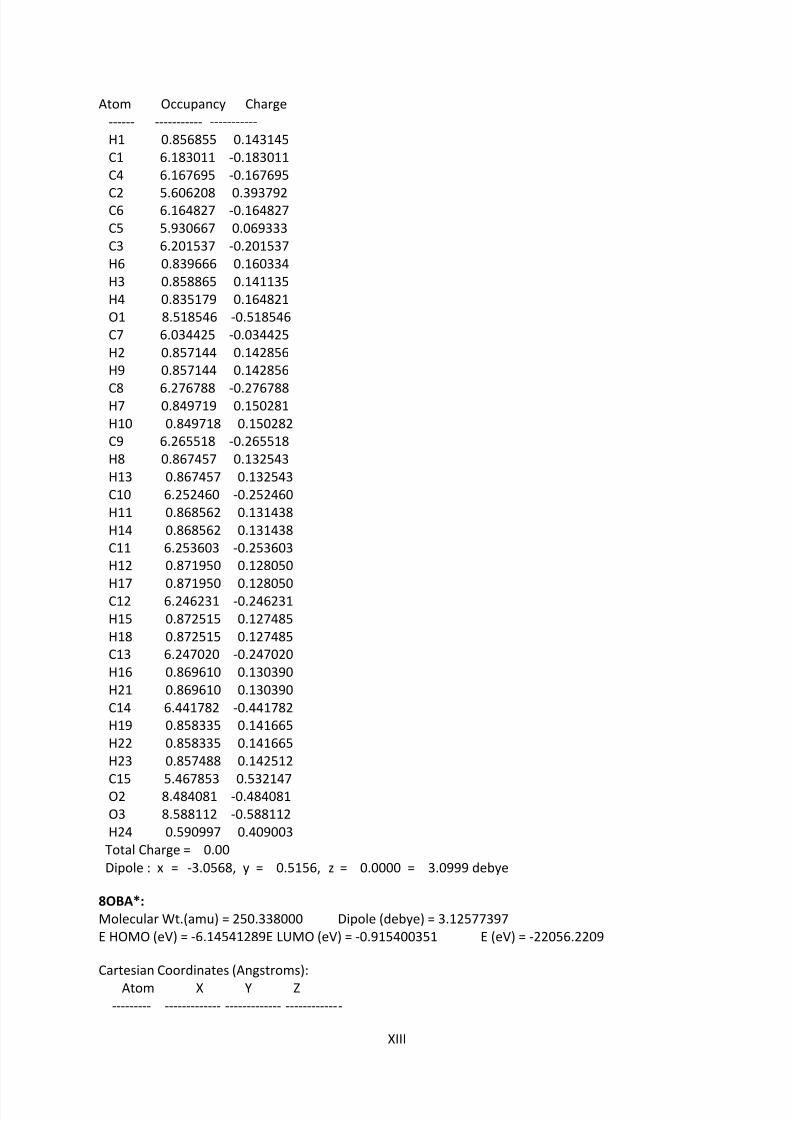
8/8/2019 Master Thesis - Jonas Sellberg
http://slidepdf.com/reader/full/master-thesis-jonas-sellberg 103/105
XIII
Atom Occupancy Charge------ ----------- -----------H1 0.856855 0.143145C1 6.183011 -0.183011C4 6.167695 -0.167695
C2 5.606208 0.393792C6 6.164827 -0.164827C5 5.930667 0.069333C3 6.201537 -0.201537H6 0.839666 0.160334H3 0.858865 0.141135H4 0.835179 0.164821O1 8.518546 -0.518546C7 6.034425 -0.034425H2 0.857144 0.142856H9 0.857144 0.142856
C8 6.276788 -0.276788H7 0.849719 0.150281H10 0.849718 0.150282C9 6.265518 -0.265518H8 0.867457 0.132543H13 0.867457 0.132543C10 6.252460 -0.252460H11 0.868562 0.131438H14 0.868562 0.131438C11 6.253603 -0.253603H12 0.871950 0.128050
H17 0.871950 0.128050C12 6.246231 -0.246231H15 0.872515 0.127485H18 0.872515 0.127485C13 6.247020 -0.247020H16 0.869610 0.130390H21 0.869610 0.130390C14 6.441782 -0.441782H19 0.858335 0.141665H22 0.858335 0.141665H23 0.857488 0.142512
C15 5.467853 0.532147O2 8.484081 -0.484081O3 8.588112 -0.588112H24 0.590997 0.409003
Total Charge = 0.00Dipole : x = -3.0568, y = 0.5156, z = 0.0000 = 3.0999 debye
8OBA*:
Molecular Wt.(amu) = 250.338000 Dipole (debye) = 3.12577397E HOMO (eV) = -6.14541289E LUMO (eV) = -0.915400351 E (eV) = -22056.2209
Cartesian Coordinates (Angstroms):
Atom X Y Z--------- ------------- ------------- -------------
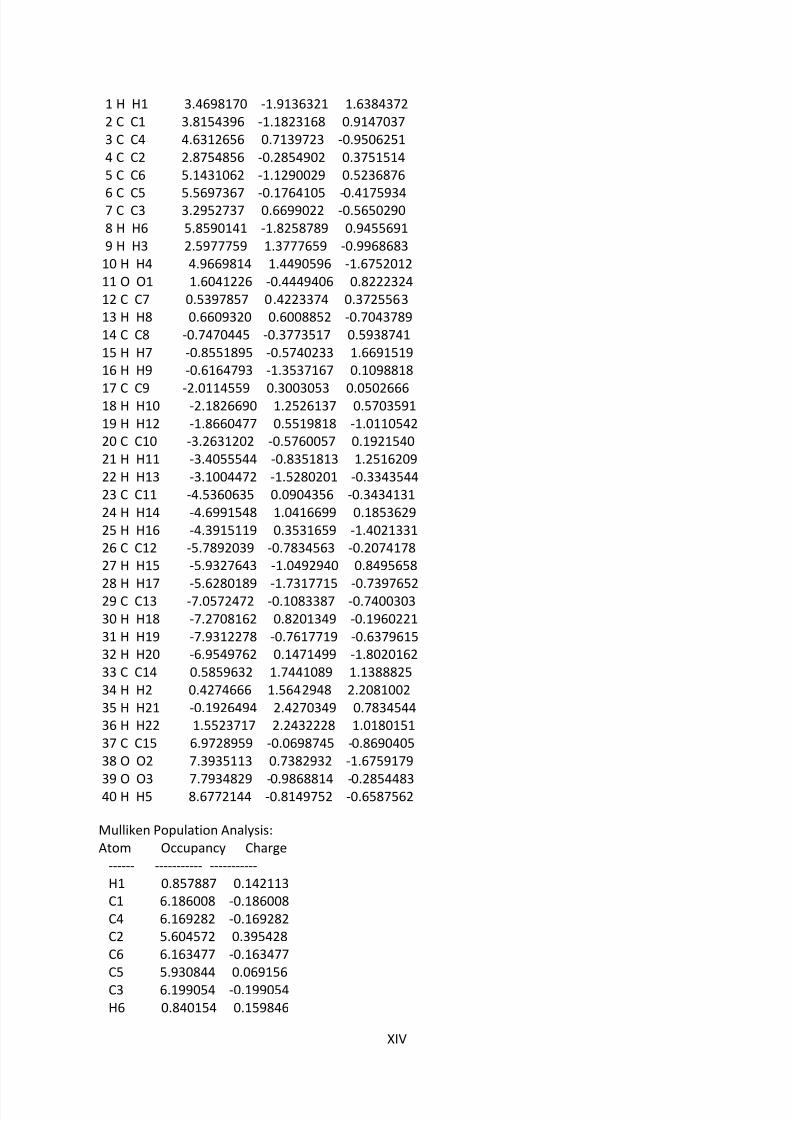
8/8/2019 Master Thesis - Jonas Sellberg
http://slidepdf.com/reader/full/master-thesis-jonas-sellberg 104/105
XIV
1 H H1 3.4698170 -1.9136321 1.63843722 C C1 3.8154396 -1.1823168 0.91470373 C C4 4.6312656 0.7139723 -0.95062514 C C2 2.8754856 -0.2854902 0.37515145 C C6 5.1431062 -1.1290029 0.5236876
6 C C5 5.5697367 -0.1764105 -0.41759347 C C3 3.2952737 0.6699022 -0.56502908 H H6 5.8590141 -1.8258789 0.94556919 H H3 2.5977759 1.3777659 -0.9968683
10 H H4 4.9669814 1.4490596 -1.675201211 O O1 1.6041226 -0.4449406 0.822232412 C C7 0.5397857 0.4223374 0.372556313 H H8 0.6609320 0.6008852 -0.704378914 C C8 -0.7470445 -0.3773517 0.593874115 H H7 -0.8551895 -0.5740233 1.669151916 H H9 -0.6164793 -1.3537167 0.1098818
17 C C9 -2.0114559 0.3003053 0.050266618 H H10 -2.1826690 1.2526137 0.570359119 H H12 -1.8660477 0.5519818 -1.011054220 C C10 -3.2631202 -0.5760057 0.192154021 H H11 -3.4055544 -0.8351813 1.251620922 H H13 -3.1004472 -1.5280201 -0.334354423 C C11 -4.5360635 0.0904356 -0.343413124 H H14 -4.6991548 1.0416699 0.185362925 H H16 -4.3915119 0.3531659 -1.402133126 C C12 -5.7892039 -0.7834563 -0.207417827 H H15 -5.9327643 -1.0492940 0.8495658
28 H H17 -5.6280189 -1.7317715 -0.739765229 C C13 -7.0572472 -0.1083387 -0.740030330 H H18 -7.2708162 0.8201349 -0.196022131 H H19 -7.9312278 -0.7617719 -0.637961532 H H20 -6.9549762 0.1471499 -1.802016233 C C14 0.5859632 1.7441089 1.138882534 H H2 0.4274666 1.5642948 2.208100235 H H21 -0.1926494 2.4270349 0.783454436 H H22 1.5523717 2.2432228 1.018015137 C C15 6.9728959 -0.0698745 -0.869040538 O O2 7.3935113 0.7382932 -1.6759179
39 O O3 7.7934829 -0.9868814 -0.285448340 H H5 8.6772144 -0.8149752 -0.6587562
Mulliken Population Analysis:Atom Occupancy Charge
------ ----------- -----------H1 0.857887 0.142113C1 6.186008 -0.186008C4 6.169282 -0.169282C2 5.604572 0.395428C6 6.163477 -0.163477C5 5.930844 0.069156C3 6.199054 -0.199054H6 0.840154 0.159846
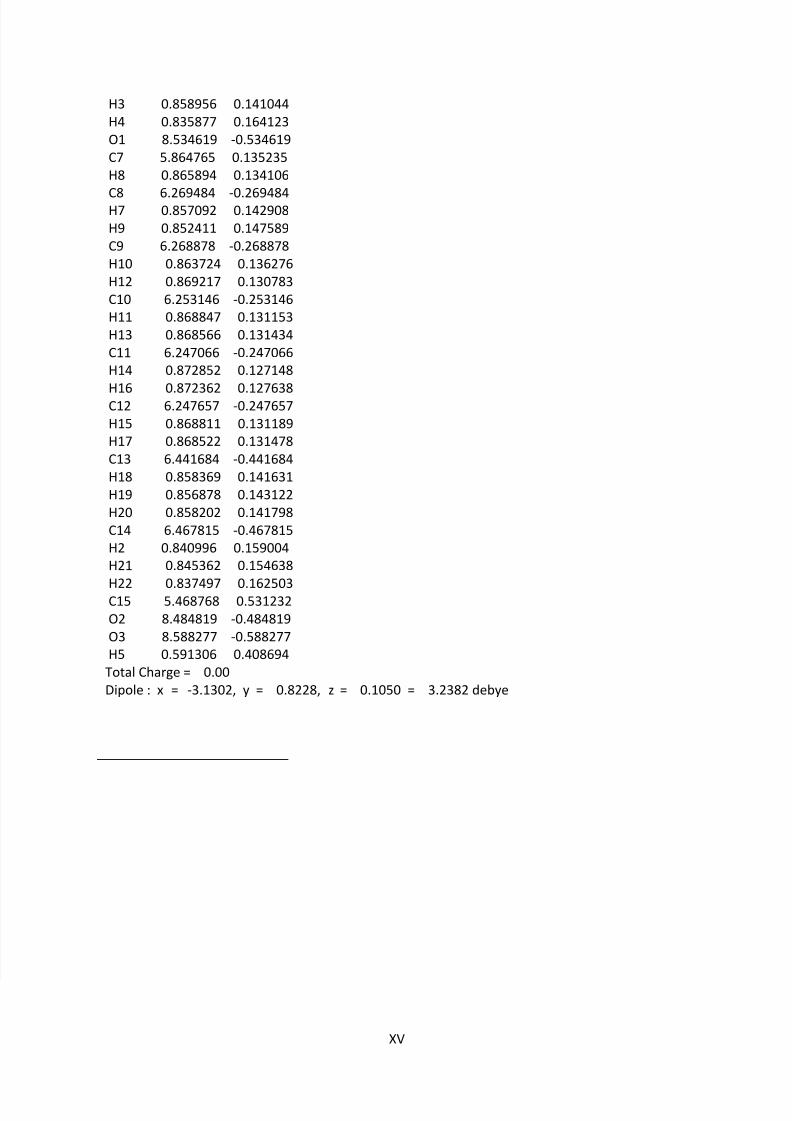
8/8/2019 Master Thesis - Jonas Sellberg
http://slidepdf.com/reader/full/master-thesis-jonas-sellberg 105/105
H3 0.858956 0.141044H4 0.835877 0.164123O1 8.534619 -0.534619C7 5.864765 0.135235H8 0.865894 0.134106
C8 6.269484 -0.269484H7 0.857092 0.142908H9 0.852411 0.147589C9 6.268878 -0.268878H10 0.863724 0.136276H12 0.869217 0.130783C10 6.253146 -0.253146H11 0.868847 0.131153H13 0.868566 0.131434C11 6.247066 -0.247066H14 0.872852 0.127148
H16 0.872362 0.127638C12 6.247657 -0.247657H15 0.868811 0.131189H17 0.868522 0.131478C13 6.441684 -0.441684H18 0.858369 0.141631H19 0.856878 0.143122H20 0.858202 0.141798C14 6.467815 -0.467815H2 0.840996 0.159004H21 0.845362 0.154638
H22 0.837497 0.162503C15 5.468768 0.531232O2 8.484819 -0.484819O3 8.588277 -0.588277H5 0.591306 0.408694
Total Charge = 0.00Dipole : x = -3.1302, y = 0.8228, z = 0.1050 = 3.2382 debye