Embed Size (px)
Citation preview

Automating self-regulation of insulin-dependentdiabetics by using fuzzy logic
Rij kg universi tei t GroningenWiskunde en Informatica
Supervisor: Dr. Ir. J.A.G. Nijhuis
Rijksuniversitejt GroningenBibliotheek Wiskunde & Informatica
Postbus 8009700 AV GroningenTel. 050 . 3634001
MASTER THESISIN
COMPUTER SCIENCE
CONTROLLING DIABETES
Martijn Dijkstra
March 2003

Abstract
The consequences of diabetes mellitus, a metabolic disease, put the society to great expenses.A diabetic himself, especially with respect to the type-I variant (insulin dependent diabetesmellitus), is for the main part responsible for the seriousness of these consequences. Withadequate regulation it is even possible to reduce the likelihood of future complications to thatof a non-diabetic. The research described in this thesis aims at two different approaches ofregulating diabetes by predicting and advising control actions to be employed by a type-Idiabetic. The first, modelling the patient specific diabetes mellitus system and deriving acontrol action is shown to be much too premature to be used sensible and safe. Next,modelling the decision behaviour of a skilled diabetic by means of Fuzzy Logic theory isproposed and implemented in a specific case. Such systems can be used to enlightendiscussion between doctor and patient on the one hand, and to support diabetics indetermining adequate control actions on the other hand.
Rijksuniversiteit GroningenBibliotheek Wiskunde & Informatica
Postbus 8009700 AV GroningenTel. 050 - 363 40 01
2

Content
INTRODUCTION ..1.1 ABBREVIATIONS .5
2 DIABETES MELLITUS 6
2.1 ORiGINS 6
2.2 THE ROLE OF INSULIN
2.3 THE PANCREAS, ISLETS OF LANGERHANS, AND BETA CELLS 8
2.4 WHERE BLOOD SUGAR COMES FROM 8
2.5 THE KIDNEY DAM
2.6 TYPES OF DIABETES 9
2.7 CAUSES OF DIABETES 10
2.8 CONTROLLING DiABETES 10
2.9 IMPORTANT PHENOMENON'S 11
3 TECHNOLOGY IN DIABETES CARE . ......... .. .. 13
3.1 INTRODUCTION 13
3.2 FACTORS OF INFLUENCE ON BLOOD GLUCOSE LEVEL 15
3.3 MODEL BASED APPROACH 16
3.4 NON-MODEL BASED APPROACH 38
3.5 CONCLUSIONS TECHNOLOGY IN DIABETES Cft.i 43
4 MODELLING THE SELF-REGULATING IDDM-PATIENT ........... .. 44
4.1 DEFINING THE STRUCTURE 44
4.2 THE CONCEPT IDEA 47
4.3 DESIGNING THE CONTROLLER 50
5 PRESENT-DAY SELF-REGULATION .. 51
5.1 STARTING SELF-REGULATION TAKING 4 SHOTS PER DAY 51
5.2 CONVERSION TO FUZZY LOGIc 52
6 DATA EXTRACTION .. ......_--...-—...-. 56
6.1 DEFINmONS, LINGUISTIC TERMS AND DATA EXTRACTION 56
6.2 THE LOGBOOK 57
7 MODEL STRUCTURE ACCORDING CHARACTERISTICS DM-SYSTEM ........ 66
7.1 SUBDIVIDING THE CONTROL AD VICES 66
7.2 ADVICE SPECIFIC STRUCTURES 67
8 EVENT RELATED MODEL STRUCTURE IMPLEMENTATION 70
8.1 WAKEUP 70
8.2 BREAKFAST - INJECTION AT WAKING UP 75
8.3 BREAKFAST — INJECTION AT BREAKFAST 82
9 TESTING .. •...•-..... m........................... 85
9.1 PERFORMANCE 85
9.2 INTERNAL WORKING ACCORDING TO TEST CASE 86
9.3 EVALUATION 93
10 EVALUATION FUZZY LOGIC CONTROLLER IMPLEMENTATIONS 94
10.1 PRESENT-DAY STARTING WITH SELF-REGULATION 9410.2 WAKINGUP 95
10.3 BREAKFAsT - INJECTION AT WAKING UP 9610.4 BREAKFAST — INJECTION AT BREAKFAST 9610.5 EvALUATION OF THE USE OF FUZZY LOGIC AND FUZZYTECH 97
10.6 CONCLUSIONS 97
3

11 SAFETY OF FUZZY LOGIC CONTROLLERS .99
12 FINAL CONCLUSIONS 100
13 FUTURE WORK 102
14 BIBLIOGRAPHY 105
4

1 Introduction
Diabetes mellitus is a metabolic disease. In Europe about 30 million people suffer fromdiabetes; 20% of them require exogenous insulin administration to survive (insulin-dependentpatients). Recent medical evidences show that a better metabolic control achieved throughIntensive Insulin Therapy can delay or prevent the development of long-term complications.It requires frequent insulin injections, accurate blood glucose monitoring and strictsurveillance by health care professionals. This patient management procedure is expensiveand time-consuming. It is calculated that 7% of the total European health care expenditures isabsorbed by diabetes care. This thesis aims toward controlling insulin dependent diabetes.
After a brief description of the disease in the first chapter, a vast investigation of literature isdiscussed with regard to the technology in diabetes care. Research in literature aboutcontrolling diabetes is done in two directions, model based and non-model based. The first isabout constructing a model of the metabolic processes w.r.t. diabetes in the body. With thehelp of these models predictions about the course of the blood glucose level are done onbehalf of deriving adequate compensatory control actions. Because the first idea was toinvestigate (c.q. eventually improve) these models, much effort is devoted to this subject.Although a small proposal is done in section 3.3.6, the conclusions are that these models arefar too premature. Information in literature about the non-model based approach ofcontrolling diabetes is very scarce. Some — rather random selected — approaches are discussedand f'urther research in this direction is substantiated. The investigated approaches of bothdirections in literature are evaluated by the measure they incorporate or take into account thefactors that are of influence on the blood glucose level. These are discussed in the beginningof the chapter about the present days technology in diabetes care.
The remainder of this thesis is about the author's own project about modelling the self-regulating insulin dependent diabetes mellitus patient. It starts with defining the structure andexplaining the concept idea. The author developed three subsystems that reproduce andsometimes even improve his reasoning about adequate control actions. Actually, the author'sway of reasoning is implemented using Fuzzy Logic theory. These systems are lifestyle-specific improvements on the way of reasoning that is provided to patients starting self-regulation nowadays. The systematically derivative of the model structure according to thecharacteristics of the DM-system is discussed before dealing with the event related modelstructure implementation in FuzzyTech.
After discussing the implementation, testing the systems is discussed with regard totwo scenarios. The internal working of one of the systems is discussed with the help of a testcase and a day out of the author's logbook. All fuzzy logic controller implementations aresubjected to an evaluation. After drawing some intermediate conclusions, the safety of FuzzyLogic controllers is discussed. Before concluding this thesis with a chapter about the(eventual) (near) future work in this research, the fmal conclusions are drawn.
1.1 AbbreviationsThe abbreviations that are listed below are used in this thesis.
BG Blood GlucoseIDDM Insulin Dependent Diabetes MellitusNIDDM Non Insulin Dependent Diabetes Mellitus

2 Diabetes Mellitus
Although controlling type I diabetes is central in this research project, this chapter first gives a
global impression of the disease. The most important historical facts and properties of thedisease, including the role of the hormone insulin and the origin of blood sugar, are discussed.The knowledge about the causes of diabetes is also discussed and some introducing commentis made on its controlling. The chapter ends with a description of two important phenomenonsthat affect the regulation of the disease. Unless otherwise specified, the information in thischapter is taken from [w31], a web page produced by the university of Massachusetts MedicalSchool, however some sentences are rephrased and some pictures are changed slightly, and asubscript is added. We comment that the impression
2.1 OriginsThe medical name for diabetes, diabetes mellitus, comes words with Greek and Latin roots.
Diabetes comes from a Greek word that means to siphon. The most obvious sign ofdiabetes is excessive urination. Water passes through the body of a person with diabetes as ifit were being siphoned from the mouth through the urinary system outof the body.
Mellitus comes from a Latin word that means sweet like honey. The urine of a personwith diabetes contains extra sugar (glucose). In 1679, a physician tasted the urine of a personwith diabetes and described it as sweet like honey.Anyone can get diabetes. According to [w30] approximately 17 million people in the UnitedStates, or 6.2% of the population, have diabetes. While an estimated 11.1 million have beendiagnosed, unfortunately, 5.9 million people (or one-third) are unaware that they have the
disease.In the table below some important dates related to the origin of diabetes are summed up.
It concerns merely a small part of a more detailed table from [w32].
6
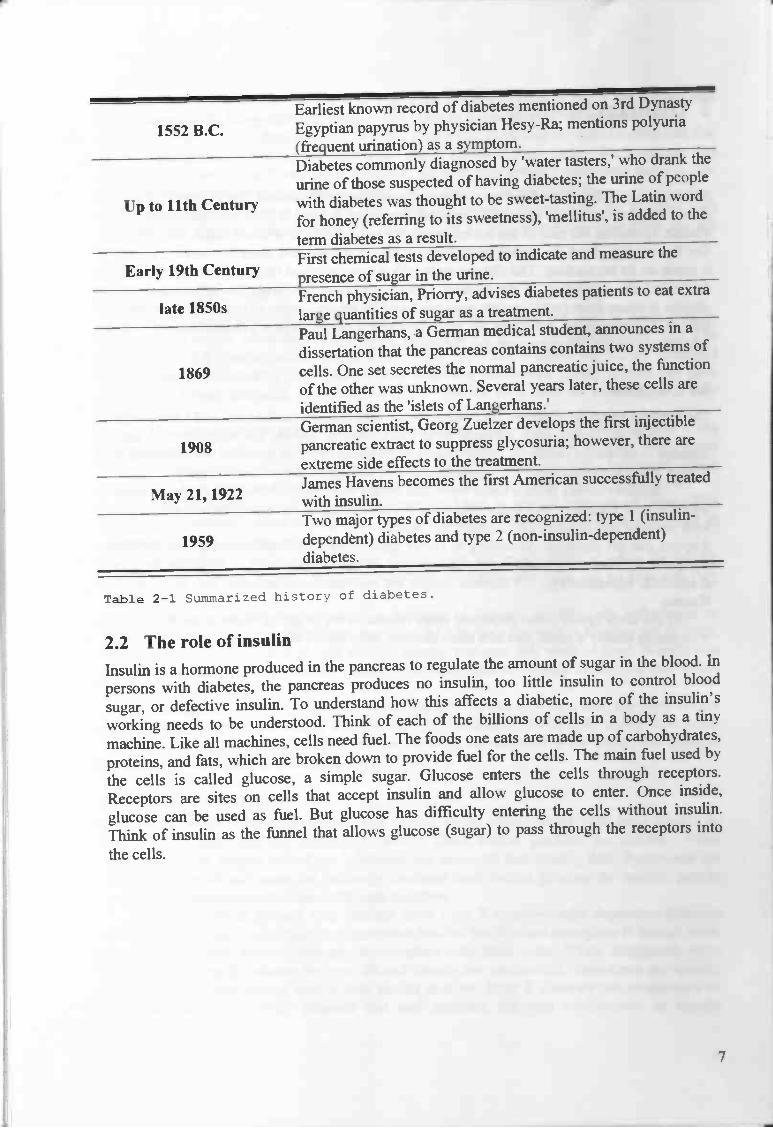
Earliest known record of diabetes mentioned on 3rd Dynasty
1552 B.C. Egyptian papyrus by physician Hesy-Ra; mentions polyuria(frequent urination) as a symptom.Diabetes commonly diagnosed by 'water tasters,' who drank the
urine of those suspected of having diabetes; the urine of people
Up to 11th Century with diabetes was thought to be sweet-tasting. The Latin word
for honey (referring to its sweetness), 'mellitus', is added to the
term diabetes as a result.First chemical tests developed to indicate and measure the
Early 19th Century presence of sugar m the urine.
1850French physician, Priorry, advises diabetes patients to eat extra
a e Slarge quantities of sugar as a treatment.Paul Langerhans, a German medical student, announces in a
dissertation that the pancreas contains contains two systems of
1869 cells. One set secretes the normal pancreatic juice, the functionof the other was unknown. Several years later, these cells areidentified as the 'islets of Langerhans.'German scientist, Georg Zuelzer develops the first injectible
1908 pancreatic extract to suppress glycosuria however, there are
extreme side effects to the treatment.James Havens becomes the first American successfully treated
May 21, 1922 with msuhn.Two major types of diabetes are recognized: type I (insulin-
1959 dependent) diabetes and type 2 (non-insulin-dependent)diabetes.
Table 2-1 Summarized history of diabetes.
2.2 The role of insulinInsulin is a hormone produced in the pancreas to regulate the amount of sugar in the blood. In
persons with diabetes, the pancreas produces no insulin, too little insulin to control blood
sugar, or defective insulin. To understand how this affects a diabetic, more of the insulin's
working needs to be understood. Think of each of the billions of cells in a body as a tiny
machine. Like all machines, cells need fuel. The foods one eats are made up of carbohydrates,
proteins, and fats, which are broken down to provide fuel for the cells. The main fuel used by
the cells is called glucose, a simple sugar. Glucose enters the cells through receptors.Receptors are sites on cells that accept insulin and allow glucose to enter. Once inside,glucose can be used as fuel. But glucose has difficulty entering the cells without insulin.Think of insulin as the funnel that allows glucose (sugar) to pass through the receptors into
the cells.
7
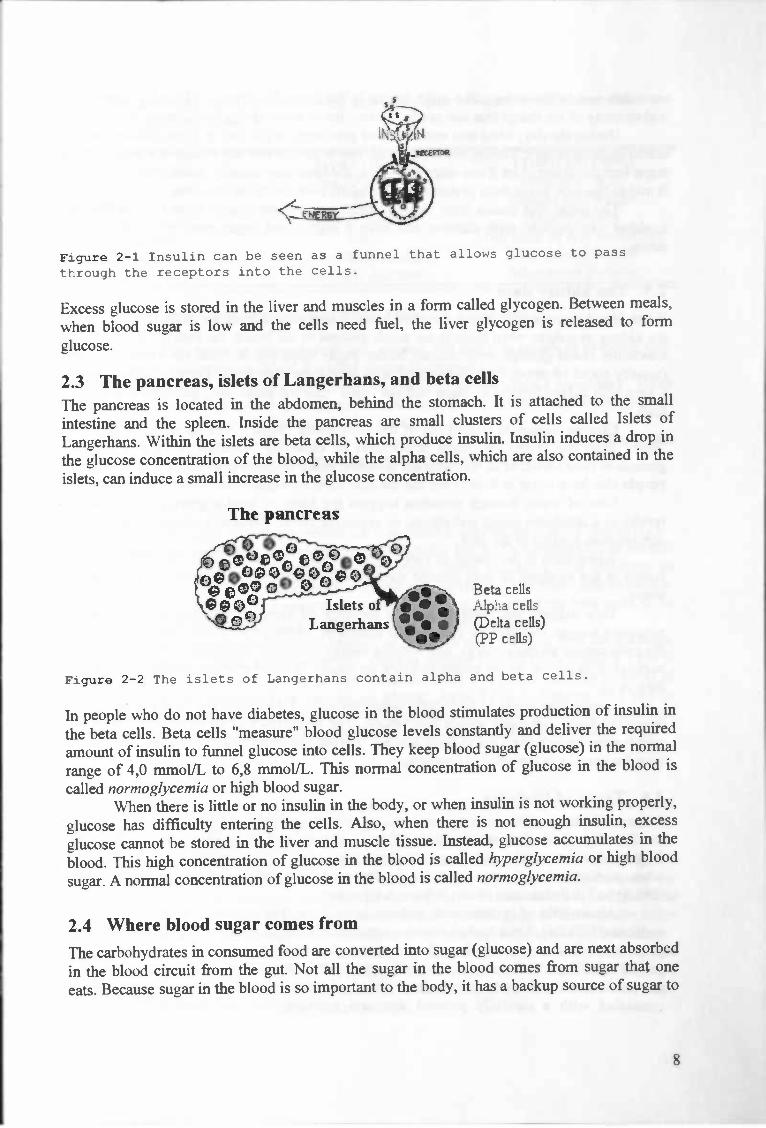
Figure 2-1 Insulin can be seen as a funnel that allows glucose to passthrough the receptors into the cells.
Excess glucose is stored in the liver and muscles in a form called glycogen. Between meals,when blood sugar is low and the cells need fuel, the liver glycogen is released to formglucose.
2.3 The pancreas, islets of Langerhans, and beta cells
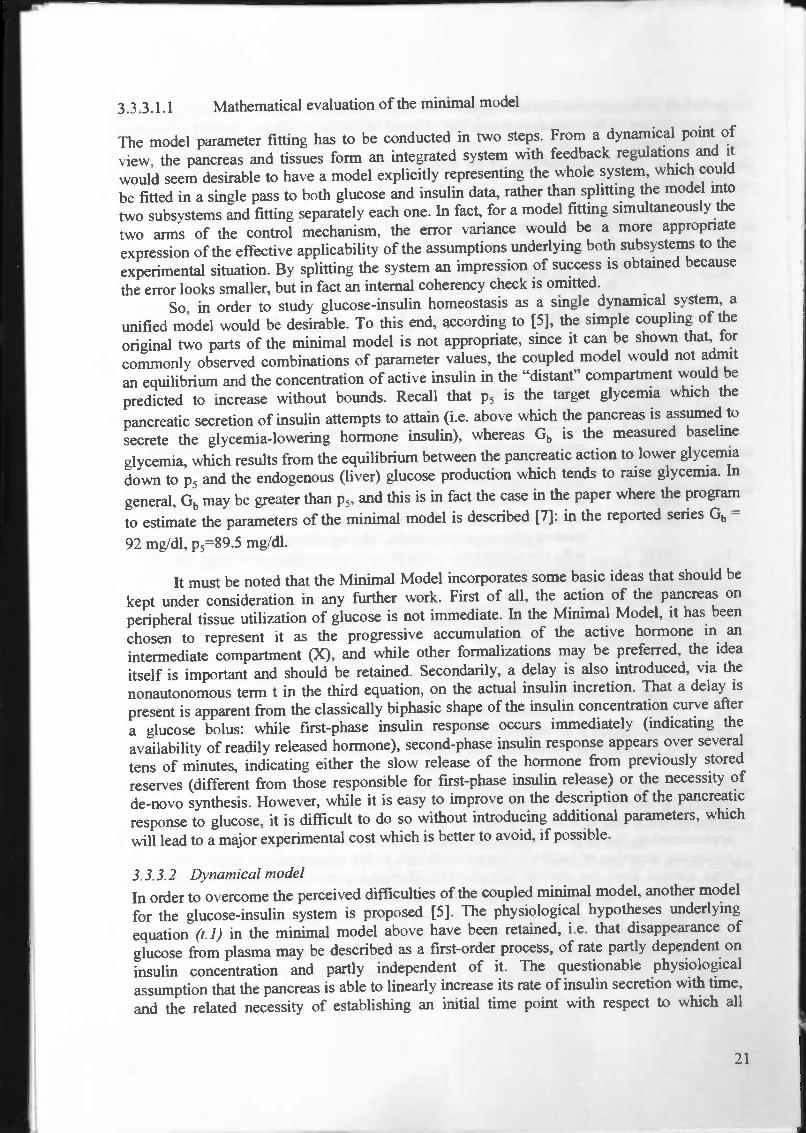
The pancreas is located in the abdomen, behind the stomach. It is attached to the smallintestine and the spleen. Inside the pancreas are small clusters of cells called Islets ofLangerhans. Within the islets are beta cells, which produce insulin. Insulin induces a drop inthe glucose concentration of the blood, while the alpha cells, which are also contained in theislets, can induce a small increase in the glucose concentration.
The pancreas
Beta cellsAlpha cells(Delta cells)(PP cells)
Figure 2-2 The islets of Langerhans contain alpha and beta cells.
In people who do not have diabetes, glucose in the blood stimulates production of insulin in
the beta cells. Beta cells "measure" blood glucose levels constantly and deliver the required
amount of insulin to funnel glucose into cells. They keep blood sugar (glucose) in the normal
range of 4,0 mmolJL to 6,8 mmoL'L. This normal concentration of glucose in the blood is
called normoglycemia or high blood sugar.
When there is little or no insulin in the body, or when insulin is not working properly,
glucose has difficulty entering the cells. Also, when there is not enough insulin, excess
glucose cannot be stored in the liver and muscle tissue. Instead, glucose accumulates in the
blood. This high concentration of glucose in the blood is called hyperglycemia or high blood
sugar. A normal concentration of glucose in the blood is called normoglycemia.
2.4 Where blood sugar comes from
The carbohydrates in consumed food are converted into sugar (glucose) and are next absorbed
in the blood circuit from the gut. Not all the sugar in the blood comes from sugar that one
eats. Because sugar in the blood is so important to the body, it has a backup source of sugar to
8

use when one is not eating. The main source is the liver. The liver is like a big factory thatmakes many of the things that one needs to live. One of those things is blood sugar.
During the day, when one eats, the liver puts some sugar into storage. Doctors call thisstored sugar glycogen. During the night when one is asleep and not eating, the liver puts thatsugar into the blood. And if one skips breakfast, the liver may actually make new sugar to use.It makes this new sugar from proteins that are taken away from our muscles.
The sugar that comes from the liver (and to a smaller degree from the kidneys, too)explains why persons with diabetes can have a high blood sugar even when they are noteating.
2.5 The kidney damWhen blood glucose rises above a certain level, it is removed from the body in urine. Picturethe kidney as a dam: when there is too much glucose in the blood, the excess "spill" out. Themaximum blood glucose level reached before sugar spills out is called the kidney threshold(usually about 10 mmoIfL). Some people with long-term diabetes or kidney disease can havea very high kidney threshold. Sugar will not "spill" into the urine until the blood sugar is veryhigh.
Glucose cannot be passed out of the body alone. Sugar sucks up water so that it can"flow" from the body. The result is polyuria or excessive urination. People with excessglucose in their blood, as in uncontrolled diabetes, make frequent trips to the bathroom. Thesepeople also have sugar in their urine; the medical term for sugar in the urine is glycosuria.
Loss of water through urination triggers the brain to send a message of thirst. Thisresults in a condition called polydipsia, or excessive thirst. Excessive urination can result indehydration, leading to dry skin.
When there is no insulin to funnel glucose into the body's cells, or when the insulinfunnel is not working to pass glucose through the receptors, the cells get no fuel and theystarve.
This triggers the brain to send a message of hunger, resulting in polyphagia orexcessive hunger. Because the glucose that should be fuelling the cells is flowing out in urine,the cells cannot produce energy, and without energy, one may feel weak or tired. Weight lossmay occur in people whose bodies produce no insulin because without insulin, no fuel enterstheir cells.
Insulin also works to keep fuels inside the cells. When insulin is low, the body breaksdown the fuels, and rapid weight loss results. The breakdown of fat cells forms fatty acidswhich pass through the liver to form ketones. Ketones are excreted in the urine. The medicalterm for ketones in the urine is ketonuria.
2.6 Types of DiabetesAlmost all people with diabetes have one of two major types. About 10% have Type I orinsulin dependent diabetes mellitus (IDDM). Their bodies produce no insulin. Whendiagnosed, most people with Type I diabetes are under 40 and usually thin. Symptoms areoften pronounced and come on suddenly. Because their bodies produce no insulin, peoplewith Type I diabetes must obtain it through injection.
About 90% of persons with diabetes have Type II or non-insulin dependent diabetesmellitus (NIDDM). Their bodies produce some insulin, but it is not enough or it doesn't workproperly to funnel glucose through the receptors into their cells. When diagnosed, mostpeople with Type II diabetes are over 40 and usually are overweight. Symptoms are usuallynot pronounced and appear over a long period of time. Type II diabetes can sometimes becontrolled with a carefully planned diet and exercise, but oral medications or insulin
9

injections may be necessary. The following table highlights some of the differences betweenType I and Type II diabetes.
Type I (IDDM) Type II (NIDDM)Age at onset Usually under 40 Usually over 40Body weight Thin Usually overweightSymptoms Appear suddenly Appear slowlyInsulin produced None Too little, or it is ineffectiveInsulin required Must take insulin May require insulinOther names Juvenile diabetes Adult onset diabetes
Table 2-2 A comparison of the major two types of diabetes.
People whose blood contains more glucose than normal, but less than occurs in diabetes, maybe diagnosed with a condition called impaired glucose tolerance (IGT).
Some women experience a rise in their blood glucose level during pregnancy. Thesewomen have a condition called gestational diabetes mellitus (GDM). Their blood glucoselevels usually return to normal after their babies are born.
Other types of diabetes may occur as a result of diseases of the pancreas or theendocrine (gland) system, genetic disorders, or exposure to chemical agents.
2.7 Causes of diabetesIn this section the causes of diabetes, which are type-related, are discussed according to [11].
Probably there is not one evident cause for IDDM, but is it a combination of severalfactors. Firstly a heritable tendency is assumed. Next, after, e.g. by a viral infection aninflammation in the islands of Langerhans is developed, the disease can come into existence.Here antibodies against the own pancreas are formed causing almost all the beta cells to bedestroyed. Because the production of insulin stops, the diabetes originates.
If one has a parent, grandparent, brother, or sister, or even a cousin who has diabetes,he is more likely to develop diabetes himself. There is about a 5% risk of developing Type IIdiabetes if the mother, father, or sibling has diabetes. There is a higher risk (up to 50%) ofdeveloping Type II diabetes if the parent or siblings have Type II diabetes and one is
overweight. Eighty percent of people with Type II diabetes are overweight when diagnosed.Diabetes symptoms disappear in many of these obese patients when they lose weight.
2.8 Controlling diabetesThere are no easy cures for most cases of diabetes. Some persons with diabetes can be curedby a transplant of insulin producing cells, but there are significant risks associated with thesurgery and with the immunosuppression-type drugs that need to be taken.But even if diabetes cannot usually be cured, it can be controlled. Control of diabetes meansbalancing the amounts of glucose and insulin in the blood. To achieve this balance, thediabetes nurse educator or doctor will prescribe a regimen of diet, exercise, and possiblyinsulin injections or oral medications, dependent on the type. Sticking to the regimen helpskeep one healthy and greatly reduces the likelihood of developing diabetes complications.People with diabetes are vulnerable to a variety of complications over time. Health-careproviders all agree that strict control of blood sugar makes complications less likely. This wasshown clearly by the Diabetes Control and Complications Trial ([28]). Control of blood sugaris the best way to minimize the risk of complications.
10

Measures that can be used to evaluate level of control are Blood Glucose (BG) (Ca.
four daily) and percentage of glycated (simplistically speaking "glucose coated") hemoglobin,HbA,. This HbAj percentage is a loose indication of BG average over a period ofapproximately two months (the average life time of red blood cells), and is measured in thatfrequency. Percentage of 1-IbA j has been found to have a good correlation to development ofcomplications [23], and is used clinically as measure of diabetes control in preference to timeseries data of BG levels.
The difficulty of using HbAj to measure control performance is the fact that there is
only one data point every two months. In [24] an average measure based on magnitude ofglucose excursion from normoglycemia, known as the Mean Amplitude Glucose Excursion(MAGE) and is computed by taking an average of a penalty function on blood glucose (BG),
J(BG), named the M-value. So MAGE = ---J(BGk), where J(BG) = 10.1Øg10()3.
NkIThis penalty function is shown in the figure below. According to [24], s = 4.4 mmolIL wasreported to have differentiated between brittle and stable diabetics best.
x
Figure 2—3 The M-value curve: 10. 11og10(x/s) i, for s 4.4 mmol/L.
2.9 Important phenomenon'sIn this section two important phenomenon's that can occur in a diabetic body, the Somogyieffect and the Dawn Phenomenon, are discussed because they are relevant in controllingIDDM. The definitions are taken from [w29].
The Somogyi effect is a swing to a high level of glucose (sugar) in the blood from anextremely low level, usually occurring after an untreated insulin reaction during the night.The swing is caused by the release of stress hormones to counter low glucose levels. Peoplewho experience high levels of blood glucose in the morning may need to test their bloodglucose levels in the middle of the night. If blood glucose levels are falling or low,adjustments in evening snacks or insulin doses may be recommended. This condition isnamed after Dr. Michael Somogyi, the man who first wrote about it. Also called "rebound."
11
1
4 6 8 10 i:

The dawn phenomenon is a sudden rise in blood glucose levels in the early morninghours. This condition sometimes occurs in people with insulin-dependent diabetes and (rarely)in people with NIDDM. Unlike the Somogyi effect, it is not a result of an insulin reaction.People who have high levels of blood glucose in the mornings before eating may need tomonitor their blood glucose during the night. If blood glucose levels are rising, adjustments inevening snacks or insulin dosages may be recommended.
12

3 Technology in diabetes care
3.1 IntroductionA vast investigation of literature is done with the eye on getting home in the technical jargon,and getting a good picture of the current state of art. In this way an overview is created ofwhat has been done already and what hasn't been done. This chapter presents a survey ofcontrol algorithms aimed tot stabilize diabetes mellitus, with discussion on the approachestaken and the challenges faced. The information from [1] is used as outline for the impressionabout the compartmental, minimal and dynamical models.
Many works have been directed into developing some sort of control algorithm forIDDM, ranging from continuous control for insulin infusion — aiming towards a fullyautomatic "artificial pancreas", "insulin advisors" — for patients taking the multiple dailyinjection therapy, and various simulation-models, used for educational or parametercalculation purposes. The discussion is focused on the "insulin advisor" type, as this is whatthis thesis aims towards. The various blood glucose models will also be discussed, since someinsulin advising algorithms use models to derive the insulin dose.
This problem can be approached from two angles: model the glucose system or modelthe control rules, typically known as respectively the "model based" approach (since a modelof the plant is constructed) and the "non-model based" approach (since the plant is consideredas a black box), respectively. The fundamental difference between the two approaches lies inwhere the parameters belong, and in the case of adaptive systems, which parameters areupdated.
In a model based system, as illustrated in Figure 3-1, a model of the plant isconstructed, and the parameters describe the plant behaviour. The controller receivesinformation from the model and executes a control action to the plant. If the plant output doesnot meet the requirement, it is possibly because the model does not adequately represent plantbehaviour, and may be updated. These parameters belong to the model, and it is the modelthat is updated. The resulting difference in control action is due to the different model — the
control algorithm itself remains the same.
H

On the other hand, non-model based systems are not concerned with full knowledge of theplant. As shown in Figure 4-2, the controller takes output of the plant, and executes a controlaction to the plant. If the result does not meet the requirement, then parameters of thecontroller are updated. Since the focus of such systems is on the control rules, they are alsocalled rule based systems.
If we compare the two approaches, we can say the following. If eventually the same controlleris developed, then a model based approach deserves priority above a non model basedapproach, because of the following reasons:
14
Figure 3-1 Diagram of a model based adaptive system.
Figure 3-2 Diagram of a non model based adaptive system.

• intuitively much clearer;• tighter to physiological reality;• more easy to improve;• one can easily chance things in a model and then calculate the outcome.
When choosing for a construction, using a model based approach, the following things haveto be investigated in our opinion. The glucose-insulin metabolism has to be understood,together with the exact influence of food, insulin and exercise on the system. The minimalmodel and the dynamical model, discussed in one of the following sections, model theglucose-insulin metabolism in healthy people with respect to only glucose and insulin. Hereother influences on the system were tried to keep constant. Also some of the formal problemsof the models will be mentioned. One small section is devoted to subcutaneous injectedinsulin profiles, followed to an example of coupling the subcutaneous injected insulin kineticsto such a model. The section about model based approaches is concluded with the modelsused in two well-known diabetes advisory systems.
After discussing the glucose-insulin metabolism and their models, an abstractingsummary with conclusions is given in the section "Evaluation Model Based Approach". Thissection also provides a preview on the non model based approach.
However, we start with a short section about factors that influence the blood glucoselevel of people with diabetes. These factors are among the criteria for assessing theappropriateness of a model; the way a model incorporates this factors, decides its
appropriateness.
3.2 Factors of influence on blood glucose levelFor all clarity, with blood glucose (BG) level, we mean the amount of glucose per litre bloodplasma. As mentioned in the chapter about the disease IDDM, there are many factors whichinfluence the BG. Some are measurable, some are difficult to measure, and for some it isalmost impossible to measure them (precisely). One of the main factors, which influence BG,is the carbohydrates in food, which end up in the blood stream after digestion by absorption asglucose from the gut. Obviously this raises the BG. The amount of carbohydrate in food isnowadays easy to measure or calculate. One of the main factors causing a drop in BG isinsulin, which takes care for the transport of glucose into the cells that need it for 'fuel'. Theamount of insulin one takes is also easy to measure, and is simply expressed in a number ofstandard units. However, the activity of a person is very difficult to measure exactly. In Table3-1, the most important factors raising BG or causing a drop in BG are mentioned.
Factors that cause BG to dropFactors that cause BG to raiseFood (carbohydrates) Insulin
Stress ExerciseIllness Alcohol
Dawn phenomenon (Temperature outside)Somogy effect
Exercise
Table 3—1 Factors of influence on BG.
The factors will briefly be discussed.We have to comment that BG influences itself. A high BG level will cause the liver to storemore glucose. Also, when BG becomes a little bit too low, the liver releases glucose.
15

The glycemic index (the GI Factor) is simply a ranking of foods based on theirimmediate effect on blood glucose levels. It measures how much your blood glucose increasesover a period of two or three hours after a meal. Generally, foods high in fat and protein havelower glycemic indexes than foods high in carbohydrate. The problem is that even among thecomplex carbohydrate not all are created equal. Some break down quickly during digestionand can raise BG to dangerous levels. These are the foods that have higher glycemic indexes.Other carbohydrates break down more slowly, releasing glucose gradually into our bloodstreams and are said to have lower glycemic indexes.
The body responds to stress with a chain reaction of biological events that result in anincrease in blood sugars, faster heart rate, and a rise in blood pressure. These physiologicalresponses were designed to help us survive, choosing "fight or flight".
Illness causes a certain amount of stress on the body. While not the same as emotionalstress, physical stress can cause your body to release hormones. These hormones can causethe level of glucose in your blood to rise. This is probably to give the body the energy it needsto heal itself.
The way BG reacts to exercise is dependent of the value of the BG when the exerciseis started. If the BG is above about 18 mmol/L, then it is possible that it raises further, butnormally it will drop down. Not only during exercise, but even for several hours afterward theBG can drop. Some possible reasons for this are that the glucose transport to the cells bydiffusion is increased, that the hepatic and tissue insulin sensitivity is increased so that theystore more glucose with less insulin, and that there flows more blood through the tissue thatcontains remainders of earlier insulin injections.
The dawn phenomenon occurs in the morning when people get up. It is a naturalreaction of the body to make the person ready for the day and to take care of energy supply.
The Somogy effect is a counter regulatory action of the liver, when BG levels are toolow during the night. When this effect appears, the liver releases a boost of glucose whichresults in hyperglycaemia.
Insulin takes care of transport of glucose from the blood plasma to the cells, and so itcauses a drop in the BG.
Alcohol increases the ability of the liver to store the glucose that circulates in theblood plasma, and so consumption of it will result in a drop of the BG.
Also small other effects as the temperature outside can affect BG; when it is warmeroutside, the insulin is absorbed faster. The factor 'temperature outside' is only mentioned forexample of other less relevant factors of influence. The site where insulin is injected is also ofinfluence on the absorption rate of the insulin. Sometimes, e.g. because of a bad blood flowthrough the tissue where the injection took place, the absorption is much less than normally.Also, an injection in the abdomen results in a faster absorption of insulin than an injection inthe upper leg.
In the following section the model based approach of controlling the diabetes is discussed andevaluated. With these models a prediction of the time course of BG can be made. The factors,mentioned in this section, are the most important factors that influence this course, so theycan be used in the evaluation of a model. Models should incorporate these factors in highmeasures.
3.3 Model based approachThe principles of non-linear dynamics theory may improve our understanding of the difficultblood glucose control in diabetes, may lead to alternative control strategies in selected
16

individuals, and might even enlighten the issues involved in automated glucose control for the
fi.iture, according to [17].Difficulties in understanding blood glucose (G) behaviour may be the result of a
tendency to assume linear relationships between its numerous determinants. Under conditionsof constant or zero exercise, a simplified model representing the traditional linear view might
be:G(post-prandial) = G(preprandial) + a(C — I)
where C and I are the amount of carbohydrate eaten at the last meal and the insulin injectedbeforehand or secreted since, respectively, and 'a' is a constant determined by patient-specificparameters such as body mass index and insulin sensitivity. This is the model on which thetraditional 'weighing scales' metaphor of diabetes control is based: correcting for differentunits, if C 'balances' I at each meal, the glucose level should remain stable.
Clearly, if 'a' is in fact a variable, the equation becomes non-linear. The tendency tomistake variables for constants has been identified as a basis for the inadequacy of linearmodels more generally in patho-physiology. Such models are appropriate in only a minorityof real-life situations.
The model might be better described by a differential equation that includes dG/dt, therate of change of glucose with respect to time. Such an equation might then do justice to thedynamics through which the numerous detenninants of blood glucose are related.
It is natural to think of the glucose regulatory system as a system of compartments; in thiscase, the glucose compartment and insulin compartment. In essence, the two compartmentsare separate, but can affect each other. Within each of the two compartments, there could bemore compartments, where contents are exchanged. This model framework, known ascompartmental modelling, is very commonly used in modelling glucose metabolism.
A brief overview of compartmental modelling will be presented, prior to an expositionof various models and model based systems. The glucose regulatory system is in itself acontinuous time system. This philosophy has been adopted by some. Others take a discretetime stance due to the nature of available data.
3.3.1 Compartmental modelsCompartmental modelling is a framework where the system is considered as a composition ofsubsystems, called compartments, where there is exchange/transport of contents with eachother and with the environment [2].
Each compartment can be described in this way. For an N-compartmental system incontinuous time, consider compartment i, with content m,. The material transports are:between compartments i and j, denoted F, and F,, and with the environment I and F01, asillustrated in Figure 4-3.
17
-U

Compartments obey the conservation of mass. Let the flows F, =J,m, be expressed, where ingeneraljj can be functions of m and t. The balance equation can be expressed by:
m, '= (—f', m, + f,,mrn,) +1, —
Compartmental modeling is used anywhere in the model based approach. In the following,
some of the models are going to be investigated, with the purpose to enhance our insights inthe glucose-insulin metabolism. The next section is about a test, performed in healthy people.The subjects are in rest, and their blood and insulin plasma concentrations are stable. Only theglucose and blood plasma concentrations are monitored after an injection of glucose in theirveins, while trying to keep other influences constant.
3.3.2 Intravenous Glucose Tolerance Test (IVG1'T)Here a standard NG1T is described, derived from [5].Ten healthy volunteers (5 males and 5 females) participated in the study. They hadmaintained a constant body weight for the six months preceding the study. For the three dayspreceding to the study each subject followed a standard composition diet. Each study wasperformed at 8:00 AM, after an overnight fast, with the subject supine in a quiet room withconstant temperature of 22—24 °C.At time 0 (0') a 33% glucose solution (0.33g Glucose I kg body weight) was rapidly injected(less than 3 minutes) in a vein of one arm. Blood samples were obtained at -30', -15', 0', 2',4', 6', 8', 10', 12', 15', 20', 25', 30', 35', 40', 50', 60', 70', 80', 100', 120', 140', 160 and180' the contra lateral arm vein.The plasma levels of glucose and insulin obtained at -30', -15' and 0' were averaged to yieldthe baseline values referred to 0'.
3.3.3 Modelling the IVGTTWe think it is important to study models that describe the IVGU, because in our opinion thisis the foundation of the glucose-insulin metabolism. From this foundation it should bepossible to extend it to a larger model that incorporates more factors. For example if the
18
Ii I
F1
F01
Figure 3—3 Material flow in a compartmental model.

relation of the consumption of food with the absorption rate of glucose from the gut is known,this can be incorporated in such a model.
Works in modelling of BG regulation started in the mid-1960s, due to Ackerman, et al. [3].They developed a two-compartmental model, one each for glucose and insulin in blood, withthe view of understanding further glucose dynamics after an oral glucose input and to exploreparameters of insulin response, which could be used as criteria to distinguish normal anddiabetic individuals. It assumed a damped sinusoid response to a large glucose input.
The model can be described as follows. Glucose moves from/to the blood glucosecompartment. The outward movements are both insulin independent (denoted by G,) andinsulin dependent (G1,5), and the inward movement comes from external source (Ga,). Thekinetics of G0, is assumed to be diffusive, and G,7. to be a linear function of blood hormonelevel, H. A mirroring relationship is assumed of insulin kinetics. The transport equations areexpressed as:
G'= —p1G — p12H + G,H'= p21G-pH+H
This model could be fitted to glucose measurements up to four hours after an ingestion ofglucose tablets, taken at 25 minute intervals.
The Ackerman model simulates glucose and insulin response after a stimulus, until steadystate is reached. It was observed that curves from diabetics were mostly underdamped,characterised by lower values of pj, and P22. The authors commented that even with the 15 —30 minute measurement interval, barely enough data was obtained to fit the parameters of themodel.
3.3.3.1 Minimal modelThe minimal model [4, 6], which is the model currently mostly used in physiological researchon the metabolism of glucose, was proposed in the early eighties for the interpretation of theglucose and insulin plasma concentrations following the IVGTT. It is a "set-up" to the simpletwo-compartment model. It was developed by Bergman et al. [4], by considering an array ofcompartmental framework and selecting the one whose parameters fitted the data best. Themodel, as originally proposed by the authors, is to be regarded as composed of two separateparts. The first part [4] uses equation (t. 1) and (t. 2) to describe the time course of plasmaglucose concentration, accounting for the dynamics of glucose uptake dependent on andindependent of circulating insulin; for this first part plasma insulin concentration is to beregarded as a known forcing function. The second part [6] consists of equation (r. 3) anddescribes the time course of plasma insulin concentration, accounting for the dynamics ofpancreatic insulin release in response to the glucose stimulus; for this second part plasmaglucose concentration is to be regarded as a known forcing function. The proposing authorsspecifically stated [7] that the model parameter fitting has to be conducted in two steps: first,using the recorded insulin concentration as input data in order to derive the parameters in thefirst two equations, then using the recorded glucose as input data to derive the parameters inthe third equation.
As seen above, the physiologic experiment consists in injecting into the bloodstreamof the experimental subject a bolus of glucose, thus inducing an (impulsive) increase in theplasma glucose concentration 0(t) and a corresponding increase of the plasma concentrationof insulin 1(t), secreted by the pancreas. These concentrations are measured during a three-hour time interval beginning at injection, after which time interval it is found that the
19

perturbed concentrations 0(t) and 1(t) have essentially returned to normal. In order to describethe time course of these concentrations, the Minimal Model of the glucose-insulin kinetics hasbeen proposed.
The standard formulation of the Minimal Model is used, renaming some parametersfor ease of notation:
dG(t)dt = —[p, + x(r)] G(t)+ p,Gb , G(0) = p0
dX(t)dt
=—p2x(t)+p3[I(t)—-Ib] , x(o)=o
dI(t)P4[G(t)_p5rt_p6[I(t)_Ibl , i(0)=p7 b
is the blood glucose concentration at time I [mm];is the blood insulin concentration;is an auxiliary function representing insulin-excitable tissue glucose uptakeactivity, proportional to insulin concentration in a "distant" compartment;is the subject's baseline glycemiais the subject's baseline insulinemia;is the theoretical glycemia at time 0 after the instantaneous glucose bolus;is the glucose "mass action" rate constant, i.e. the insulin-independent rateconstant of tissue glucose uptake, "glucose effectiveness";is the rate constant expressing the spontaneous decrease of tissue glucoseuptake ability;
illis the insulin-dependent increase in tissue glucose uptake ability, per unit ofinsulin concentration excess over baseline insulin;(mg/dl)' min']is the rate of pancreatic release of insulin after the bolus, per minute and permg/dl of glucose concentration above the "target" glycemia;is the pancreatic "target glycemia";is the first order decay rate constant for Insulin in plasma;is the theoretical plasma insulin concentration at time 0, above basalinsulinemia, immediately after the glucose bolus.
In Equation 3, only the positive part of the term [G(t) —p] is taken, i.e. when 0(t) is greaterthan p5 the value is taken to be [G(t) — ps], otherwise the term's value is taken to be zero. Alsoin Equation 3, the multiplication by t is introduced by the authors to express, as a firstapproximation, the hypothesis that the effect of circulating hyperglycemia on the rate ofpancreatic secretion of insulin is proportional both to the hyperglycemia attained and to thetime elapsed from the glucose stimulus [8]. Multiplying by t in this way introduces thenecessity of establishing an origin for time, binding this model to the IVGTT experimentalprocedure.
Parameters po, P1, pt, p5, p6 and i are usually referred to in the literature as Go, S0, y,n en Jo respectively, while the Insulin sensitivity index S1 is computed as p3/p2.
20
(1.1)
(t.2)
(t.3)
whereG(t)I (t)X(t)
[mg /dl)[pUl/mi][min1]
Gb [mg/dl]lb [pUl/mi]po [mg/dlJPi [min']
P2 [min']
[min2(pUI/ml)
P4 [(pUI/ml)
p [rng/dl]P6 [min']P7 [pUI/ml]
3.3.3.1.1 Mathematical evaluation of the minimal model
The model parameter fitting has to be conducted in two steps. From a dynamical point of
view, the pancreas and tissues form an integrated system with feedback regulations and it
would seem desirable to have a model explicitly representing the whole system, which could
be fitted in a single pass to both glucose and insulin data, rather than splitting the model into
two subsystems and fitting separately each one. In fact, for a model fitting simultaneously the
two arms of the control mechanism, the error variance would be a more appropriate
expression of the effective applicability of the assumptions underlying both subsystems to the
experimental situation. By splitting the system an impression of success is obtained because
the error looks smaller, but in fact an internal coherency check is omitted.
So, in order to study glucose-insulin homeostasis as a single dynamical system, aunified model would be desirable. To this end, according to [5], the simple coupling of the
original two parts of the minimal model is not appropriate, since it can be shown that, for
commonly observed combinations of parameter values, the coupled model would not admit
an equilibrium and the concentration of active insulin in the "distant" compartment would be
predicted to increase without bounds. Recall that p is the target glycemia which the
pancreatic secretion of insulin attempts to attain (i.e. above which the pancreas is assumed to
secrete the glycemia-lowering hormone insulin), whereas Gb is the measured baseline
glycemia, which results from the equilibrium between the pancreatic action to lower glycemia
down to p and the endogenous (liver) glucose production which tends to raise glycemia. In
general, °b may be greater than p, and this is in fact the case in the paper where the program
to estimate the parameters of the minima! model is described [7]: in the reported series °b =
92 mg/dl, p5=89.5 mg/dl.
It must be noted that the Minima! Model incorporates some basic ideas that should be
kept under consideration in any further work. First of all, the action of the pancreas onperipheral tissue utilization of glucose is not immediate. In the Minimal Model, it has been
chosen to represent it as the progressive accumulation of the active hormone in anintermediate compartment (X), and while other formalizations may be preferred, the idea
itself is important and should be retained. Secondarily, a delay is also introduced, via thenonautonomous term t in the third equation, on the actual insulin incretion. That a delay is
present is apparent from the classically biphasic shape of the insulin concentration curve after
a glucose bolus: while first-phase insulin response occurs immediately (indicating the
availability of readily released hormone), second-phase insulin response appears over several
tens of minutes, indicating either the slow release of the hormone from previously stored
reserves (different from those responsible for first-phase insulin release) or the necessity ofde-novo synthesis. However, while it is easy to improve on the description of the pancreatic
response to glucose, it is difficult to do so without introducing additional parameters, which
will lead to a major experimental cost which is better to avoid, if possible.
3.3.3.2 Dynamical modelIn order to overcome the perceived difficulties of the coupled minimal model, another model
for the glucose-insulin system is proposed [5]. The physiological hypotheses underlyingequation (t. 1) in the minimal model above have been retained, i.e. that disappearance ofglucose from plasma may be described as a first-order process, of rate partly dependent on
insulin concentration and partly independent of it. The questionable physiologicalassumption that the pancreas is able to linearly increase its rate of insulin secretion with time,
and the related necessity of establishing an initial time point with respect to which all
21
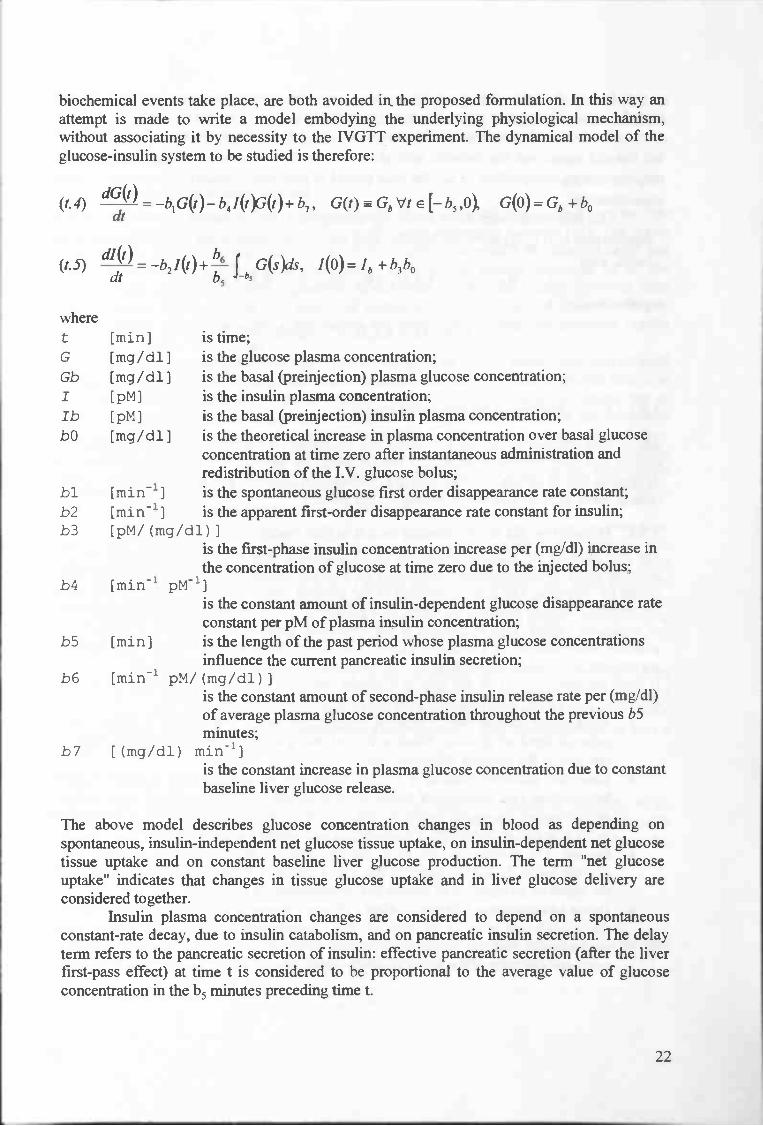
biochemical events take place, are both avoided in the proposed formulation. In this way anattempt is made to write a model embodying the underlying physiological mechanism,without associating it by necessity to the IVGTT experiment. The dynamical model of theglucose-insulin system to be studied is therefore:
(t.4) = —b1G(t)— b41(t)3(t)+ 17, G(t) Gb Vt e [— 15 ,O G(O)= Gb + b0
(t.5) dJ(t) =_b2J(t)÷!—f G(s)ds, J(O)=Ib +b3b0
wheret [mini is time;G [mg/dl I is the glucose plasma concentration;Gb [mg/dl] is the basal (preinjection) plasma glucose concentration;I [pM] is the insulin plasma concentration;lb [pM] is the basal (preinjection) insulin plasma concentration;bO [mg/dl 1 is the theoretical increase in plasma concentration over basal glucose
concentration at time zero after instantaneous administration andredistribution of the I.V. glucose bolus;
bl [min'] is the spontaneous glucose first order disappearance rate constant;b2 [min'] is the apparent first-order disappearance rate constant for insulin;b3 [pM/(mg/dl)J
is the first-phase insulin concentration increase per (mg/dl) increase in
the concentration of glucose at time zero due to the injected bolus;b4 [min1 pM']
is the constant amount of insulin-dependent glucose disappearance rate
constant per pM of plasma insulin concentration;
b5 [mini is the length of the past period whose plasma glucose concentrations
influence the current pancreatic insulin secretion;
b6 [min' pM/(mg/dl))is the constant amount of second-phase insulin release rate per (mg/dl)of average plasma glucose concentration throughout the previous b5minutes;
b7 [(mg/dl) min']is the constant increase in plasma glucose concentration due to constant
baseline liver glucose release.
The above model describes glucose concentration changes in blood as depending on
spontaneous, insulin-independent net glucose tissue uptake, on insulin-dependent net glucose
tissue uptake and on constant baseline liver glucose production. The term "net glucose
uptake" indicates that changes in tissue glucose uptake and in liver glucose delivery are
considered together.
Insulin plasma concentration changes are considered to depend on a spontaneous
constant-rate decay, due to insulin catabolism, and on pancreatic insulin secretion. The delay
term refers to the pancreatic secretion of insulin: effective pancreatic secretion (after the liver
first-pass effect) at time t is considered to be proportional to the average value of glucose
concentration in the b5 minutes preceding time t.
22

Due to the delay, initial conditions for the problem have to be specified including notonly the level of glucose at time zero, but also its value at each time from -b5 to 0.
The term (1/b5) in front of the integral in (eq. t.5) has been introduced so as to makethe integral equal one for constant unit glucose concentration, thus making b6 , pancreatic
responsiveness, independent of b5 , the time period of pancreatic sensitivity to plasma glucose
concentrations.The free parameters are only six (b0 through b5). In fact, assuming the subject is at
equilibrium at (Gb, Ib) for a sufficiently long time (>b5) prior to the administration of thebolus, then
0 = —b1G, — b4IbGb + b7 and 0= —b2Ib + b6Gb
together imply
b7=bIGb+b4IbGb, b6=b2-.
3.3 .3.2.1 Stability of the dynamical model
About their dynamical model, [5] stated the following. It depends on six free parametersoverall and may exhibit a secondary insulin peak. In contrast to the minimal model, thedynamical model admits only one positive, bounded equilibrium point, which is the couple ofresting, basal glucose and insulin values for the subject.
3.3.4 Minimal model and dynamical model versus realityThe two parts of the minimal model are to be estimated separately on the recorded data. Inorder to study glucose-insulin homeostasis as a single dynamical system, a unifying modelwould be desirable. The simple coupling of the original two parts of this model would not beappropriate, because it would not admit an equilibrium for commonly observed combinationsof parameter values. This in contrast to the dynamical model, which assures a fitting for allpossible combinations of parameter values. Moreover, the dynamical model uses less freeparameters, and should be easier to fit. The latter seems to be a better model to us.If these models, once fit on the data of a patient, are used as predictive models, we give thefollowing evaluation, with regard to their approximation of reality.
• Food. Only glucose that is injected straight into veins of a subject is considered asexternal input of glucose. When a subject eats (different combinations of) food, thereaction of the subjects BG is less direct.
• Exercise. Exercise induces a higher sensitivity to insulin, and a higher insulin-independent rate constant of tissue glucose uptake. For each process there exists acorresponding parameter in the models. However, the relation between a perturbationin the exercise level and the corresponding parameters has to be found.
• Insulin. The models are able to fit the behaviour of the pancreas as reaction on theglucose bolus. In IDDM-subjects, this effect has to be eliminated from the model, andthe effect of an injection of insulin has to be inserted in stead of it.
• Dawn phenomenon I Somogy effect / Illness I Stress (I Alcohol). We don't know ifthe models are able to fit data of this phenomenon's. Especially for the dawnphenomenon and the Somogy effect we have great doubts, because this kind ofreaction/behaviour of the human-system is strongly deviating from normal behaviour.
23
We conclude that if these models are going to be used for prediction of the glucose level, a lotof investigation with respect to the effect off food, exercise and insulin has to be done yet.Also, such predictive models should be able to cope with the dawn phenomenon, the Somogyeffect, illness, and stress.
3.3.5 Subcutaneous insulin kineticsSubcutaneous insulin kinetics is a complex process whose quantitation is needed for a reliableglycaemic control in the conventional therapy of insulin-dependent diabetes [14]. The majordifficulties in modeling include accounting for the distribution in the subcutaneous depot andtransport to plasma. A single model describing in detail the various processes for all thecommercially available insulin preparations is not available. Several models however havebeen proposed which vary in the degree of complexity. Virtually all of them handle theregular insulin preparation while a few handle the intermediate acting and the novel insulinanalogues.
An important component of a simulation model of an IDDM patient in a conventionaltherapeutic regimen is the description of how insulin is absorbed and enters plasma after a scinjection. Since the landmark work of Binder (1969), it is a well accepted notion that scinsulin absorption is a complex process influenced by many factors including the associatedstate of insulin, i.e. concentration, injected volume, injection site/depth and tissue blood flow.In particular, the absorption rate of subcutaneous injected insulin decreases with increasinginsulin concentrations as well as with increasing volumes, and this explains the well-knowninverse relation between the rate of absorption and the size of injected dose. The quantitativedescription of insulin absorption is thus a difficult task.
A single model describing in detail the various processes of subcutaneous absorptionfor all the commercially available insulin preparations is not available, but several moremacroscopic models of sc insulin absorption have been proposed which handle one or morepreparations. All the models described in [14] handle soluble (regular) insulin while monomerinsulin is only analyzed in two of them, and intermediate acting insulin (NPH or lente) is onlyconsidered in the model of Berger et al. [15]. It is worth noting that the model of Berger et al.predictions are simulations, while 4 of the 5 other models predictions are best fit toexperimental data.
The various models differ essentially in the sc insulin absorption description, sinceplasma insulin kinetics is, in all cases, assumed to be single compartment. The single pooldescription, while not adequate in presence of highly dynamic perturbations, is a reasonableapproximation when insulin concentration varies with relatively slow dynamics such as after asc injection.
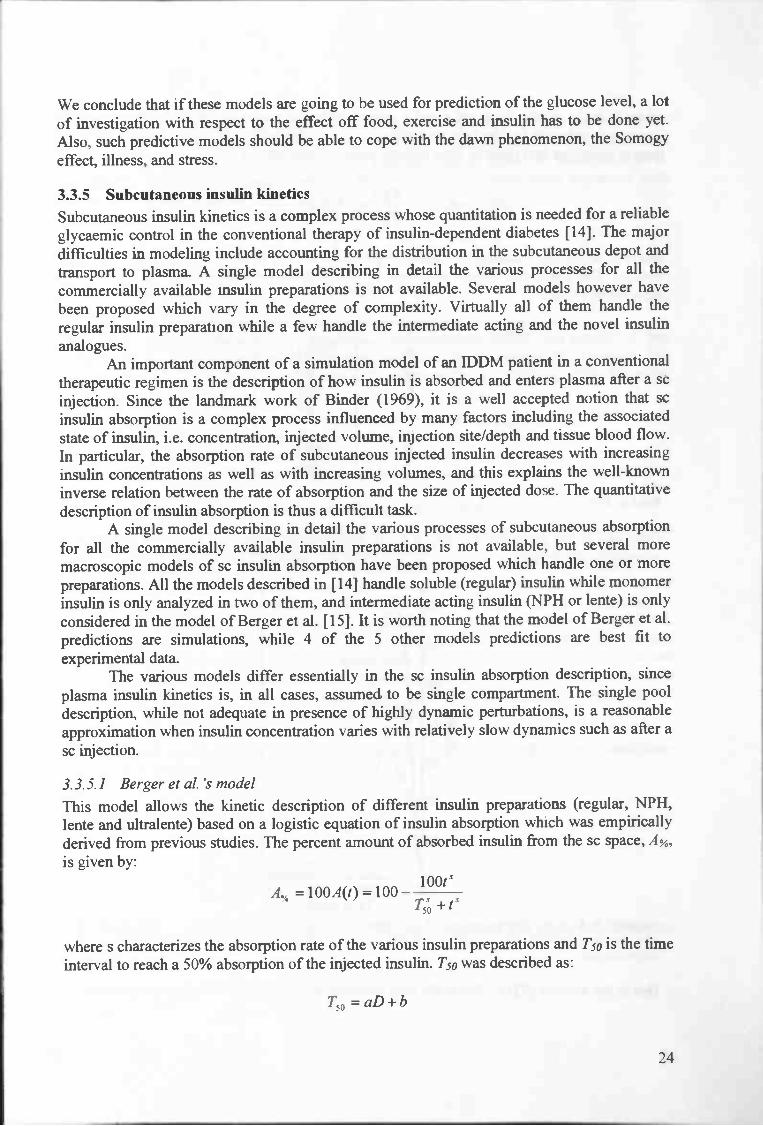
3.3.5.1 Berger et a!. 's modelThis model allows the kinetic description of different insulin preparations (regular, NPH,lente and ultralente) based on a logistic equation of insulin absorption which was empiricallyderived from previous studies. The percent amount of absorbed insulin from the sc space, A%,is given by:
A.1 =IOOA(t)=100—lOOts
T5)+t5
where s characterizes the absorption rate of the various insulin preparations and T50 is the timeinterval to reach a 50% absorption of the injected insulin. 1' was described as:
T = aD + b
24

where D is the insulin dose and a and b assume different values for each insulin preparation.Absorption velocity, i.e. the time derivative of A(t) multiplied by the injected dose, is then theinsulin input flux into plasma. Thus plasma insulin concentration is:
t' T5Di'(t)=—k i(t)+ " =—k i(t)+ 50
e e u IT5 ,s2'd'15O )
where ice is the rate constant for insulin degradation and Vd is the plasma insulin distributionvolume. The parameter values proposed by the authors for regular and NPH insulin arereported in Table 3-2.
soluble s - 2a minU' 3
b mm 102
iCe mm' 9x10'Vd ml l2x
NPH s - 2
a minU' 10.8b mm 294
Table 3-2 Model parameters.
Only two of the proposed models (in [14]), including the described model of Berger et a!.,account for the inverse relationship between dose and absorption time (Figure 3-4).
0 200 400 600Tme (mm)
Figure 3-4 Dose dependency of plasma insulin concentration, predicted bythe Berger model for a 5U (dashed), lOU (solid) and 20U (dotted) scinjection.
Due to the authors of [14], this is the only available model for the NPH absorption kinetics.
25
40

3.3.5.2 Woodworth et a!. 's modelHowever, [16] reported in their article about the short acting insulin [Lys(B28), Pro(B29)]-human insulin, lispro, that their previous studies of insulin lispro, regular insulin, and NPHinsulin have shown that the one-compartment pharmacokinetic model of Woodworth et al.best fits the subcutaneous administration of these insulins. Two differential equations wereused to describe this equation:
= —k X1dt
a
and
= k X1 —dt
in which X1 represents the amount of drug in a depot compartment, X2 is the amount of drugin the body, ka is the absorption rate constant, and K is the elimination rate constant. Theamount of drug in the body was then related to the concentration (C) with use of the following
relationship:
c=V/F
in which V/F represents the apparent volume of distribution adjusted for bioavailability (F).
3.3.6 Dynamical model and subcutaneously injected insulinHere an example is given of the coupling of the dynamical model and a model that describesthe kinetic of the insulin which is subcutaneously injected.With the eye on a model based description of glucose metabolism in IDDM-patients, an ideawould be to take the dynamical model, and replace the insulin secretion of the pancreas by theinsulin absorption due to a subcutaneous injection. Maybe with this coupling it is possible todo a prediction on the behaviour of the glucose-insulin metabolism in subjects with IDDM,which are in rest just like the healthy subjects in the IVGTF. However, we have to commentthat the dynamical and minimal model were originally developed for fitting on known glucoseand insulin data, with the purpose of deriving parameters e.g. for the insulin sensitivity of asubject. Anyway, this coupling must create the possibility of deriving such parameters forIDDM patients. After this, it could be used as a predictive model.
The dynamical model (the parameters are commented elsewhere), without begin conditions(derived from t.4 and t.5):
(1)dG(r)
= _b1G(t)— b4I(t9(t)+ b7dt
(2) dI(t) bI(t)+"6f G(s)ds.dt b5 -b,
The differential equation used in Berger et al.'s model (described in a previous section) for
the plasma insulin concentration:
(3)dJ(t)
= —k i(t)+ tS_ISTSD
dte Vd(T+ts)2
26

Now, if we use the dynamical model, but substitute (2) by (3), we get a system that would (ifthe parameters are chosen well) describe the glucose-insulin kinetics for patients with IDDMbeing in the same conditions as the healthy subjects in the IVGTT. Because the parameters inequation (3) are all known constants, the only free parameters that remain are b1, b4 and b7 of
equation (1). Due to [14] are the constants in (3) derivable from other experiments. Theconstant b4 is the constant amount of insulin-dependent glucose disappearance rate per pM ofplasma insulin concentration. An idea is to make a variable of this constant, so that theinfluence on hepatic and tissue insulin sensitivity induced by performing exercise is possible.
Also, when the relation of eating food with its effect on the glucose level,dG(t)
is known,
the model can be applicable on real life situations. However, we don't know the effect of such
a coupling and for our best knowledge there is no literature recorded about it. We can say thatthe comparison of this adapted dynamical model is the same as the evaluation above, except
that it is adapted for insulin injections.
In the next section two well-known insulin advisor simulators are reviewed with respect to the
model they use to simulate the glucose-insulin metabolism.
3.3.7 Models used in existing simulators
3.3.7.1 The Automated Insulin Dosage Advisor (AIDA)
Guyton et al. developed a detailed multi-compartmental model, with the focus on the glucosecompartment subdivided into smaller compartments based on the organs of major glucoseuptake [9]. The authors have expressed that this model was constructed to explore the criticalpoints for experimental design purposes, and not intended for fitting individual curves of data,thus does not include parameters pertaining to the individual. The model described glucoseflow from a central compartment to various organs and peripheral tissues, as shown in Figure
3-5.
27

Figure 3-5 Model of blood glucose regulation due to Guyton et al. [9]. The
solid lines represent material flow, and the broken lines mean that thematerial quantity affect flow from the other compartment, without actualexchange of material.
The authors reported that the simulation followed experimental data closely for glucose levels
and for insulin rise immediately after glucose infusion, but the two curves deviated towardsinsulin steady state.
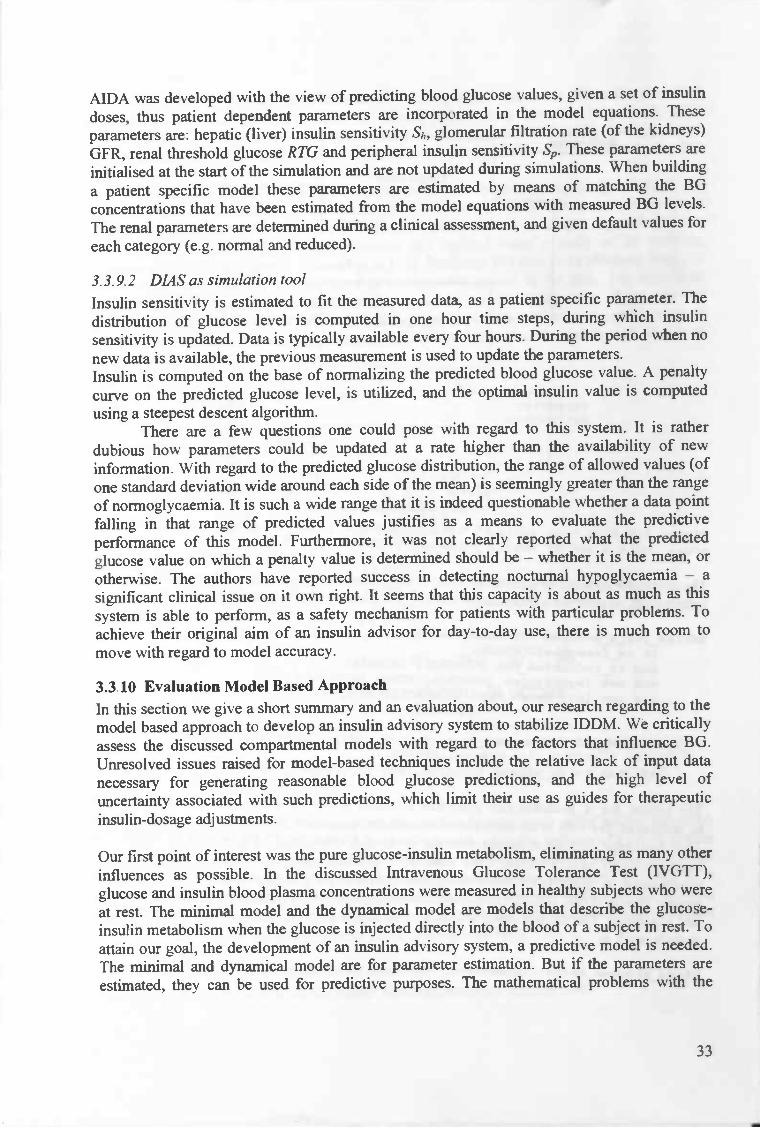
A compartmental model similar in nature to that ofGuyton's, is used by Lehmann andDeutsch to base their insulin advisory system, known as. AIDA (Automated Insulin DosageAdvisor) [10]. There are three main compartments in AIDA, of glucose, insulin and activeinsulin, in the same vein as Bergman's minimal model. The glucose and insulin compartmentsdo not exchange contents, but the amount of material effect each other's flow. It is a model ofa diabetic person, thus the source of insulin is assumed to be external. As Guyton has done,the glucose compartment is also subdivided to smaller compartments, however thesubdivision is based more on the process (e.g. insulin independent glucose uptake) rather thanthe location/organ in which glucose uptake occur (e.g. brain glucose, renal glucose), as shownin Figure 3-6. This manner of subdivision yields less a number of subcompartments within theglucose compartment, making it a slightly simpler model from the glucose point of view.
28
Liver
Insulin

3.3.7.2 The Diabetes Advisory System (DIAS)
Glucose Urine
Contrary to the preciously described continuous time systems, the DIAS system [13] is basedon a discrete-time, probabilistic compartmental model, shown in Figure 3-7. It takes thisstance on the grounds that glucose levels are discretely sampled, and that it would not be wiseto attempt to fit a continuous model to the data. DIAS incorporates a model of the humancarbohydrate metabolism implemented in a Bayesian network (causal probabilistic network orCPN), which gives it the ability to handle the uncertainty, for example, in blood glucosemeasurements or physiological variations in glucose metabolism. Two adjustable parametersare included in the model, the insulin sensitivity and time-to-peak of NPH-type insulinabsorption.
29
CarbohydrateIntake
Insulin Insulin Plasma Insulin
Injections
Figure 3-6 Compartmental structure of the AIDA model. Reproduction fromLehmann et al. [19).
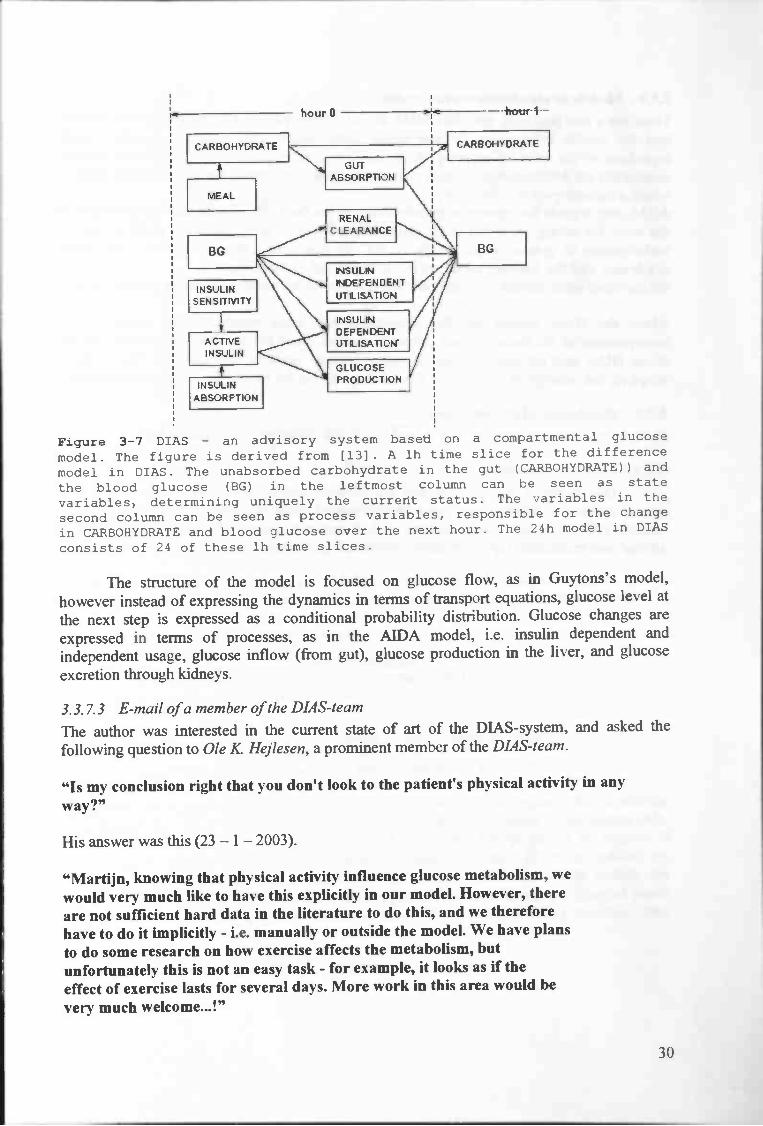
Figure 3-7 DIAS — an advisory system based on a compartmental glucose
model. The figure is derived from [13]. A lh time slice for the difference
model in DIAS. The unabsorbed carbohydrate in the gut (CARBOHYDRATE)) and
the blood glucose (BG) in the leftmost column can be seen as state
variables, determining uniquely the current status. The variables in the
second column can be seen as process variables, responsible for the change
in CARBOHYDRATE and blood glucose over the next hour. The 24h model in DIAS
consists of 24 of these lh time slices.
The structure of the model is focused on glucose flow, as in Guytons's model,however instead of expressing the dynamics in terms of transport equations, glucose level atthe next step is expressed as a conditional probability distribution. Glucose changes areexpressed in terms of processes, as in the AIDA model, i.e. insulin dependent andindependent usage, glucose inflow (from gut), glucose production in the liver, and glucoseexcretion through kidneys.
3.3.7.3 E-mail of a member of the DIA S-team
The author was interested in the current state of art of the DIAS-system, and asked thefollowing question to Ole K Hejiesen, a prominent member of the DIAS-team.
"Is my conclusion right that you don't look to the patient's physical activity in any
way?"
His answer was this (23 — 1 — 2003).
"Martijn, knowing that physical activity influence glucose metabolism, wewould very much like to have this explicitly in our model. However, thereare not sufficient hard data in the literature to do this, and we thereforehave to do it implicitly - i.e. manually or outside the model. We have plansto do some research on how exercise affects the metabolism, butunfortunately this is not an easy task - for example, it looks as if theeffect of exercise lasts for several days. More work in this area would bevery much welcome...!"
30

3.3.8 Models in simulators versus realityThere are a few problems with this AIDA model. Firstly physical activities are not factored
into the insulin independent glucose usage compartment, thus assuming constant usage
regardless of the level of exercise. Also, the model is not adaptive — the patient specific
parameters are determined at the start, and not updated. This assumes a time-invariant system,
which a diabetic person is far from.AIDA only regards the amount of carbohydrates in the food. This means that BG prediction is
the same for eating white rise (high glycaemic index) and bread, with the same amount of
carbohydrate in grams, which surely is not the case. Also stress I illness / the dawn
syndrome and the Somogy effect are not incorporated in the model.
On the other hand, insulin injections are incorporated in the model, which is a positive point.
About the DIAS system we can give about the same comment with regard to the
incorporation of the factors, which influence the BG. Read the email in the previous section
about DIAS and physical activity. Another dubious point is that although the model is
adaptive, the parameters are updated at a rate higher than the availability of new information.
3.3.9 Simulators AIDA and DIAS
Here the two advisory systems, AIDA and DIAS, are reviewed as simulation tools.
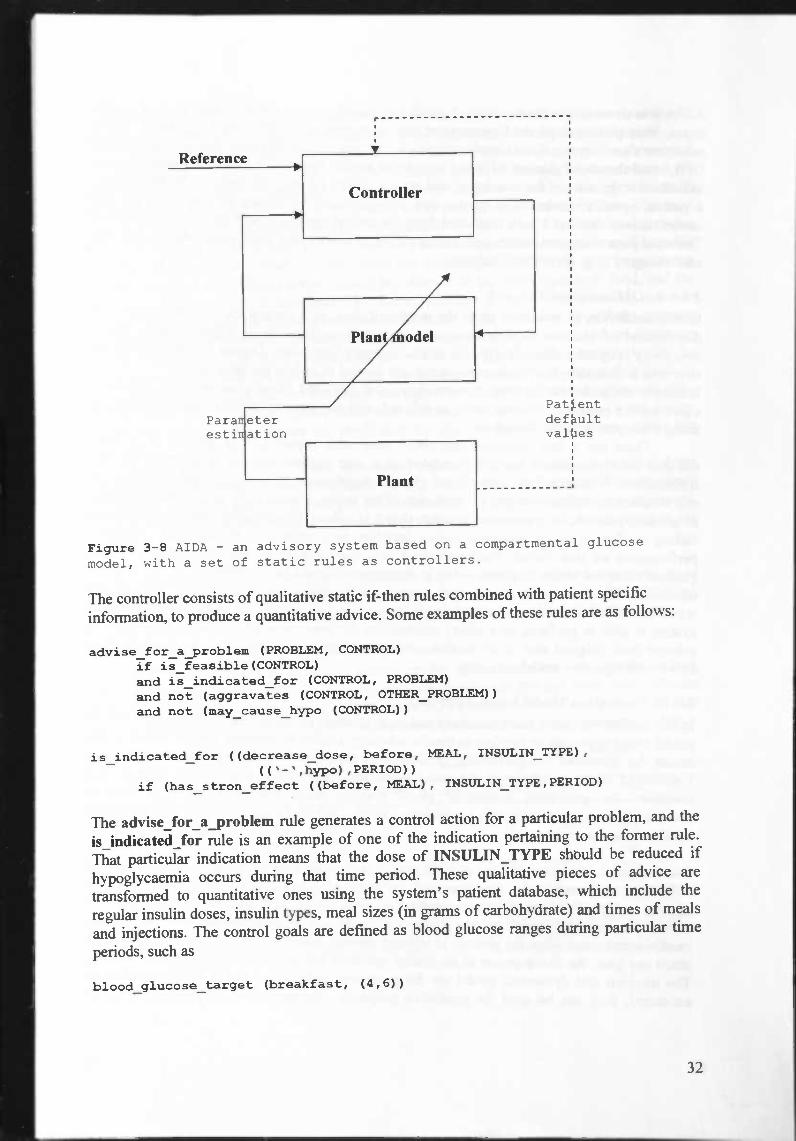
3.3.9.1 AIDA as simulation toolThis model is incorporated into the advisory system as shown in Figure 3-8. The
system operates as follows: simulate a 24-hour period worth of glucose and insulin dynamics,
identify problem area — where control goal is not met, consult the rules, 'implement the
advice' and resimulate, repeat the above steps until goal is reached.
31
Pat.entdefultvalties
Figure 3-8 AIDA - an advisory system based on a compartmental glucose
model, with a set of static rules as controllers.
The controller consists of qualitative static if-then rules combined with patient specific
information, to produce a quantitative advice. Some examples of these rules are as follows:
advise_for_a_problem (PROBLEM, CONTROL)if is_feasible (CONTROL)and is_indicated_for (CONTROL, PROBLEM)
and not (aggravates (CONTROL, OTHER_PROBLEM))and not (may_cause_hypo (CONTROL))
is_indicated_for ((decrease_dose, before, .AL, INSULIN_TYPE),
(('-',hypo) ,PERIOD))
if (has_s tron_effect ((before, MEAL), INSULIN_TYPE ,PERIOD)
The advise_for_a_problem rule generates a control action for a particular problem, and theis_indicated_for rule is an example of one of the indication pertaining to the former rule.That particular indication means that the dose of INSULIN_TYPE should be reduced ifhypoglycaemia occurs during that time period. These qualitative pieces of advice aretransformed to quantitative ones using the system's patient database, which include theregular insulin doses, insulin types, meal sizes (in grams of carbohydrate) and times of mealsand injections. The control goals are defined as blood glucose ranges during particular time
periods, such as
blood_glucose_target (breakfast, (4,6))
32
AIDA was developed with the view of predicting blood glucose values, given a set of insulindoses, thus patient dependent parameters are incorporated in the model equations. Theseparameters are: hepatic (liver) insulin sensitivity Sh, glomerular filtration rate (of the kidneys)GFR, renal threshold glucose RTG and peripheral insulin sensitivity S,,. These parameters areinitialised at the start of the simulation and are not updated during simulations. When building
a patient specific model these parameters are estimated by means of matching the BGconcentrations that have been estimated from the model equations with measured BG levels.The renal parameters are determined during a clinical assessment, and given default values foreach category (e.g. normal and reduced).
3.3.9.2 DIAS as simulation toolInsulin sensitivity is estimated to fit the measured data, as a patient specific parameter. Thedistribution of glucose level is computed in one hour time steps, during which insulinsensitivity is updated. Data is typically available every four hours. During the period when no
new data is available, the previous measurement is used to update the parameters.Insulin is computed on the base of normalizing the predicted blood glucose value. A penaltycurve on the predicted glucose level, is utilized, and the optimal insulin value is computedusing a steepest descent algorithm.
There are a few questions one could pose with regard to this system. It is ratherdubious how parameters could be updated at a rate higher than the availability of newinformation. With regard to the predicted glucose distribution, the range of allowed values (ofone standard deviation wide around each side of the mean) is seemingly greater than the rangeof normoglycaemia. It is such a wide range that it is indeed questionable whether a data pointfalling in that range of predicted values justifies as a means to evaluate the predictiveperformance of this model. Furthermore, it was not clearly reported what the predictedglucose value on which a penalty value is determined should be — whether it is the mean, orotherwise. The authors have reported success in detecting nocturnal hypoglycaemia — a
significant clinical issue on it own right. It seems that this capacity is about as much as thissystem is able to perform, as a safety mechanism for patients with particular problems. Toachieve their original aim of an insulin advisor for day-to-day use, there is much room tomove with regard to model accuracy.
3.3.10 Evaluation Model Based ApproachIn this section we give a short summary and an evaluation about, our research regarding to themodel based approach to develop an insulin advisory system to stabilize IDDM. We criticallyassess the discussed compartmental models with regard to the factors that influence BG.Unresolved issues raised for model-based techniques include the relative lack of input datanecessary for generating reasonable blood glucose predictions, and the high level ofuncertainty associated with such predictions, which limit their use as guides for therapeuticinsulin-dosage adjustments.
Our first point of interest was the pure glucose-insulin metabolism, eliminating as many otherinfluences as possible. In the discussed Intravenous Glucose Tolerance Test (IVGTT),glucose and insulin blood plasma concentrations were measured in healthy subjects who wereat rest. The minimal model and the dynamical model are models that describe the glucose-insulin metabolism when the glucose is injected directly into the blood of a subject in rest. Toattain our goal, the development of an insulin advisory system, a predictive model is needed.The minimal and dynamical model are for parameter estimation. But if the parameters areestimated, they can be used for predictive purposes. The mathematical problems with the
33

minimal model, and the smaller number of parameters that are used in the dynamical model
brought us to the conclusion that the dynamical model is preferable to the minimal model.
We came with the idea of replacing the pancreatic insulin secretion in the dynamical
model by the insulin absorption due to a subcutaneous injection. Except that this reduced the
number of free parameters dramatically, we are able to determine the relevant parameters in
IDDM subjects now, and next use it for prediction of glucose-insulin metabolism. The most
important factors that influence the BG are summed up in Table 3-1. When we put the
adapted dynamical model to the light of Table 3-1, we saw the following problems. To enable
this adapted dynamical model to cope with the consumption of food, will be a severe
problem, because very little is known about the relation of the consumption of food, and the
absorption of glucose due to this food. The second problem is that of incorporating exercise
into the model, because the relation between an increase in physical activity and the increase
in the insulin-independent disappearance of glucose together with the increased sensitivity to
insulin, is unknown. The third problem is that we expect great troubles especially for the
dawn phenomenon and the Somogy effect we have great doubts, because this kind of
reaction/behaviour of the human-system is strongly deviating from normal behaviour. The
idea of using the dynamical model, that was adapted to insulin injections, is no longer
regarded as a potential candidate for predicting the glucose-insulin metabolism in real life
situations.About the models used in the simulation tools AIDA and DIAS, we concluded the
following with regard to the factors influencing BG. Again, only the amount of carbohydrate
is regarded, which is surely not enough. Different levels of physical activity are neglected.
Other factors, like the dawn phenomenon and the Somogy effect are not incorporated in the
model.
Below the accuracy of model based glycaemic predictions is discussed, followed by a
concluding section about the unresolved issues of the model based approach. Out of this we
finally conclude that we have to examine literature about the non-model based approach.
3.3.10.1 Accuracy of model based glycaemic predictions
Every clinician is aware that a diabetic patient on the same insulin regimen, resting in bed,
eating at the same time each day a dietician-prescribed standard diet can have quite different
BG readings from day to day. For example Table 3-3 contains the BG data from an 18 year
old type 1 diabetic patient resting in bed on the same insulin regimen for 6 consecutive days.
D.y 13makfas bach SJ.PFr 1kdttrr
rime Valuc Thac Value lime Value lime Value
Wcdncday (JK:40 4.49.0
IK:la17:9
11.0
LU 0&.09 11.0Thuraday 0t45 63 13:
11.0 1L57 LUFriday ('K:35 2.0 12:40
00:12 4.0Satuntay 0L31 2.0
IK:04 9.0 00:11 11.0Smdiy t'1.4 4.5 12:Jg
12:'. 9.0 J0 10.0 2i:5 9.0Mndav 07.4G 5.0
Table 3-3 Blood glucose data from an 18 years old insulin-dependent (type
1) diabetic patient resting in bed on the same insulin regimen for 6
consecutive days. Data from Lehmann et al. [19]. Blood glucose values are
given in rnmol/L.
34

Clearly the patient's glucose metabolism is not very regular or consistent. From the modeling
perspective endocrine processes must be taking place which are not, at present, fully
understood and/or which cannot be explicitly modeled. Given this, BG predictions generated
by quantitative models cannot be better than the natural variability which exists in the BG
data.To say something about the accuracy of model based glycaemic predictions we
consider predictions from the AIDA simulation, because we think this is one of the most
successful simulations of glycaemic predictions. Figure 3-9 shows a simple regression graph
of observed (measured) BG versus predicted BG derived from a study of 24 patients,
followed over a 4-5 day period, referred to in [12]. Predicted BG data were obtained from the
AIDA model [10]. As can be seen there is considerable scatter in the data. For individual
measurements (or patients) the BG predictions may be a considerable way of the line off
identity. However, it needs to be recognized that such plots are relative simplifications of
complex associations. For example the predictive capability of such models will also vary
with time [19].
w 25Cl)00
20(!J
100wI-2 50w
0
0 5 10 15 20 25
OBSERVED BLOOD GLUCOSE(mmoIII)
Figure 3-9 Observed versus predicted blood glucose values for a
compartmental model of glucose—insulin interaction in diabetes. Data from
Lehmann et al. [12], from 24 insulin—dependent (type 1) diabetic patients
followed up for 4-5 days. Regression line equation: y = 4.9 + O.55x (R =
0.45).
Nevertheless data such as these —simply expressed as a mean root mean square deviation
between observed and predicted BG data of 1.9 mmol/L— led the authors of [10] to realize
that such quantitative compartmental models were not reliable enough for making glycaemic
predictions or thereby deriving clinical therapeutic decisions for individual patients. It is
noted, even through the original data were for the most part derived from a highly selected
group of patients [20], that best fit curve exhibited qualitatively different patterns with respect
to observed data in six out of 30 patients (20% of the group) [12].
3.3.10.2 Unresolved issues model based approach
In this section the drawbacks of the model based approach are summarized.
35

Apart from uncertainties over predictive accuracies — there are several concerns regarding
modeling approaches. Problems may arise from
• the lack of relevant medical knowledge that would be needed to describe all
important factors and processes affecting glucose metabolism,
• methodological difficulties that appear when dealing with complex metabolic
systems, and• quality of data patients report as raw material for state assessment and control.
Clearly the models don't describe the glucose-insulin metabolism deep enough, because there
exist more processes that affect glucose dynamics substantially. Current modeling knowledge
of the glycaemic effect of food is very limited. Basing the entire assessment of food on the
overall carbohydrate content of the meal is a well recognized simplification of a very complex
physiological process. However, data are simply not available in the literature about the
glycaemic indices and absorption times to peak of a wide variety of foods.Similarly the effect of exercise, stress, glucose-counter regulatory effect or dawn
phenomenon on the BG profile can be complex and counter-intuitive making reliance on
compartmental models for individual therapy planning once again unrealistic. Furthermore,
such caveats are raised before one considers the difficulties of actually quantifying, for
example, the amount of exercise undertaken or the intensity of stress that might result in fast
elevation of the BG level.Even if each unit process is described with sufficient precision a methodological
problem would still persist. Hedbrant et al. [21] have suggested that in a fairly complicated
system one has to accept a weak description of the whole system despite sharp descriptions of
the individual components. The components (e.g. liver, pancreas, muscle or n-cells) are
handled separately and described within certain confidence intervals. When these descriptions
of the components are put together, the description of the overall performance turns out to be
very weak, due to the merging of the confidence intervals.The major limitations of such model-based approaches come from the data collection
process. Both artificially stable and hectic but unrecorded lifestyle conditions make model-
based control rather illusory. To generate data for such models, in an attempt to control the
clinical test environment, the volunteers or patients are often subjected to somewhat artificial
conditions, such as fixed meal times and contents and limited exercise. Also, most patients are
reluctant (or unable) to record all relevant lifestyle events (stress, exercise, food intake, etc.)
with a consistency and precision that would be needed to build an adequate patient specific
model (PSM).In this respect the glucoregulatory system involves a great number of variables most
of which are non-observable and as such, beyond the physician's control. These perturbations
are not random, therefore, their effect on the BG level cannot be seen as a white noise
affecting observed values. As a result, it is easy to argue against the selection of a small
number of parameters within a model and to 'blame' them for the large variability seen in
home monitoring BG data.
By placing all this deficiencies of the model based approach on record, we are able to draw
our conclusions. The next section shows that these conclusions lead us to take a closer look at
the non model based approach.
3.3.11 Conclusions Model Based Approach
We perceived the following drawbacks of the model based approach.
• The lack of relevant medical knowledge that would be needed to describe all
important factors and processes affecting glucose metabolism.
. The differences in the insulin's action profile from time to time.
36

• Errors in measurements.• The inimeasurability of some significant interior processes (e.g. the influence of the
central nerve system), so a complete model is almost impossible.• Because of the many parameters that will be needed for an adequate model, such a
model must be very complicated.• The paucity of data (very much data is needed to tune all the parameters).• The probably bad quality of the relevant data that patients should report.• The existence of very complicated non linear relations in metabolism.• Methodological difficulties that appear when dealing with complex metabolic systems.• The predictive accuracies are bad, even in the subjects who were the easiest to predict.
We conclude that the models that are currently available only deal with very few real lifesituations. Even in these situations the predictive accuracies are bad. Suppose that there are Nfactors that influence the blood glucose regulation. Let the universe Ube an N-dimensionalspace, with one dimension for each factor. The universe U consists of all differentcombinations of factors that influence BG, and includes a subspace .RL'that consists of allpossible combinations of factors possible in Real Life situations. The developedCompartmental Models of IDDM claim to be able to predict BG in a certain number of casesthat occur in real life. Let CMbe the collection of all of these situations. In the Figure 3-10below a representative reproduction of a two-dimensional projection of these spaces is given.
CM
Figure 3-10 In the figure a two-dimensional projection of the universe, U,
containing all the different combination of factors that influence BG. RCis the set of all combinations that could occur in real life situations,and M is the set of all real life situations that are claimed to bepredictable by compartmental models.
Even the predictions of the compartmental models in the relatively small subspace CM areaccording to the authors their self too bad to use for personal predictions.
As in the following sections will appear, the development of a non model / rule based systemis preferred. Because of the fact that there are much less articles in scientific libraries to findabout this approach than there are about the model based approach, we suspect that there is
37
U

less investigation done in this branch of science. Moreover, adding exercise to the inputs
doesn't complicate a non model based system very much. This in contrast to the mathematical
models which cope with great troubles when one is trying to add the influence of exercise to
the system, due to the difficulties in measuring the amount and intensity of the relevantexercise. They can be published and easily reviewed by both clinicians and patients. Such
peer review allows their appropriateness and generalizablility to be established. Custom
tailored rules are also suitable for adaptive control. Furthermore by their very nature safety
features can be incorporated into algorithms (provided of course the algorithms are followed),therefore offering reassurance to clinicians and patients alike.
We hope, by taking the non-model based approach of developing an (artificial intelligent)
insulin advisory system, to develop a controller that is able to cope with more situations than
those of C$i Such a system certainly can be trained in, or developed for all RL'situations.
Here the IDDM-system of human is considered more or less as a black box.
3.4 Non-model based approachAt the end of the previous section we concluded that the models, that are currently available,
are only capable of making predictions in a severe limited number of IDDM real lifesituations. Moreover, these predictions are so erroneous that they sometimes yield perilousadvices. These advices were deducted from a model that is constructed from the "IDDM-
body". We know, however, that some IDDM patients are adequate controllers to their own
IDDM-body in almost all RC(real life) situations. These patients work with own extensions
of the simple IF-THEN rules they learned from medical experts when they started with self-
regulation.Generally rule/non-model based systems are believed to be typically much simpler to
develop than their model based counterparts. Curiously enough, this approach is less taken, as
literature on non-model based algorithms is scare.
3.4.1 IntroductionIn the non-model based approach, stabilizing IDDM is tried, without modelling the IDDM-
system explicitly. The IDDM-system is regarded more or less as a black box, and a controller
is developed to control this black box, regarding only the input and output of the box. In this
section we discuss a couple of different methods for the construction of an advising system
for diabetes management.The discussed advising systems diverge from advising systems for individuals to cope
with different situations, to a system that advises for adequate insulin regimens. These
advisory systems stand at a higher level than the individual level. In fact the advice of medical
specialists is modelled. Further the construction of a diagram is discussed. This diagram givesadvice on adjustments in the rate of insulin infusion on the base of the last two BGmeasurements on behalf of diabetes management in critical patients. We start with discussing
algorithms that contain direct instructions of what to do for the individual patient in different
therapeutic situations.
3.4.2 Algorithms for individual patientsActually, optimal decisions can be selected according to some guidelines (algorithms) thatcontain direct instructions of what to do in different therapeutic situations. Clinical algorithmsencapsulated as production rules or mathematical formulas, reflect the heuristics of theroutine therapeutic strategy which attempts to lead the patient to progressively better controlby suggesting stepwise changes to the dose or distribution of insulin in response to the
38
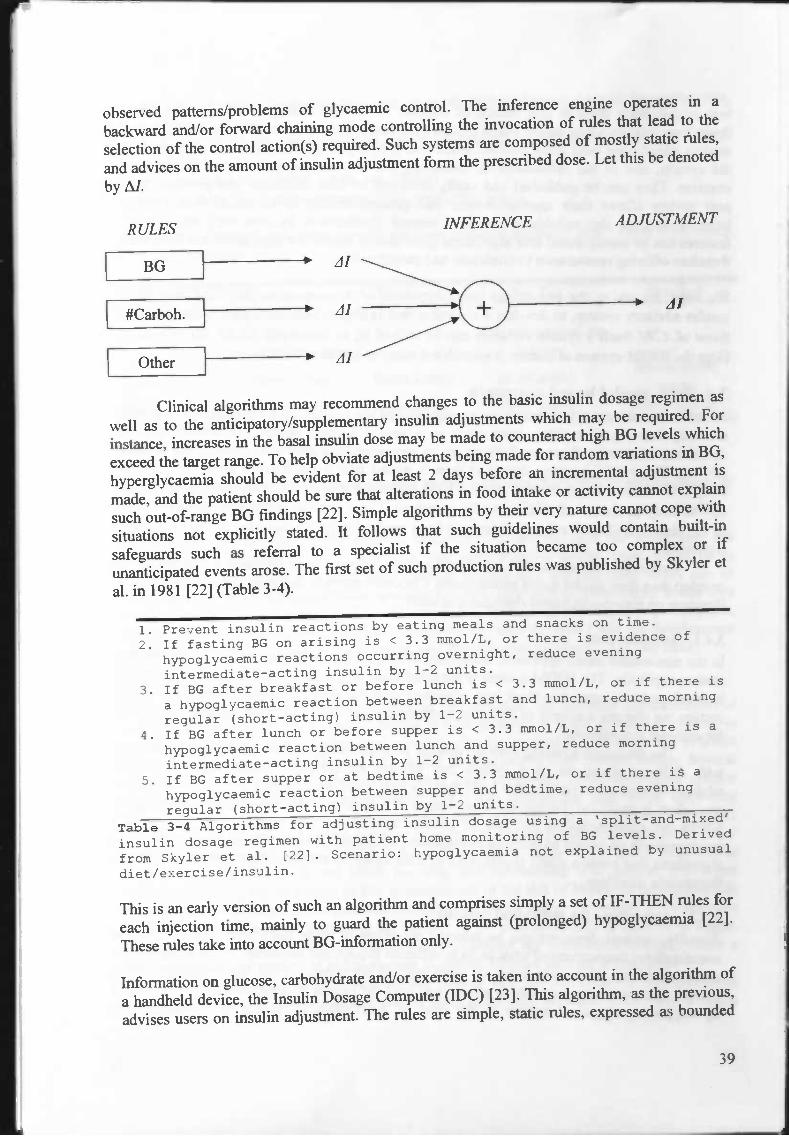
observed patterns/problems of glycaemic control. The inference engine operates in a
backward and/or forward chaining mode controlling the invocation of rules that lead to the
selection of the control action(s) required. Such systems are composed of mostly static ñiles,
and advices on the amount of insulin adjustment form the prescribed dose. Let this be denoted
by Al.
RULES
rBGJ#Carboh.rh—
INFERENCE ADJUSTMENT
—v Al
Clinical algorithms may recommend changes to the basic insulin dosage regimen as
well as to the anticipatory/supplementary insulin adjustments which may be required. For
instance, increases in the basal insulin dose may be made to counteract high BG levels which
exceed the target range. To help obviate adjustments being made for random variations in BG,
hyperglycaemia should be evident for at least 2 days before an incremental adjustment is
made, and the patient should be sure that alterations in food intake or activity cannot explain
such out-of-range BG findings [22]. Simple algorithms by their very nature cannot cope with
situations not explicitly stated. It follows that such guidelines would contain built-in
safeguards such as referral to a specialist if the situation became too complex or if
unanticipated events arose. The first set of such production rules was published by Skyler et
a!. in 1981 [22] (Table 3-4).
1. Prevent insulin reactions by eating meals and snacks on time.
2. If fasting BG on arising is < 3.3 mmol/L, or there is evidence of
hypoglycaemic reactions occurring overnight, reduce evening
intermediate—acting insulin by 1—2 units.
3. If BG after breakfast or before lunch is < 3.3 rnmol/L, or if there is
a hypoglycaemic reaction between breakfast and lunch, reduce morning
regular (short—acting) insulin by 1—2 units.
4. If BG after lunch or before supper is < 3.3 mmol/L, or if there is a
hypoglycaemic reaction between lunch and supper, reduce morningjnermediate—acting insulin by 1—2 units.
5. If BG after supper or at bedtime is < 3.3 mmol/L, or if there is a
hypoglycaemic reaction between supper and bedtime, reduce evening
regular (short-acting) insulin by 1—2 units.
Table 3-4 Algorithms for adjusting insulin dosage using a 'split-and-mixed'
insulin dosage regimen with patient home monitoring of BG levels. Derived
from Skyler et al. [221. Scenario: hypoglycaeiflia not explained by unusual
diet/exercise/insulin.
This is an early version of such an algorithm and comprises simply a set of IF-THEN rules for
each injection time, mainly to guard the patient against (prolonged) hypoglycaemia [221.
These rules take into account BG-information only.
Information on glucose, carbohydrate and/or exercise is taken into account in the algorithm of
a handheld device, the Insulin Dosage Computer (IDC) [23]. This algorithm, as the previous,
advises users on insulin adjustment. The rules are simple, static rules, expressed as bounded
39

piecewise linear functions of the various variables, examples of which are shown in Figure 3-
11 below.
4L T(unit) 1 (unit)
BG(/d1)
_____________
i carbchyd ate (g)
200 300 400 20 40 60
Figure 3—11 Examples of the rules used in the IDC [23], of tI as functions
of BG and meal deviation from normal (in terms of grams of carbohydrate).
This system regards the effects of BG, carbohydrate, and exercise when applicable, as
independent variables to the M functions. The overall effect is regarded to be thesuperposition of all components. The algorithm is modified, quantitatively as a function of
current BG only, and qualitatively in terms of various factors, including hypoglycaeinia,
carbohydrates, levels of activity, stress, and general health condition such as fever and nausea,
in three categories (e.g. mild/less, typicallregular, more/strong).
The IDC-system is implemented in a telephone advisory system, where patients enter their
BG reading and injection time (e.g. pre-breakfast, etc.), and then are advised on insulin dose
[241. This telephone advisory system computes adjustments from insulin doses prescribed by
physicians, and its use is strictly operated from a clinic. The system stored patient
information, and can be used as a database system by the physician.The authors claim success in the form of reduction in incidence ofhypoglycaemia and
hyperglycaemia, and report that user friendliness to be a feature which encourages patients to
use it, and that there are patient-dependent parameters incorporated to the rules. However,
there is no report available about how the rules are parameterised. About the IDC, the authors
of [19] report that this device could not explain or justify its reasoning — either to patients or
health-care professionals, which may account for its relative lack of widespread use.
However, a similar conceptual approach, integrated via a telemedicine system, forms the basis
of the newer HumaLink prototype [24].
3.4.3 Advices on insulin regimenWhen a diabetic patient starts with self regulation, he is advised by a medical expert for an
adequate insulin regimen. Table 3-5 gives examples of possible regimens. As there is very
little information in medical literature concerning practical aspects of this issue, medical
experts adopt their own rules for insulin regimen specification and dose adjustment. In [25]
the application of a neural network approach for the development of a prototype system for
knowledge classification in this domain is discussed. The system facilitates decision making
for diabetic patient management by insulin administration. The prototype system classifies
clinicians' knowledge in the domain of insulin administration. Some main factors
participating in the decision making by doctors for insulin prescription are:
• Patient age• Special condition (j)regnancy, surgery, infection)
• Unstable diabetes (yes, no)
40

• Glucose profile (morning, afternoon, evening, nightlunknown, normal, hyperglycemia,hypoglycemia).
• Physical activity (morning-noon, afternoon-evening, thgJitJnone-unknown, sedentary,
light, heavy)• Food intake (breakfast, lunch, tea, dinner)• Desirable blood glucose control (fair, good, very good).
A number of diabetologists came up with the most common regimens used (Table 3-5), whichserved as the output set.
Regimen no. Pre-Breakfast Pre-Lunch Pre-Tea Pre-Bed
I Intermediate acting - - -
2Short +
intermediate actingShort + intermediate
acting
3.
Short actmg.
Short actmg.
Short actmgIntermediate
.actmg
4 Short acting Short acting Short acting Short acting
Table 3-5 Most Common Regimens.
The resulting system proved to be applicable to this particular problem, classifying correctly
92% of the testing cases.
It is well recognized that insulin regimen selection is a problem that has more than onescientifically acceptable solution. We think that generalization of the prescription of anadequate insulin regimen is a good point because in such way patients more easily can beexchanged between different medical specialists. Every specialist is accustomed to his ownworking-method. If every specialist would use such a tool for insulin regimen prescription,we think a more universal way of thinking will emerge, with the effect that the developmentof general algorithmic prescriptions is easier, and literature can be extended in this field.
3.4.4 Neuro-fuzzy controllingWhen a critical patient cannot meet his energy requirements, the parental administration ofnutrients is needed. When the same patient is also diabetic, a good glycaemic control ismandatory to avoid energy waste and optimize insulin treatment. To allow an efficientutilization of administered nutrients, BG should be maintained near normal values. Severalalgorithms to adjust insulin infusion rates have been proposed. These algorithms operatethrough a feedback regulation (Westenskow, 1997) that follows the logic of an open-loopcontrol system and adjust insulin administration rates according to a time schedule of BGmeasurements (unmodified insulin infusion rates for BG values between 6.7 and 10.0 mM; +
0.5 U/h for every BG value> IOM; - 0.5 U/h for every value <6.7 mM). Since theseconventional algorithms do not allow reaching and maintaining near normal BG levelswithout increasing the frequency of BG measurements or the risk of hyper- or hypoglycaemicevents, target BG values are higher than desirable (between 8 and 11 mmolIL). To improveglycaemic control, without increasing the number of BG determinations or the risk of hyper-or hypoglycaemic events, the last two BG determinations are considered in [26], where aneuro-fuzzy control method of blood glucose in critical diabetes patients is described.
In this way, taking into account the degree and the direction of the glycaemicvariation, the rate of insulin infusion can be more accurately adjusted. They used a neural
41
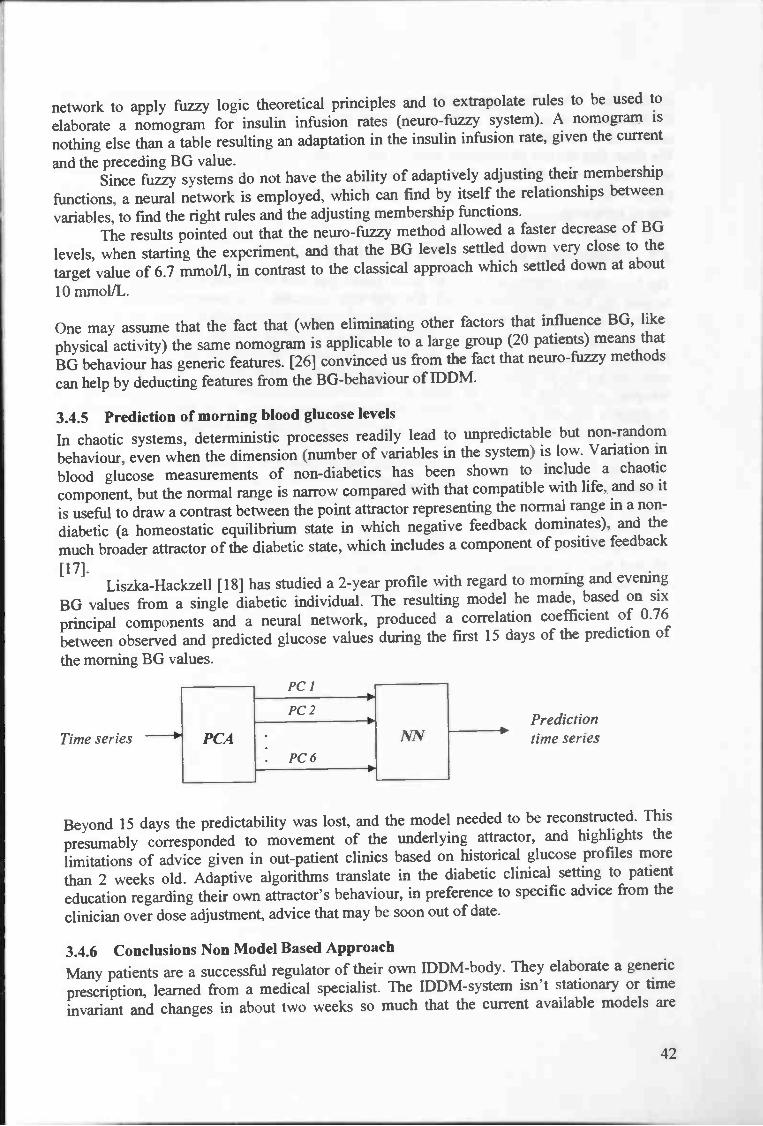
network to apply fuzzy logic theoretical principles and to extrapolate rules to be used to
elaborate a nomo gram for insulin infusion rates (neuro-fuzzy system). A nomogram is
nothing else than a table resulting an adaptation in the insulin infusion rate, given the current
and the preceding BG value.Since fuzzy systems do not have the ability of adaptively adjusting their membership
functions, a neural network is employed, which can find by itself the relationships between
variables, to fmd the right rules and the adjusting membership functions.The results pointed out that the neuro-fuzzy method allowed a faster decrease of BG
levels, when starting the experiment, and that the BG levels settled down very close to the
target value of 6.7 mmol/l, in contrast to the classical approach which settled down at about
10 mmoIJL.
One may assume that the fact that (when eliminating other factors that influence BG, like
physical activity) the same nomogram is applicable to a large group (20 patients) means that
BG behaviour has generic features. [26] convinced us from the fact that neuro-fuzzy methods
can help by deducting features from the BG-behaviour of IDDM.
3.4.5 Prediction of morning blood glucose levelsIn chaotic systems, deterministic processes readily lead to unpredictable but non-random
behaviour, even when the dimension (number of variables in the system) is low. Variation in
blood glucose measurements of non-diabetics has been shown to include a chaotic
component, but the normal range is narrow compared with that compatible with life, and so it
is useful to draw a contrast between the point attractor representing the normal range in a non-
diabetic (a homeostatic equilibrium state in which negative feedback dominates), and the
much broader attractor of the diabetic state, which includes a component of positive feedback
[17].Liszka-Hackzell [18] has studied a 2-year profile with regard to morning and evening
BG values from a single diabetic individual. The resulting model he made, based on six
principal components and a neural network, produced a correlation coefficient of 0.76
between observed and predicted glucose values during the first 15 days of the prediction of
the morning BG values.
Beyond 15 days the predictability was lost, and the model needed to be reconstructed. This
presumably corresponded to movement of the underlying attractor, and highlights the
limitations of advice given in out-patient clinics based on historical glucose profiles more
than 2 weeks old. Adaptive algorithms translate in the diabetic clinical setting to patient
education regarding their own attractor's behaviour, in preference to specific advice from the
clinician over dose adjustment, advice that may be soon out of date.
3.4.6 Conclusions Non Model Based Approach
Many patients are a successful regulator of their own IDDM-body. They elaborate a generic
prescription, learned from a medical specialist. The IDDM-system isn't stationary or time
invariant and changes in about two weeks so much that the current available models are
42
Time seriesPredictiontime series

invalid then. Neuro-fuzzy approaches are capable of learning some of the behaviour of the
IDDM-system, at least with regard to the appropriate adaptation in the insulin infusion rate
connected to BG values.We think that the use of computer tools in prescribing insulin regimens can bring physicians
to the same train of thought. The outcome of such a tool will be the same with respects to
patients in about the same situation, visiting different doctors. This would admit an unified
way of reasoning.
3.5 Conclusions Technology in Diabetes Care
The best models constructed with the model based approach of developing an insulin advisory
system are only applicable in very few real life situations. The predictions done in these
situations have limited use for the construction of patient specific models.Very much investigation in the model based approach is done, where a model of the
IDDM-system is tried to construct on behalf of deducting an adequate control action. On the
other hand, little investigation in the non model based approach is done, where a model of an
adequate controller is tried to construct. These adequate, already existing controllers arecontrollers that are able to function in all real life situations, so if an appropriate model of
such a controller is made, it can be used to control IDDM in real life situations too.
We think new research into the non model based approach is probably more useful than
deepen research into the model based approach.
43

4 Modelling the self-regulating IDJJM-patient
4.1 Defining the structureThis section gives an idea about the scope of interest in this project by defming the structure
of the control process. A short introduction into control theory is given in order to clarify the
context we are working in and to classify the control system we try to develop. Definitions of
italic terms are taken from [27].In mathematical control theory, the mathematical model describing the physical
system that we want to behave according to the specification is called the control system, the
system to be controlled, or the plant, and the mathematical model of the controller device that
is aimed at achieving these specifications is called the controller. In our situation the physical
system to be controlled is the body of a diabetic with regard to the time course of its BG. Here
we call this system, the DM-system, where DM = Diabetes Mellitus. This DM-system
consists of all sorts of complex non-linear physiological processes that influence BG.
However, some diabetics are in fairly full control of their own DM-system in most situations,
obviously, without knowing the behaviour of most processes, or even without knowing from
the existence of most processes. A diabetic doesn't know the action profile of the insulin he
uses, the absorption profile of glucose from the gut induced by food intake, the renalthreshold value above which glucose is filtrated out of the blood at a certain rate and other BG
determining processes. The average diabetic regards the DM-system more or less as a black
box. This is an interesting fact. We conclude that if a model can be derived of the diabetic's
decision making, this model can be used for stabilizing the DM-system. No suitable model is
developed for the DM-system yet, and thus from now on it is regarded as a black box. In
Figure 4-1 the diabetics ignorance of the complicated processes in the DM-system, is
illustrated.
44
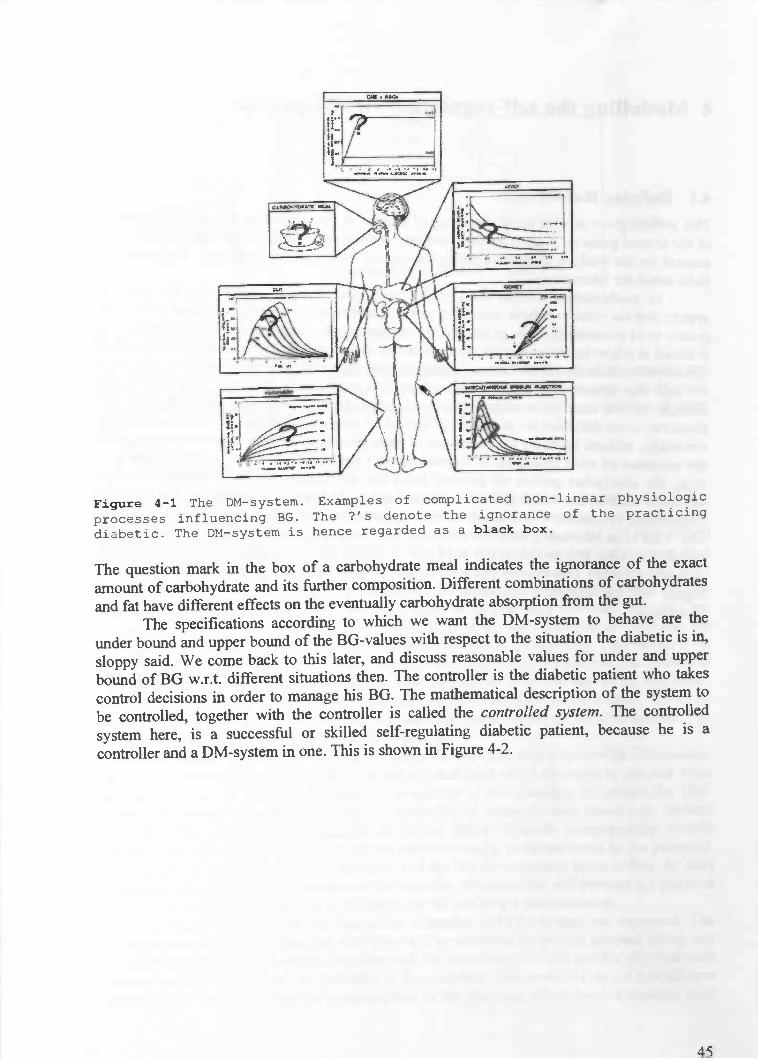
The question mark in the box of a carbohydrate meal indicates the ignorance of the exactamount of carbohydrate and its further composition. Different combinations of carbohydratesand fat have different effects on the eventually carbohydrate absorption from the gut.
The specifications according to which we want the DM-system to behave are theunder bound and upper bound of the BG-values with respect to the situation the diabetic is in,sloppy said. We come back to this later, and discuss reasonable values for under and upperbound of BG w.r.t. different situations then. The controller is the diabetic patient who takescontrol decisions in order to manage his BG. The mathematical description of the system tobe controlled, together with the controller is called the controlled system. The controlledsystem here, is a successful or skilled self-regulating diabetic patient, because he is acontroller and a DM-system in one. This is shown in Figure 4-2.
45
Figure 4-1 The DM-system. Examples of complicated non—linear physiologic
processes influencing BG. The ?'s denote the ignorance of the practicing
diabetic. The DM-system is hence regarded as a black box.

Person
In order to give a more detailed structure definition, it is useful to give a clear separation of
person, system and controller. The system is the collection of all physiologic processes
influencing BG. The controller, here a part of the human brain, generates an adequate control
advice to stabilize the DM-system with regard to the situation on it's input canal. The person
is all what remains when removing the DM-system and the controller from a diabetic (Figure
4-4). The person can execute other control actions than the controller advices him. For
example, a diabetic person can ignore an advice for an insulin injection because he is in
public transport, e.g. a train, and doesn't like people watching him to open his trousers.
An important paradigm in control systems design, and in mathematical control theory,
is feedback. The idea of feedback is to let the action of the physical controlling device at any
moment in time depend on the actual behaviour of the physical system that is beingcontrolled. This idea imposes a certain 'smart' structure on the controlling device: it 'looks' at
the system that it is influencing, and decides on the basis of what it 'sees' how it will
influence the system the next moment. In our situations, the person is a kind of interface
between system and controller. Obviously we have to cope with feedback, because a self-
regulating diabetic monitors his own DM-system all the time; the systems behaviour is never
exactly predictable.Any physical controller "device" that has this feedback structure is called a feedback
controller. In terms of its mathematical model, the feedback structure of a controller is often
represented by certain variables (representing what the controller 'sees') being mapped to
other variables (representing the influence that the controller exerts on the system). The first
kind of variables are called measured outputs of the system, the second kind of variables are
called control inputs to the system.Typically, the input variables are considered to be caused by the measured outputs.Mathematically, the relation between the measured outputs and the control inputs can be
described by a map. Often, designing a controller for a given system can be formulated as the
problem of finding a suitable map between measured outputs and control inputs. The control
system corresponding to the combination of a control system and a feedback controller is
often called the closed-loop system, and one often speaks about the interconnection of the
control system and the feedback controller. The principle of feedback is illustrated pictorially
in the diagram in Figure 4-3.
46
Figure 4—2 The skilled diabetic can be regarded as a controlled system,
because he is both the system as the controller.

measuredoutputs
Our situation is a bit more complicated. For example, not all the inputs of the system areknown to the controller. Furthermore there is noise on the measured outputs. In the nextsection we try to explain the structure in more detail, referring to the following figure (Figure
4-4).
4.2 The concept ideaOn behalf of the development of an adequate controller for diabetes, we are interested in theprocess of taking appropriate control actions by skilled diabetics. A model, taking the samedecision in the same situation as a skilled diabetic would do, can be useful for less skilleddiabetics with (about) the same DM-system. To submit the diabetics decision making to acloser look, we have to get a better idea of the information flow in this process. The mostimportant output of the DM-system is, of course, that with infonnation on BG. Other outputssuch as general health condition are also important, as long as they influence BG, and arequantifiable in some way. Only the output that is used by the controller to establish thenecessary control action in some situation is relevant and has to be regarded. This output is (inmost situations a part or subset of) the input of the controller. Sometimes the controllerderives important effects from the input, that serve as input for a second step in the controller.An example is the trend in BG that is concluded from different BG measurements. The trendin BG is used as input for the controller, but isn't the actual output of the DM-system. Theinternal structure of the controller is discussed later on.
A skilled diabetic is a person who is able to live his life with a controlled DM-system.The person develops the planning with regard to when (and what) he wants to eat and whenhe wants to take his exercise. Because the execution of this planning influences the DM-system, the diabetic therefore invokes the controller at some discrete (maik) or isolatedmoments. The controller then delivers an advice about adequate compensating controlactions. Also, the controller is able to advice adaptations c.q. postponements in the planning.For example, if physical exercise is planned, and the BG measurement taken before the startis considered to be too low to commence the exercise, the controller will prevent the physicalexercise being executed according to the planning, by advising a postponement.
In Figure 4-4, the diabetics integrated controller and DM-system are separated. Theglobal information flow is depicted with arrows. The activities the person planned which canpossibly influence the DM-system, together with the information on BG and his physical statecoming from the DM-system, are provided to the controller. The controller on his turn advicesthe person about the execution or postponement of the planning, where needed together with
47
Figure 4-3 The principle of feedback. A closed-loop system.

adequate compensating control actions. Beside this, there are other inputs to the DM-systemwhich are not visible to the controller.
Person
Figure 4-4 Difference is made between person, controller and system. The
observations from the DM—system (].), the input provided to the controller
(2), the controllers advice (3), executed activities and compensating
control actions (4), and other influences on the system (5) are discussed
in the text.
The arrows in Figure 4-4 represent a flow of information as status indication, planned BG
influencing activities, advice and control action. The arrows are discussed according to their
labels.
1 Derivable information about the state of the DM-system that the person considers
to be useful for controllerInformation on BG
o Current BG valueo "Feeling low" / "Feeling high"
Physical state with regard too Illness (influenza)o Stress
48
'I
I
Controller

2 Input of the controller
> Information collected from the DM-system (label 1)Planning of the diabetic
o Physical activities• Intensity• Duration
o Food• Kind• Amount
3 Advice for a control action
r Advice for execution or postponement of planning with regard too Physical activitieso Food, Advice for control actions abouto Taking insulin with regard to
• Kind of insulin• Dose• Moment
o Taking food to prevent or remedy hypo'so Taking food to compensate a descending trend in BG
4 Execution of activities and control actions
r Foodr Insulin
Physical activities
5 External inputs to DM-system (not visible to controller)
A virus starting to cause illness)' A deviation in the contents of the food with regard to the estimation
Of course more examples of external inputs to the DM-system can be nominated as indirectinfluences on the course of BG. For example a warm surrounding which was not noticed bythe diabetic and causes a (small) drop in BG.
Other important disturbances are in the DM-system itself. Sometimes insulin isn'tabsorbed properly, or unexplainable raises in BG appear. We refer to Table 3-3 that showsdifferent BG values on six consecutive days in a diabetic, keeping external influencesconstant. This inexplicable internal variance in the DM-system is called internal noise.Further, the output, labelled with 1, is polluted by noise. The sensor, which measures the BGvalues, can give erroneous results (accurateness depends on range; values in normoglycemiaare more precise measured; max. 10% deviation), and other things like the different effectphysical exercise of the same intensity can have on the system.
Consider the labels in Figure 4-4. We are interested in the way skilled diabetics, in the personof controller, make the mapping of the output of the system (arrow with label 1) together withthe planned BG influencing activities, bundled in the arrow with label 2, on the correspondingadvice that is generated by the controller (arrow with label 3). We propose to submit thediabetic's decision making to a closer look. We mentioned before that the DM-system is
49

regarded as a black box. In fact the controller, the human brain, is a black box too; someinformation goes in, and some control actions go out of it. In spite of this, a lot of structure
can be brought in the process a control decision is made.
4.3 Designing the controllerIn contrast to the nature of the DM-system being continuous, the controller is discrete (math.)
in nature. In general the controller is invoked only at discrete events, say a couple of times a
day.The DM-system is time-variant. This means that it can behave different in the same
situation at different times. The controller in contrast, is time-invariant. The controller
consists of rules about how to cope with different situations. Although one could argue that
the diabetic changes his rules when the DM-system changes, the rules that induce other rules
to be changed, can also be considered as a part of the controller, so that the controller can be
considered to remain static. The essence is that the alternation in some rules isn't induced by
time, but by other rules that consider the changing DM-system in time. Of course, the rules of
the controller can be refined by new insights of the diabetic.Although the controller actually is a black box, some structure in it can be derived.
Time is an important aspect and is divided in past, present and future. The state of the DM-
system in present is here the most important, followed by the near past and future. Eventually
it is BG that has to be managed, and therefore BG in present, or the current BG, is the most
important state variable. Other factors of influence on BG, discussed yet in chapter 3.2, have
to be taken under consideration. Further, where relevant, these factors have to be assigned to
the different categories time is divided in. The time categories, present, past and future, are
discussed in this order with respect to the relevant influences.The observable state variables in present firstly are the information about BG, denoted
as BG_current, and the feeling one has about his BG being all right, denoted as BG_feeling.
Secondly, the person's activities currently executed. Thirdly, the control actions. These
comprise consuming food that is rich in carbohydrates, and injecting insulin. Short working
carbohydrates can elevate BG for a moment, and long working carbohydrates can compensate
a descending trend in BG. Important aspects with regard to an insulin injection are the
moment of the injection and the amount, or dose of injected insulin.
50

5 Present-day self-regulation
In this chapter the state of art in present-day self-regulation with respect to the insulininjection for a meal is discussed. First the process of starting self-regulation is discussedaccording to a general document for people starting self-regulation that is provided by ahospital. Next this reasoning is converted into a Fuzzy Logic implementation. The sectionends with an evaluation of this approach.
5.1 Starting self-regulation taking 4 shots per dayPatients not deploying self-regulation are restricted to a predefmed insulin schedule, drawn upby a physician. Meals ought to be consumed at fixed times and with fixed amounts ofcarbohydrates. A dietician computes these fixed amounts of carbohydrates. The physiciancouples these amounts of carbohydrates per meal type to a standard amount of insulin foreach meal.
The "Martini Ziekenhuis" in Groningen provide patients starting with self-regulationthe following generic advice for adaptations in the standard amount of insulin injected beforemeals and adaptations in the injected amount of intermediate working insulin. Table 5-1consists of the BG values that have to be obtained on different moments of the day.
Moment BG range (mmolIL)awaking 4—7
during daytime 4— 10
before go to sleep 6—8during the night >4
Table 5-1 BG values to obtain.
In the following sections adaptations to the standard insulin regime are discussed. First theintermediate working insulin has to be fine-tuned, to attain a stable basic BG pattern, followedby adaptations in the short working insulin, which is taken before meals.
Only the injection of short working insulin is discussed. Because our research focuseson the correct dealing with breakfast, only this part is of interest here; of course self-
regulation involves much more.
Adaptation in short working insulin
The dose of short working insulin is given before a meal and can be adapted for each newinjection. The dose is checked by BG measurements at the following moments.
1. Before the meal.2. lY2h.afterthemeal.3. Before the next meal.
Adaptations in short working insulin are influenced by two factors here, BG and the amountof carbohydrates eaten more than the standard prescribed amount. There are big differences inthe effectiveness of insulin between different patients. Use the following rules for guidelinesin adaptations and adapt them to yourself.
51

Table 5-2 consists of the adaptations in short working insulin with respect topreprandial BG. The amount of insulin is given in units (U).
BG (mmolIL) AI (U)<4 If standard amount <
If standard amount?16U then —2;l6Uthen—4.
10—15 +215—20 +4
>20 +6
Table 5-2 Adaptation in short working insulin due to preprandial BG.
Adaptations in the amount of injected short working insulin, due to the consumption of
carbohydrates more than in a normal meal are processed as follows. Let k be the extra amount
of carbohydrates (gram), and k' = k — 15. Thenif k' < 0, and
AI=k'I15 if k'?O.
The one and only adaptation with respect to the insulin doses that have to be injected the day
after physical exercise, is a decrease in the insulin dose taken for breakfast. It concerns only a
qualitative advice (the quantitative deviation is patient specific). Let this adaptation be called
The total adaptation M = MB0 +AJ +
In the following section, the implementation of this reasoning about establishing the correct
dose is implemented according to the author's insight.
5.2 Conversion to Fuzzy LogicIn this project the self-regulation advice of the Martini hospital with regard to the adaptations
in short working insulin is discussed according to the reasoning above.
The input consists of:1. the choice for the kind of breakfast;2. the preprandial blood sugar level;3. the desired amount of extra carbohydrates to consume.
The output is an advice for the amount of insulin to inject.
The following figure shows the whole structure of this fuzzy system including inputinterfaces, rule blocks and output interfaces. The connecting lines symbolize the data flow.
52

Martini
Figure 5-1 The structure of the system according to "self—regulation,
Martini". Left the input variables, in the middle the enumerated rule
blocks. Right the output variables that form the advice.
The structure is discussed with the help of the enumerated rule blocks.
5.2.1 1 The kind of breakfastWe assume the patient to have a choice for two different kinds of breakfast. For these
different kinds of breakfasts the dietician determines the respective insulin dose. The
following two choices are implemented:1. two slices of bread with cheese, and2. two soft rolls with pudding.
In rule block I the coupling of these kinds of breakfast is made with the corresponding
amount of insulin.
5.2.2 2 Classification of insulin doseIn rule block 2, simply the check is done whether the result of the former rule block is more or
less than 16 U.
5.2.3 3 Insulin due to BGHere the difference in the insulin injection due to the preprandial BG level is determined
according to table 5-2. For example, if 10 mM <BG < 15 mM, then 2 U more are injected,and if 15 mM <BG <20 mM, 4 U more are injected. Of course, it isn't sensible to have acrisp transition between 2 U and 4 U, if BG is 14.9 mM, respectively 15.1 mM. The author
chose for the following relaxing transitions.
53

BG is on the horizontal axis. For example, the BG value 15 mM is for half a part member of
the interval "between 10 mM and 15 mM", and the interval "between 15 mM and 20 mM".
Thus if BG = 15 mM, the average of 2 U and 4 U is taken.
If BG is smaller than 4 mM, the insulin adaptation depends on the injected amount of insulin.
Therefore fmal adaptation is determined on the base of the classification of BG at the input
variable and the outcome of rule block 2.
5.2.4 4 Extra carbohydratesIt seems if the insulin that has to be injected due to an increased amount of carbohydrates,
increases linear with the amount of extra carbohydrates, starting with 15 gram. Only the
diabetic dependent factor has to be chosen. Here a factor of 2 is chosen. The classification at
the input variable is straight forward, and depicted in the figure below.
III I DIj
Figure 5-3 The membership functions that classify the amount of extra
carbohydrates in breakfast.
5.2.5 5,6 Intermediate insulin doseIn rule block 5, the adaptation in the insulin dose due to BG and the extra amount ofcarbohydrates is summed. Eventually, in rule block 6, the standard amount of insulin for the
chosen amount of breakfast is summed with the total adaptation due to BG and the amount of
54
FT Prepr indiI
______________________________________________
Figure 5-2 The membership functions that classify the preprandial BG.
tho&30 thoLá_45

extra carbohydrates. This yields the total amount of insulin that should be injected accordingto this reasoning. On this amount of insulin, eventually a last adaptation can be done.
5.2.6 7 Total insulin doseIn rule block 7, the total amount, determined in the preceding, is decreased if physicalexercise is performed the day before. Because this decrease isn't further specified in thehospital's papers, the author chose for a multiplication of about 4/5th. For big doses, the factorwas chosen a bit smaller.
55
6 Data extraction
In this chapter, the derivation of the controller model with respect to the patient's decision
taking is discussed. Not the process of taking decisions, but which decisions and the basis onwhich these decisions are made, are in the centre of interest. First some definitions andlinguistic terms are defined. The data extraction in order to derive the relevant variables is
done by means of a logbook. In the following chapter the global structure of the controller —
translating the input variables to the output variables — is determined according to thecharacteristics of the DM-system. The consecutive chapter discusses the case specificstructure implementation.
6.1 Definitions, linguistic terms and data extraction
In this and the following section the data extraction out of the "decision taking part" of the
life of an educated self regulating IDDM-patient is discussed with an eye on the modelconstruction. On behalf of the data extraction, one needs to define the linguistic terms. Some
concepts (printed bold) are defined to enlighten further discussion.
The set of events is formed by grouping real-life situations that are considered as equivalent
with regard to the process of decision taking. Examples of events are waking up, breakfast,
and practicing sports. Control actions are actions a diabetic can take to manage his BG.Actually the control action is the output of the advice system. Examples of control actions are
the moment and amount of injected insulin, and postponement of a meal.At each event there exist a number of factors or variables that significantly influence
the required control action. Each variable has a name and, strictly spoken, a set of possible
values. The set of these variables is called the situation. Actually the situation is the input ofthe advice system. Examples of input variables at (event =) breakfast are the BG value(measured at breakfast) and the amount of carbohydrates in the breakfast. A state is asituation with one value chosen for each variable. For example, if a situation is
(Current_BG_value, Previous_BG_value}, then an example of a state is (10.0 mmol/L, 6.3
mmol/L). For each event the situation is different: when one wakes up, studies or practices a
sport, different factors have to be regarded in the consideration process which determines an
adequate control action. Also, some factors are concerned with different events, but areweighted on different ways. For both physical activity and studying the BG level is animportant factor of influence at the control actions, but their weighting depends on the event.
Which control actions are taken, is based on the diabetics experiences with regard to
the state from where this action is taken. The diabetic in the person of controller can be seen
as a mathematical function, mapping a situation to a control action. The idea is to imitate this
function by deriving a model that exhibits the same behaviour as the diabetic.
56

Situation
Controller
actions
For different events the situation is different. To gain insights in which factors are important
at which events, a logbook is kept up to date by the author, for some events. A logbook is a
set of recorded combinations of states that occurred in the diabetic's life and the control
actions taken. A logbook is event bound.The amount of carbohydrates will be expressed in bread units, BU, where I BU is
defined as 15 grams of carbohydrates. The amount of carbohydrates in an average slice of
bread equals about 1 BU.The data extraction out of the skilled diabetics life, in order to get insight in his process of
decision taking is done by keeping logbooks up to date for the different relevant events. In the
following section four event related logbooks are discussed. Some explanation is given for the
choice of the variables yet, but the generation of the control actions out of the input variables
is discussed in the next chapter.
6.2 The logbookFor about two weeks the author kept logbooks up to date for the events
1. Wakeup,2. Breakfast — injection at wake up,
3. Breakfast — injection at breakfast, and
4. Supper.
These are the most basic events, always needing a clear control action. The purpose of
keeping logbooks up to date firstly was the deduction and denomination of sensible input and
output parameters. Secondly, the content of the logbook shows a little of the relation between
situation and quantity of the concerning control actions. In this section these four logbooks
are discussed w.r.t. the significant factors that are used in the consideration about an adequate
control action. For some logbooks a little content is included. The first idea was to assume the
existence of one all-embracing controller, because the DM-system should not be able to
distinguish between different events. This resulted in keeping eventless logbooks up to date,
recording each consideration to perform a control action or not. After the discussion of the
logbooks about the four events mentioned above, the eventless logbook is discussed w.r.t. its
problems and difficulties.
57
,,_ 99
MOdQI
Figure 6-l The purpose is to derive a model that exhibits (for each event)
the same behaviour as the skilled self—regulating diabetic in the person of
controller does; the same 'translation' from situation to control action.
Of course, lifestyle is of major importance in the determination of the correct control
action. For example the period between waking up and commencing breakfast. If this period
is too big, it will be impossible to inject the insulin for breakfast when one wakes up because
of the insulin's premature working. The intuitive reasoning behind the taken control actions,integrated with the author's lifestyle and the arising problems for the different events, are
described below.All observances can be clearly divided in three groups with relation to time:
1. Future,2. Current, and3. Past.
6.2.1 Wake upWhen the author wakes up, he measures his BG, called BG_wake-up. A rough subdivision of
BGwake-up is:BG_wake-up <4 - too low,
4 < BG_wake-up <7 - good, and
7 < BG_wake-up -* (too) high.
Roughly said, BG_wake-up determines the moment of the injection. If BG_wake-up is toohigh then immediately an increased dose insulin is injected. If BG_wake-up isn't too high,then the injection is taken some moments before commencing the breakfast. If BG_wake-up is
too low, first a bit of fast- and short-working food is consumed before arising. The elapsed
time between waking up and commencing breakfast normally is about half an hour.Sometimes, when the injection is taken immediately after measuring BG_wake-up (beingmuch too high), a bigger postponement than half an hour of commencing breakfast is wishful.
Except the moment of the injection, BG_wake-up also partly determines the insulindose. The higher BG_wake-up, the more insulin is needed.
BG_wake-up being high can have different plausible reasons. On the one hand we have
• eating too much before going to sleep or an extreme high BG before going to sleep,
• injecting too less long-working insulin before going to sleep,
• reduced absorption of the long-working insulin, or• the dawn phenomenon.
The first three are quite trivial. The latter is a metabolic effect that occurs sometimes, and
causes release of excess hormones, and especially the liver to release a certain amount of
glucose that prepares the body for getting up. This phenomenon manifests itself in a highBG_wake-up value, or an increase of BG between BG_wake-up and BG brealcfast, which ismeasured when commencing breakfast. If the dawn phenomenon is clearly perceived themoment of commencing breakfast can be postponed for example by another '/2 h.
On the other hand it is possible that too much long-working insulin was injectedbefore going to sleep, or that the effectiveness of the long-working insulin was enhanced by
great physical activity the day before. This causes BG to drop during the night. When BG
reaches a certain (low) value, alpha-cells in pancreas cause a counter regulating action which
results in a release of a big amount glucose by the liver that raises BG dramatically (forexample to a value of 14 mM when waking up. This effect is called the Somogy-effect. In both
cases, the amount of glucose has to be removed from the blood by injecting extra short-
working insulin.Of course the amount of carbohydrates intended to consume at breakfast positively
influence a raise in BG. The amount of carbohydrates is expressed in bread units, BU.
58

Physical activity enhances the insulin independent disappearance of glucose bydiffusion and the effectiveness of insulin because the number of receptors on the cells isincreased. Also when exercise is practiced, more blood streams through the subcutane tissuecontaining the insulin of earlier injections, so that more insulin is absorbed. All three result in
a BG drop. So, deploying physical activities like sports the day before, or (less intensive)riding a bike after breakfast, diminish the need for insulin. Of course, the longer ago, or theless intensive, a physical activity is, the less influence it has on dropping BG. This variable iscalled Last_time_sported. Of course the intension of practicing a physical activity is veryimportant. The kind of sport has great influence on the resulting effects, described just now.For example, running takes more effort than playing table tennis. This variable is calledSport_kind. On behalf of simplicity and insight in first instance the bold assumption ofSport_kind= running is done. In further development of the system the system can be
extended.Mainly there are two possibilities for the author after breakfast (F_Activity): ¼ h.
bicycling followed by studying or directly studying. Above was roughly said that the value ofBG_wake-up was the criterion that determined the moment of injection. For certain boundaryvalues, the activity after breakfast can influence this choice by a postponement of theinjection.
The result of the former considerations should lead to an intermediate insulin dose.Because the DM-system is time-variant in nature, the local behaviour in time is important toinclude in the considerations that lead to this final control action. Therefore the standard doseof yesterday (Y_Ins_st) is compared to the real injected dose of yesterday (Y_Jns_ReaI), todetermine the difference in the need for insulin in that local period of time. Of course, thedifference in need can change. So an assessment (Y_Ins_assess) of yesterdays real injecteddose has to be given. This can vary between good and [(much little)] too less/much. Theformer denotation equals the set {much too less, too less, little too less, good, little too much,
too much, much too much}.
Concluding, the relevant, and thus in the logbook recorded factors in the situation of wakingup, with respect to the time, and the relevant control actions together with their dimensions,are summarized in the following two tables.
Time Factor Dimension or rangeFuture F_activity ¼ h. bicycling, noneCurrent BG_wake-up mmol/LCurrent Carbohydrates BU
Past Last_time_sported DaysPast Sport_kind Running, swimmingPast Y_Ins_st U
Past Y_Ins UPast Y_Ins_assess Good, [(much I little)] too
less/much
Table 6-1 Event = Wake up. Dimension or range of the relevant factorsw.r.t. their place in time.
59

Control action Dimension or rangeTake_glucose Yes, No
Moment_injection Now, at breakfastInsulin_dose U
Table 6-2 Event = Wake up. Dimension or range of the relevant control
actions w.r.t. their place in time.
Later on the relation between input and output is discussed. The content of the logbook gives
an indication about how this relation is. In the following table some examples of the logbook
of waking up are illustrated.
The situation:
Y Ins st Y_Ins real Y Ins_assess BG wake-up Carbohydr. Last_time_sported F_activity
7.5 U 8 U Much too less 13.0mM 3 BU 1 day studying¼ h. bic.7 U 7 U Good 13,4 mM 2,5 BU 4 days'/ h. bic.8,5 U 9,5 U Good 11,3 mM 2 BU days
The corresponding control actions:
Take glucose Moment_injection Insulin doseNo Wake-up 10,0 UNo Wake-up 9,5 UNo Wake-up 6,5 U
At the moment of waking up there are two possible conclusions to be drawn; the injection istaken at that moment, or the injection is taken at the moment of the breakfast. The followingtwo sections are about the decisions that have to be made when the breakfast is commenced.In the first, the injection is already taken at waking up, in the second no injection is taken yet.
6.2.2 Breakfast — injection at wake upFrom now on the main interest is in arguing the inclusion of input and output (resp. situationand control action) variables in the process of determination of the right control actions.
About half an hour after taking the injection usually the breakfast commences. In some
situations there is a reason to postpone breakfast for the benefit ofBG stabilization; if BG was
very high at wake up, it takes more time than /2 h. for BG to drop far enough. That BG isn'tdecreasing as much as expected at the injection can for example be because the insulin isn'tabsorbed as well as normally. If a postponement of the breakfast (PostponementMeal) issensible depends on
1. The BG value at waking up and the current BG value. If the current BG value is still
very high, it would be better to postpone the meal, giving BG more time to drop. Onthe other hand, the BG course has to be included in the consideration, because if thereis a strong decrease of BG (BG at wake up minus current BG is big), a postponementcan be dangerous and insensible.
2. The period since the injection is also important; a drop of 5 mM in half an hour ismuch more dangerous than the same drop in two hours.
If, the postponement is more than an hour since the injection and BG is still high, or evenhigher than BG_wake-up, a second dose of insulin can be decided to give (Ins_2th_dose).
Important is the willingness of the patient to eat extra carbohydrates (WnessExtraCarb) in
case the second insulin dose is estimated accidentally a little too big. If not, the best guess is
diminished somewhat. The amount of insulin in the first dose (Ins_wake-up) is most
60

important for the determination of the second dose. The relative need for insulin isincorporated in the determination of the first insulin dose. For the determination of aneventual second dose the amount of the first dose is of much more importance than therelative need for insulin (which will be negligible here).
If no further postponement of commencing breakfast, and no second insulin dose arewished, then the determination of the composition of the meal is an important control actionto consider. If a hypo is expected, some extra glucose will be needed. Also, if future activityis wished, in some cases extra sugar drink is needed. If BG is descending very quick, anincreased amount of carbohydrates (Carbo_amount) is whished. Contrary, if BG isdescending too less, or even ascending, fewer carbohydrates are wishful.
Concluding, the relevant, and thus in the logbook recorded factors in the situation of wakingup, with respect to the time, and the relevant control actions together with their dimensions,
are summarized in the following two tables.
Time Factor Dim ension or rangeFuture F_activity 1/4 h. bicycling, none
Current BG_Now mmol/L
Current WnessExtraCarb Yes, no
Past Ins_when MinutesPast BG_wake-up mmol/L
Past Ins_wake-up U
Table 6—3 Event = Breakfast — injection at Wake up. Dimension or range of
the relevant factors w.r.t. the time.
Control action Dimension or range
Composition_meal Extra_glucose, Extra_sugarDrink, MoreShortWorking, NormalHypo_expected Glucose_needed, yes, probably_no, absolutely_no
PostponementMeal No, 'A h, indefiniteCarbo_amount Same, [(little
Imuch)] more/less
Ins_2th_dose U
Table 6—4 Event = Breakfast — injection at Wake up. Dimension or range of
the relevant control actions.
6.23 Breakfast — injection at breakfastThe first comment is that this event resembles parts of the other two events. l'bis one will bediscussed more briefly than the other.
If BG_wake-up isn't too high, then the injection is taken at the moment ofcommencing breakfast. This is the most wishful situation. Also, sometimes, when BG_wake-
up is (too) high, other, non-diabetes circumstances, force to take an injection at the moment ofcommencing breakfast.
The most important control action is the insulin dose. Also, if BG_breakfast is low, ora little low and there is physical activity after breakfast (F_Activity), one needs something likedrinks with sugar. In some exceptional cases a postponement ofbreakfast is wishful; e.g. if infirst instance BG_wake-up was good and BG_breakfast is much bigger than BG_wake-up.This refers to performance of the dawn phenomenon (section 6.2.1). In fact, the differencebetween BG_breakfast and BG_wake-up is ofmuch more importance than the actual value ofBG_wake-up. Of course the desirable amount of carbohydrates to consume are of majorimportance for the insulin dose.
61

Sometimes BG will be decreasing between waking up and commencing breakfast. Insome of these cases the BG value at breakfast is about 4.0 or smaller which can emerge inhypoglycaemia.
Just like the reasoning given for the determination of the dose when waking up, therelative need for insulin has to be included in the reasoning about this dose. This concerns
again1. the standard dose that was advised yesterday,2. the real advised dose yesterday, and3. the assessment of that the real injected dose.
Again, the last time sported (Last_time_sported) has its influence on the effectiveness and
thus the dose insulin.
Concluding, the relevant factors in the situation of the injection at breakfast, with respect tothe time, and the relevant control actions together with their dimensions, are summarized inthe following two tables.
Time Factor Dimension or rangeFuture F_activity V. h. bicycling, noneCurrent BG_Breakfast mmolfL
Current Carbohydrates BUPast Last_time_sported Days
Past BG_wake-up mmolfL
Past Y_Ins U
Past Y!ns real U
Past Y_Ins_assess Good, [(much ) little)] tooless/much
Table 6—5 Event Breakfast — injection at breakfast. Dimension or range of
the relevant factors w.r.t. the time.
Control action Dimension or rangeComposition_meal Extra_glucose, Extra_sugarDrink, MoreShortWorking, Normal
Hypo_expected Glucose_needed, yes, probably_no, absolutely_noPostponementMeal No, V2 h, indefinite
Insulin_dose U
Table 6-6 Event = Breakfast - injection at breakfast. Dimension or range of
the relevant control actions.
6.2.4 SupperFor a long time the author tried to discover what the relevant influences are on the controlactions at supper. The denomination of the linguistic variables, that are necessary for thededuction of the control actions at this event, appeared to be more complex in comparisonwith the denomination at breakfast. Below the most important variables are discussed togetherwith the raising problems. It is the author's opinion that a controller for supper is possible todevelop but that more profound research is needed.
In the first place, the amount of carbohydrate is of major importance for the insulindose. The main point that determines the amount of carbohydrates is the kind of food(Food_Kind). For example, white rice contains very many carbohydrates with respect to masspercentage, potatoes much less. The standard dose for a meal with rice is about 10 U; thestandard dose for a meal with potato's is about 6 U. Contrary to the procedure at breakfast,
62
where the amount is measured in bread units (BU), here an estimation is made in comparisonto the standard amount of food (Food_Amount). It can be normal, or [(much I
little)]more/less. This is the second influence on the dose. These two influences have a fuzzy nature;this requires a good assessment capacity of the relevant patient.
Secondly the presence or absence of a dessert, its kind (e.g. yogurt or quark)(Dessert_Kind), and the amount (Dessert_Amount) determine the added amount to the dose.The latter can easily be expressed in bread units (BU) by reading on the dessert's packing.The dose has to be compensated by the period that the last physical exercise was ago(Last_time_sported).
Further, high values of BG_supper need to be compensated by an increment of thedose. If BG is raising quickly (BG_Local_Delta), this raise has to be compensated to. On theother hand, if BG is dropping quickly, a little decrease of the dose is wishful. The moment ofinjection (Moment_injection) is both dependent on the height of BG and the averageglycaemic index of the food; the higher BG, the earlier the injection, the faster food isabsorbed from gut, the earlier the injection, and vice versa. When great physical activity isexpected after supper, the amount of short working carbohydrates (Composition_meal) shouldbe more than if no physical activity is expected. These things are relatively easy realizable.More difficult is the implementation of the effect of control actions from the near past, like aninsulin dose (Injected_Ins_time and Injected_Ins_dose) or consumption of some food(Consumed_Food_when, Consumed_Food_Kind and Consumed_Food_amount). Or worse,the combination of an injection and several consumptions.
The major problem is the inclusion of physical activity straight after supper(Activity_after_Supper), or direct before (Activity_before_Supper) and its duration(Activity_before_Supper_Duration). The effects are very various. The dose depends verymuch on the intensity and duration (Activity_after_Supper_duration) of the physical activityafter supper. If the author is going to run for an hour the (total) injected dose can be 2Y2 U,contrary to 12 U in case of physical inactivity.
Other problems like a strongly reduced absorption of long-working insulin(Long_working_Insulin_absorption) or a temporary in-/decreased need for insulin, bycoincidence, are not minor influences on the optimal insulin dose. Also the opposite canhappen, an increased absorption of the long-working insulin or an 'over'-dose have negativeinfluence on the amount of injected insulin. The local behaviour with respect to the relativeneed for insulin can be deducted from the effect of the injections earlier that day. For examplethe injection at the lunch can be taken. The standard advice (L_Ins_st), eventual advice and itsassessment (L Ins assessment) are an indication for the relative need for insulin.
Further, the willingness (WnessExtraCarb) to eat a little more to compensate apossible small over-estimated insulin dose (which is the best guess/advice), influences theeventual injected dose. If there is no willingness, little less insulin (than the best guess) has tobe injected.The relevant influences and control actions are summarized with respect to the time, in thefollowing tables.

Time Factor - Dimension or range
Future Activity_after_Supper Running, bicycling, none
Future Activity_afler_Supper_duratiOn Minutes
Current BG_supper mmol/L
Current BG_Local_Delta mmol/L
Current Food_Kind Rice, potato's,
Current Food_Amount normal, or [(much I little)]more/less
Current Dessert_Kind Quark, yogurt
Current Dessert_Amount Less, normal, more
Current WnessExtraCarb Yes, no
Past Last_time_sported Days
Past Injected_Ins_time (*) Minutes
Past Injected_Ins_dose (*) U
Past Consumed_Food_when (*) Minutes
Past Consumed_Food_Kind (*) Short working, long working
Past Consumed_Food_amount (*) BU
Past Activity_before_Supper Running, bicycling, none
Past Activity_before_Supper_DuratiOn Minutes
Past Long_working_Insulin_absorption Better, normal, worse
Past L_Ins_st U
Past L_Ins_real U
Past L_Ins_assessment Good, [(much I little)] tooless/much
Table 6—7 Event = Supper. Dimension or range of the relevant factors w.r.t.
the time. (*) More than one occurrences possible.
Control action Dimension or range
Composition_meal Extra_glucose, Extra_sugarDrink, MoreShortWorking, Normal
PostponementMeal No, 1/2 h, indefinite
Moment_injection Now, at supperIns_dose U
Table 6—8 Event = Supper. Dimension or range of the relevant control
actions.
From this section the conclusion can be drawn that estimating the optimal dose for supper is
more complex than at breakfast. The size of the table and the less crisp (more fuzzy) values of
the variables give yet a slight impression of the expected size of the model that has to begenerated to produce a prediction for the optimal control action. Although the system wouldbecome complex, it would probably be possible to derive a good system because the author isalso capable of dealing with all this information and able to derive the necessary controlactions.
6.2.5 The all-embracing controllerThis section is about an all-embracing controller that should be applicable under allcircumstances.
64
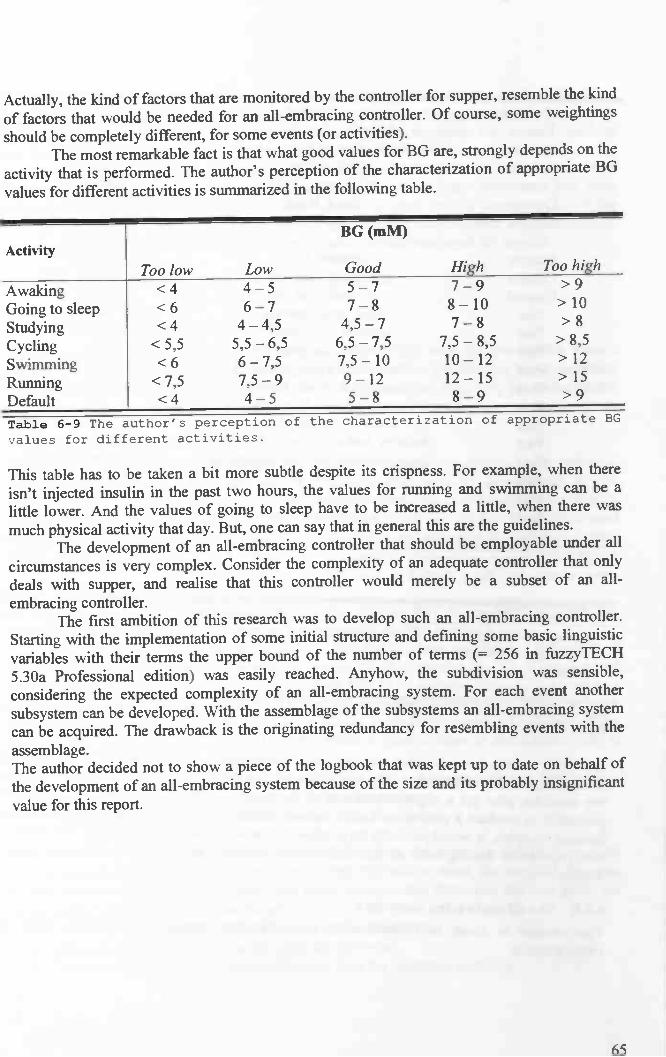
Actually, the kind of factors that are monitored by the controller for supper, resemble the kind
of factors that would be needed for an all-embracing controller. Of course, some weightingsshould be completely different, for some events (or activities).
The most remarkable fact is that what good values for BG are, strongly depends on theactivity that is perfonned. The author's perception of the characterization of appropriate BG
values for different activities is summarized in the following table.
ActivityBG (mM)
Too low Low Good High Too high
AwakingGoing to sleepStudyingCyclingSwimmingRunningDefault
<4 4—5 5—7 7—9 >9<6 6—7 7—8 8— 10 > 10
<4 4—4,5 4,5—7 7—8 > 8
<5,5 5,5—6,5 6,5—7,5 7,5—8,5 >8,5<6 6—7,5 7,5 — 10 10— 12 > 12
<7,5 7,5—9 9—12 12—15 >15<4 4—5 5—8 8—9 >9
Ta1e 6—9 The author's perception of the characterization of appropriate BG
values for different activities.
This table has to be taken a bit more subtle despite its crispness. For example, when thereisn't injected insulin in the past two hours, the values for running and swimming can be alittle lower. And the values of going to sleep have to be increased a little, when there wasmuch physical activity that day. But, one can say that in general this are the guidelines.
The development of an all-embracing controller that should be employable under allcircumstances is very complex. Consider the complexity of an adequate controller that onlydeals with supper, and realise that this controller would merely be a subset of an all-embracing controller.
The first ambition of this research was to develop such an all-embracing controller.Starting with the implementation of some initial structure and defining some basic linguisticvariables with their terms the upper bound of the number of terms ( 256 in fUZZyTECH
5.30a Professional edition) was easily reached. Anyhow, the subdivision was sensible,considering the expected complexity of an all-embracing system. For each event anothersubsystem can be developed. With the assemblage of the subsystems an all-embracing systemcan be acquired. The drawback is the originating redundancy for resembling events with theassemblage.The author decided not to show a piece of the logbook that was kept up to date on behalf ofthe development of an all-embracing system because of the size and its probably insignificantvalue for this report.
65

7 Model structure according characteristics DM-system
In the former chapter for a couple of events the relevant input and output variables arederived. A structured approach will be needed in order to translate the inputs to the matchingoutputs or control action advices.
In this chapter, different kinds of control advice and of input variables aredistinguished. On the base of the differences in the control advices, advice specific structures
are derived. These are discussed in the successive sections. In the next chapter these advicespecific structures are implemented with respect to the relevant event.
7.1 Subdividing the control advicesThe output variables are the control actions a diabetic can take to manage his BG, given acertain event. The output variables are divided in two categories:
• Insulin related, and• Non-insulin related advices.
The first are advices about the amount of insulin that has to be injected in a certain situation,and the second are advices that don't deal with the determination of an insulin dose. Examplesof the latter are the postponement of a meal and the composition of a meal.
The insulin related advices could be divided in two subcategories:• Insulin determining,• Insulin correcting advices.
If BG level is too high, or expected to become too high, for example due to the consumptionof a lot of carbohydrates, an insulin dose is necessary. On the other hand it is possible that theformer insulin injection was too small, and a correcting dose is necessary to achieve the resultthat was aimed in first instance. The first kind of advice, the insulin determining advices, isdue to non-insulin related reasons, the second kind of advice, the insulin correcting advices, isalways a correction on a former insulin injection, in order to achieve the result that was aimed
in first instance.
The subdivision is shown in the following diagram.
Advices
Non-insulin related Insulin related
Insulin determining Insulin correcting
Figure 7—1 A subdivision of sorts of advices.
66
The main issue in stabilizing DM is taking care of an appropriate insulin level all the time.The DM-system is time variant. This means that it's behaviour changes in course of time withregard to the BG level, even if the external situation remains the same. So, we can concludethat the need for insulin changes in time, even if the external situation remains the same.Because the DM-system is time variant, it will be important to involve the local behaviour ofthe system in the controller for insulin related advices. With local behaviour, the localbehaviour in time is meant. Some input variables will be used for the determination of theconcerning situation. These variables are called the situation determining input variables.Other input variables will be used for the determination of the local need for insulin.
In the next section the advice specific structures are derived.
7.2 Advice specific structuresThe distinguished kinds of advices will be discussed, starting with the non-insulin relatedadvices. Every advice is determined on the base of the situation determining input variables.The only case where a correction on this advice is made, is where an advice for a non-insulinrelated insulin dose is generated.
7.2.1 Non-insulin related advicesThis structure is about static. It is just on the base of the situation determining input variables.For example the threat of an approaching hypoglycaemia can be derived out of thecomparison of two BG measurements, the time between them, the amount of injected insulinand the period since that injection. The local behaviour of the system, i.e. the relative needfor insulin, isn't influencing the non-insulin related advices, because only the eventual overalleffects are studied.
7.2.2 Insulin determining advicesAs indicated above, this section is about insulin advices that follow directly from thesituation, and are not a correction on an earlier, too small injected insulin dose.
The situation determining input variables, like the last time sported and the height ofBG, will determine an amount of insulin to inject. Let this amount be called the standardinsulin dose (I_standard). The values for I_standard have to be deduced from the logbook as asort of average injected dose, all the time in (about) the same situation, thus, with the sameexternal influences. The value I_standard is the starting point in the eventual prediction of theoptimal dose. I_standard is believed to be stable within a space of time of about half a year. Itcan change due to the following reasons:
• A change in the patient's lifestyle (more or less active, for example), and due to this achange in his personal characteristics, as fat percentage;
• The patient (becomes older and) his metabolism changes.
Now, a correction with the local need for insulin is important. Other input variables have to beused to determine the relative need. Once determined this relative need, the standard dose canbe compensated with this relative need. The input variables that determine the best guess forthe momentary relative need for insulin are:
• The standard insulin dose injected for breakfast yesterday;• The real injected insulin dose for breakfast yesterday;• The assessment of the real injected insulin dose for breakfast yesterday.
67

Their use is explained below. From section x.4.6 (Conclusions Non Model Based Approach)is quoted that the DM-system is time variant. So, if all the influences are kept constant, eventhen the system's behaviour changes. After about two weeks, much of the predictability is lostby the current available (non model based) systems. From table x.3 (Accuracy of model basedglycaemic predictions), slight differences are noticeable in BG values from day to day, while
all the external (external) influences are kept constant. This has leaded to the following idea.
If there is a temporal need for more insulin in the recent past, it plausible that there is also a
need for more insulin in the present. Therefore, we can compare the real injected insulin dose(Y_I_real) of yesterday with the standard dose that was advised yesterday. If yesterday's realneed was much bigger than the standard need, this will be the case today.
The problem is that the structure is static now. Because the DM-system's relative need
for insulin can change from day to day, an adaptation in the relative need for insulin in acertain situation has to be made from day to day, if necessary. The best way to do this is bymaldng an assessment (Y_I_assessment) of the real injected insulin with regard to its quantityin retrospect, by considering the eventual correcting control action. In this way the relativeneed for insulin can be corrected day by day. The following figure shows the eventual general
structure of a controller.
Yj_re.I —. Emai.rdayoptma1
Y_I_.uesrnert —
Figure 7-2 The eventual general structure of a controller. The real adviced
insulin dose yesterday with its assessment in retrospect lead to the
optimal guess for the present need for insulin.
Because of the fact that in this research only a controller is developed for waking up and
breakfast, the reference point of the relative need for insulin is yesterday, because no more
recent data is available. For controllers at supper for example, more recent data can beprocessed. We have to distinguish between two different cases, which influence the dose of
short working insulin injections.1. A difference in relative need for insulin due to a change in metabolism, which means
that a multiplication of I standard is necessary, and2. a difference in the action profile of the injected long working insulin, which means
that no multiplication is needed, but a sum of I_standard and a bit less/extra insulin tocompensate for the difference in the long working insulin's action profile.
At waking up, it is not possible to make a difference between 1 and 2. The successful controlactions of the author at waking up, which often lead to a stable DM-system, imply that it is
not necessary to know the cause ofelevated BG values at wake-up.The assessment of the insulin doses typically changes from day to day. The value for therelative need for insulin is typically believed to change significantly within less than twoweeks. After half a year the average (recent) values for the relative need for insulin can becomputed. The standard advised values could be updated to this average.
68
YJ_5tandard
I_ddsu

7.2.3 Insulin correcting advicesHere already an insulin dose is injected. Anyway, sometimes the injected insulin dose was too
small. This is perceived by a BG value that is much higher than expected. If BG is a little too
high, most often the choice is made not to inject a second dose. If BG is very much too high,
the choice for a second injection is made almost always. In the first case a little insulin is
needed, in the second case very much insulin is needed. The average dose is in between.Of course the amount of insulin in the second dose very much depends on the first
amount of insulin in the second, correcting, injection. The influence of the relative need is
negligible.
In the following chapter the event related model structure implementation with regard to the
advices distinguished above are discussed.
69

8 Event related model structure implementation
In the former sections the event related inputs and outputs are determined. The following step
is the defmition of the structure — viewed as a mathematical function — that translates the input
to the correct output. In this research, this is done for the following events.1 Wakeup;2a Breakfast — injection at wake up;2b Breakfast — injection at breakfast.
The structure actually is made up of a set of rule blocks. Per system these rule blocks areenumerated. The intuitive idea behind these rule blocks is described with an eye on theimplementation in FuzzyTech 5.30a Professional Edition. On behalf of the time, only system
1 and 2a are implemented.The system structure identifies the fuzzy logic inference flow from the input variables
to the output variables. The fuzzification in the input interfaces translates analog inputs intofuzzy values. The fuzzy inference takes place in rule blocks that contain the linguistic controlrules. The outputs of these rule blocks are linguistic variables. The defuzzification in theoutput interfaces translates them into analog variables.
8.1 WakeupIn this project, a controller is modelled for the event of waking up. On the basis of seven inputvariables (one is not in use yet), a control advice is brought out. The advice is about thenecessity of glucose, the moment of the injection, and the eventual insulin dose. With the helpof the structure discussed below, the advice generation is discussed.
8.1.1 System structureThe following figure shows the whole structure of this fuzzy system including inputinterfaces, rule blocks and output interfaces. The connecting lines symbolize the data flow.
Figure 8—1 The structure of the system belonging to the event "Wake up".
Left the input variables, in the middle the enumerated rule blocks. Right
the output variables which form the advice (except the variable below the
horizontal line).
70
Wake up

The precise system structure is discussed according to the global structure that is derived in aprevious section. This means that situation determining input variables determine the standardinsulin dose that would be injected under certain circumstances, which is compensated withthe relative need for insulin. The variables are clearly ordered with respect to time; future,current and past.
The variables that determine the situation here are:Future:
- activity in future.Current:
- the current BG value;- the desired amount of carbohydrates in breakfast.
Past:- the lasttime sported.
The variables that determine the local relative need for insulin are:Past:
- the advised standard amount of insulin;- the real advised insulin;- the assessment of the real advised insulin.
In the consecutive sections, first the determination of the advice for the moment of injectionand the need for glucose are discussed, followed by the determination of the advice for theinsulin dose. The latter is a bit more complicated. It starts with deriving a standard dose out ofthe variables that determine the situation, which is combined with the best guess for therelative need for insulin. The resulting dose is classified, and according to this classification,the difference in insulin dose due to a difference of one bread unit (1 BU) in breakfast isdetermined. Remark. The standard amount of carbohydrates in breakfast is 2 BU. The insulindose is adapted to the possibly present difference in breakfast, resulting in the eventual insulindose.
All the rule blocks in the structure above are enumerated with red numbers. This enumerationis used in the following discussion.
8.1.2 1 Classification of BG valueAt waking up, the BG value is determined. Some decisions are more or less dependent on thisvalue. The precise BG value is not that important, that for every slight difference, decisionsare completely different. The decisions a diabetic takes if his BG is 8.1 mM, or if his BG is8.2 mM, actually will not be different. Sometimes it doesn't even matter if BG is 8.0 or BG is10.0 mM.
To abstract from the exact value, the BG value range, which runs from about 1 mM toabout 25 mM, is divided in a few classes. The number of different classes in the system, isexactly the number of different classes the author globally distinguish. The size of a class isdetermined by the range of BG values that all lead to the same decision. Because, for differentkinds of decisions, different kinds of classes are used, some of the defined classes willoverlap. For example, the classification of BG values for studying is different from that forrunning. A value of BG = 5.0 mM falls in the category 'good' for studying and in 'too low'for running (compare section 6.2.5 about the all-embracing controller). In this system, aclassification is used for the determination of the moment of injection, while another
71

classification is used for the amount of extra insulin that has to be injected due to high BG
values.
From now on, only classifications of BG values — made in rule block 1 — are used fordecisions.
8.1.3 2 Determination of the moment of injection and the need for glucoseIn rule block 2, an indication is given for the best moment of injection and the need forglucose. There is only a need for glucose if BG is smaller than 4 mM. A very simple controlaction. The moment of injection depends on both the BG value and the activity afterbreakfast.
The principle idea: if BG is very high, it is not advisable to eat instantaneously,because further increase of BG is not wishful. If the injection is taken instantaneously, andbreakfast is commenced after taking a shower; BG has time to drop.
If BG is 7.5 mM or higher, the author takes the injection immediately. If BG is lower,then he will take his injection on a later moment, for example at commencing breakfast. If BGis about 7.5 mM, and the injection is taken at waking up, it is possible that BG dropped somuch, that physical activity after breakfast (1/4 h. biking), is not safe. So, if future activity isplanned, the minimum BG value at which an instantaneous injection is advised should be a bithigher. The author chose for about 9.0 mM.
8.1.4 3,4, ..., 10 The determination of the insulin doseThe determination of the insulin dose is the most important and difficult control action. Thederivation is done according to the structure defined in the former chapter; the variables thatdetermine the situation determine the standard insulin dose, which is corrected then with therelative need for insulin.
A minor exception on this idea is that the amount of extra injected insulin due to extracarbohydrates is in few cases slightly dependent on the relative need for insulin. It will bediscussed below, where the insulin dose is adjusted to a possibly diverging amount ofcarbohydrates, from the standard amount of 2 BU.
8.1.4.1 The standard insulin doseWhen one wakes up, the situation determining variables are
• the (yet classified) BG value;• the last time sported;• the planned amount of carbohydrates in breakfast;• the planned future activity.
Only the first two are used to determine the standard insulin dose. The are discussed below,but first a reason for disregarding the latter two with respect to the determination of thestandard insulin dose is given.
It is the author's lifestyle to ignore the future activity, i.e. bicycling for '/4 hour afterbreakfast, in the determination of the insulin dose. Namely, there are two possibilities, to copewith this future activity:
• decrease the amount of insulin, or• eat a little more.
The latter is chosen. The relation between future activity and the meal's content is discussedin the advice system that can be used when breakfast is actually started. The other option wasto choose for a decrease in the amount of insulin if future activity is planned. This is also a
72
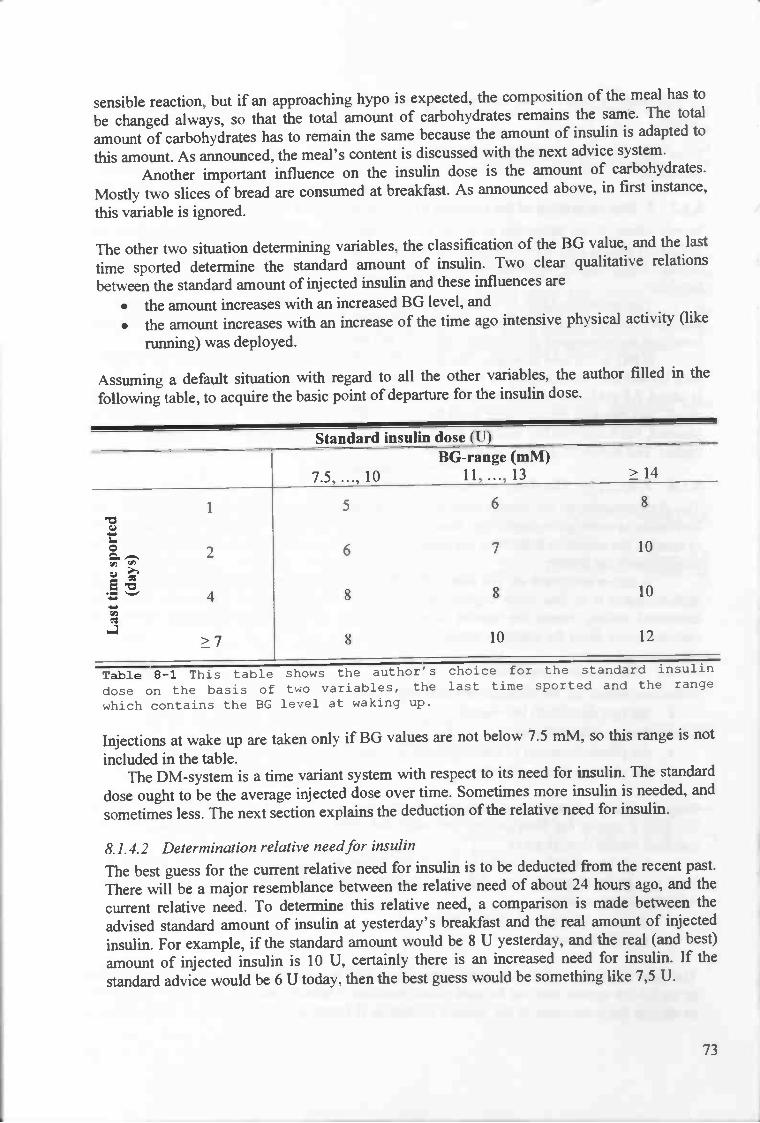
sensible reaction, but if an approaching hypo is expected, the composition of the meal has to
be changed always, so that the total amount of carbohydrates remains the same. The total
amount of carbohydrates has to remain the same because the amount of insulin is adapted to
this amount. As announced, the meal's content is discussed with the next advice system.Another important influence on the insulin dose is the amount of carbohydrates.
Mostly two slices of bread are consumed at breakfast. As announced above, in first instance,
this variable is ignored.
The other two situation determining variables, the classification of the BG value, and the last
time sported determine the standard amount of insulin. Two clear qualitative relationsbetween the standard amount of injected insulin and these influences are
• the amount increases with an increased BG level, and
• the amount increases with an increase of the time ago intensive physical activity (like
running) was deployed.
Assuming a default situation with regard to all the other variables, the author filled in thefollowing table, to acquire the basic point of departure for the insulin dose.
Standard insulin dose (U)BG-range (mM)
7.5,...,10 ll,...,13 ?14
1
0Q-Eo
4,-
>7
5 6 8
8 8 10
8 10 12
Table 8—1 This table shows the author's choice for the standard insulin
dose on the basis of two variables, the last time sported and the range
which contains the BG level at waking up.
Injections at wake up are taken only if BG values are not below 7.5 mM, so this range is notincluded in the table.
The DM-system is a time variant system with respect to its need for insulin. The standard
dose ought to be the average injected dose over time. Sometimes more insulin is needed, andsometimes less. The next section explains the deduction of the relative need for insulin.
8.1.4.2 Determination relative need for insulin
The best guess for the current relative need for insulin is to be deducted from the recent past.There will be a major resemblance between the relative need of about 24 hours ago, and the
current relative need. To determine this relative need, a comparison is made between theadvised standard amount of insulin at yesterday's breakfast and the real amount of injected
insulin. For example, if the standard amount would be 8 U yesterday, and the real (and best)amount of injected insulin is 10 U, certainly there is an increased need for insulin. If thestandard advice would be 6 U today, then the best guess would be something like 7,5 U.
73
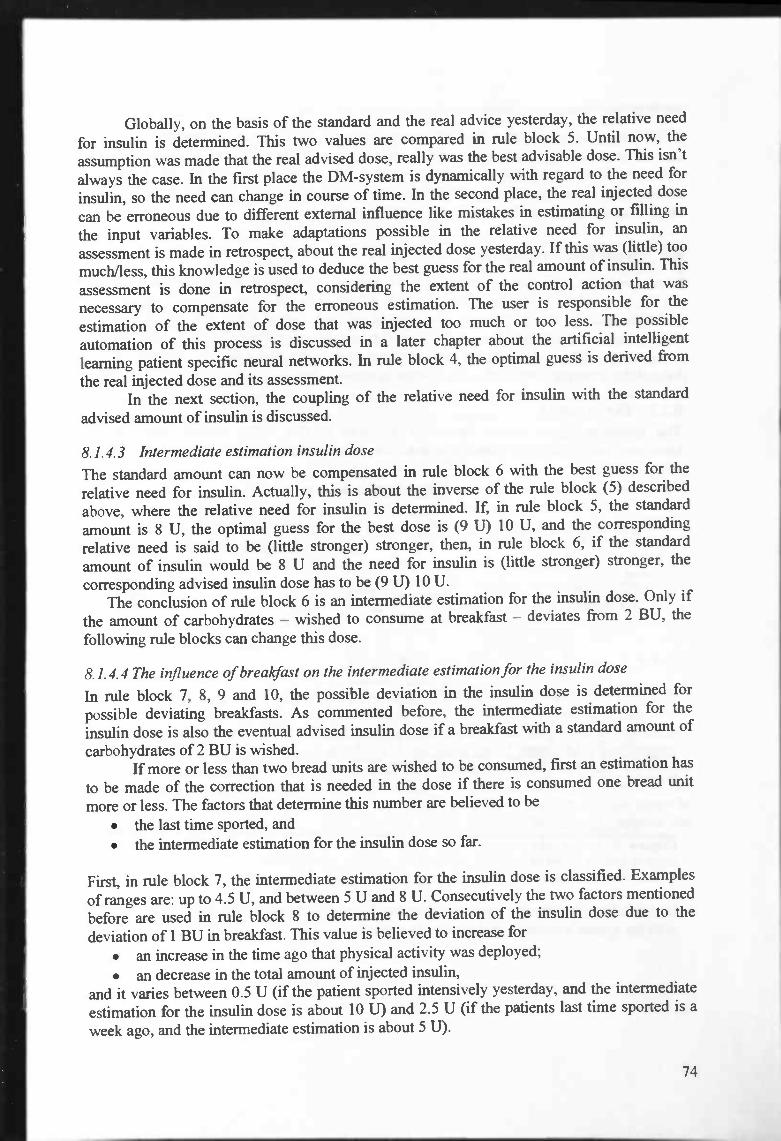
Globally, on the basis of the standard and the real advice yesterday, the relative need
for insulin is determined. This two values are compared in rule block 5. Until now, theassumption was made that the real advised dose, really was the best advisable dose. This isn'talways the case. In the first place the DM-system is dynamically with regard to the need forinsulin, so the need can change in course of time. In the second place, the real injected dose
can be erroneous due to different external influence like mistakes in estimating or filling in
the input variables. To make adaptations possible in the relative need for insulin, anassessment is made in retrospect, about the real injected dose yesterday. If this was (little) toomuch/less, this knowledge is used to deduce the best guess for the real amount of insulin. This
assessment is done in retrospect, considering the extent of the control action that wasnecessary to compensate for the erroneous estimation. The user is responsible for theestimation of the extent of dose that was injected too much or too less. The possibleautomation of this process is discussed in a later chapter about the artificial intelligentlearning patient specific neural networks. In rule block 4, the optimal guess is derived fromthe real injected dose and its assessment.
In the next section, the coupling of the relative need for insulin with the standardadvised amount of insulin is discussed.
8.1.4.3 Intermediate estimation insulin dose
The standard amount can now be compensated in rule block 6 with the best guess for therelative need for insulin. Actually, this is about the inverse of the rule block (5) describedabove, where the relative need for insulin is determined. If, in rule block 5, the standardamount is 8 U, the optimal guess for the best dose is (9 U) 10 U, and the correspondingrelative need is said to be (little stronger) stronger, then, in rule block 6, if the standardamount of insulin would be 8 U and the need for insulin is (little stronger) stronger, thecorresponding advised insulin dose has to be (9 U) 10 U.
The conclusion of rule block 6 is an intermediate estimation for the insulin dose. Only if
the amount of carbohydrates — wished to consume at breakfast — deviates from 2 BU, thefollowing rule blocks can change this dose.
8.1.4.4 The influence of brealcfast on the intermediate estimation for the insulin dose
In rule block 7, 8, 9 and 10, the possible deviation in the insulin dose is determined forpossible deviating breakfasts. As commented before, the intermediate estimation for theinsulin dose is also the eventual advised insulin dose if a breakfast with a standard amount ofcarbohydrates of 2 BU is wished.
If more or less than two bread units are wished to be consumed, first an estimation has
to be made of the correction that is needed in the dose if there is consumed one bread unit
more or less. The factors that determine this number are believed to be• the last time sported, and• the intermediate estimation for the insulin dose so far.
First, in rule block 7, the intermediate estimation for the insulin dose is classified. Examplesof ranges are: up to 4.5 U, and between 5 U and 8 U. Consecutively the two factors mentionedbefore are used in rule block 8 to determine the deviation of the insulin dose due to thedeviation of 1 BU in breakfast. This value is believed to increase for
• an increase in the time ago that physical activity was deployed;
• an decrease in the total amount of injected insulin,and it varies between 0.5 U (if the patient sported intensively yesterday, and the intermediateestimation for the insulin dose is about 10 U) and 2.5 U (if the patients last time sported is aweek ago, and the intermediate estimation is about 5 U).
74

In the next rule block (9) a kind of multiplication is done; the total deviation equals theamount of deviating bread units (with respect to the standard amount of 2 BU) times thedifference in the dose due to a deviation of I BU. And, eventually in rule block 10 asummation of the intermediate estimation (rule block 6's result) with the correction (ruleblock 9's result) is done. This yields the eventual dose.
8.2 Breakfast — injection at waking upIn this project a controller for breakfast is developed. Assumed is an injection at waking up.On the basis of six input variables, a control advice is brought out for breakfast. The inputvariables include the BG-course, the amount of and period since the insulin injection.Examples of the advices are revision of the amount of carbohydrates to consume, thecomposition of the meal, a further postponement of the meal, and a second injection. With thehelp of the structure discussed in the following section, the advice generation is discussed.
8.2.1 The structureThe following figure shows the whole structure of this fuzzy system including inputinterfaces, rule blocks and output interfaces. The connecting lines symbolize the data flow.
In the following table the input variables are listed with respect their place in time, togetherwith the system's output variables c.q. its advices.
75
Breakfast ton.w.
Figure 8—2 The structure of the system belonging to the event "Breakfast —injection at wake up". Left the input variables, the rule blocks areenumerated. Right the output variables which form the advice.

Time Input variable Output variableFuture Activity after breakfast Composition meal
Current BG now Hypo expectedCurrent Willingness to eat extra carbohydrates Postponement meal
Past Time ago until injection Amount of carb's to consumePast BG at waking up Second insulin dose
Past Injection_dose at waking up
Table 8-2 In this table the input and output variables of the system arelisted. The input variables are categorized with respect to their place in
time.
How the advices are generated out of the input variables, is discussed in the nextsections,with the help of the enumerated rule blocks in the figure above. First the estimation for thedanger of a hype is discussed together with the possible advice to postpone the meal. This isfollowed by the discussion about an advice on the composition of breakfast. Sometimes areduced or increased amount of carbohydrates is advised, and sometimes even a second
insulin dose. The latter two sections are devoted to these subjects.
8.2.2 1,2 Hypo alarm and advices on the postponement of breakfastThe insulin injection is taken at waking up. The global action profile of the short workinginsulin used by the author is as follows. The insulin's effects are measurable for about 2hours. Within a quarter after the moment of the injection and after about two hours, not somuch can be expected of the effects of the insulin. After a small half an hour the first effectsof the insulin are most often noticeable, and about an hour after the injection, the insulin'seffects are the best noticeable in general. The four relevant distinguished periods since theinjection are
• 'A hour,• 1 hour,• lV2hour,and• 2 hours.
Given the period since the injection, the BG course — the BG value at waking up, and the BGvalue now — determines the measure of expecting a hype in the (near) future, say about the
first V2 hour. First in rule block (1) a classification is made of the BG value at waking up;values which yield the same control action are in the same range. Next, this classification iscompared with the current BG value. Dependent on the period since the injection, the dangerfor an approaching hypo is estimated by the author's knowledge. In the figure below, thedanger for an approaching hype is depicted for different values of current BG, the range inwhich the BG value at waking up fells, and the period since the injection. It reflects theworking of rule block 2.
The different stages in the danger for an approaching hype are• absolutely yes,• probably yes,• probably no, and• absolutely no.
76
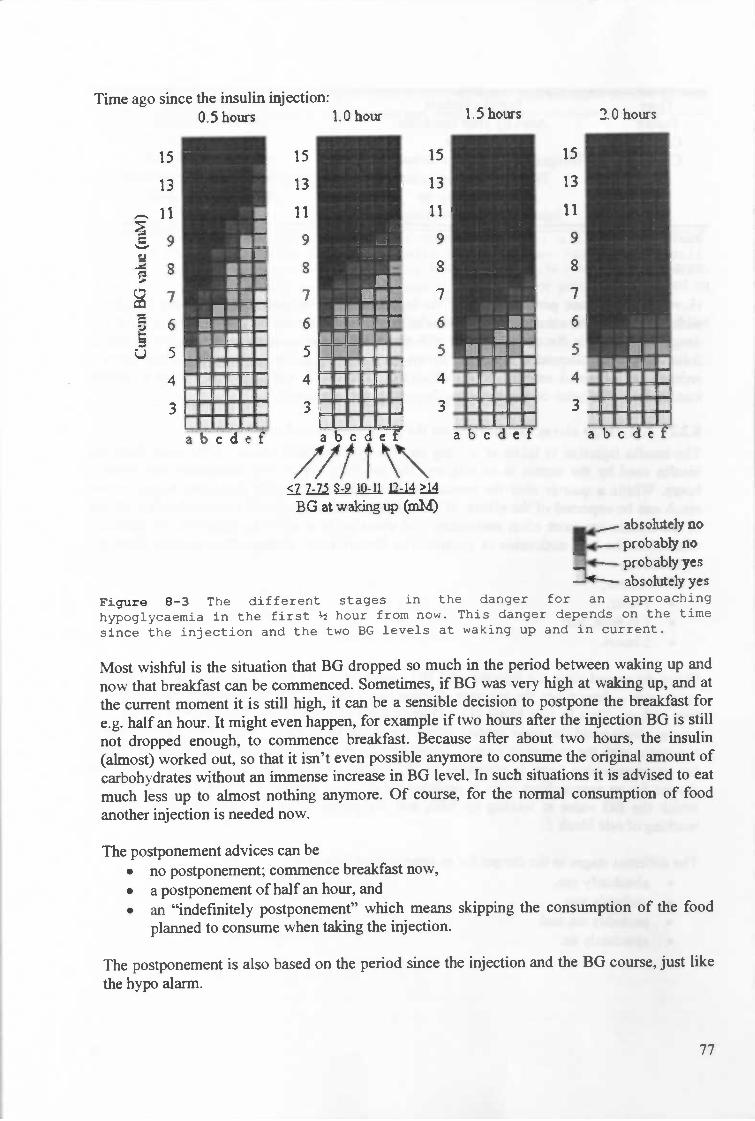
Most wishful is the situation that BG dropped so much in the period between waking up andnow that breakfast can be commenced. Sometimes, if BG was very high at waking up, and atthe current moment it is still high, it can be a sensible decision to postpone the breakfast for
e.g. half an hour. It might even happen, for example if two hours after the injection BG is stillnot dropped enough, to commence breakfast. Because after about two hours, the insulin(almost) worked out, so that it isn't even possible anymore to consume the original amount ofcarbohydrates without an immense increase in BG level. In such situations it is advised to eatmuch less up to almost nothing anymore. Of course, for the normal consumption of foodanother injection is needed now.
The postponement advices can beno postponement; commence breakfast now,
• a postponement of half an hour, and• an "indefmitely postponement" which means skipping the consumption of the food
planned to consume when taking the injection.
The postponement is also based on the period since the injection and the BG course, just likethe hypo alarm.
77
Time ago since the insulin injection:0.5 hours 1.0 hour 1.5 hours 2.0 hours
4
U
ISRuuuIrNIUR
RURRUI.'.''a'."
U & L
RU..'a....I....N....urn...
15
13
11
9
S
7
6
5
4
3
IUR
Ru...U....U....'a...
15
13
11
9
8
7
6
5
4
3
U'...U....a....U'...a abcdet bcdef
//1?\\lLD14?1BGatwalcingup(mM) I absoke1y no
probably no.44-. probably yes—--- absolutely yes
Figure 8-3 The different stages in the danger for an approaching
hypoglycaemia in the first hour from now. This danger depends on the timesince the injection and the two EG levels at waking up and in current.
In the following section the advice that is brought out on the composition of the meal is
discussed.
8.2.3 3 Composition of breakfastThe content of an average breakfast is two slices of bread with cheese. The carbohydrates insugar drink and glucose are more short working than those in bread. Sometimes it is advisable
to change the meal's content, to eat some extra glucose or to drink with sugar — leaving the
total amount of carbohydrates assumed taking the initial injection, unaffected. Rule block 3
brings out some advice on the content of the meal, with regard to the ratio of short and longworking carbohydrates. Also, a possible advice can be the consumption of some extra glucose
or some extra drink with sugar.The injection at waking up is taken considering the amount of carbohydrates the
patient wants to consume at breakfast. Most often, this amount can be consumed withoutproblems, but sometimes it is advisable to eat some more short working carbohydrates instead
of the same amount of long working carbohydrates. For example changing the consumptionof one slice of bread by the consumption of some drink with sugar as drinking chocolate.
The drop in BG due to the activity is compensated with some extra sugar drink. Also,
if an approaching hypo is expected, the composition of the meal is changed, leaving the totalamount of carbohydrates unchanged. Now some short working carbohydrates are consumedin stead one slice of bread. The total amount of carbohydrates has to remain the same because
the amount of insulin is adapted to this amount.In situations where probably no hypo or absolutely no hypo is expected, the content is
advised to remain normal. Except, if no postponement is advised and there is planned physicalactivity after breakfast, then some more short working carbohydrates are advised. On theother hand, if the expectation for a hypo is absolutely sure, the consumption of some extraglucose is advised. If there is physical activity after breakfast, and no postponement of themeal is advised, then some extra sugar drink is advised either. Also, if the expectation for ahypo is probably sure, in general some extra sugar drink is advised.
Concluding, the information about the content of the meal is derived from
• the activity after breakfast,• the expectation of a hypo, and• the eventual postponement of the meal.
The possible advices are• consume some extra glucose,• consume some extra sugar drink,• consume more short working carbohydrates, keeping the total amount constant, and
• no need to change the meal's content.
This section was about the meal's content, the next is about the amount of carbohydrates in a
meal.
8.2.4 4 The amount of carbohydrates in breakfastAs discussed in earlier sections (on multiple places), due to the dawn phenomenon,sometimes enormous increases in BG can occur after waking up. Because this is unknown atthe moment of the injection at waking up, it cannot be taken into account then. A solution fora compensation of this arise in BG is to diminish the amount of carbohydrates intended to
consume. On the other hand, sometimes the drop in BG is much faster than expected andwished, due to an overestimation of the insulin dose or a coincidental increased working of
78

the insulin. In these cases, it is advisable to eat something more than intended to. The advicesabout the amount of carbohydrates in breakfast are, consume
• more,• little more,• same,• little less,• less, and• much less.
Remark. There are three graduations for eating less, in contrast to two for eating more,because the first occurs more often than the latter and so the author probably developed anincreased capability to distinguish these cases.
The advice is brought out on the basis of the same variables as the hypo advice and theadvice for the postponement of the meal, namely
• the period between the injection and now,• the BG value now, and• the range that included the BG value at waking up.
79

/;,fl\\1Li214?i4BG atwaking up (mM)
moree more
• .__..—_htiie less
L4*------— lessU*_ much less
Figure 8-4 The advised amount of carbohydrates in comparison with the
amount that is wished to eat at waking up. This advice depends on the time
since the injection and the two BG levels at waking up and in current.
The author filled the rule blocks (like all rule blocks) on the basis of this intuition.
The output of this rule block (4) about the amount of carbohydrates to consume is only valid
if there isn't taken a second injection; sometimes the situation is so bad that BG doesn't dropenough and a second insulin dose is necessary. The following section is about the latter. Thisautomatically implies that the same amount of carbohydrates can be consumed as originally
preferred at the first injection.
8.2.5 5,6, 7 The second insulin doseThe fact if a second insulin dose is necessary, is (again) derived, in rule block 5, from the
three variables• the period between the injection and now,• the BG value now, and• the range that included the BG value at waking up.
The global structure of this process is described in the former section. If there is decided totake a second insulin injection, the amount of this dose mainly depends on the first dose,
80
Time ago since the insulin injection:O.5hons 1.Ohon 1.5hows 2.Ohoizs
aa.a.s.
I..a.U.....U....,U.....
15
13
11
9
8
7
6
5
4
U.aa.uiU..ui.
'—U...I
15
13
11
9
8
7
6
5
4
3
a'.aiu*
3
a U coeL

which was injected at waking up. It is a correction that is aimed at the intended result at thefirst injection. If this injection is taken the original breakfast can be consumed (after theindicated postponement) as intended when taking the first injection.
Out of the three variables, mentioned above, the 'relative amount' of extra neededinsulin is determined in rule block 5. The 'relative amounts' are:
• None,• Very little,• Little,• Average,• Much, and• Very much.
Only the major choices here, are discussed. An important choice is when to take a secondinjection and when not. The advice to inject very little insulin, is for example given, if the BGvalue at waking up was between 7.0 mM and 7.5 mM, and half an hour later it was 10 mM. IfBG is smaller than 10 mM, no injection is taken. If it were 14 mM half an hour later, theadvice would be to inject very much. Other, more moderate advices are given if the lattervalue lies in between 10 mM and 14 mM. Of course, if the BG value at waking up was morethan 7.5 mM, the BG value of half an hour later has to be greater than 10 mM, to make itsensible to take an injection of very little insulin.
Interesting is the fact that if the injection is taken two hours ago, the need for anotherinjection is independent on the BG value at waldng up. Only if the current BG value is 8.5mM or more, there is need for a little extra insulin. For values below 8.5 mM a further drop isexpected which makes the consumption of the decreased amount of advised carbohydratesstill possible.
Actually the relative need for insulin has to be compared with the injected amount of insulinin the first injection, which would form the amount of the second injection. For example if thefirst dose is 8 U the average injected second dose is 3.5 U. This is done in rule block 7, butfirst another operation is executed, discussed in the next section.
8.2.6 6 The diabetic's health is put firstFor people with diabetes it is difficult to weigh up the contras of a high BG level and thecontras of eating more than wished. The effects of an injection are never exactly predictable.If little less than the best guess is injected, less often a hypo will be caused. The drawback ofinjecting less is that higher BG levels are reached on average. On the other hand, thedrawback of very often eating more than wished, is that people become fat. Moreover, thefatter a person is, the more difficult it is to stabilize his BG level.
This is the reason that an unusual input variable is added to specify the willingness toeat extra carbohydrates in case the dose was little overestimated. The terms present at thisinput are:
• No, and• Eventualyes.
If there is willingness to eat some extra carbohydrates if the dose was little overestimated, thebest guess for the dose is done on the basis of the output of rule block 5, described in theformer section. If there is no willingness, then the output of rule block 5 is decreased with onecategory.
81
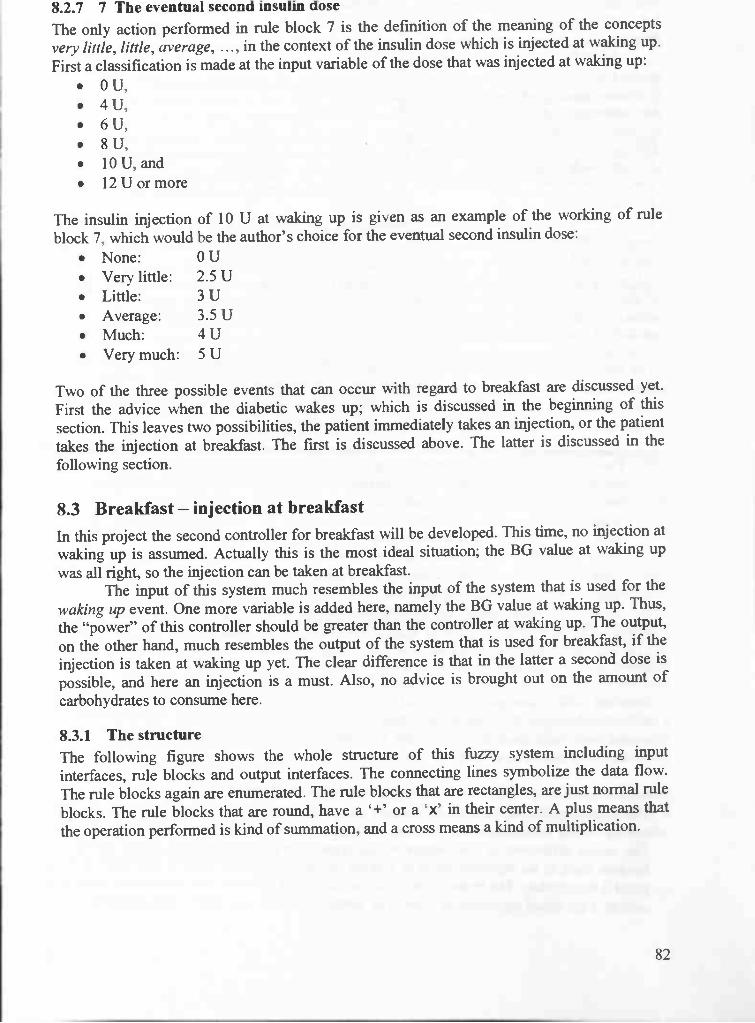
8.2.7 7 The eventual second insulin doseThe only action performed in rule block 7 is the definition of the meaning of the conceptsvery little, little, average, ..., in the context of the insulin dose which is injected at waking up.
First a classification is made at the input variable of the dose that was injected at waking up:
• 0U,• 4U,• 6U,• 8U,• 1OU,and• l2Uormore
The insulin injection of 10 U at waking up is given as an example of the working of ruleblock 7, which would be the author's choice for the eventual second insulin dose:
• None: OU• Very little: 2.5 U• Little: 3 U• Average: 3.5U• Much: 4U• Very much: 5U
Two of the three possible events that can occur with regard to breakfast are discussed yet.First the advice when the diabetic wakes up; which is discussed in the beginning of thissection. This leaves two possibilities, the patient immediately takes an injection, or the patient
takes the injection at breakfast. The first is discussed above. The latter is discussed in thefollowing section.
8.3 Breakfast — injection at breakfastIn this project the second controller for breakfast will be developed. This time, no injection atwaking up is assumed. Actually this is the most ideal situation; the BG value at waking upwas all right, so the injection can be taken at breakfast.
The input of this system much resembles the input of the system that is used for thewaking up event. One more variable is added here, namely the BG value at waking up. Thus,the "power" of this controller should be greater than the controller at waking up. The output,
on the other hand, much resembles the output of the system that is used for breakfast, if theinjection is taken at waking up yet. The clear difference is that in the latter a second dose ispossible, and here an injection is a must. Also, no advice is brought out on the amount ofcarbohydrates to consume here.
8.3.1 The structureThe following figure shows the whole structure of this fuzzy system including inputinterfaces, rule blocks and output interfaces. The connecting lines symbolize the data flow.The rule blocks again are enumerated. The rule blocks that are rectangles, are just normal ruleblocks. The rule blocks that are round, have a '+' or a 'x' in their center. A plus means thatthe operation performed is kind of summation, and a cross means a kind of multiplication.
82
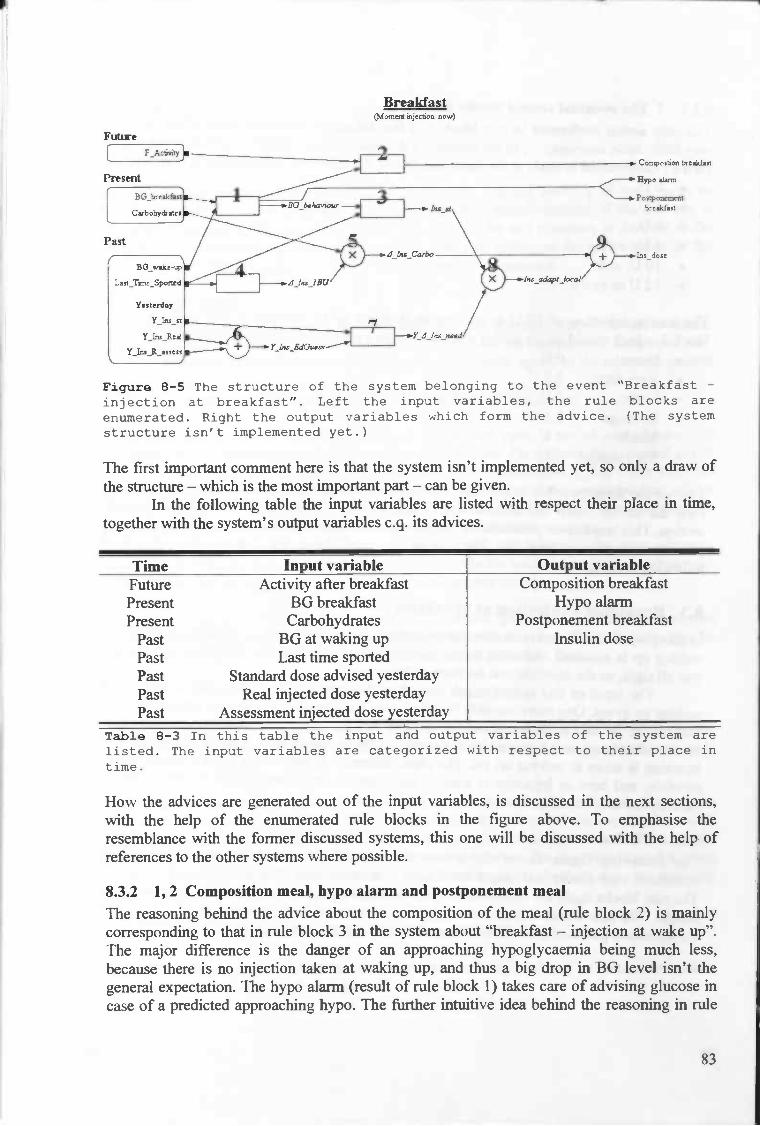
BreakfastcMon3exl iijec.o noi.)
1
- breáfit
Figure 8—5 The structure of the system belonging to the event "Breakfast -injection at breakfast". Left the input variables, the rule blocks areenumerated. Right the output variables which form the advice. (The systemstructure isn't implemented yet.)
The first important comment here is that the system isn't implemented yet, so only a draw ofthe structure — which is the most important part — can be given.
In the following table the input variables are listed with respect their place in time,together with the system's output variables c.q. its advices.
Time Input variable Output variableFuture Activity after breakfast Composition breakfastPresent BG breakfast Hypo alarmPresent Carbohydrates Postponement breakfast
Past BG at waking up Insulin dosePast Last time sportedPast Standard dose advised yesterdayPast Real injected dose yesterdayPast Assessment injected dose yesterday
Table 8—3 In this table the input and output variables of the system arelisted. The input variables are categorized with respect to their place intime.
How the advices are generated out of the input variables, is discussed in the next sections,with the help of the enumerated rule blocks in the figure above. To emphasise theresemblance with the former discussed systems, this one will be discussed with the help ofreferences to the other systems where possible.
8.3.2 1,2 Composition meal, hypo alarm and postponement mealThe reasoning behind the advice about the composition of the meal (rule block 2) is mainlycorresponding to that in rule block 3 in the system about "breakfast — injection at wake up".The major difference is the danger of an approaching hypoglycaemia being much less,because there is no injection taken at waking up, and thus a big drop in BG level isn't thegeneral expectation. The hypo alarm (result of rule block 1) takes care of advising glucose incase of a predicted approaching hypo. The further intuitive idea behind the reasoning in rule
83
Fuüne

block 2 is about this. If there is planned future activity, there will be advised to eat more short
working carbohydrates, assuming that the BG level at breakfast isn't (become) high (e.g. 8.5
mM). This is to avoid a hypo when practicing the activity. In other cases just a normal
breakfast is advised.The BG level at breakfast can be compared with that of waking up. If there is a strong
drop, and the current value is also low, then a warning for approaching hypoglycaemia is
given (rule block 2). Also, assuming a reasonable BG level (i.e. not above e.g. 7.5 mM,
otherwise an injection would have been taken at waking up), the measure of increase or
decrease is an important fact in the determination of the standard dose that has to be injected.
If there is an ascending trend in BG, of course this has to be compensated with insulin. The
BG behaviour is another output of rule block I.
8.3.3 3,6,7,8 Intermediate estimation insulin doseThe method to derive an appropriate insulin dose mainly resembles the first system's method.
The standard dose is determined by the combination of the BG behaviour and the last time
sported (rule block 3). This again is like the determination of the standard dose in the first
system. The major difference is that at the dose determination at waking up is only on the
basis of one BG value, and here — knowing this BG value at waking up being all right (what
means not too high) — one more value (the current BG value), and thus the trend in BG, can
be included in the evaluation of the standard dose. This will yield a better guess for the insulin
dose, because more information is available.For the output of rule block 3, the standard insulin dose, yields that it is based on the
amount of carbohydrates of two slices of bread in breakfast. This is the same assumption as in
the first system, and is because of the fact that such a breakfast is quite standard for the
author.The relative need for insulin is derived on the basis of the same method as in the first
system; the rule blocks 6, 7 and 8 here, are the same as the rule blocks 4, 5 and 6 respectively
in the first system. Their work is already described before. Rule block 8 yields the
intermediate insulin dose.
8.3.4 4,5,9 Breakfast's influence on intermediate estimation for insulin dose
The standard amount, which is already compensated with the relative need for insulin is based
on the standard amount of carbohydrates of 2 BU. Only if the amount of carbohydrates
diverges from standard, this dose has to be adapted. The insulin that has to be injected due to
I BU more or less carbohydrates in breakfast (thus in total 3 BU, or 1 BU), is called
A_Ins_1BU. An eventually diverging amount of carbohydrates it isn't often more than I or
1.5 BU. The only significant influence is thought to be the period until the last time intensive
physical exercise is performed. In the first system, the insulin dose — determined on the base
of the last time sported and BG behaviour — (for a standard meal of 2 BU) is believed toinfluence A_Ins_1BU. Yet, this influence is considered to be minor enough to ignore. It is a
minor influence, because the advised doses until now are not influenced that much by BG
behaviour, in contrast to the dose that is computed at waking up which strongly depends on
the BG level.Once determined _Ins_l BU (the output variable of rule block 4), it can be multiplied
by the difference in breakfast, compared to the standard meal of 2 BU. This multiplication is
rule block S's output, and is summed in rule block 9 with the insulin dose computed so far.
This summation yields the eventual insulin dose.
84

9 Testing
With the testing of a system, we mean both testing the internal working of the system astesting the performance of a system. In this chapter the internal working of the systems isdiscussed according to the analysis of a real test case. In the end a section is devoted to theevaluation of the testing discussed in this section. But first testing of the performance of theFuzzy Logic IDDM-controllers as described in this work, is discussed.
9.1 PerformanceWith the performance of a system, its predictability of the adequate control action is meant.Testing of control advices is a difficult question. In fact, there are two possible scenarios:
1. The system is tested in a set of familiar situations with regard to the adequate controlaction.
2. The system is tested in practice with regard to the executed advice.
If the performance of the system is tested as in the first case, a set of combinations ofsituations and corresponding control actions has to be known. This set can be extracted out ofreal life situations that are assessed in retrospect as controlled adequately. For every situationin the test set, the advice of the system has to be compared with the corresponding advicefrom the test set. We state that its performance is (almost) as bad as its worst advice. Anadvice is considered to be worse than another advice if it bears more danger.
For example, a system can yield an advice that is very close to the most adequateadvice hundred times, and one time be completely beside the mark, to be bad in comparisonwith a system that always is a bit faulty, but never makes big mistakes.
The proposal of an adequate control action is a complex question. The author asked twomedical doctors that couldn't tell him an appropriate error measure. The following can bestated. If d (> 0) is the adequate insulin dose, and c (> 1) is a number, then
cd is a worse advice than dic.
Maybe an adequate error measure uses a square or x3 because the more an advice diverges,the worse it (relatively) is. More research has to be done to detennine an appropriate errormeasure.
The second case in testing the performance of a system concerns the effect of an executedcontrol action. The only possibility now is considering the effects of the insulin dose withrespect to the corresponding BG values. Take a BG sample, for example two hours after theinjection and compare its error to the error of the aimed value. The cost function, describedearlier in this work, could function here as an error function if the absolute signs are removedand the result is inverted (with adding a minus sign):
error(BG) : — 10*(logio(BG/4.4))3,
An error value above zero means that too much insulin is injected and an error value belowzero means that too little insulin is injected.
85
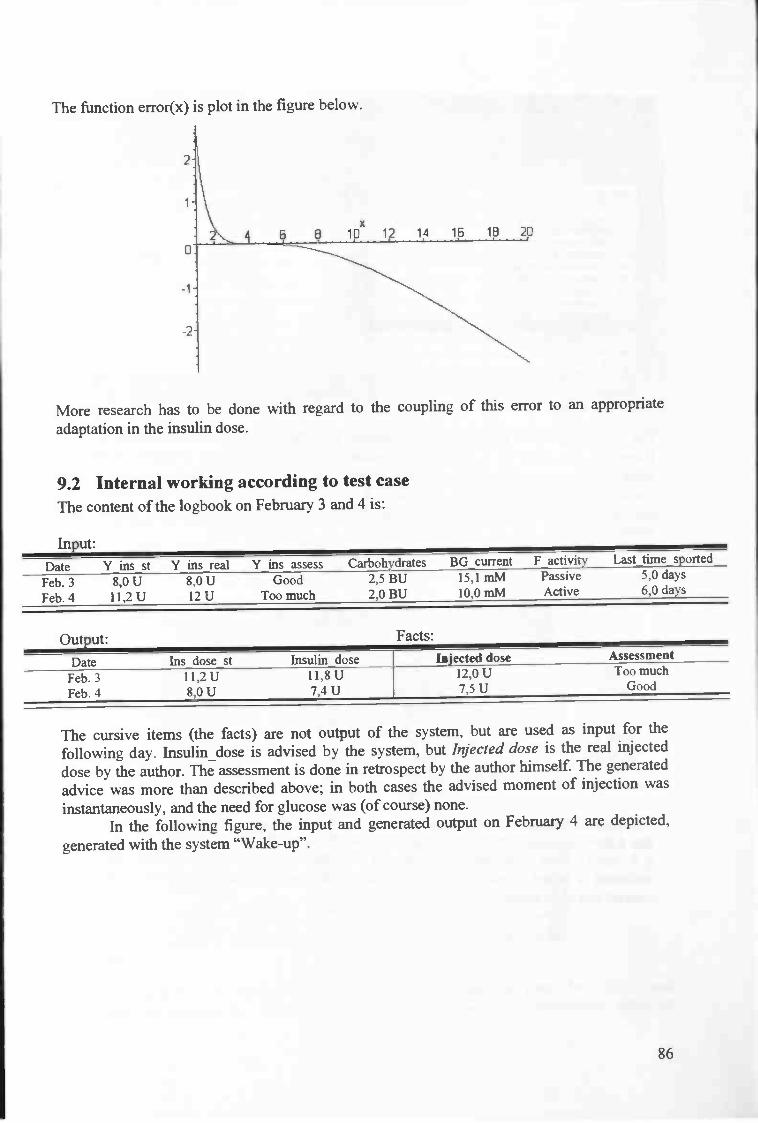
The function error(x) is plot in the figure below.
More research has to be doneadaptation in the insulin dose.
with regard to the coupling of this error to an appropriate
9.2 Internal working according to test caseThe content of the logbook on February 3 and 4 is:
Input:
Date Y ins_st Y_ins_real Y_ins_assess Carbohydrates BGcurrent F_activity Last_time_sported
Feb. 3Feb. 4
8,0 U11,2 U
8,0 U12 U
GoodToo much
2,5 BU2,0 BU
15,1 mM10,0 mM
PassiveActive
5,0 days6,0 days
Output: Facts:
Date Ins_dose_st insulin_dose Injected dose AssessmentmuchFeb.3
Feb.411,2 U8,OU
11,8 U7,4U
12,0 Ui,SU Good
The cursive items (the facts) are not output of the system, but are used as input for thefollowing day. Insulin_dose is advised by the system, but Injected dose is the real injecteddose by the author. The assessment is done in retrospect by the author himself. The generatedadvice was more than described above; in both cases the advised moment of injection wasinstantaneously, and the need for glucose was (of course) none.
In the following figure, the input and generated output on February 4 are depicted,
generated with the system "Wake-up".
86
1
x
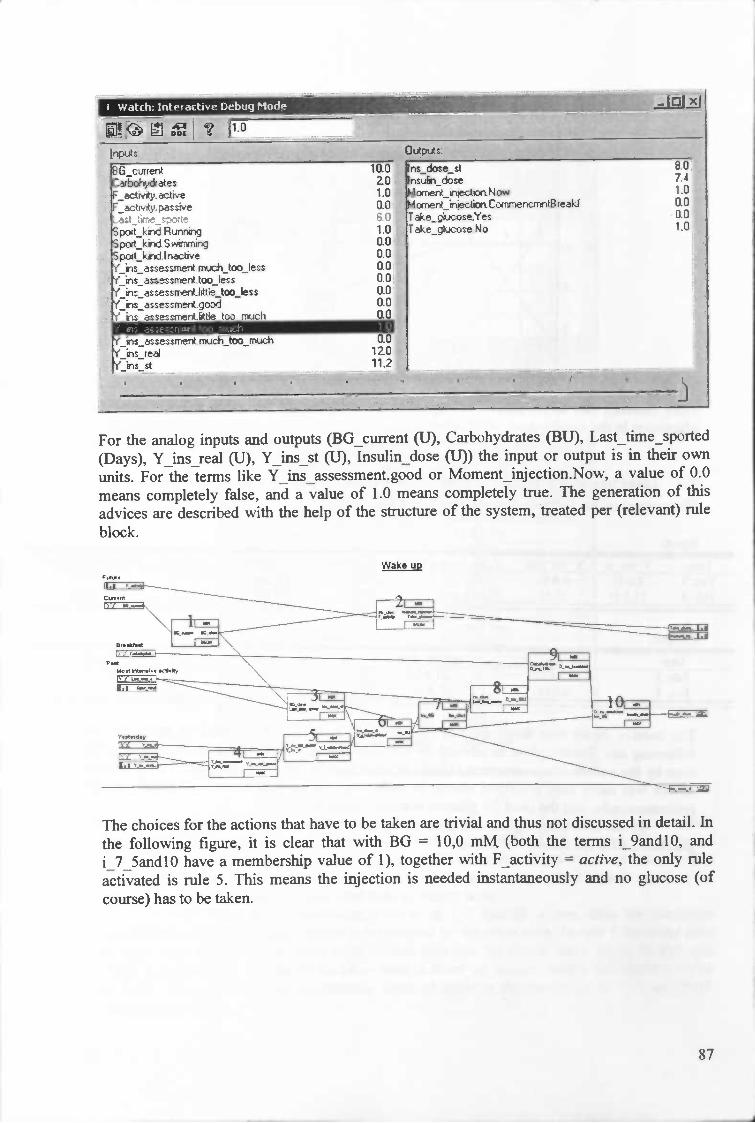
I Watth: 1ntertive Dehuq Mode
rx1s3G_ct.uerbohyc*eacy.actNe
poIt_kid.R&xTwigpod_kidS wirT1Tigpodkiinathves_as*enmeitmuch_too_Ies*esime,ttoo_i_amattI._too_Ietsanessmett good_aseumeritOe too rm.ich
issessmerttmjchtoomuth'iredr'ii*at
I •I• I -. •
LJJ
iao ns_doe_s --2.0 ns*h_doee1.0 4ome&ijethoaNowo.o &CoencndWfef
re_cose.Yes1.0 rthe_coe.No000.0 '.0.00.0 .0.00.00.0
0.012.011.2
au7.41.00.00.01.0
For the analog inputs and outputs (BG_current (U), Carbohydrates (BU), Last_time_sported(Days), YJns_real (U), YJns_st (U), Insulin dose (U)) the input or output is in their ownunits. For the terms like Y_ins_assessment.good or Moment_injection.Now, a value of 0.0means completely false, and a value of 1.0 means completely true. The generation of thisadvices aie described with the help of the structure of the system, treated per (relevant) rule
block.
Wake UP
The choices for the actions that have to be taken are trivial and thus not discussed in detail. Inthe following figure, it is clear that with BG = 10,0 mM (both the terms i_9andlO, andi_7_5andlO have a membership value of 1), together with F_activity = active, the only ruleactivated is rule 5. This means the injection is needed instantaneously and no glucose (ofcourse) has to be taken.
87
-j

Rule block 2
- X
Next, the best guess in retrospect of the insulin dose yesterday is done with the actual injected
dose, Y_ins_real, and its assessment, in retrospect, Y_ins_assessment. The term twelve for
Y_ins_real was the only noazero term, with a membership value of I. The same yields for the
assessment term too_much. Because this, only one rule (rule 69) is activated (compare next
figure). This results in the fact that the term ten gets a membership value of 1. So, inretrospect, the best guess for the dose yesterday, is believed to be 10 U.
Rule block 4
_IrIxI
THEN- -
DoS Yi_o&Jel0i.0001fll.OoEjttiteen
01.oo0elfli.000e1even
11.001 ten- .-.- l rwe
The determination of the standard injected dose, where only the class where BG falls in, and
the period not sported, are regarded, is computed as follows. The membership value of
88
__ ____
IFBGdass
J1EN
DoS -- Mon i*ctionTHEN
DoS Toicoe1 Sm4
2 1L&5&d7_iP!—_pa'e
4 L7...5and8_5 active
5 L910 active
6 L11ancJ13
7 eatet_14tii —_---------9
Ui.000'Conersw8reJl.00fl1encITreafrJ1.000NcM -
1 .O0IJComencrrvBreakf
10(4 Now(]iTTfl1.000Now —
0i.000'i'eflt000 No01.000 No
flioo(J No
11.0(4 No
1]i.00(J No
01000 No1____.
10
11
I12
4
13
3I,jYiaueunent Y_rs_reai
64 Twel
65 tooje TweU
66 t1e_tooJe Twel
67 good Twe*
68 ftt$ejoomuch
rn1ooor1teen
69 too.much
70
Twefi
Twe*
muchjoo_nuch Twe
72 too_Ies — Ititeen tQi - 00fleen
73 e_too... Ttiteen O1.0COiteen
74 good Tliteen 01.000 tiiteen
75 tteJoo...rmacb Tliteen t]i.(XJOjtwel
76 toomuch jTPà vl

Rule 7 and rule 10 are the only rules with nonzero output. Both rules affect the membershipvalue of Eight. The operator used in this rule block, is the MIN-MAX operator. This meansthat for each rule the minimum of the IF-terms is taken as the output value, or membershipvalue of the output term. The membership value of the concerning output term is equal to themaximum value of all the rules with that term as output term.
In rule 7 and 10 the membership value of I_7_5andlO is one, thus the minimummembership value of the input terms is determined by the other term. In rule 7 the other termis Four, with a membership value of 0.33, and therefore the output term, Eight, in that rulegets a value of 0.33. In rule 10 the other term is Week_or_longer, with a membership valueof 0.67 . Now, the eventual membership value of Eight is the maximum of 0.33 and 0.67,which is 0.67.
89
i_7_5andlO is one (discussed above). The membership values of Four and Week_or_longerare 0.33 and 0.67, respectively (compare figure below).
[tast time sporte
The next figure shows the rule block that determines the Ins_st_dose on the basis of the lasttime sported and the class in which the current BG value falls.
2 iilandi33 greater_i 4
L7_5endl 0
Lii andi 3
6 greater_14
[Ii .001], Five
01.0011 Si91.001], E1
01.0011 sfli.oC1. Seven
i.oo[ Ten
1
7 1L7_5&d1O
8 Lllandl3greater_i 4 r ui
1.00k
1.0cC
1.0cC
EEj*
0 L7_Sandl 0 Week_or_longer
1illandl 3 WeekoLbnger
T,
2Igreater_i 4
Rule block 3
toc[ENTenT

In rule block 5, out of the yesterdays standard advice and the guess for the best dose inretrospect, yesterday, the relative need for insulin is determined. The standard adviceyesterday was 11,2 U. It appears from the following figure that both terms ten and twelve
have a nonzero membership value.
lerm Zero Five E Se' Eicit Ten Twefve
ero 0.00 1.0
Fre aooastSxISeven 0.00 6EiQN 0.00tT. OAfl Q4
_______
15.08.0
11.2 U
Ten has a membership value of 0.4, and twelve of 0.6. (Compare: 0.4 * 10 + 0.6 * 12= 11.2.)Now, at the following rule block, rule block 5, two rules have nonzero output. BecauseY_ins_st has 7 terms and Y_ins_opt_guess has 23 terms, the rule block (5) that defines therelative need of insulin yesterday by comparing the two variables, has 7 times 23 = 161 rules.
Only two rules are activated. The membership values of the terms of Y_i_relativeNeed,together with the rules that activated the terms are illustrated in the following figure.
ItMlenStrong - 0.0000Ie_strong - 0.6000
The result of this rule block, that determines the relative need for insulin is, that the termless_strong has a membership value of 0.6, and normal of 0.4, again computed with the MLN-MAX strategy.
The standard advised insulin dose in this case, Jns_dose_st, is eight, with amembership value of 1. As shown above, with regard to the relative need for insulin(yesterday), two terms have nonzero membership value, less_strong and normal. In rule block6, which determines the insulin dose so far, Ins_BG, two rules are activated.
90
0.2
-4.0
RuIe Analy r i tiveNeed
much_strcwger - 0.000thcwer-0.0000tIe_*on9et a 0.0000no.m-0.4O0O
Rule block — For eacn term me rules with nonzero output are depicted. (This is a summaryof the relevant part of this rule block.)


eim
DcL5-a0000D1-O.0000D1_5a00OOD2-O.3333
and D2_5 are that the insulin dose increases (decreases) with 2 U, respectively 2.5 U, if the
amount of carbohydrates increases (decreases) with the amount of 1 BU. For all clarity, thestandard amount of carbohydrates at breakfast is 2.0 BU.
Rule A.ily.rr E_ir1BI
___________
Rule blocK
Yet the total increase is computed due to the amount of carbohydratesBecause at February 4, the standard amount of 2 BU is consumed, theCompare following figure.
.Rule Analyzer - D_ii._breaklast *'-:
in the breakfast.increase is zero.
lD1
00000. 00000.0.0000.0.0000.0.0000.i0000.0.0000. 0.0000.0.0000.0.0000.0.0000.
Term I AS I IF I 4w• I DoS I Res... 1±
Mr_2_5-0.0000Mn_2."0.0000Mvi_1_5-cL0000
-aooooMm_0_5 - 0.0000Zeroal.0000 D&dejBre Caiboèjckates.Two 1.000 1.000 —
PbJ_0_5 • 0.0000— 0.0000
Plus_1_5-0.00000.0000 i
Rule block 9
Now the eventual insulin dose is the sum of the insulin dose determined for so far, Ins_BG,and the increase due to an eventual different breakfast. Because the influence of the breakfastis zero here, the dose, computed for so far, is the eventual insulin dose.
92

In*ki_doe
: IoIJ
Ins*hi_doe-7.402U
Temi I RB I IF I A. DoS I Ree...
F,ve_5 - 00000S -000(X)
• 0.0000&Seven - 0.6000 Sum.jis6G.m... D_ns_beódast
Ins_BG - Seven 0.&X) 1.000 0.600
Seven_5 — 0.0000E-04000 Sum..jsBGji... Djis_btedast-Zero
Ine_BG .E 0400 1.000 0.400
Ei_5-00000Nne-0.0000 .. :J.
Rule block 10
Insulin_dose has a value of 0.6 * 7+0.4 * 8 7,4 U.
9.3 EvaluationIn the section before the internal working of one of the systems is shown. Situations with aknown control action can be explicitly programmed in the Fuzzy structure. Fuzzy provides(eventual non-)linear interpolation between this known situations in a sensible way, as stated
in many articles.In the beginning of this chapter two scenarios in testing the performance of a system
are discussed. The first supposes the knowledge of an ideal dose; the second supposesknowledge of the effect of the executed advice. Both cases are described to be realizable, butmore research is necessary anyway.
93

10 Evaluation Fuzzy Logic controller implementations
Every diabetic starting with self-regulation is explained the reasoning described in the chapterabout Present-day self-regulation. In this chapter the Fuzzy Logic implementation of this wayof reasoning is evaluated with regard to the "manual way". The diabetic is expected to refinethis reasoning according to his lifestyle and the behaviour of his own DM-system. In the latersections the author's refinements with regard to dealing with the determination of the insulindose for breakfast and other control actions are discussed. Next, the use of Fuzzy Logic at theimplementation of a controller for diabetes is evaluated. The chapter will end withconclusions on the Fuzzy Logic implementation of the different systems. In a next chapter the
possible approach of a continuation on patient specific controller models is discussed.
10.1 Present-day starting with self-regulationThe reasoning presented in the chapter about present-day starting with self-regulation is themost basic one possible. The reasons for simplicity are that
1. it has to be applicable on every diabetic as point of departure, and
2. it has to be simple enough to understand for most diabetics.
The first is because a patient-specific implementation is very lifestyle-dependent (this
appeared from the author's refined systems).
The Fuzzy Logic implementation yields an exact representation of the reasoning. Theadvantage in comparison with the normal "manual way", is the predefined gradual transitionfrom one BG category to another. The big advantage is the automation of the process.
Both the relation between BG and an adaptation in the insulin dose, and the relation betweenthe consumption of extra carbohydrates and an adaptation in the insulin dose, are assumed tobe non-linear in literature. However, in the hospital's paper, each relation is defined as alinear one; probably on behalf of simplicity. Even (patient-specific) non-linear relations asthese can be implemented very easy with the means of Fuzzy Logic. For a patient-specificimplementation, the patient-specific quantitative relations can be implemented.
Factors other, that really are important influences on the course of BG, which are not includedin this reasoning, are assumed to be invariant. For example, if the activity after breakfastdiffers from day to day, it is worth it to include it in the contemplations about the correctinsulin dose. But, if the activity after breakfast is the same each day, it hasn't to be included inthe contemplations about the correct insulin dose every day, because it hasn't any influence.
This restricts the patient in his freedom of movement and requires a regular life. Themore alternative ways of living a patient has, the more complicated his control system is.
A drawback of this system's structure is the absence of the theoretical present automatedcorrection mechanism for structural erroneous insulin doses. If there is injected a structuraltoo small or too big dose, and the patient cannot allocate the cause in food, physical activity,
stress or illness, the dose has to be adapted by 1 or 2 units. This dose has to be used for atleast three days.
94

In the following three sections the author's extensions (i.e. refinements) of the abovereasoning with regard to dealing with breakfast are discussed. More advices than only theinsulin dose are included in these systems. The Fuzzy Logic structure implementations are
discussed in preceding chapters.
10.2 Waking upThe advices determined here concern the moment of injection, the insulin dose, and theeventual need for glucose. If this system is compared with the point of departure, described
above, the following things are striking.• The extended kinds of advices.• The automated determination for the optimal guess of the current relative need for
insulin.• The difference in the insulin dose that corresponds with a difference of one BU in
breakfast is dependent on the amount of injected insulin and the last time sported.
• The evaluation of the period that no physical activity is performed.
The moment of injection is a useful advice. Because it is totally dependent on the BG value atwaking up and the presence of future activity, the determination of this advice is
straightforward.
As in section "10.4 breakfast — injection at breakfast", the most remarkable fact is theautomated determination for the optimal guess of the current relative need for insulin, in caseof an injection. This kind of structure provides adaptations in the insulin dose in course oftime. Every day there is a possibility for a correction. However, the author doesn't use thispossibility daily. Only if the insulin dose of the past day really wasn't appropriate, this can beregistered in the system. Then a correction is made according to the estimated extent of theerror in the past day.
One can have his doubts about the fact that such an opportunity has to be offered fromday to day for a general diabetic. Considering the importance of the time ago since the lastphysical exercise in the insulin dose determination, the author's expectation is the following.The system's equilibrium points with respect to the relative need for insulin change in courseof time. The actual need for insulin decreases rapidly for an increasing period since the lasttime sported. This rapid change in the actual need for insulin is expected to cause the relativeneed for insulin to differ more than if there is no change in the actual need for insulin.Moreover physical activity changes the nature of the DM-system. Diabetics (like the author)with an irregular life with respect to the performance of physical activity are expected moreoften dealing with a rapid change in the actual need for insulin. Probably this is the reasonthat the author developed the possibility of a correction on a smaller time scale.
Moreover, if the rapid change in the actual need for insulin is not estimated correct,due to any reason, the next day this can be corrected, so internal faulty configurations of thesystem are automatically adjusted. So, this automated correction system, is able to correctevery deviation in the insulin need.
Of course, for a more moderate effect, the correction mechanism can be used as follows. Letthe assessment (in retrospect) of yesterday morning's insulin dose be a sort of averageassessment of the insulin doses in the mornings of the past two, three or more days. If theassessments (at least qualitatively) resemble each other, a correction can be made.
95
The third remarkable fact in the beginning of this section was this. The amount of injectedinsulin depends on the amount of carbohydrates in breakfast. On a certain moment, theamount that would be injected for a standard meal is known. The deviation in the insulin dosedue to a deviation of one BU in the amount of carbohydrates is believed to be dependent on
1. the period not sported, and2. the amount of injected insulin without a deviation in the amount of carbohydrates.
The exact relation between this two variables and the adaptation in the insulin dose isdisputable. Although maybe some improvements can be made here, it is anyhow animprovement in comparison with the system above, because there the two above factors are
ignored completely.
The period not sported is very important. The standard insulin dose can be 1.5 times bigger ifthe last time sported is more than 6 days ago, compared to 1 day ago. In the "hospital'sreasoning", only the first insulin dose on the very next day is decreased. For different (groups
of) patients this effect will behave different. Also the intensity, kind and duration of the sportare important influences.
Dependent on the height of BG it must be possible to do a (safe) guess for the best period towait for consuming meal. Further research is necessary.
103 Breakfast — injection at waking upThis system provides the patient of a broad advice. The advices are about the composition ofthe meal, the postponement of breakfast, the amount of carbohydrates in breakfast, theeventual second insulin dose, and a measure for the expectation of hypoglycaemia. This is anadvantage in comparison with the hospital's system, because there the patient has to estimate
everything by his own.
The willingness for extra carbohydrates in case the insulin dose — that is the best estimationfor the average case — appears, in retrospect, to be little overestimated, is believed to be useful
in every case an insulin dose is generated.
One could argue that future activity enhances the danger for a hypo, but that is not truebecause this is compensated with the advice about the meal's content.
The eventual postponement should yield an exact number of minutes (or quarters), and can beextended from the current three categories, now, '/2 hour, infinite.
10.4 Breakfast — injection at breakfastThe most important difference of this system, in comparison with the former two systems, isthe power. This system is believed to be more powerful than the other two, which means thatit's predictions are believed to be more sure. The reasons for this are
1. the insight on the course of BG is based on two measurements (and the time inbetween), and
2. the behaviour of the DM-system is yet stable; BG at waking up is expected to bestable, because no injection is taken at waking up, if this system is used.
96

Taking up the second reason, the possibilities for the advice for the insulin dose don't varymuch in this system. As explained earlier, this is the reason that the intermediate estimatedamount of insulin isn't included in the determination for the difference in the injection due toa difference in the amount of carbohydrates by 1 BU.
10.5 Evaluation of the use of Fuzzy Logic and FuzzyTechThe implementation of both the general advice, developed by the "Martini hospital" wasstraightforward. Determining the structure of the control system, according to the way theauthor controls his own DM-system appeared to be a very complex. It lasted very long andthe structure is redesigned a couple of times. For all systems yield that if the structure isdefmed properly, the implementation in Fuzzy Logic was straightforward. Every input factor(e.g. the willingness to eat eventual some extra carbohydrates) and output advice (for examplethe hypo-alarm) comprising fuzzy concepts are easy to implement with the help of fuzzy inputvariables, if appropriate linguistic terms are chosen. Crisp input and output variables are alsoeasy to implement with the "compute membership" variables. The intelligent part, the choiceof the linguistic terms and the interconnections between the rule blocks, which forms theinternal structure c.q. the translation from input to output, are drawn from an expert, here theauthor.
About the reasoning behind a correct control action for diabetes in general, the following canbe said. If a diabetic is asked why he takes a certain control decision, he perfectly is able togive a foundation in words. Also, the patients control behaviour is discussed in wordsbetween a doctor and his patient; sometimes even on the telephone. Every body is ought tohave an idea about the intuitive meaning of the concepts little less, average or more, in caseof the advised amount of food. Fuzzy logic probably is an appropriate mean to model theprocess of control action decision taking.
The Fuzzy Logic structure is implemented with the help of FuzzyTech. The great drawback ofFuzzyTech is the absence of an easy implementation of linear summations andmultiplications. If the system was implemented in a real advice program, there are easyworkarounds to cope this problem.
Anyway, the reasoning in the realised implementations is uttermost transparent and can beadapted where necessary. In fact, this is what happens on a regular doctor consult. Normally,the doctor cannot be absolutely sure if his patient fully understands what he is saying. Withthe availability of such a system, the doctor can directly implement his advices in the patient-specific system. Errors in communication between doctor and patient, and misunderstandingsare not an issue anymore, using such systems.
Using such systems, the patient gets his personal advice, tuned exactly to his situation.For some patients this will provide an easier way to live, because they are not able to give anappropriate estimation of the situation their selves.
10.6 ConclusionsThe conclusions about the Fuzzy Logic implementation of the different systems, drawn in thisand the preceding chapters, are summed up here.
97

• It is shown to be possible to realise a Fuzzy Logic implementation by means ofFuzzyTech of the most basic ways up to refmed ways of reasoning about appropriate
control actions.• Patient specific quantitative relations can be implemented. Complicated non-linear
relations between different variables are no problem anymore.• Interpolation between situations that are familiar to the expert with respect to the
corresponding control action is an advantage of a Fuzzy Logic implementation.• Deriving the structure can be difficult for patients. It should be easier for doctors or
expert-patients.• The patient-specific implementation is lifestyle-dependent. A more extended lifestyle
— offering the patient more choices in his life, maintaining the same control goals —
requires a more complex model.• These Fuzzy Logic implementations are uttermost transparent for both doctors as
patients, and easy to adapt, if the patient's lifestyle changes or the patient's DM-system's characteristics changed.
• An example of a drawback of using FuzzyTech is the roundabout way ofimplementing primitive operations as the linear summation of two variables.
• The author's refined system illustrates a possibility for automated insulin correctionsin course of time.
98

11 Safety of Fuzzy Logic controllers
This chapter deals with the safety for IDDM-patients, using control advice systems that aredeveloped on the base of Fuzzy Logic, by means of FuzzyTech here. If the systems areproperly used, they are considered to be safe. This is made plausible in the following.
The user may not make any mistake in choosing the right event, because thisdetermines the choice of the subsystem. Also, the values for the respective input variablesshould be inserted correctly. Obviously the developed event related systems only could beused when the relevant event occurs. The system that brings out advice when one wakes up,cannot be used properly, for example, if about 2 hours before waking up, a small dose insulinis injected due to a high BG.
This, and other practical reasons, for example the absence of the computer (system),contributed to a relatively small test set (9 cases in one month). In these tests, a comparisonbetween the author's own control action, and the advice of the system, is made. The author'sand the system's results (almost!) completely resembled. For all clarity, the system is ought towork properly if, for (about) every situation, it resembles the control advices that the authorwould have given in the same situation.
Though, there aren't much experiments needed to conclude that the system worksproperly, because it is totally based on the author's knowledge. The author is seen as expertwith the full knowledge of his way of controlling his DM-system. For some situations theauthor is rather sure about the desired control action. These cases are literally implemented inthe system and the advices cannot even theoretically differ from the author's control actions.Some small difference in the outcome can be explained by
• different interpolation between known situations, and• small nuance differences in the situation.
If the situation is somewhere in between other known situations, the author isn't able toperform an appropriate interpolation between the corresponding control actions. The FuzzyLogic, eventual non-linear interpolation between two states is more confidential. On the otherhand, the author is somewhat in advantage, because of the perception of small nuancedifferences in the situation what for no corresponding input variable exists. But, if the nuanceis that influential, an input variable should be added to the model.
The system is fully transparent with regard to the way of reasoning and the contents of therule blocks. The controllers structure corresponds to the patients reasoning, so if the model iscorrectly built, no dramatically mistake can be made in it's advices. Moreover, doctors canadd or remove factors of influence at own insight, or change the rule block's contents. So, thedoctor can construct a patient specific model that corresponds exactly with how he wants thepatient to behave. If doctors are assumed to give safe advices, the Fuzzy Logic system that isconstructed or validated by a doctor, are also safe.
The final conclusion with regard to the safety for the patients c.q. users is the following. Adoctor is ought to be able to construct a Fuzzy Logic controller. Fuzzy Logic patientspecific controllers that are constructed or validated by a doctor are safe.
99
12 Final conclusions
This master thesis in computer science aims at controlling insulin-dependent diabetes mellitus(IDDM). Controlling diabetes can be done in two directions:
1. model based, and2. non-model based.
In the first case (1) the diabetes mellitus (DM-)system is modelled and appropriate controlactions are derived out of this models. This approach is preferable to the latter because of itsintuitive clearness, its physiological foundation and other reasons mentioned in section 3.1. Insection 3.2 the author defmed some factors of influence on the blood glucose (BG) level thathave to be incorporated in a model, as measure to evaluate the appropriateness of the modelscurrently available and described in literature.
A big problem in this area is the paucity of useful data. (So, the time course of a lot ofBG, food, exercise and other relevant factors were kept up to date by the author (a diabetichimself) because it could eventually be of use.) Data merely about the course of BG waspublished yet when the author completed this thesis; indicating the premature progress in thisbranch of science. In section 3.3.6 coupling of a simple metabolic model (dynamical model)with a model of the action profile of subcutaneous injected insulin is proposed. Later on in theinvestigation of literature it appeared that research on this kind of models is far too premature
to be useful for glycemic predictions or control actions. The predictive accuracies are verybad, even in the subjects that are the easiest to predict. Because of this and the limited time forthis research, the other direction in this research is investigated.
In the second case (2) the DM-system considered more or less as a black box and is tried toconstruct a model of a feedback controller with the help of a human expert. Very littleresearch is done in this direction.
Diabetics who are starting with self-regulation get minimal advices from the hospitaland have to elaborate them eventually, with the help of a medical doctor, according to theirlifestyle. Diabetics are ought to take their own decisions with regard to the determination andadaptation of the insulin dose for every injection.
This research showed that this way of reasoning about the correct control action could bemodelled with Fuzzy Logic theory. The patient-specific implementation is lifestyle-
dependent. A more extended lifestyle — offering the patient more choices in his life,maintaining the same control goals — requires a more complex model. The control actions thathave to be taken according to the information of a hospital are implemented in Fuzzy Tech.Also the refined structure of a system (divided in three subsystems), which represents theauthor's reasoning at breakfast, is implemented (in two of the three cases). It appeared thatmore control actions than merely the insulin dose could be implemented. Examples are:postponement of meal and the amount of carbohydrates to consume. After the development ofthe breakfast controller it seems plausible that it is possible to develop an all-embracingcontroller that can be used during the whole day.
The author proposed an automated insulin dose correction mechanism that takes the non-stationary behaviour of the DM-system with regard to the relative need for insulin intoaccount.
100
In chapter 7 the structure of the control system is derived out of the characteristics of theDM-system.
The author stated that the determination of the structure of the controller is a complextask; on the other hand, the FL-implementation is quite straightforward.
Although no other controllers using Fuzzy Logic theoiy are discovered in literature, it is theauthor's opinion that user-specific Fuzzy Logic IDDM controllers are a useful advicemechanism due to the following reasons.
It could provide more insight in and support for the determination of adequate controlactions to patients who are starting with self-regulation and to less capable patients.The communication between a doctor and a patient can be improved by a clearunambiguous way of communicating.
Moreover the implemented systems provide an (eventually non-linear) interpolation betweenknown states, probably better than patients can.
About the safety of the controllers the following is concluded. A doctor is ought to be able toconstruct a Fuzzy Logic controller. Fuzzy Logic patient specific controllers that areconstructed or validated by a doctor are considered to be safe or as safe as possible.
101
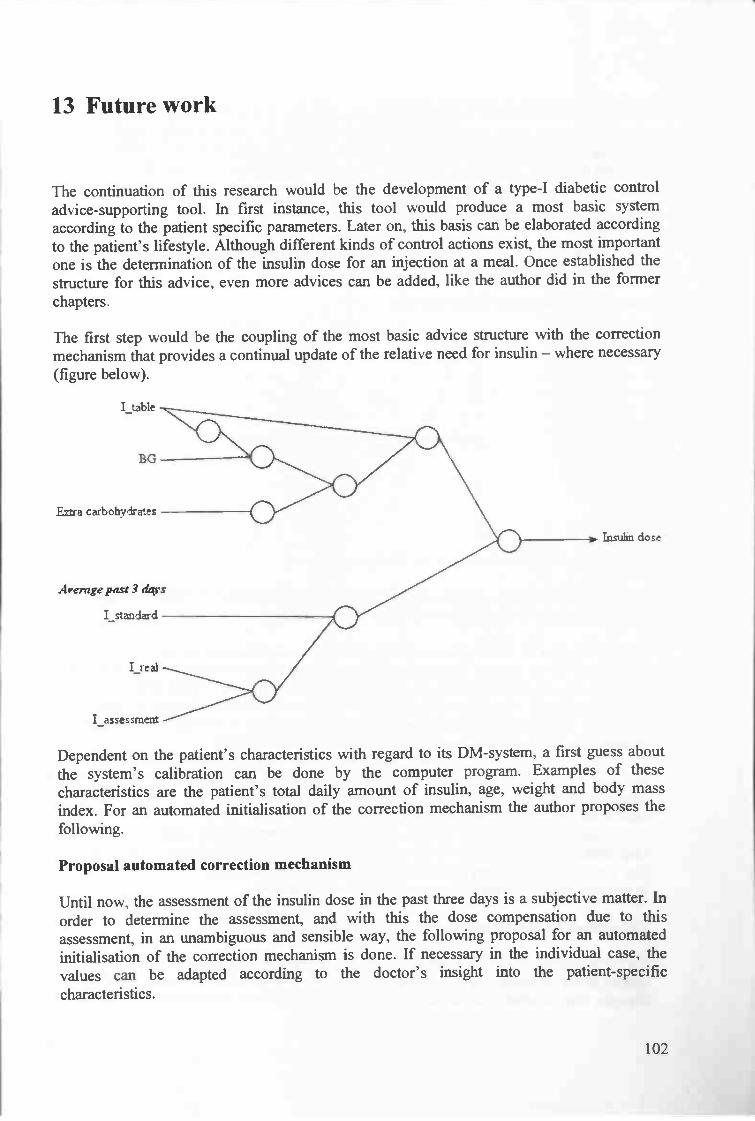
13 Future work
The continuation of this research would be the development of a type-I diabetic controladvice-supporting tool. In first instance, this tool would produce a most basic systemaccording to the patient specific parameters. Later on, this basis can be elaborated accordingto the patient's lifestyle. Although different kinds of control actions exist, the most importantone is the determination of the insulin dose for an injection at a meal. Once established thestructure for this advice, even more advices can be added, like the author did in the formerchapters.
The first step would be the coupling of the most basic advice structure with the correctionmechanism that provides a continual update of the relative need for insulin — where necessary
(figure below).
E.xa carbohydrates
Avemgepast 3 dqvs
Insubn dose
Dependent on the patient's characteristics with regard to its DM-system, a first guess aboutthe system's calibration can be done by the computer program. Examples of thesecharacteristics are the patient's total daily amount of insulin, age, weight and body massindex. For an automated initialisation of the correction mechanism the author proposes the
following.
Proposal automated correction mechanism
Until now, the assessment of the insulin dose in the past three days is a subjective matter. Inorder to determine the assessment, and with this the dose compensation due to thisassessment, in an unambiguous and sensible way, the following proposal for an automatedinitialisation of the correction mechanism is done. If necessary in the individual case, thevalues can be adapted according to the doctor's insight into the patient-specificcharacteristics.
102
I_table
BG
I standard
I_assessment

For example, take one (or two) BG measurement(s), for example (1 and) 2 (or more) hoursafter the injection. This value(s) can be compared with the corresponding target BG levelaccording to the following formula. It is derived of the M-value that was proposed by [24],discussed earlier in the chapter about the testing of the systems. The use of the formula is
explained after showing the graph.
3
ln(f(x, s) := —10
S), wherex is a BG value and s is the aimed value.
ln(1O)
Belowf(x, 4.4) andf(x, 10.0) are plotted.
Withy =f(x, 4.4), in rea andy = f(x, 10.0), in blue.
One could argue thatf(x, s) is the relative deviation of x in comparison with the target value s.This is an intuitive feeling; further research can be done here.
The initialisation of the insulin correction mechanism can be computed as follows. Let A bethe average of the relative deviations on (for example) three successive days. Suppose thetotal daily amount of insulin to be D. The idea is that the maximum insulin adaptation upwardis between 2% and 5% of D, and the maximum insulin adaptation downward between 5% and10% of D. The maximum percentage depends on the amount of the injection that should bereduced. The greater this dose, the greater the maximum adaptation.
For example, if the dose that should be corrected is greater than 16 U (this value isalso used in such a way in the Martini Hospital's starting-self-regulation advices), then anadaptation upward is 5% of D, and an adaptation downward is 10% of D. If the dose issmaller than 8 U, the respective values can be 2% and 5%.
Maybe a value of A = 1.76 or greater, is an appropriate value for a maximumadaptation of the insulin dose. To give an impression, if the target value is s = 4.4, and 1.76 =f(xo, 4.4) = —f(xj, 4.4) then the lower and higher values x0 and Xj are XO = 1.21 and x1 = 16.0.
In this way, the correction is done in a sensible, structured way.
Elaboration according to the patient's lifestyle
For every patient, a basic structure is defined according to the patient-specific parameters. Theoutline of the structure is shown in the figure above. With the help of insight in the patient'slifestyle, this structure can be elaborated. The reasoning about occurrences that happen just
103

sometimes or often (in contrast to "always" or "never"), and exert influence on the controlaction that has to be taken, have to be included in the structure.
In the former chapters, the outline of the structure if physical exercise and futureactivity were included, is described. Probably the outline and interconnection of the internalstructure is the same for every diabetic, but the content of the rule blocks is expected to differmuch between different kinds of persons. This structure can be used.
It is the expectation that the main structure (presence/absence of physical activity andfuture activity in patient's lifestyle) is easy to generate by asking the patient a couple ofsimple questions. A medical doctor or a trained diabetes nurse can do further patient-specificimplementation.
104

14 Bibliography
[1] Source: DissertationAuthor: Lucia SantosoTitle: Technology in diabetes care
[2] Source: Academic Press, London, England, 1983.Author: Keith Godfrey.Title: Compartmental models and their application.
[3] Source: Bulletin of Mathematical Biophysics, 27: 21 - 37, 1965.
Author: E. Ackerman, J.W. Gatewood, L.C. Rosevear, and G.D. Molnar.
Title: Model studies of blood glucose regulation.[4] Source: American Journal of Physiology, 236: E667 - 677, 1979.
Author: R.N. Bergman, Y.Z. Ider, C.R. Bowden, and C. Cobelli.Title: Quantitative estimation of insulin sensitivity.
[5] Source: J. Math. Biol. (2000) 40: 136 - 168.
Author: Andrea De Gaetano, Ovide Arino.Title: Mathematical modelling of the intravenous glucose tolerance test.
[6] Source: Diabetes 29: 979 - 990, 1980.Author: G. Toffolo, R.N. Bergman, D.T. Finegood, C.R. Bowden, and C.
Cobelli.Title: Quantitative estimation of beta cell sensitivity to glucose in the intact
organism: a minimal model of insulin kinetics in the dog.[7] Source: Comput. Methods Programs Biomed. 23: 113 - 122, 1986.
Author: G. Pacini, and R.N. Bergman.Title: M1NMOD: a computer program to calculate insulin sensitivity and
pancreatic responsivity from the frequently sampled intravenousglucose tolerance test.
[8] Source: Diabetes 29: 979-990, 1980.Author: Toffolo, G., R. N. Bergman, D. 1. Finegood, C. R. Bowden, and C.
Cobelli.Title: Quantitative estimation of beta cell sensitivity to glucose in the intact
organism: a minimal model of insulin kinetics in the dog.[9] Source: Diabetes, 27: 1027 - 1042, 1978.
Author: J.R. Guyton, Foster RO, Soeldner JS, Tan MH, Kahn CB, Koncz L,Gleason RE.
Title: A model of glucose-insulin homeostasis in man that incorporates theheterogeneous fast pool theory of pancreatic insulin release.
[10] Source: Journal of Biomedical Engineering, 14: 235 - 242, 1992.
Author: E.D. Lehmann and T. Deutsch.Title: A physiological model of glucose-insulin interaction in type I diabetes
mellitus.[11] Source: Book.
Author: Dr. J.W.F. ElteTitle: Diabetes - Over diagnose, behandeling en veelvoorkomende
complicaties (1992, pages 15 - 19).
[12] Source: Medical Engineering and Physics, 16: 193 - 202, 1994.
Author: E.D. Lehmann, I. Hermanyi, and T. Deutsch.
105
Title: Retrospective validation of a physiological model of glucose insulininteraction in type I diabetes mellitus.
[13] Source: Computer Methods and Programs in Biomedicine 54 (1997)49 - 58.
Author: Ole K. Hejiesen, Steen Andreassen, Roman Hovorka, David A. Cavan.Title: DIAS - the diabetes advisory system: an outline of the system and the
evaluation results obtained so far.[14] Source: Computer Methods and Programs in Biomedicine 62 (2000) 249 - 257.
Author: Gianluca Nucci, Cluadio CobelliTitle: Models of subcutaneous insulin kinetics. A critical review.
[15] Source: Diabetes Care 12 (1989) 725 - 736.Author: M. Berger, D. Rodbard.Title: Computer simulation of plasma insulin and glucose dynamics after
subcutaneous insulin injection.[16] Source: Clinical pharmacology & therapeutics. Volume 58 (1995), number 4,
459 - 469.Author: Daniel C. Howey, MD, Ronald R. Bowsher, PhD, Rocco L. Brunelle,
MS, Howard M. Rowe, MS, Paula F. Santa, BS, Joyce Downing-Shelton, BSN, and James R. Woodworth, PhD Indianapolis, md.
Title: [Lys(B28), Pro(B29)]-human insulin: Effect of injection time onpostprandial glycemia
[17] Source: Diabetes Medicine, 19, 274 - 278 (2002).Author: T.A. HoltTitle: A chaotic model for tight diabetes control.
[181 Source: Computers and Biomedical Research 32, 132 - 144 (1999)Author: J.J. Liszka-HackzellTitle: Prediction of Blood Glucose Levels in Diabetic Patients Using a Hybrid
A! Technique.[19] Source: Computer Methods and Programs in Biomedicine 56(1998)193 - 204.
Author: E.D. Lehmann, T. Deutsch.Title: Compartmental models for glycaemic prediction and decision-support
in clinical diabetes care: promise and reality.[20] Source: EURODIABETA Technical Report to the EEC Advanced Informatics
in Medicine Exploratory Action, 15, EEC-AIM, Brussels, 1990.Author: S. Andreassen, R. Bauersachs, J. Benn, E. Carson, E. Gomez, R.
Hovorka, E. Lehmann, P. Nahgang, F. del Pozo, A. Roudsari, J.Schneider.
Title: Report on developed prototypes integrating KBS and othermethodologies for insulin therapy advisory systems.
[21] Source: Diab. Res. Clin. Pract. 14(1991)113 - 122.
Author: J. Hedbrant, J. Ludvigsson, K. Nordenskjold, Sarimner.Title: A computer model of diabetes physiology for education of physicians
and patients.[22] Source: Diabetes Care 4(1981)311 -318.
Author: J. Skyler, D. Skyler, D. Seigler, M.O. Sullivan.Title: Algorithms for adjustment of insulin dosage by patients who monitor
blood glucose.[23] Source: CRC Critical Review in Biomedical Engineering, 17 (1989), 1-24.
Author: ALBISSER, A.M.Title: Intelligent instrumentation in diabetic management.
[24] Source: Med Inform (Lond) 1996 Oct-Dec;21(4):297-316
106

Author: Albisser AM, Harris RI, Sakkal S, Parson ID, Chao Sc.Title: Diabetes intervention in the information age.
[25] Source: Journal of Medical Systems, Vol. 25, No. 2, 2001.Author: G. Gogou, N. Maglaveras, B.V. Ambrosiadou, D. Goulis, and C.
Pappas.Title: A Neural Network Approach in Diabetes Management by Insulin
Administration.[26] Source: Journal of Diabetes and its complications 15 (2001), 80 - 87.
Author: Davide Dazzi, Francesco Taddei, Alessandra Gavarini, Enzo Uggeri,Roberto Negro, Antonio Pezzarossa.
Title: The control of blood glucose in the critical diabetic patient. A neuro-fuzzy method.
[27] Source: Book.Author: H.L. Trentelman, A.A. Stoorvogel, and M. Hautus.Title: control Theory for Linear Systems. (2001, pages 3,4.)
[28] Source: The New England Journal of MedicineAuthor: The Diabetes Control and complications Trial Research Group (DCCT)Title: The effect of intensive treatment of diabetes on the development and
progression of long-term complications in insulin-dependent diabetesmellitus.
[w29] Source: Url: http://www.diabetes123.com/dictionary![w30] Source: Un: http://www.diabetes.org[w3 1] Source: Un: http://www.UMassMed.edu/diabeteshandbook!
Author: Ruth E. Lundstram, John P. Mordes, Aldo A. Rossini[w32] Source: Url: http://www.diabetes.calSection_Aboutltimeline.asp
Author: Canadian Diabetes Association.Title: The history of diabetes.
[w33] Source: Wieteke is een lekker ding!
107