Embed Size (px)
Citation preview
Master Thesis
Economic Study of Solar Thermal Plant based on Gas Turbines
Author:
Albert Cabané Fernández
Supervisor:
Jens Klingmann
LTH School of EngineeringMarch 2013
1
Economic Study of Solar Thermal Plant based on Gas Turbines
Albert Cabané Fernández
Department of Energy Sciences Faculty of Engineering LTH • Lund University • 2013
Department of Energy SciencesFaculty of Engineering LTH, Lund UniversityP.O. Box 118SE-221 00 LundSweden
2

Preface
I would like to express my gratitude towards Professor Jens Klingmann and Bengt Sunden, who have initially proposed the idea for this project and has directed me along the way. His experience and guidance are the most important factors contributing to the results presented here. I would also like to acknowledge invaluable the help and insight provided by some of the members of the Energy Sciences department at LTH, such as Majed Sammak and Björn Nyberg, who have helped whenever I needed.
I dedicate this work to my mum and my aunt, who have patiently supported me during these 5 years of studies and encouraging me to write and finish this thesis.
Finally, I would like to thank both universities involved in my exchange to give me the opportunity of staying these months in Lund, Sweden. It has been one of my best experiences in my life, undoubtedly.
Albert Cabané Fernández, March 2013
3
Table of contents1. Introduction.................................................................................................................................. 9
1.1. Framework...................................................................................................................................10
1.2. Objectives.................................................................................................................................... 11
2. Limitations and possible extensions............................................................................................12
3. CSP Technology............................................................................................................................ 13
3.1. Parabolic Trough Plant................................................................................................................ 13
3.2. Fresnel Plant................................................................................................................................ 14
3.3. Stirling Plant................................................................................................................................15
3.4. Central Receiver System............................................................................................................. 16
4. Possible location and scenarios...............................................................................................18
5. State of technology........................................................................................................................20
5.1. Brayton cycle...............................................................................................................................20
5.2. Solar Gas Turbines..................................................................................................................... 20
5.2.1. Hybrid Solar Plants................................................................................................................21
5.2.2. Solar Combined cycle............................................................................................................22
6. The use of fuel............................................................................................................................... 24
7. Solar Hybrid Gas Turbine Components.....................................................................................25
7.1. Heliostats and Solar Field............................................................................................................25
7.1.1. Solar Field Looses................................................................................................................. 26
7.2. Tower........................................................................................................................................... 28
7.3. Receiver.......................................................................................................................................29
7.4. Gas Turbine................................................................................................................................. 30
8. Hybrid Solar Combined cycle components................................................................................ 32
8.1. Heliostats and Solar Field............................................................................................................32
8.2. Tower........................................................................................................................................... 32
8.3. Receiver.......................................................................................................................................32
8.4. Steam Turbine..............................................................................................................................32
8.5. Heat Recovery Steam Generator (HRSG)................................................................................... 33
9. IPSE simulations...........................................................................................................................34
9.1. Hybrid Solar Brayton Cycle parameters......................................................................................34
9.2. Hybrid Solar Brayton cycle results..............................................................................................36
9.3. Hybrid Solar Regenerative Brayton cycle parameters................................................................ 37
4
9.4. Hybrid Solar Regenerative Brayton cycle results....................................................................... 38
9.5. Solar Combined cycle parameters............................................................................................... 38
9.6. Solar Combined cycle results...................................................................................................... 40
10. Economic Analysis...................................................................................................................... 41
10.1. Financial Incentives...................................................................................................................42
10.2. Hybrid Solar Brayton Cycle...................................................................................................... 43
10.2.1. Investment Costs................................................................................................................. 43
10.2.2. O&M Plant Costs................................................................................................................ 49
10.2.3. Fuel Cost..............................................................................................................................50
10.3. Solar Regenerative Brayton cycle............................................................................................. 51
10.3.1. Investment Costs................................................................................................................. 51
10.3.2. O&M Costs..........................................................................................................................55
10.3.3. Fuel Costs............................................................................................................................ 56
10.4. Solar Combined Cycle...............................................................................................................56
10.4.1. Investment costs.................................................................................................................. 56
10.4.2. O&M Costs..........................................................................................................................58
10.4.3. Fuel Costs............................................................................................................................ 59
11. Results..........................................................................................................................................60
11.1. Solar field...................................................................................................................................60
11.2. Tower......................................................................................................................................... 60
11.3. Receiver..................................................................................................................................... 60
11.4. Cycle performance comparison................................................................................................. 61
11.5. Optimization.............................................................................................................................. 62
11.6. Levelized Cost of Electricity..................................................................................................... 63
12. Conclusions................................................................................................................................. 65
References..........................................................................................................................................66
Images References............................................................................................................................ 68
Appendix 1. IPSE files......................................................................................................................70
Appendix 2. Excell files.................................................................................................................... 71
5
List of Images
Figure 1: Installed capacity in Spain as at 31 December, 2012............................................................9
Figure 2: Electricity demand in Spain at 1 December, 2012..............................................................10
Figure 3: Operating parabolic trough................................................................................................. 14
Figure 4: Operating parabolic trough plant........................................................................................ 14
Figure 5: Operating Fresnel Plant.......................................................................................................15
Figure 6: Stirling prototype dish for thermal application...................................................................15
Figure 7: Scheme of Solar Two power tower..................................................................................... 16
Figure 8: Spanish map of the direct normal insolation (left) and different locations of thermal solar
plants (right)....................................................................................................................................... 19
Figure 9: Scheme of Brayton cycle and its diagram T-s.....................................................................20
Figure 10: Diagram of Hybrid Solar Brayton cycle.......................................................................... 21
Figure 11: Diagram of Hybrid Solar Regenerative Brayton cycle.................................................... 22
Figure 12: Scheme of a Integrated Solar Combined Cycle................................................................ 23
Figure 13: Scheme of a Hybrid Solar Combined Cycle.................................................................... 23
Figure 14: Configuration of PS10 in Sevilla (left image) and configuration of Solar TWO in
California (right image) .....................................................................................................................25
Figure 15: Flux diagram with explicit looses..................................................................................... 26
Figure 16: From top to bottom and left to right: Blockage factor, Spillage factor, Atmospheric
attenuation factor, Cosine factor, Reflection factor, respectively.......................................................28
Figure 17: Decomposition diagram of REFOS receiver (left image) and REFOS receiver module
(right image)....................................................................................................................................... 29
Figure 18: SOLGATE solar receiver cluster...................................................................................... 30
Figure 19: Solar receiver concept by ASME...................................................................................... 32
Figure 20: Hybrid Solar Brayton cycle model in IPSE..................................................................... 34
Figure 21: Hybrid Solar Regenerative Brayton model in IPSE.........................................................37
Figure 22: Solar Combined cycle model in IPSE..............................................................................38
Figure 23 : Definition of the Levelized Electricity Costs...................................................................41
Figure 24: PS10 plant in Sevilla.........................................................................................................45
Figure 25: Summary of the initial investment for the Hybrid Solar Brayton Cycle..........................49
Figure 26: Summary of the initial investment for the Hybrid Solar Regenerative Brayton Cycle....55
Figure 27: Summary of the initial investment for Solar Combined cycle..........................................58
Figure 28: Levelized Cost of Energy Comparison by LAZARD......................................................64
6
List of Tables
Table 1: Comparison of different CSP technologies.......................................................................... 17
Table 2: Composition and Calorific Value of the elements that compose the natural gas..................24
Table 3: Annual heliostat field efficiency...........................................................................................26
Table 4: Technical Specifications of SGT-700................................................................................... 30
Table 5: Technical Specifications of SGT-400................................................................................... 31
Table 6: Technical Specifications of SST-060.................................................................................... 33
Table 7: Steam properties at design point...........................................................................................33
Table 8: Operational parameters of Hybrid Solar Brayton cycle....................................................... 35
Table 9: Operational results of Hybrid Solar Brayton cycle.............................................................. 36
Table 10: Operational parameters of Hybrid Solar Regenerative Brayton cycle...............................37
Table 11: Operational results of Hybrid Solar Regenerative Brayton cycle......................................38
Table 12: Operational parameters of Solar Combined cycle..............................................................39
Table 13: Operational results of Solar Combined cycle..................................................................... 40
Table 14: Production of 50000 units/year...........................................................................................44
Table 15: Summary of the investment costs for Hybrid Solar Brayton Cycle...................................48
Table 16: Summary of yearly operational and maintenance costs for Hybrid Solar Brayton Cycle.50
Table 17: Data of natural gas prices .................................................................................................. 50
Table 18: Summary of fuel costs for Hybrid Solar Brayton Cycle...................................................50
Table 19: Summary of the investment costs for the Hybrid Solar Regenerative Brayton Cycle......54
Table 20: Summary of yearly operational and maintenance costs for Hybrid Solar Regenerative
Brayton Cycle.....................................................................................................................................55
Table 21: Summary of fuel costs for Hybrid Solar Regenerative Brayton Cycle..............................56
Table 22: Summary of the investment costs for the Solar Combined Cycle.....................................57
Table 23: Summary of yearly operational and maintenance costs for Solar Combined Cycle.........58
Table 24. Summary of fuel costs for Solar Combined Cycle............................................................. 59
Table 25: Calculation of Solar Field in Hybrid Solar Brayton cycle..................................................60
Table 26: Comparison of results between different configurations....................................................61
Table 27: Comparison of results between different configurations optimizing the efficiency...........62
Table 28: Comparison of specific investment costs........................................................................... 63
Table 29: Levelized Cost of Electricity.............................................................................................. 63
7
Abbreviations
ASME American Society of Mechanical Engineerscrf Capital Recovery FactorCRS Central Receiver SystemCSP Concentration Solar PowerDLR German Aerospace CenterDNI Direct Normal IrradianceECOSTAR European Concentrated Solar Thermal Road-MappingENEGAS National Power Company and Gas in SpainGDP Gross Domestic ProductHT High TemperatureHRSG Heat Recovery Steam GeneratorHSCC Hybrid Solar Combined CycleHTF Heat Transfer FluidIEA International Energy AgencyIPSE Process Simulation EnvironmentISCC Integrated Solar Combined CycleLEC Levelized Cost of ElectricityLT Low TemperatureMT Medium TemperatureNREL National Renewable Energy LaboratoryO&M Operational and MaintenancePSA Solar Platform in AlmeriaREFOS Receiver for fossil-hybrid gas turbine systemsRPC Reticular Porous CeramicSANDIA Energy, Climate and Infrastructure SecuritySGT Siemens Gas TurbinesSM Stretched MembraneSOLGATE Solar Hybrid Gas Turbine Electric Power SystemSOLUGAS Solar Up-scale Gas Turbine SystemSST Siemens Steam TurbineTIT Turbine Inlet Temperature
8
1. Introduction
Since many years, electricity generation involves the transformation of some form of energy into electricity. For many years, fossil fuels have been used as primary energy but owing to its non renewability, other technologies have been developed. High levels of CO2 caused by burning fossil fuels produce a negative effect on the climate, increasing natural disasters. For this reason, it became completely necessary to find out other technologies more versatile and more tolerant with the environment generating low emissions of CO2. These technologies are called renewable. As their name suggests, this form of energy is inexhaustible. There are various types of renewable energies depending on what sort of energy source is used, such as hydro, solar photovoltaic, wind and many more. One of these energies is called solar thermal energy or also called Concentrated Solar Power (CSP). It is based on capture as much solar radiation as possible by a series of mirrors or lenses to heat a fluid. Then through a thermodynamic cycle, thermal energy is converted into electricity. This energy has been chosen as the topic of this thesis as the Sun is the most abundant natural resource, providing highly efficacious and reliable solutions and technologically equipped worldwide. Unlike other renewable technologies, CSP has an inherent capacity to store heat energy, producing electricity even when the sky is covered by clouds. Besides, it could be equipped with fuel supports to substitute the solar resource when the weather conditions are not optimal. All these factors give CSP the ability to provide reliable electricity.
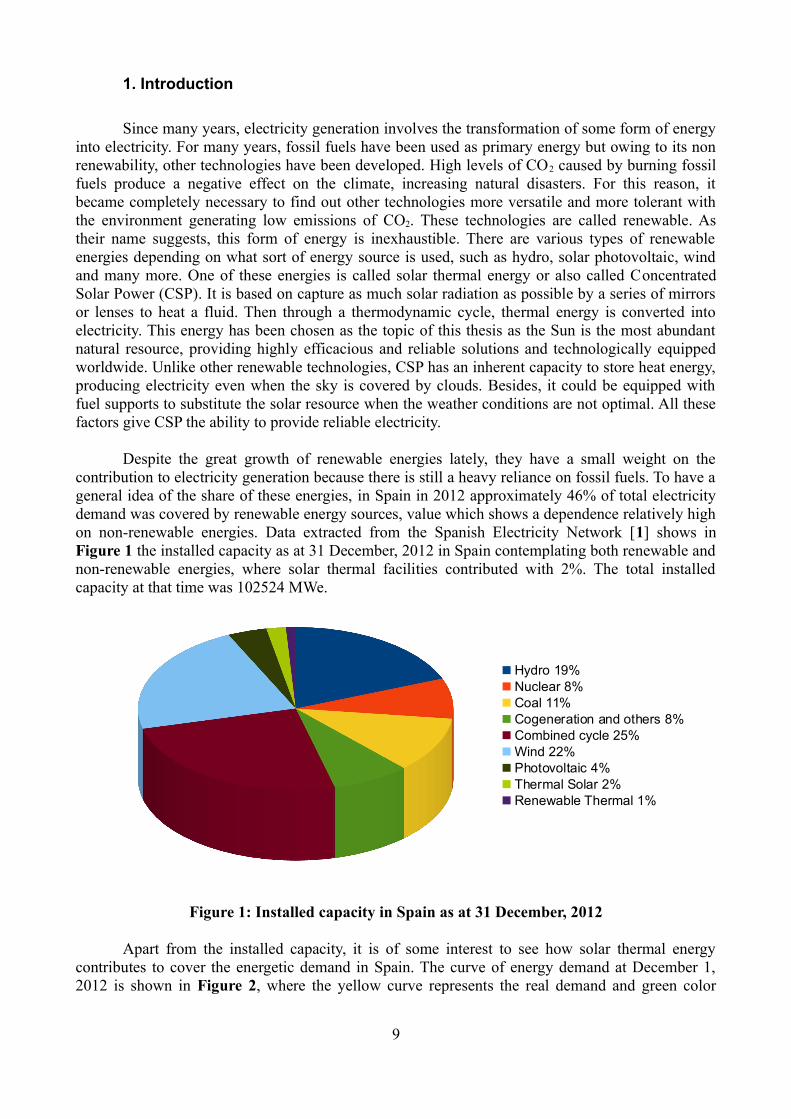
Despite the great growth of renewable energies lately, they have a small weight on the contribution to electricity generation because there is still a heavy reliance on fossil fuels. To have a general idea of the share of these energies, in Spain in 2012 approximately 46% of total electricity demand was covered by renewable energy sources, value which shows a dependence relatively high on non-renewable energies. Data extracted from the Spanish Electricity Network [1] shows in Figure 1 the installed capacity as at 31 December, 2012 in Spain contemplating both renewable and non-renewable energies, where solar thermal facilities contributed with 2%. The total installed capacity at that time was 102524 MWe.
Figure 1: Installed capacity in Spain as at 31 December, 2012
Apart from the installed capacity, it is of some interest to see how solar thermal energy contributes to cover the energetic demand in Spain. The curve of energy demand at December 1, 2012 is shown in Figure 2, where the yellow curve represents the real demand and green color
9
Hydro 19%Nuclear 8%Coal 11%Cogeneration and others 8%Combined cycle 25%Wind 22%Photovoltaic 4%Thermal Solar 2%Renewable Thermal 1%
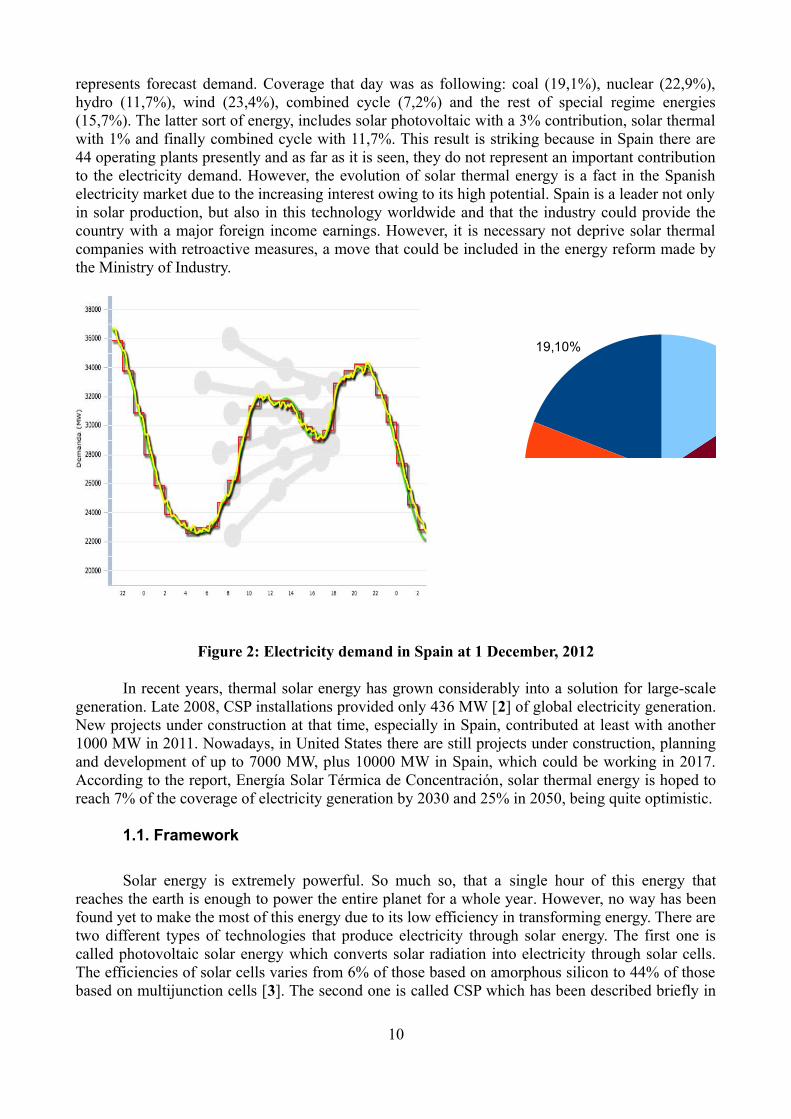
represents forecast demand. Coverage that day was as following: coal (19,1%), nuclear (22,9%), hydro (11,7%), wind (23,4%), combined cycle (7,2%) and the rest of special regime energies (15,7%). The latter sort of energy, includes solar photovoltaic with a 3% contribution, solar thermal with 1% and finally combined cycle with 11,7%. This result is striking because in Spain there are 44 operating plants presently and as far as it is seen, they do not represent an important contribution to the electricity demand. However, the evolution of solar thermal energy is a fact in the Spanish electricity market due to the increasing interest owing to its high potential. Spain is a leader not only in solar production, but also in this technology worldwide and that the industry could provide the country with a major foreign income earnings. However, it is necessary not deprive solar thermal companies with retroactive measures, a move that could be included in the energy reform made by the Ministry of Industry.
Figure 2: Electricity demand in Spain at 1 December, 2012
In recent years, thermal solar energy has grown considerably into a solution for large-scale generation. Late 2008, CSP installations provided only 436 MW [2] of global electricity generation. New projects under construction at that time, especially in Spain, contributed at least with another 1000 MW in 2011. Nowadays, in United States there are still projects under construction, planning and development of up to 7000 MW, plus 10000 MW in Spain, which could be working in 2017. According to the report, Energía Solar Térmica de Concentración, solar thermal energy is hoped to reach 7% of the coverage of electricity generation by 2030 and 25% in 2050, being quite optimistic.
1.1. Framework
Solar energy is extremely powerful. So much so, that a single hour of this energy that reaches the earth is enough to power the entire planet for a whole year. However, no way has been found yet to make the most of this energy due to its low efficiency in transforming energy. There are two different types of technologies that produce electricity through solar energy. The first one is called photovoltaic solar energy which converts solar radiation into electricity through solar cells. The efficiencies of solar cells varies from 6% of those based on amorphous silicon to 44% of those based on multijunction cells [3]. The second one is called CSP which has been described briefly in
10
19,10%
Section 1. This energy is a form of feasible concentration from a commercial viewpoint which allows a greater volume generation than photovoltaic power. Additionally, it can provide longer operating time because of the possibility to integrate it either with supplementary firing or heat storage. This energy is more advisable for those areas of the world with more hours of sunshine such as southern countries Europe, North Africa, South America or Australia.
The necessity of using renewable resources leads to show a special interest in the production of electricity through this type of energy. It is expected that CSP technology will continue to grow and the levelized electricity cost will become more competitive against fossil power plants. This thesis is focused on CSP, particularly on solar tower with hybrid gas turbines, an emerging technology. Although a fuel support is used, the pollution generated by this type of plant can not be compared with, for example, a conventional coal plant.
1.2. Objectives
The goal of this thesis is to carry out an economic analysis of solar thermal plant based on gas turbines. Throughout the project, there is a brief overview of different technologies used today in CSP without going into greater depth in most of them, but emphasizing solar tower technology with solar hybrid gas turbines. Having explained the reason why this technology has been chosen, possible configurations currently found in the solar panorama will be considered. Then, with the help of a thermodynamic software, called IPSE, all necessary data will be extracted for further economic evaluation. All configurations tested are hybrid using a fuel support based on Brayton cycle. Before carrying out the economic analysis, it will attempt to optimize the electrical efficiency and see how it affects to the levelized cost of electricity. Finally, all the configurations studied will be compared considering economic and energetic aspects. These are all the points which will be treated shortly:
1. Brief explanation of CSP technology2. Thermodynamic study of various CSP configurations using IPSE software
1. Solar Hybrid Brayton cycle2. Solar Hybrid Regenerative Brayton cycle3. Solar Combined cycle
3. Economic study of the different configurations4. Comparing the economic viability
11
2. Limitations and possible extensions
The title of this thesis is pretty generic. For this matter, it is completely necessary to see what is discussed throughout its elaboration and what is not. Regarding the thermodynamic study, it is based only on gas turbines as it is considered they have certain advantages over steam turbines in terms of solar energy, all of them discussed in this report. It is well proved that most CSP plants operate with so called steam cycle (Rankine) because of its compatibility with solar trough technology but it has decided to study gas turbines precisely because of their energetic potential and cost competitiveness.
The thermodynamic study, through which the necessary values are extracted for later comments, is made with IPSE. This program is really easy to use only by connecting component models with streams. It offers the possibility to calculate all the necessary properties at determined conditions. The simulations are intended to be as realistic as possible, so most of the parameters entered are contrasted values and none of them left to chance. Without going any further, all configurations studied use the same gas turbine to obtain values as real as possible.
The economic evaluation is carried out after simulating. Before proceeding with the economic aspects, all costs involved of such plants must be estimated. Nevertheless, they are not easy to find because most companies prefer to keep confidentiality to avoid direct competition. So as to estimate these costs, other plants with similar functionality are considered or simply they have been extracted from the literature.
A possible extension of this thesis would be the study of plant profitability taking into account the actual situation in the Spanish energy market. Moreover, a study of cost reduction could be carried out based on the minimization of the total costs.
12
3. CSP Technology
To start with, it is interesting to make a brief explanation of different CSP technologies available worldwide for electricity generation. As it has been said before, CSP concentrates Sun's radiation through the use of mirrors. Then, a fluid is heated to convert the thermal energy into electricity.
All energy systems attempt to obtain maximum efficiency with minimum losses. One of the highlights of this energy is tracking the position of the Sun throughout the day in order to collect as much radiation as possible. This is why the control system plays an important role. Thus, there could be differentiated two groups depending on whether the monitoring is done in one or two axis. CSP technologies which use one-axis tracking are:
• Parabolic Trough Plant • Fresnel Plant
These plants are characterized by concentrating solar radiation along a linear surface absorbing and transmitting energy to the working fluid. Its structure can rotate to track the position of the Sun thanks to an algorithm which contains exactly the position of it.
Those technologies which use two-axis tracking are:
• Stirling Plant• Central Receiver System
Unlike previous plants, two-axis tracking systems focus solar radiation in a single point. Today there is no a clear dominance over other although parabolic trough plants are the most developed currently.
3.1. Parabolic Trough Plant
This practice represents the most mature technology in terms of solar thermal energy as it has been used since the 80's. So much so, that currently these plants presents a power range from 10 to 300 MW [4].
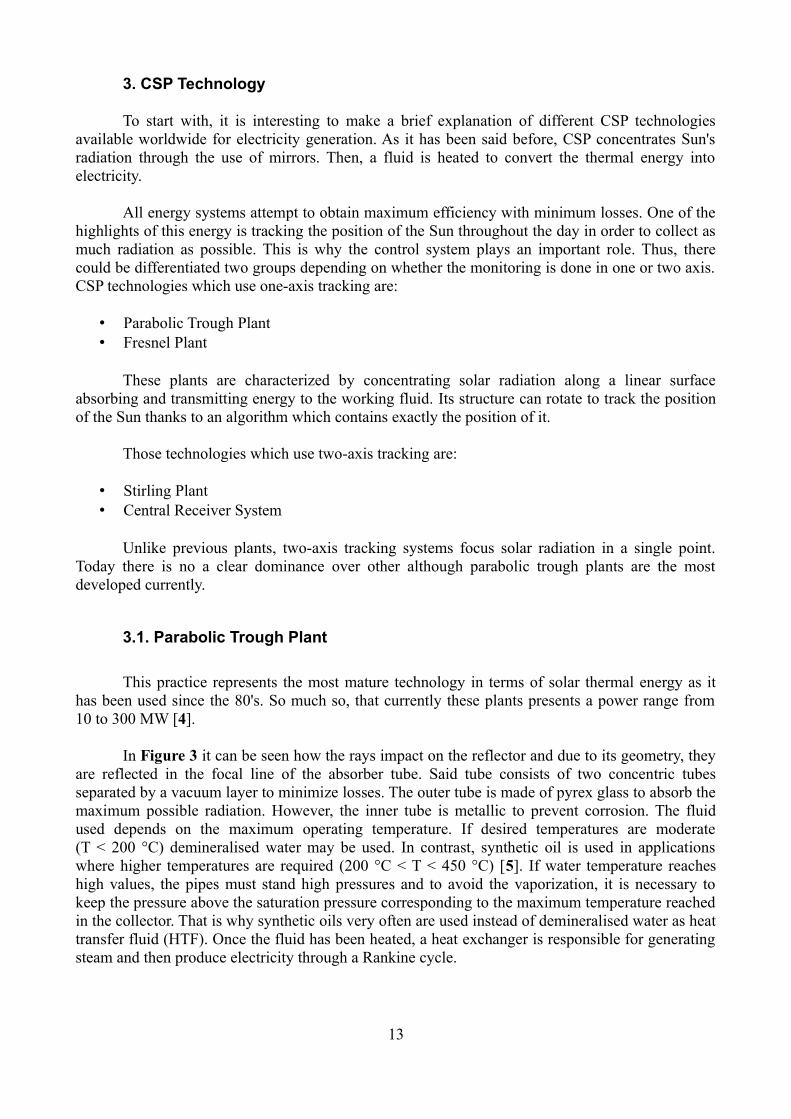
In Figure 3 it can be seen how the rays impact on the reflector and due to its geometry, they are reflected in the focal line of the absorber tube. Said tube consists of two concentric tubes separated by a vacuum layer to minimize losses. The outer tube is made of pyrex glass to absorb the maximum possible radiation. However, the inner tube is metallic to prevent corrosion. The fluid used depends on the maximum operating temperature. If desired temperatures are moderate (T < 200 °C) demineralised water may be used. In contrast, synthetic oil is used in applications where higher temperatures are required (200 °C < T < 450 °C) [5]. If water temperature reaches high values, the pipes must stand high pressures and to avoid the vaporization, it is necessary to keep the pressure above the saturation pressure corresponding to the maximum temperature reached in the collector. That is why synthetic oils very often are used instead of demineralised water as heat transfer fluid (HTF). Once the fluid has been heated, a heat exchanger is responsible for generating steam and then produce electricity through a Rankine cycle.
13
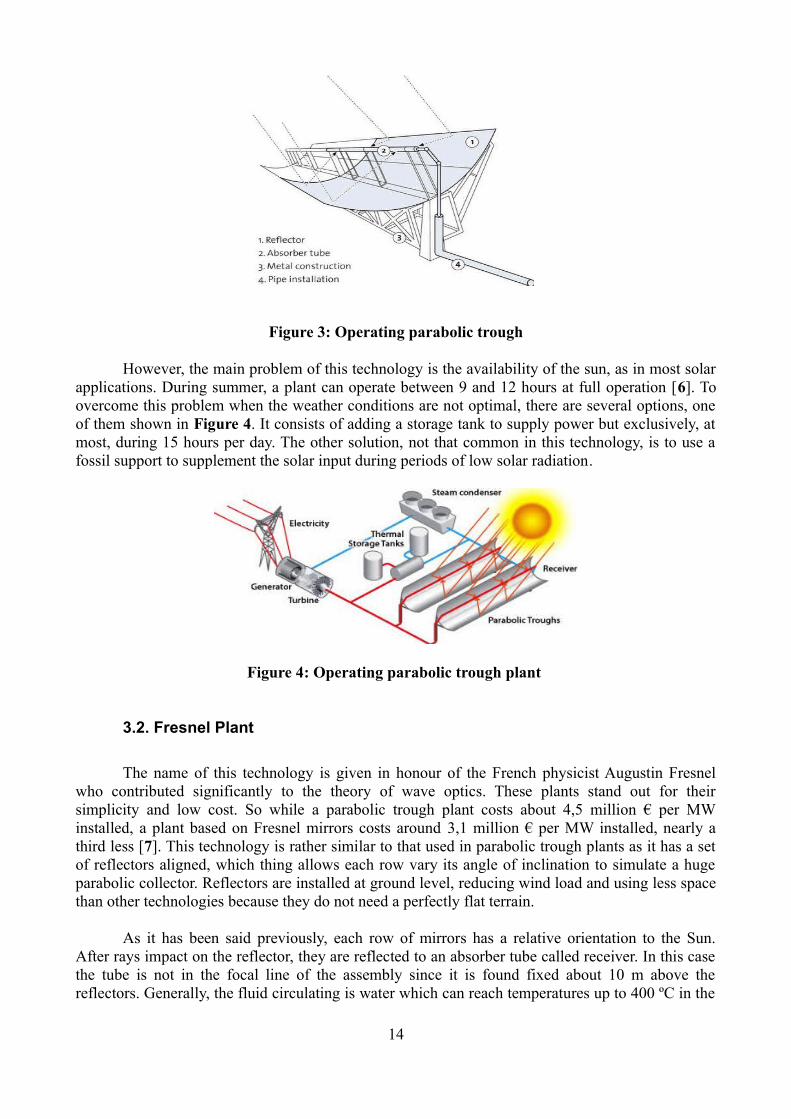
Figure 3: Operating parabolic trough
However, the main problem of this technology is the availability of the sun, as in most solar applications. During summer, a plant can operate between 9 and 12 hours at full operation [6]. To overcome this problem when the weather conditions are not optimal, there are several options, one of them shown in Figure 4. It consists of adding a storage tank to supply power but exclusively, at most, during 15 hours per day. The other solution, not that common in this technology, is to use a fossil support to supplement the solar input during periods of low solar radiation.
Figure 4: Operating parabolic trough plant
3.2. Fresnel Plant
The name of this technology is given in honour of the French physicist Augustin Fresnel who contributed significantly to the theory of wave optics. These plants stand out for their simplicity and low cost. So while a parabolic trough plant costs about 4,5 million € per MW installed, a plant based on Fresnel mirrors costs around 3,1 million € per MW installed, nearly a third less [7]. This technology is rather similar to that used in parabolic trough plants as it has a set of reflectors aligned, which thing allows each row vary its angle of inclination to simulate a huge parabolic collector. Reflectors are installed at ground level, reducing wind load and using less space than other technologies because they do not need a perfectly flat terrain.
As it has been said previously, each row of mirrors has a relative orientation to the Sun. After rays impact on the reflector, they are reflected to an absorber tube called receiver. In this case the tube is not in the focal line of the assembly since it is found fixed about 10 m above the reflectors. Generally, the fluid circulating is water which can reach temperatures up to 400 ºC in the
14
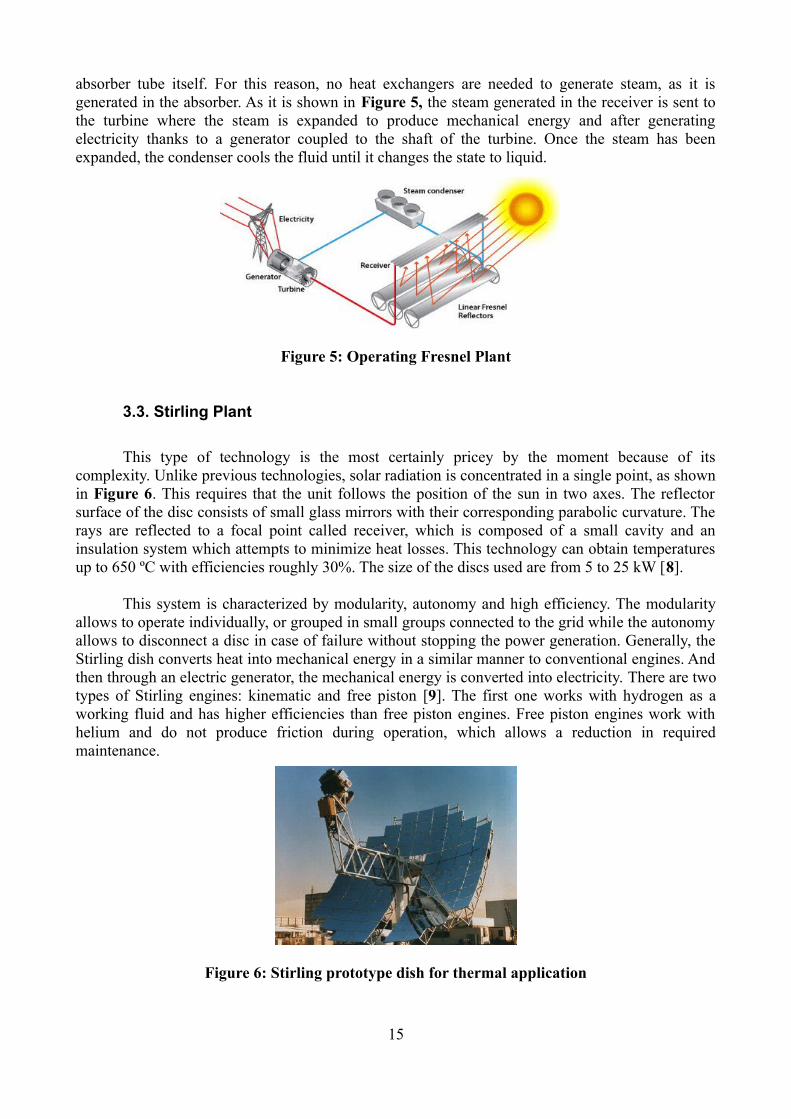
absorber tube itself. For this reason, no heat exchangers are needed to generate steam, as it is generated in the absorber. As it is shown in Figure 5, the steam generated in the receiver is sent to the turbine where the steam is expanded to produce mechanical energy and after generating electricity thanks to a generator coupled to the shaft of the turbine. Once the steam has been expanded, the condenser cools the fluid until it changes the state to liquid.
Figure 5: Operating Fresnel Plant
3.3. Stirling Plant
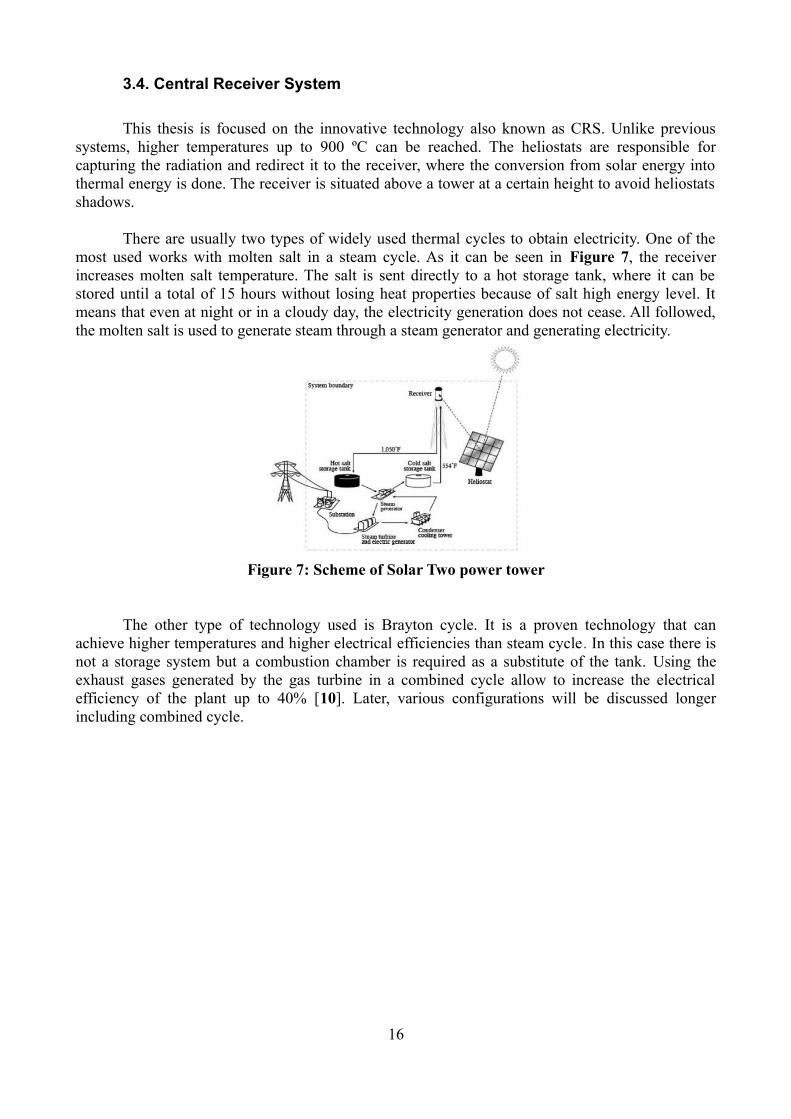
This type of technology is the most certainly pricey by the moment because of its complexity. Unlike previous technologies, solar radiation is concentrated in a single point, as shown in Figure 6. This requires that the unit follows the position of the sun in two axes. The reflector surface of the disc consists of small glass mirrors with their corresponding parabolic curvature. The rays are reflected to a focal point called receiver, which is composed of a small cavity and an insulation system which attempts to minimize heat losses. This technology can obtain temperatures up to 650 ºC with efficiencies roughly 30%. The size of the discs used are from 5 to 25 kW [8].
This system is characterized by modularity, autonomy and high efficiency. The modularity allows to operate individually, or grouped in small groups connected to the grid while the autonomy allows to disconnect a disc in case of failure without stopping the power generation. Generally, the Stirling dish converts heat into mechanical energy in a similar manner to conventional engines. And then through an electric generator, the mechanical energy is converted into electricity. There are two types of Stirling engines: kinematic and free piston [9]. The first one works with hydrogen as a working fluid and has higher efficiencies than free piston engines. Free piston engines work with helium and do not produce friction during operation, which allows a reduction in required maintenance.
Figure 6: Stirling prototype dish for thermal application
15
3.4. Central Receiver System
This thesis is focused on the innovative technology also known as CRS. Unlike previous systems, higher temperatures up to 900 ºC can be reached. The heliostats are responsible for capturing the radiation and redirect it to the receiver, where the conversion from solar energy into thermal energy is done. The receiver is situated above a tower at a certain height to avoid heliostats shadows.
There are usually two types of widely used thermal cycles to obtain electricity. One of the most used works with molten salt in a steam cycle. As it can be seen in Figure 7, the receiver increases molten salt temperature. The salt is sent directly to a hot storage tank, where it can be stored until a total of 15 hours without losing heat properties because of salt high energy level. It means that even at night or in a cloudy day, the electricity generation does not cease. All followed, the molten salt is used to generate steam through a steam generator and generating electricity.
Figure 7: Scheme of Solar Two power tower
The other type of technology used is Brayton cycle. It is a proven technology that can achieve higher temperatures and higher electrical efficiencies than steam cycle. In this case there is not a storage system but a combustion chamber is required as a substitute of the tank. Using the exhaust gases generated by the gas turbine in a combined cycle allow to increase the electrical efficiency of the plant up to 40% [10]. Later, various configurations will be discussed longer including combined cycle.
16
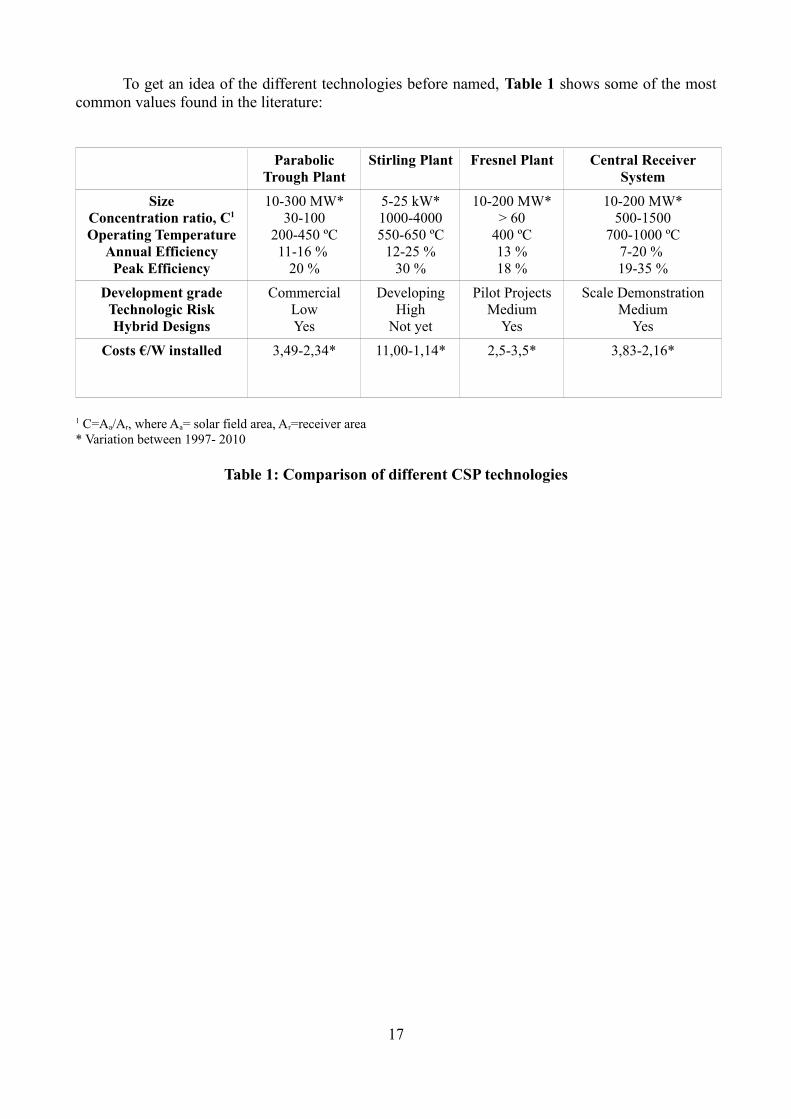
To get an idea of the different technologies before named, Table 1 shows some of the most common values found in the literature:
Parabolic Trough Plant
Stirling Plant Fresnel Plant Central Receiver System
SizeConcentration ratio, C1
Operating TemperatureAnnual Efficiency
Peak Efficiency
10-300 MW*30-100
200-450 ºC11-16 %
20 %
5-25 kW*1000-4000550-650 ºC
12-25 %30 %
10-200 MW*> 60
400 ºC13 %18 %
10-200 MW*500-1500
700-1000 ºC7-20 % 19-35 %
Development gradeTechnologic RiskHybrid Designs
CommercialLowYes
DevelopingHigh
Not yet
Pilot ProjectsMedium
Yes
Scale DemonstrationMedium
Yes
Costs €/W installed 3,49-2,34* 11,00-1,14* 2,5-3,5* 3,83-2,16*
1 C=Aa/Ar, where Aa= solar field area, Ar=receiver area* Variation between 1997- 2010
Table 1: Comparison of different CSP technologies
17
4. Possible location and scenarios
The objective of this thesis is not to define a specific location for the implementation of the plant but it is a point to consider seriously, as it is one of the most important factors. Before defining any point of the project, a study of the area must be done in order to locate the plant. As it has been said in Section 1.1., there is a large number of regions with an excellent solar resource but this study is based on the area of Spain, where there are 44 operating CSP plants.
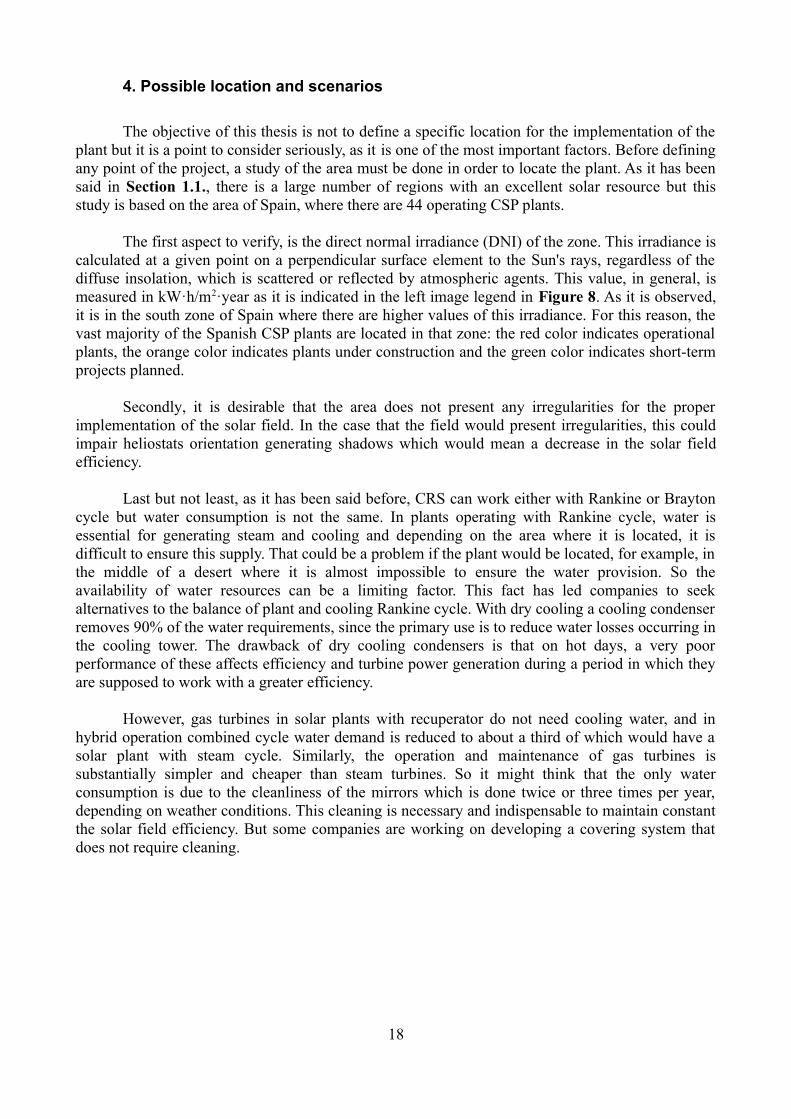
The first aspect to verify, is the direct normal irradiance (DNI) of the zone. This irradiance is calculated at a given point on a perpendicular surface element to the Sun's rays, regardless of the diffuse insolation, which is scattered or reflected by atmospheric agents. This value, in general, is measured in kW·h/m2·year as it is indicated in the left image legend in Figure 8. As it is observed, it is in the south zone of Spain where there are higher values of this irradiance. For this reason, the vast majority of the Spanish CSP plants are located in that zone: the red color indicates operational plants, the orange color indicates plants under construction and the green color indicates short-term projects planned.
Secondly, it is desirable that the area does not present any irregularities for the proper implementation of the solar field. In the case that the field would present irregularities, this could impair heliostats orientation generating shadows which would mean a decrease in the solar field efficiency.
Last but not least, as it has been said before, CRS can work either with Rankine or Brayton cycle but water consumption is not the same. In plants operating with Rankine cycle, water is essential for generating steam and cooling and depending on the area where it is located, it is difficult to ensure this supply. That could be a problem if the plant would be located, for example, in the middle of a desert where it is almost impossible to ensure the water provision. So the availability of water resources can be a limiting factor. This fact has led companies to seek alternatives to the balance of plant and cooling Rankine cycle. With dry cooling a cooling condenser removes 90% of the water requirements, since the primary use is to reduce water losses occurring in the cooling tower. The drawback of dry cooling condensers is that on hot days, a very poor performance of these affects efficiency and turbine power generation during a period in which they are supposed to work with a greater efficiency.
However, gas turbines in solar plants with recuperator do not need cooling water, and in hybrid operation combined cycle water demand is reduced to about a third of which would have a solar plant with steam cycle. Similarly, the operation and maintenance of gas turbines is substantially simpler and cheaper than steam turbines. So it might think that the only water consumption is due to the cleanliness of the mirrors which is done twice or three times per year, depending on weather conditions. This cleaning is necessary and indispensable to maintain constant the solar field efficiency. But some companies are working on developing a covering system that does not require cleaning.
18
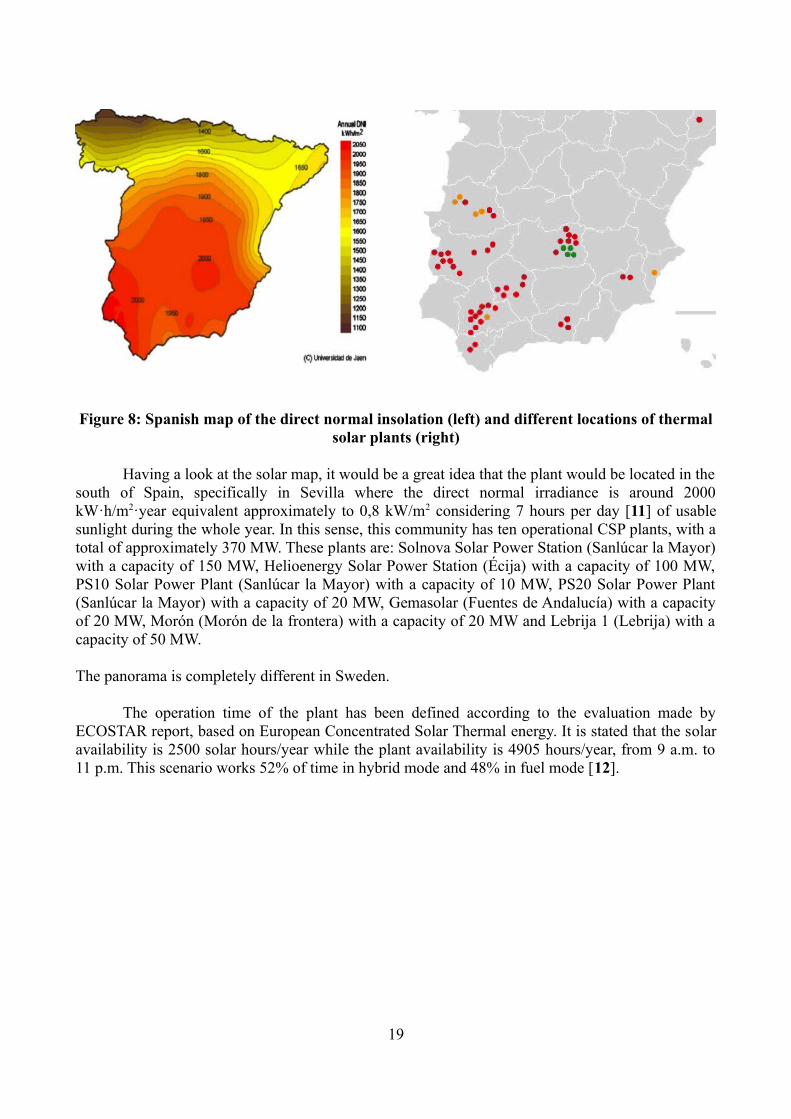
Figure 8: Spanish map of the direct normal insolation (left) and different locations of thermal solar plants (right)
Having a look at the solar map, it would be a great idea that the plant would be located in the south of Spain, specifically in Sevilla where the direct normal irradiance is around 2000 kW·h/m2·year equivalent approximately to 0,8 kW/m2 considering 7 hours per day [11] of usable sunlight during the whole year. In this sense, this community has ten operational CSP plants, with a total of approximately 370 MW. These plants are: Solnova Solar Power Station (Sanlúcar la Mayor) with a capacity of 150 MW, Helioenergy Solar Power Station (Écija) with a capacity of 100 MW, PS10 Solar Power Plant (Sanlúcar la Mayor) with a capacity of 10 MW, PS20 Solar Power Plant (Sanlúcar la Mayor) with a capacity of 20 MW, Gemasolar (Fuentes de Andalucía) with a capacity of 20 MW, Morón (Morón de la frontera) with a capacity of 20 MW and Lebrija 1 (Lebrija) with a capacity of 50 MW.
The panorama is completely different in Sweden.
The operation time of the plant has been defined according to the evaluation made by ECOSTAR report, based on European Concentrated Solar Thermal energy. It is stated that the solar availability is 2500 solar hours/year while the plant availability is 4905 hours/year, from 9 a.m. to 11 p.m. This scenario works 52% of time in hybrid mode and 48% in fuel mode [12].
19
5. State of technology
5.1. Brayton cycle
This cycle is formed mainly by three components: the compressor, the combustion chamber and the gas turbine. The procedure whereby electricity is generated is as follows: firstly, the compressor compresses air increasing its pressure and its temperature. Ideally, this process is considered isentropic but really there exist an increase in entropy which must be considered by the compressor isentropic efficiency (1→2'). Once the fluid has been compressed, the combustion chamber is responsible for increasing air temperature considerably igniting fuel. Ideally, this process is considered isobaric but actually the combustion chamber always has a small pressure loss (2'→3'). Then, the air reaches the gas turbine with a considerably high temperature. Thanks to its temperature and its velocity, the air is able to move the blades generating mechanical energy. As in the compressor, an increase in the entropy is considered (3'→4').
The turbine is coupled with the compressor in order not to use energy from the grid to compress the air. Generally, the compressor consumes the third part of the energy generated by the turbine. Finally, the mechanical energy is converted into electricity through a generator. The gases of the turbine are expelled to atmosphere, in most of the cases.
Figure 9: Scheme of Brayton cycle and its diagram T-s
5.2. Solar Gas Turbines
In terms of solar thermal energy, the two most widely used thermodynamic cycles for power generation are Brayton and Rankine cycle. In the development of this thesis it is decided to choose Brayton cycle as it presents several advantages over Rankine cycle. First of all because gas turbines do not require constant supply of water, unlike steam cycles. Water supply may cause limitations when thinking about the location of solar steam turbines. The solar source is essential for the operation of such plants but water availability becomes a criterion also essential. Moreover, due to the low heat capacity of the air, it may be heated up to 900 °C easily, temperatures which can not be achieved with steam cycles. On the other hand, due to the high temperature at which exhaust gases are expelled from the gas turbine, this waste heat can be used either in a combined cycle or include
20
a regenerative heat exchanger, which thing would significantly increase the electrical efficiency of the plant. But one of the major advantages of Brayton is that it can operate efficiently on small-scale plants with economies of scale of 15 MW [13].
However, it is difficult to obtain operating conditions in gas turbines only with solar source. Steam cycles operate at temperatures that are several hundred degrees below, which is a big difference in technical terms. When high temperatures are needed, the use of resistant materials is essential, in the same way that innovative techniques are indispensable to obtain these temperatures. For these reasons, a hybrid system is needed to supplement the shortages that the solar energy presents to achieve high electrical efficiencies.
5.2.1. Hybrid Solar Plants
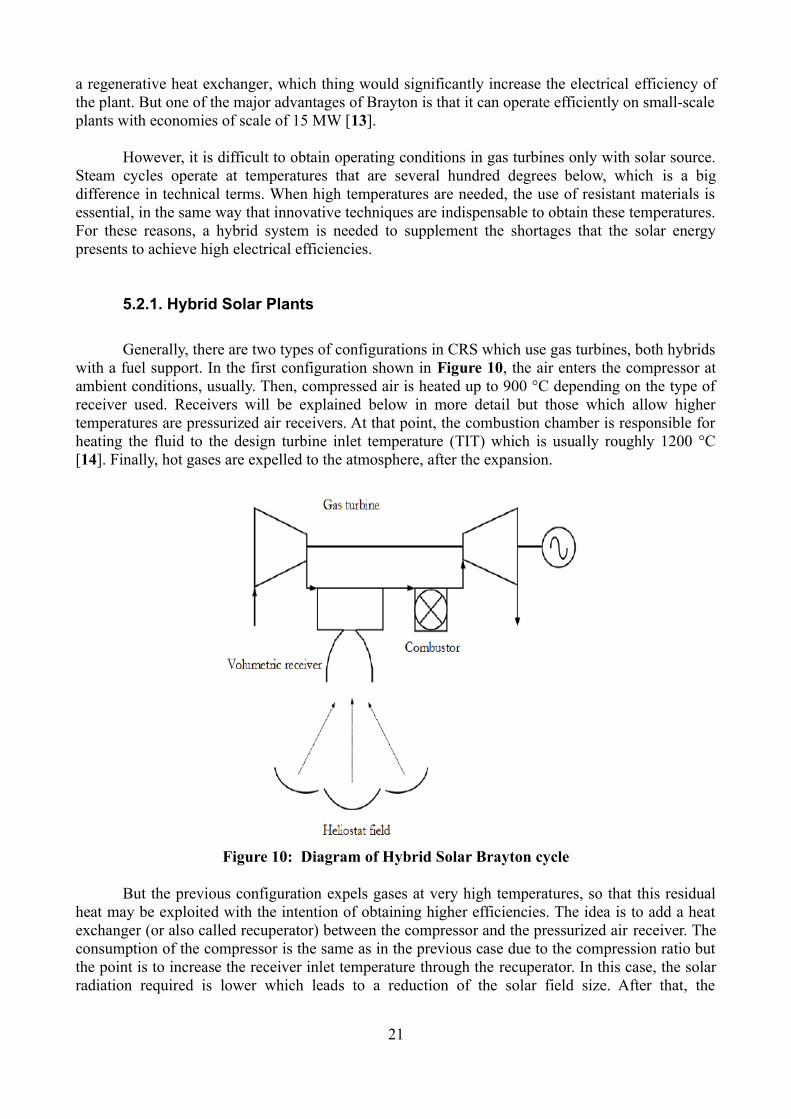
Generally, there are two types of configurations in CRS which use gas turbines, both hybrids with a fuel support. In the first configuration shown in Figure 10, the air enters the compressor at ambient conditions, usually. Then, compressed air is heated up to 900 °C depending on the type of receiver used. Receivers will be explained below in more detail but those which allow higher temperatures are pressurized air receivers. At that point, the combustion chamber is responsible for heating the fluid to the design turbine inlet temperature (TIT) which is usually roughly 1200 °C [14]. Finally, hot gases are expelled to the atmosphere, after the expansion.
Figure 10: Diagram of Hybrid Solar Brayton cycle
But the previous configuration expels gases at very high temperatures, so that this residual heat may be exploited with the intention of obtaining higher efficiencies. The idea is to add a heat exchanger (or also called recuperator) between the compressor and the pressurized air receiver. The consumption of the compressor is the same as in the previous case due to the compression ratio but the point is to increase the receiver inlet temperature through the recuperator. In this case, the solar radiation required is lower which leads to a reduction of the solar field size. After that, the
21
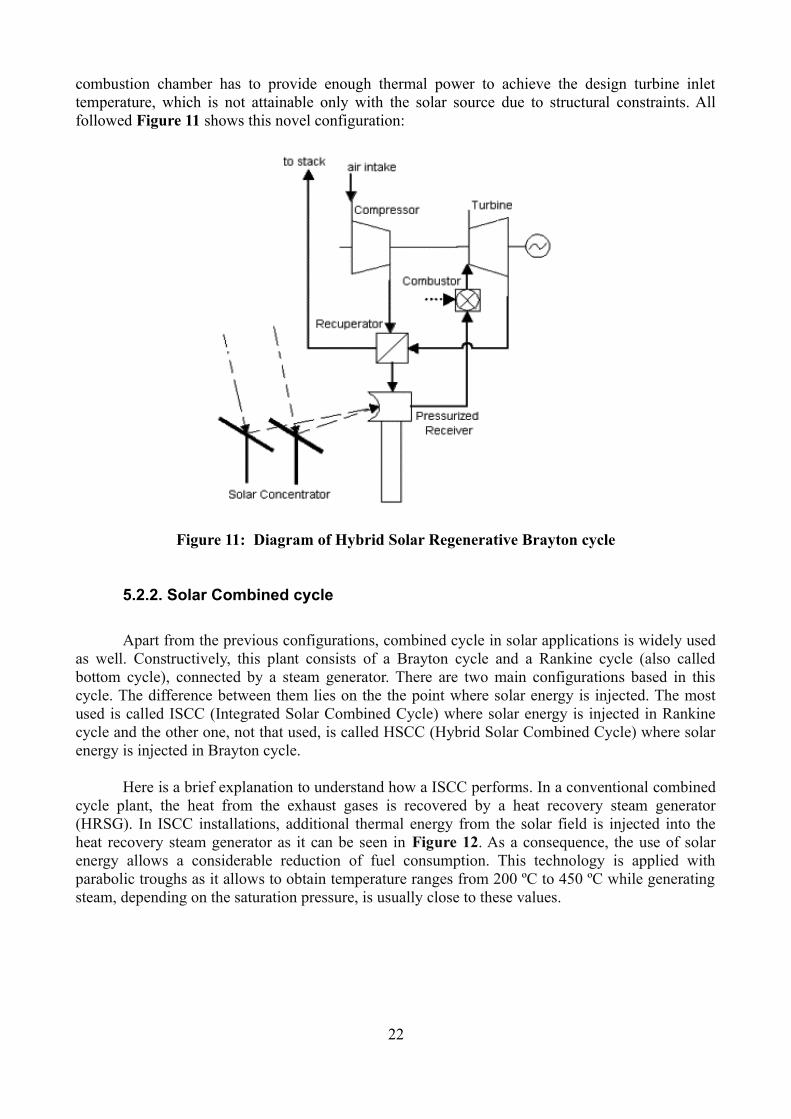
combustion chamber has to provide enough thermal power to achieve the design turbine inlet temperature, which is not attainable only with the solar source due to structural constraints. All followed Figure 11 shows this novel configuration:
Figure 11: Diagram of Hybrid Solar Regenerative Brayton cycle
5.2.2. Solar Combined cycle
Apart from the previous configurations, combined cycle in solar applications is widely used as well. Constructively, this plant consists of a Brayton cycle and a Rankine cycle (also called bottom cycle), connected by a steam generator. There are two main configurations based in this cycle. The difference between them lies on the the point where solar energy is injected. The most used is called ISCC (Integrated Solar Combined Cycle) where solar energy is injected in Rankine cycle and the other one, not that used, is called HSCC (Hybrid Solar Combined Cycle) where solar energy is injected in Brayton cycle.
Here is a brief explanation to understand how a ISCC performs. In a conventional combined cycle plant, the heat from the exhaust gases is recovered by a heat recovery steam generator (HRSG). In ISCC installations, additional thermal energy from the solar field is injected into the heat recovery steam generator as it can be seen in Figure 12. As a consequence, the use of solar energy allows a considerable reduction of fuel consumption. This technology is applied with parabolic troughs as it allows to obtain temperature ranges from 200 ºC to 450 ºC while generating steam, depending on the saturation pressure, is usually close to these values.
22
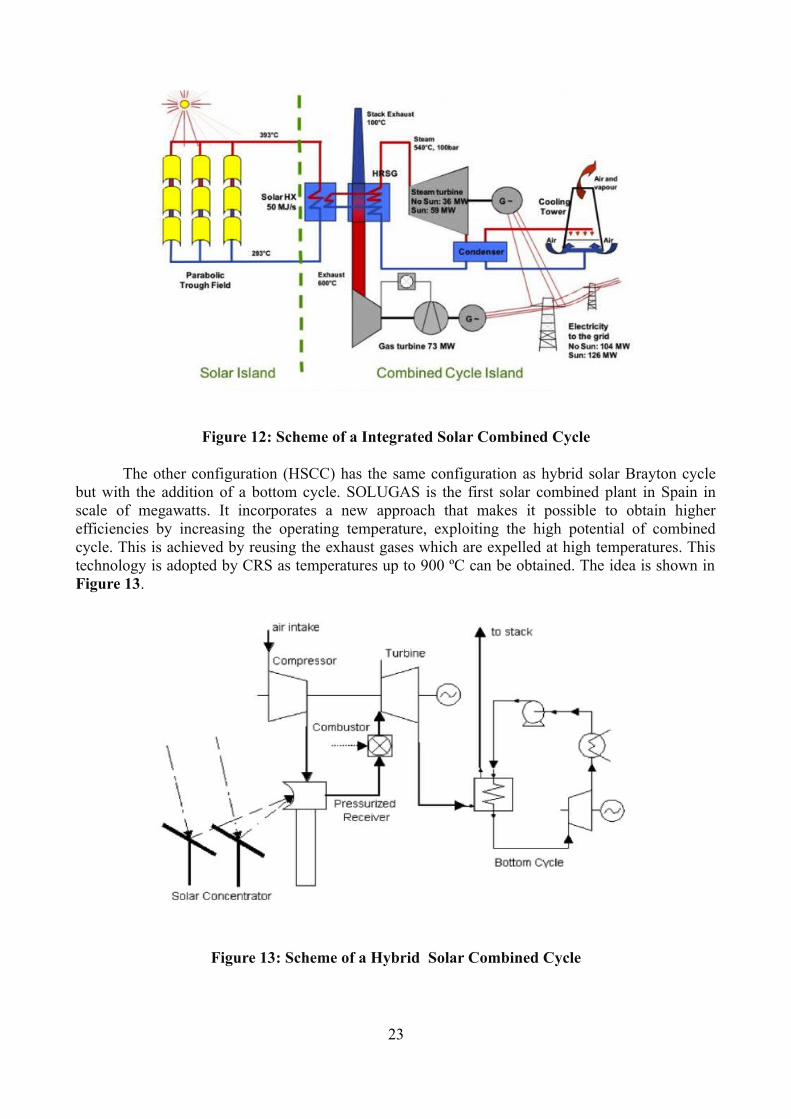
Figure 12: Scheme of a Integrated Solar Combined Cycle
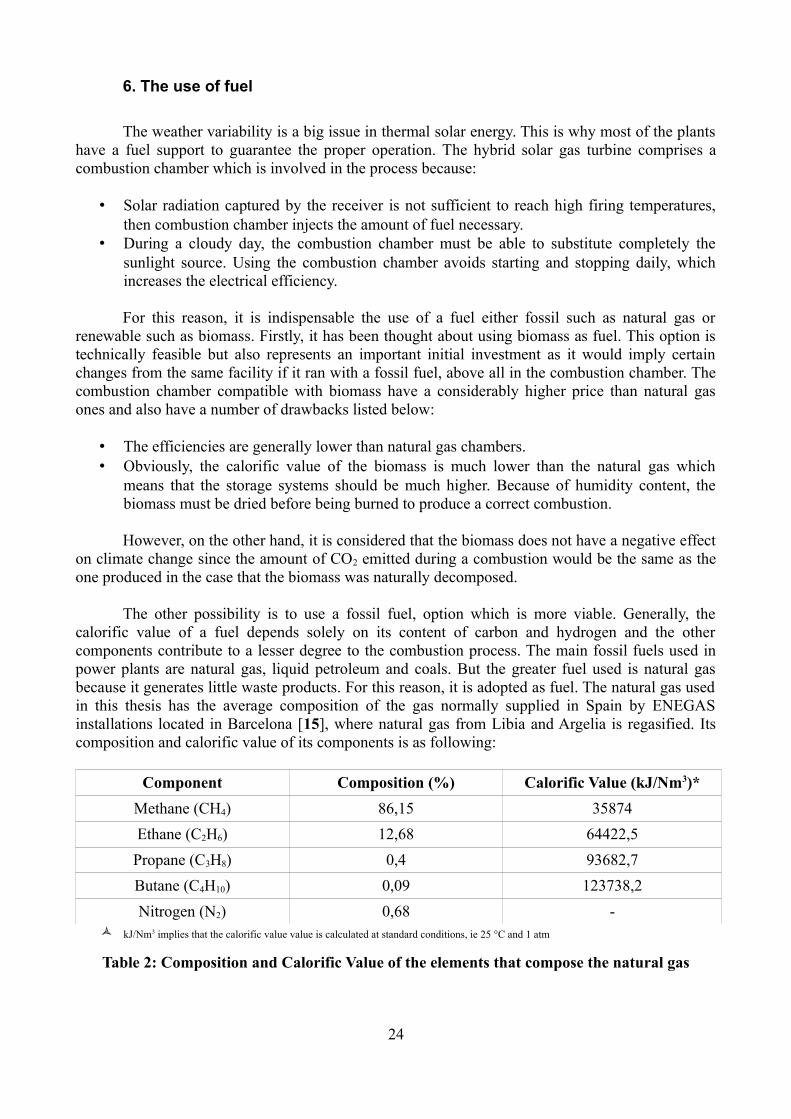
The other configuration (HSCC) has the same configuration as hybrid solar Brayton cycle but with the addition of a bottom cycle. SOLUGAS is the first solar combined plant in Spain in scale of megawatts. It incorporates a new approach that makes it possible to obtain higher efficiencies by increasing the operating temperature, exploiting the high potential of combined cycle. This is achieved by reusing the exhaust gases which are expelled at high temperatures. This technology is adopted by CRS as temperatures up to 900 ºC can be obtained. The idea is shown in Figure 13.
Figure 13: Scheme of a Hybrid Solar Combined Cycle
23
6. The use of fuel
The weather variability is a big issue in thermal solar energy. This is why most of the plants have a fuel support to guarantee the proper operation. The hybrid solar gas turbine comprises a combustion chamber which is involved in the process because:
• Solar radiation captured by the receiver is not sufficient to reach high firing temperatures, then combustion chamber injects the amount of fuel necessary.
• During a cloudy day, the combustion chamber must be able to substitute completely the sunlight source. Using the combustion chamber avoids starting and stopping daily, which increases the electrical efficiency.
For this reason, it is indispensable the use of a fuel either fossil such as natural gas or renewable such as biomass. Firstly, it has been thought about using biomass as fuel. This option is technically feasible but also represents an important initial investment as it would imply certain changes from the same facility if it ran with a fossil fuel, above all in the combustion chamber. The combustion chamber compatible with biomass have a considerably higher price than natural gas ones and also have a number of drawbacks listed below:
• The efficiencies are generally lower than natural gas chambers.• Obviously, the calorific value of the biomass is much lower than the natural gas which
means that the storage systems should be much higher. Because of humidity content, the biomass must be dried before being burned to produce a correct combustion.
However, on the other hand, it is considered that the biomass does not have a negative effect on climate change since the amount of CO2 emitted during a combustion would be the same as the one produced in the case that the biomass was naturally decomposed.
The other possibility is to use a fossil fuel, option which is more viable. Generally, the calorific value of a fuel depends solely on its content of carbon and hydrogen and the other components contribute to a lesser degree to the combustion process. The main fossil fuels used in power plants are natural gas, liquid petroleum and coals. But the greater fuel used is natural gas because it generates little waste products. For this reason, it is adopted as fuel. The natural gas used in this thesis has the average composition of the gas normally supplied in Spain by ENEGAS installations located in Barcelona [15], where natural gas from Libia and Argelia is regasified. Its composition and calorific value of its components is as following:
Component Composition (%) Calorific Value (kJ/Nm3)*
Methane (CH4) 86,15 35874
Ethane (C2H6) 12,68 64422,5
Propane (C3H8) 0,4 93682,7
Butane (C4H10) 0,09 123738,2
Nitrogen (N2) 0,68 - kJ/Nm3 implies that the calorific value value is calculated at standard conditions, ie 25 °C and 1 atm
Table 2: Composition and Calorific Value of the elements that compose the natural gas
24
7. Solar Hybrid Gas Turbine Components
Before starting with the thermodynamic study, it is indispensable to describe all components that form entirely the plant in the different configurations studied. Once the description is made, it may conduct the thermodynamic study trough IPSE software.
7.1. Heliostats and Solar Field
The heliostats are the main responsible for capturing sunlight together with the central receiver. Basically, they consist of a reflective surface, a support structure, movement mechanisms and a control system. The solar field is formed by a series of heliostats arranged to conveniently follow the position of the sun, focusing the sunlight on a small area.
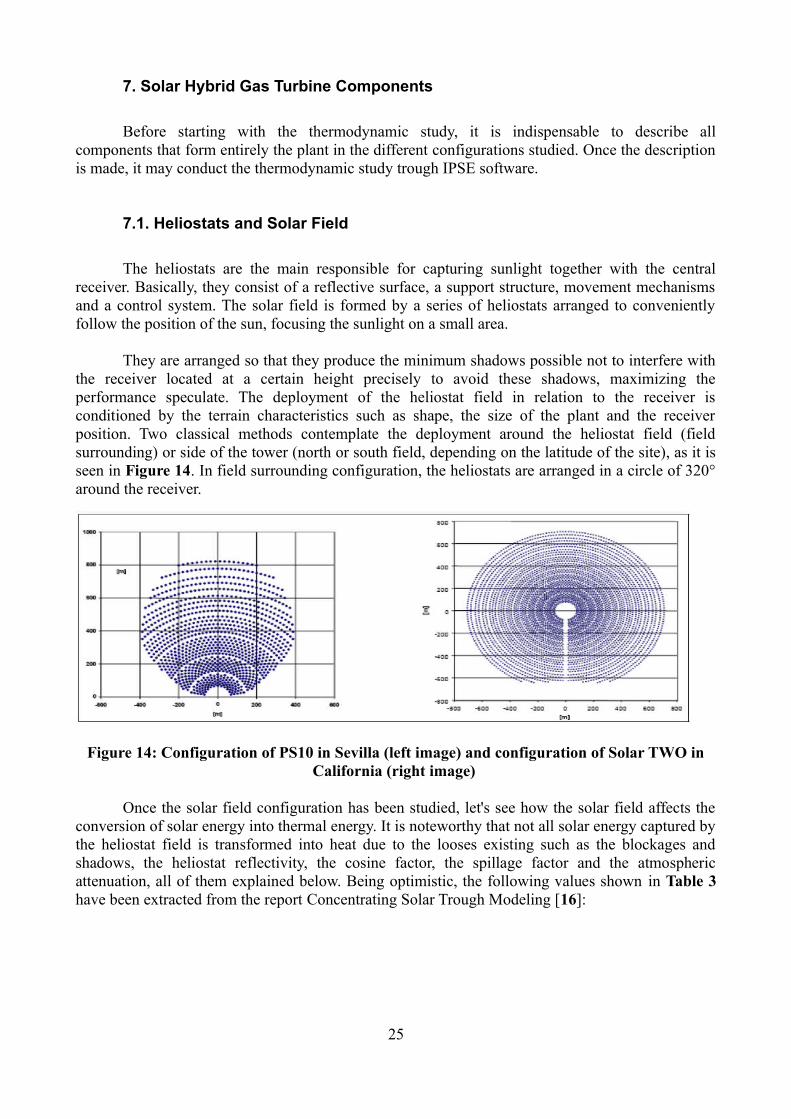
They are arranged so that they produce the minimum shadows possible not to interfere with the receiver located at a certain height precisely to avoid these shadows, maximizing the performance speculate. The deployment of the heliostat field in relation to the receiver is conditioned by the terrain characteristics such as shape, the size of the plant and the receiver position. Two classical methods contemplate the deployment around the heliostat field (field surrounding) or side of the tower (north or south field, depending on the latitude of the site), as it is seen in Figure 14. In field surrounding configuration, the heliostats are arranged in a circle of 320° around the receiver.
Figure 14: Configuration of PS10 in Sevilla (left image) and configuration of Solar TWO in California (right image)
Once the solar field configuration has been studied, let's see how the solar field affects the conversion of solar energy into thermal energy. It is noteworthy that not all solar energy captured by the heliostat field is transformed into heat due to the looses existing such as the blockages and shadows, the heliostat reflectivity, the cosine factor, the spillage factor and the atmospheric attenuation, all of them explained below. Being optimistic, the following values shown in Table 3 have been extracted from the report Concentrating Solar Trough Modeling [16]:
25
Solar Field Efficiencies
Blockages 99%
Shadows 99%
Heliostat Reflectivity 90%
Cosine Factor 80%
Spillage Factor 97%
Atmospheric attenuation 95%
Thermal Receiver Efficiency 90%
Annual Efficiency 59%
Table 3: Annual heliostat field efficiency
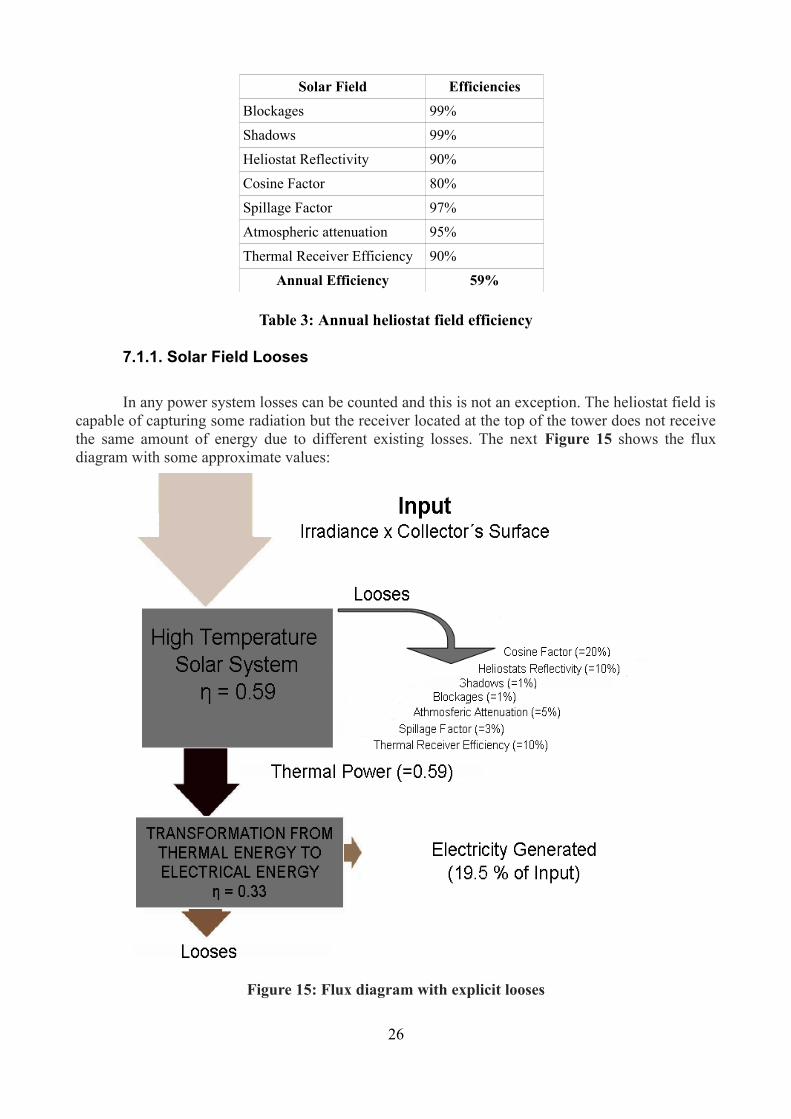
7.1.1. Solar Field Looses
In any power system losses can be counted and this is not an exception. The heliostat field is capable of capturing some radiation but the receiver located at the top of the tower does not receive the same amount of energy due to different existing losses. The next Figure 15 shows the flux diagram with some approximate values:
Figure 15: Flux diagram with explicit looses
26
First of all the solar field efficiency (ηfield) must be defined. It is calculated as the quotient between the power captured by the receiver (Qrec) and solar power (Qsol) captured by heliostats:
(7.1)
The only unknown term in this equation is the heliostats surface since Qrec is obtained through IPSE and the constant 0,8 kW/m2 has been defined in Section 4. ηfield is not easy to estimate as many factors affect the optical activity. The following formula explains how to estimate it and which are these factors affecting the overall performance of the solar field:
(7.2)
Where:ηblo is the blockage factorηspi is the spillage factorηatm is the atmospheric attenuation factorηcos is the cosine factorρref is the reflexivity of heliostats
Blockage factor:
It is caused, essentially, by the proximity of the heliostats. What actually happens with this phenomenon is a decrease in the effective surface of the collector. That is to say, the rays collide with the surface but due to the inclination of them and the proximity of each other, the reflected beam is unable to reach the tower where the receiver is located. This phenomenon can be spotted in the back of the heliostats due to reflected light.
Spillage factor:
Although heliostats attempt to capture the maximum possible radiation, part of this energy does not reach the receiver. To try to minimize these losses it is required a good monitoring of the Sun as well as a good heliostat orientation. Another way to try to reduce this phenomenon would be to increase the size of the receiver but the problem is obvious: the larger the receiver, the higher the investment and losses.
Atmospheric attenuation factor:
The locations where CRS plants are located are often areas previously studied where the meteorology is favorable. But the weather is variable and unpredictable. So in days when the sky is covered by clouds, the radiation absorbed by the receiver fluctuates due to the journey of the light beam. In this case, the height of the tower is a critical element due to the energy dissipation.
27
η field=Qrec
Qsol
=Qrec
0,8 kWm2
· heliostats surface (m2)
η field=ηblo · ηspi · ηatm · ηcos · ρref
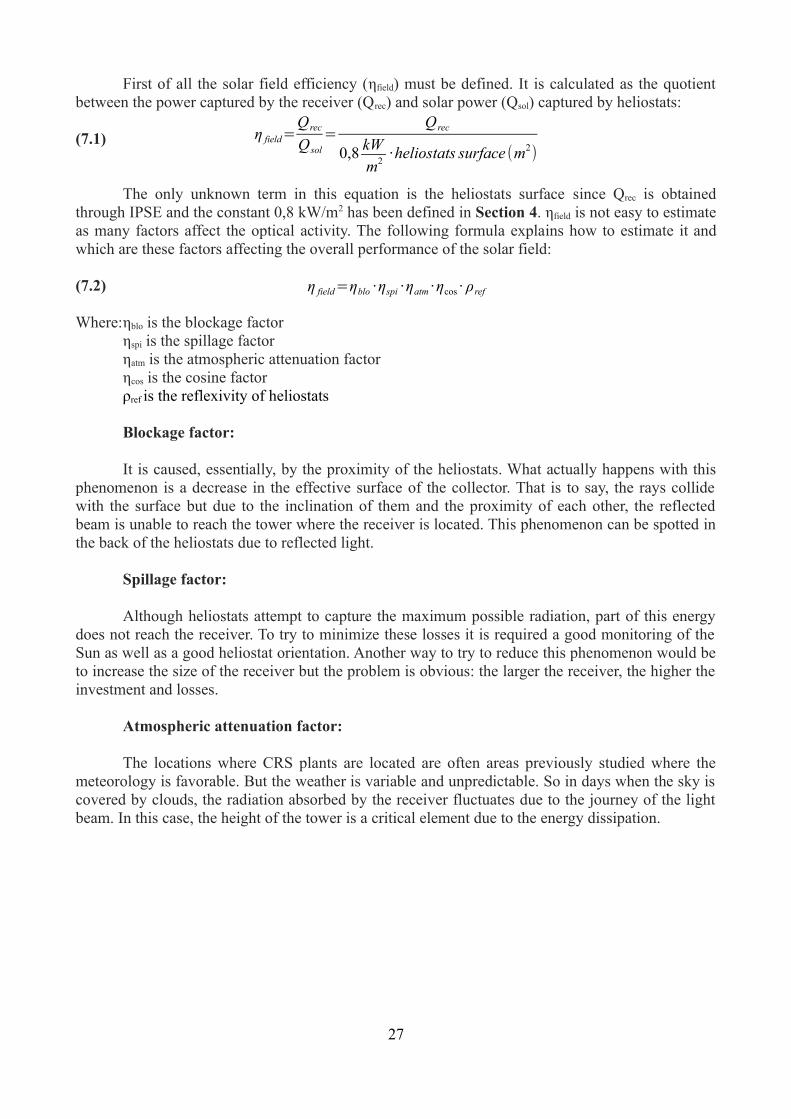
Cosine factor:
This factor varies depending on the direction of the Sun's rays with the orientation of the optical axis of the heliostat. Although the real surface of a heliostat is specific, due to the inclination at which the rays impinge upon it, the useful surface (ie the real surface projecting radiation to the receiver) is reduced. Clearly this factor depends on the angle α indicated in Figure 16.
Reflection factor:
When the rays impinge on a surface three phenomena occur: absorption, transmission and reflection. In the case of solar collectors, the only component that deserves special mention is the reflection. The higher the factor, the greater part of the solar energy is reflected to the receiver. Recently SENER and CASA (heliostats manufacturers) have been working with materials of high reflection factor obtaining values between 85% and 95% [17]. Generally, heliostats are formed by reflective mirrors with a thin layer of highly reflective aluminum, reducing the light beam absorbed and transmitted.
Figure 16: From top to bottom and left to right: Blockage factor, Spillage factor, Atmospheric attenuation factor, Cosine factor, Reflection factor, respectively
7.2. Tower
The function of the tower is to support the receiver. Although it is only a structural element, from it depends the uptake of radiation. This is why it is placed at a certain height in order to avoid the shadows cast by the blockages between different heliostats. Actually, for structural reasons, the receiver is located a few meters below the highest point of the tower.
28
7.3. Receiver
The receiver operation is very simple since it acts as a heat exchanger. The goal of the receiver is to convert the solar radiation into thermal energy to obtain as high temperatures as possible, ranging from 800 ºC to 1000 ºC with the lowest pressure drop possible. It is not that effortless to achieve such high temperatures. For this reason, volumetric receivers have been designed, which can be either pressurized or atmospheric. There exist a wide variety of solar receivers according to the type of working fluid used, the power required and other aspects to consider. But the development of pressurized air receivers is closely related to the use of hybrid plants, where solar energy reduces the fuel consumption.
SOLGATE, is one of the projects of PSA (Plataforma Solar de Almería) which started in 2002, with deep research to integrate the solar receiver in gas turbines, using pressurized volumetric receivers. The objective of hybridizing solar plants is to reduce costs up to 30% compared to pure solar platforms. After first attempts in June 2003, 960 ºC were achieved with a thermal efficiency of 68-79%. In 2004 some changes were made in the receiver so as to achieve higher temperatures such as 1030 ºC [18].
The REFOS air receiver was developed at DLR Stuttgart, Institute for Technical Thermodynamics, and also tested at the PSA. The REFOS receiver is a modular volumetric pressurized receiver for air preheating in combined cycle plants.
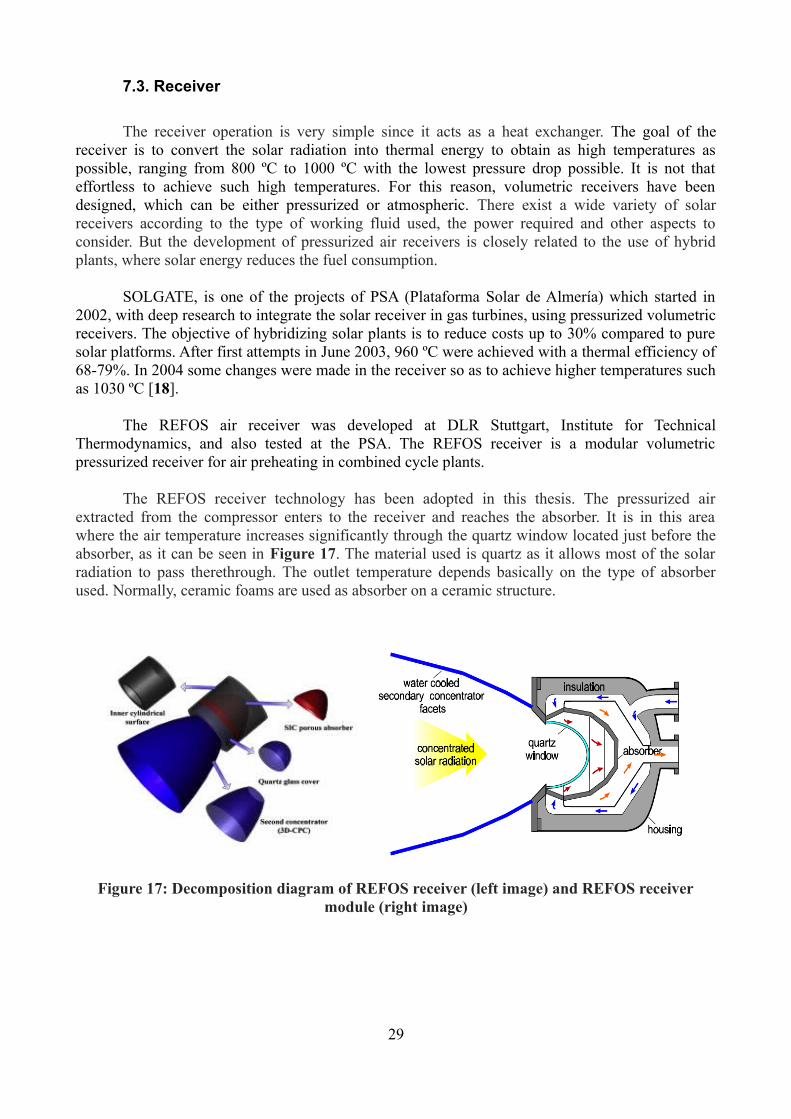
The REFOS receiver technology has been adopted in this thesis. The pressurized air extracted from the compressor enters to the receiver and reaches the absorber. It is in this area where the air temperature increases significantly through the quartz window located just before the absorber, as it can be seen in Figure 17. The material used is quartz as it allows most of the solar radiation to pass therethrough. The outlet temperature depends basically on the type of absorber used. Normally, ceramic foams are used as absorber on a ceramic structure.
Figure 17: Decomposition diagram of REFOS receiver (left image) and REFOS receiver module (right image)
29
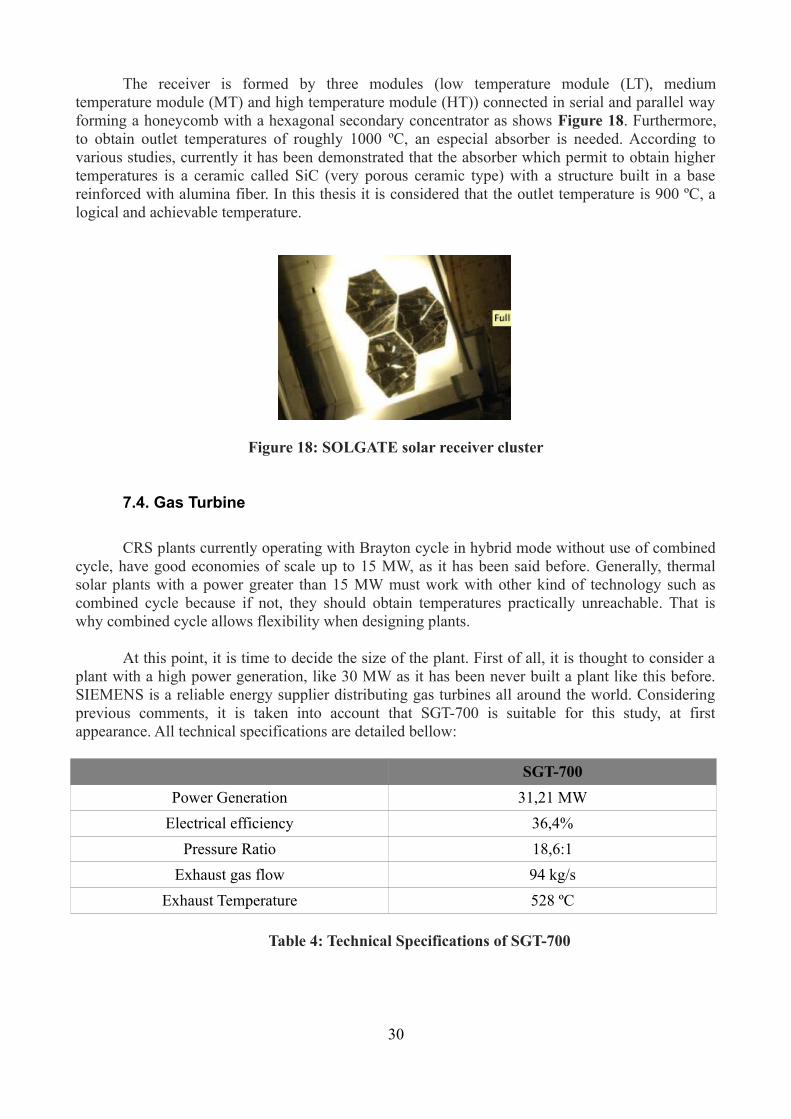
The receiver is formed by three modules (low temperature module (LT), medium temperature module (MT) and high temperature module (HT)) connected in serial and parallel way forming a honeycomb with a hexagonal secondary concentrator as shows Figure 18. Furthermore, to obtain outlet temperatures of roughly 1000 ºC, an especial absorber is needed. According to various studies, currently it has been demonstrated that the absorber which permit to obtain higher temperatures is a ceramic called SiC (very porous ceramic type) with a structure built in a base reinforced with alumina fiber. In this thesis it is considered that the outlet temperature is 900 ºC, a logical and achievable temperature.
Figure 18: SOLGATE solar receiver cluster
7.4. Gas Turbine
CRS plants currently operating with Brayton cycle in hybrid mode without use of combined cycle, have good economies of scale up to 15 MW, as it has been said before. Generally, thermal solar plants with a power greater than 15 MW must work with other kind of technology such as combined cycle because if not, they should obtain temperatures practically unreachable. That is why combined cycle allows flexibility when designing plants.
At this point, it is time to decide the size of the plant. First of all, it is thought to consider a plant with a high power generation, like 30 MW as it has been never built a plant like this before. SIEMENS is a reliable energy supplier distributing gas turbines all around the world. Considering previous comments, it is taken into account that SGT-700 is suitable for this study, at first appearance. All technical specifications are detailed bellow:
SGT-700
Power Generation 31,21 MW
Electrical efficiency 36,4%
Pressure Ratio 18,6:1
Exhaust gas flow 94 kg/s
Exhaust Temperature 528 ºC
Table 4: Technical Specifications of SGT-700
30
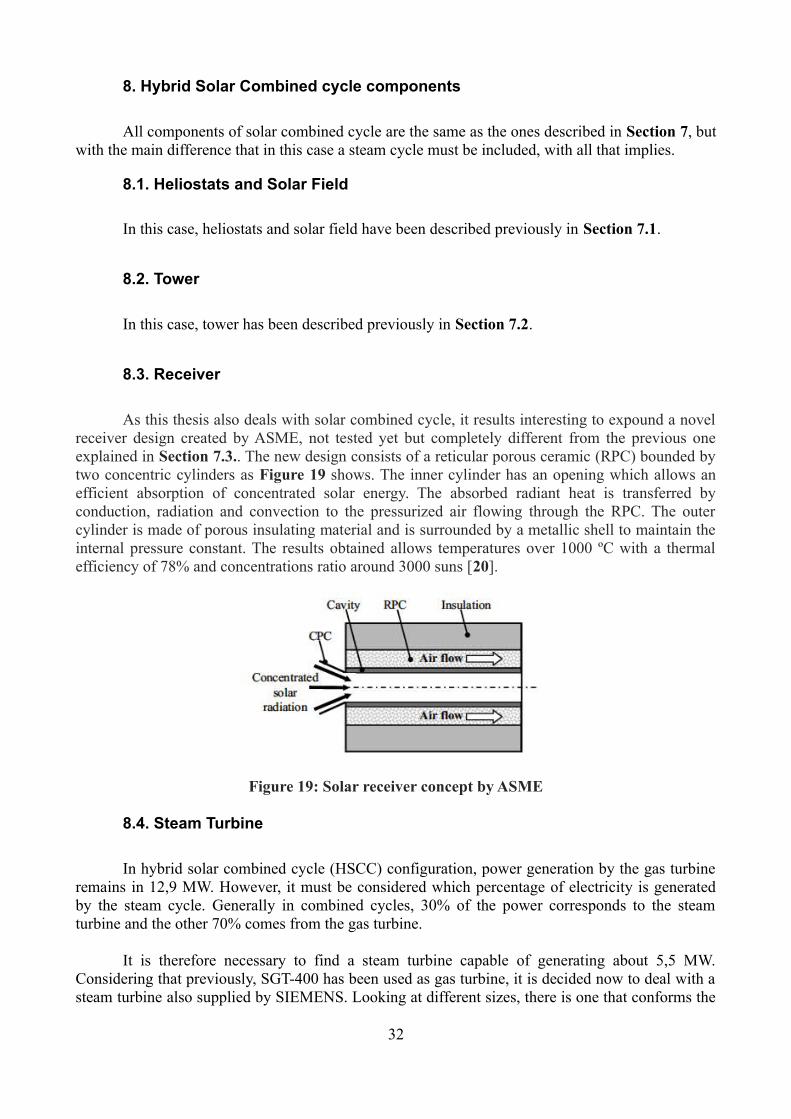
Before continuing, the compatibility with the use of solar energy must be checked. Having a look at the technical specifications, it is pointed out that despite the flexibility of the combustion chamber, low TIT temperatures are reached. As high TIT are needed, it is considered that this turbine is not adequate for the study being carried out in this project. In previous sections, it has been commented that thanks to the receiver and combustion chamber, high inlet temperatures can be obtained in order to reach high electrical efficiency as long as there is a cooling system that allows the blades reach that temperatures. That is why it is necessary another turbine model to choose which can withstand higher inlet temperatures. Now the problem to solve is the nominal value of the plant. It would think in a larger turbine but also must assess the structural constraints. That is why it is decided to study the possibility of working with a smaller turbine. Here are some of the technical specifications of the turbine SGT-400, characterized by two stages:
SGT-400
Power Generation 12,9 MW
Electrical efficiency 34,8%
Pressure Ratio 16,8:1
Exhaust gas flow 39,4 kg/s
Exhaust Temperature 555 ºC
Firing Temperature 1344 ºC
Table 5: Technical Specifications of SGT-400
The differences with the previous turbine are clear and obvious. An important difference to note is the mass flow. This is almost a third of the turbine used in the SGT-700, which significantly reduces the consumption of air. Besides, its firing temperature can reach 1344 °C [19] much higher than the temperature reached with SGT-700. However, before proceeding with the election of this, the compatibility with solar energy must be tested. Thanks to its versatility it can operate in simple cycle, combined cycle or cogeneration. The variability of the solar radiation is uncontrollable whereby the combustion chamber must be able to withstand sudden fluctuations. The turbine inlet temperature must be kept constant, so that the combustion chamber must supply the vacuum heat between the receiver output and the turbine inlet. For all these reasons, it is considered that SGT-400 fulfills all requirements.
31
8. Hybrid Solar Combined cycle components
All components of solar combined cycle are the same as the ones described in Section 7, but with the main difference that in this case a steam cycle must be included, with all that implies.
8.1. Heliostats and Solar Field
In this case, heliostats and solar field have been described previously in Section 7.1.
8.2. Tower
In this case, tower has been described previously in Section 7.2.
8.3. Receiver
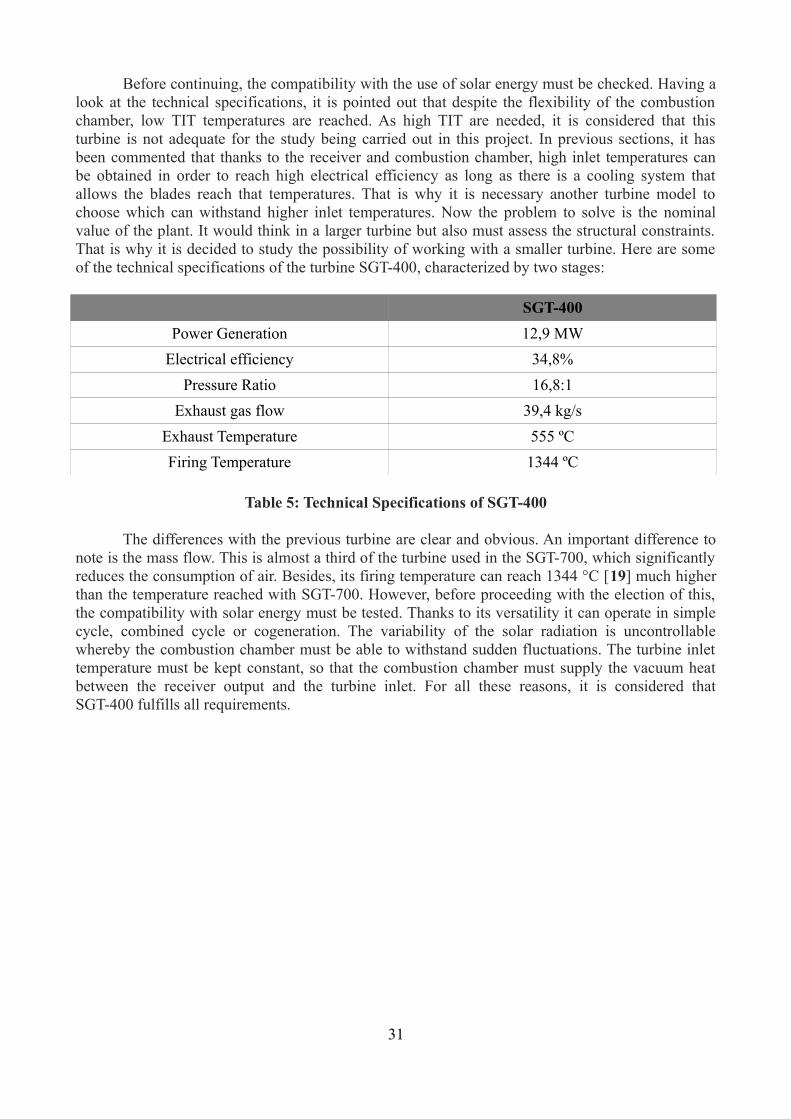
As this thesis also deals with solar combined cycle, it results interesting to expound a novel receiver design created by ASME, not tested yet but completely different from the previous one explained in Section 7.3.. The new design consists of a reticular porous ceramic (RPC) bounded by two concentric cylinders as Figure 19 shows. The inner cylinder has an opening which allows an efficient absorption of concentrated solar energy. The absorbed radiant heat is transferred by conduction, radiation and convection to the pressurized air flowing through the RPC. The outer cylinder is made of porous insulating material and is surrounded by a metallic shell to maintain the internal pressure constant. The results obtained allows temperatures over 1000 ºC with a thermal efficiency of 78% and concentrations ratio around 3000 suns [20].
Figure 19: Solar receiver concept by ASME
8.4. Steam Turbine
In hybrid solar combined cycle (HSCC) configuration, power generation by the gas turbine remains in 12,9 MW. However, it must be considered which percentage of electricity is generated by the steam cycle. Generally in combined cycles, 30% of the power corresponds to the steam turbine and the other 70% comes from the gas turbine.
It is therefore necessary to find a steam turbine capable of generating about 5,5 MW. Considering that previously, SGT-400 has been used as gas turbine, it is decided now to deal with a steam turbine also supplied by SIEMENS. Looking at different sizes, there is one that conforms the
32
previous configuration. Turbine SST-060 is capable of generating up to 6 MW making it ideal for this study. The technical specifications are listed below:
SST-060
Power Generation 6 MW
Maximum Inlet Temperature Turbine 530 ºC
Maxim Inlet Pressure Turbine 131 bar
Table 6: Technical Specifications of SST-060
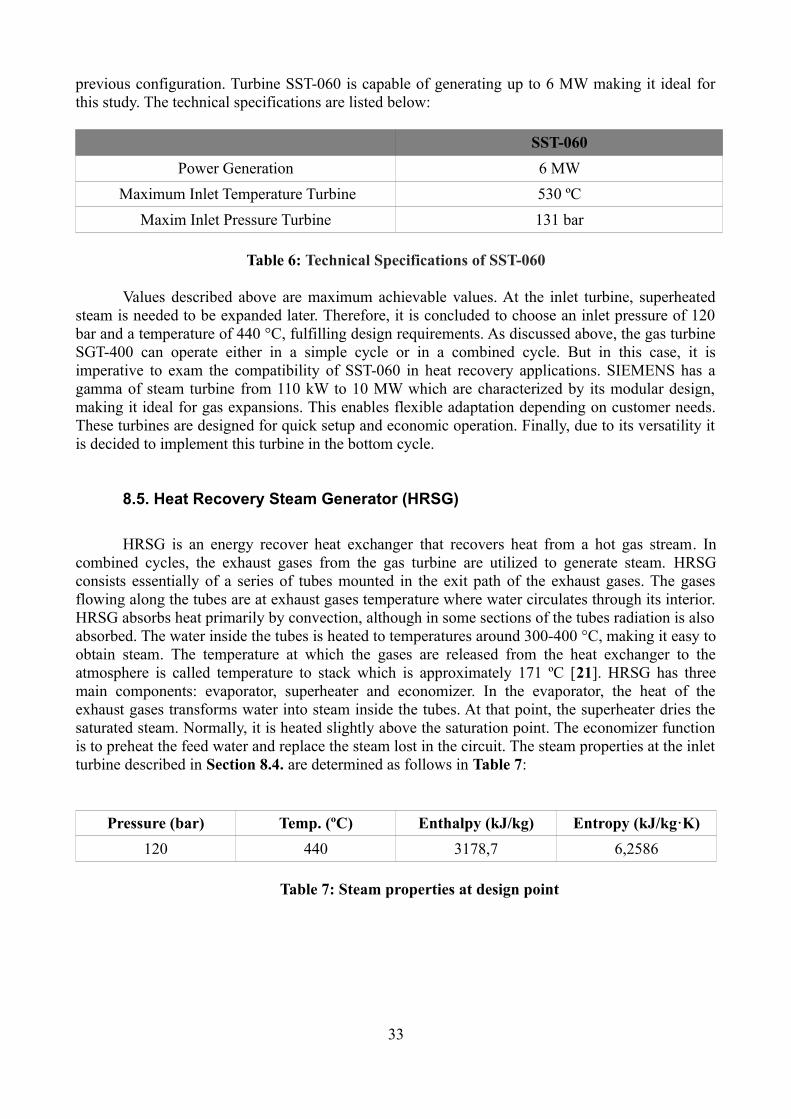
Values described above are maximum achievable values. At the inlet turbine, superheated steam is needed to be expanded later. Therefore, it is concluded to choose an inlet pressure of 120 bar and a temperature of 440 °C, fulfilling design requirements. As discussed above, the gas turbine SGT-400 can operate either in a simple cycle or in a combined cycle. But in this case, it is imperative to exam the compatibility of SST-060 in heat recovery applications. SIEMENS has a gamma of steam turbine from 110 kW to 10 MW which are characterized by its modular design, making it ideal for gas expansions. This enables flexible adaptation depending on customer needs. These turbines are designed for quick setup and economic operation. Finally, due to its versatility it is decided to implement this turbine in the bottom cycle.
8.5. Heat Recovery Steam Generator (HRSG)
HRSG is an energy recover heat exchanger that recovers heat from a hot gas stream. In combined cycles, the exhaust gases from the gas turbine are utilized to generate steam. HRSG consists essentially of a series of tubes mounted in the exit path of the exhaust gases. The gases flowing along the tubes are at exhaust gases temperature where water circulates through its interior. HRSG absorbs heat primarily by convection, although in some sections of the tubes radiation is also absorbed. The water inside the tubes is heated to temperatures around 300-400 °C, making it easy to obtain steam. The temperature at which the gases are released from the heat exchanger to the atmosphere is called temperature to stack which is approximately 171 ºC [21]. HRSG has three main components: evaporator, superheater and economizer. In the evaporator, the heat of the exhaust gases transforms water into steam inside the tubes. At that point, the superheater dries the saturated steam. Normally, it is heated slightly above the saturation point. The economizer function is to preheat the feed water and replace the steam lost in the circuit. The steam properties at the inlet turbine described in Section 8.4. are determined as follows in Table 7:
Pressure (bar) Temp. (ºC) Enthalpy (kJ/kg) Entropy (kJ/kg·K)
120 440 3178,7 6,2586
Table 7: Steam properties at design point
33
9. IPSE simulations
To simulate the different configurations studied, it has been selected the thermodynamic software called IPSE. Before proceeding, note that all simulations done in Section 9 correspond to the design point, optimum point at which the receiver is capable of absorbing solar energy sufficient for having an output temperature of 900 °C.
9.1. Hybrid Solar Brayton Cycle parameters
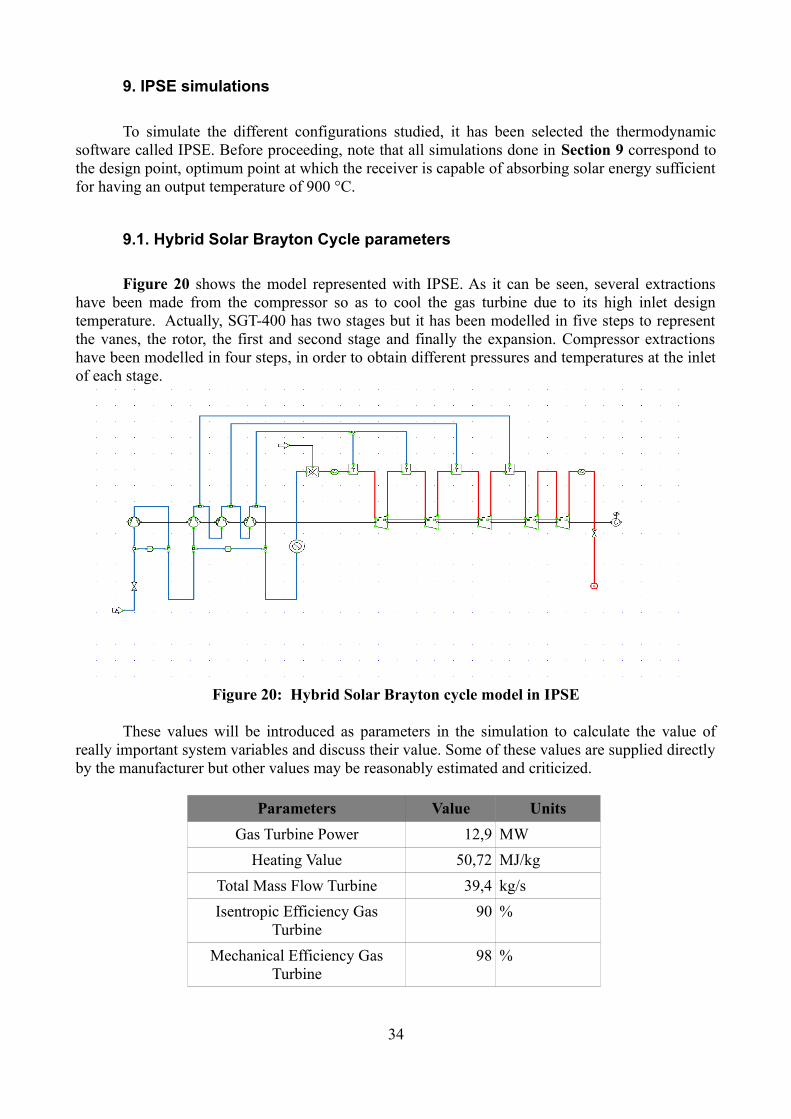
Figure 20 shows the model represented with IPSE. As it can be seen, several extractions have been made from the compressor so as to cool the gas turbine due to its high inlet design temperature. Actually, SGT-400 has two stages but it has been modelled in five steps to represent the vanes, the rotor, the first and second stage and finally the expansion. Compressor extractions have been modelled in four steps, in order to obtain different pressures and temperatures at the inlet of each stage.
Figure 20: Hybrid Solar Brayton cycle model in IPSE
These values will be introduced as parameters in the simulation to calculate the value of really important system variables and discuss their value. Some of these values are supplied directly by the manufacturer but other values may be reasonably estimated and criticized.
Parameters Value Units
Gas Turbine Power 12,9 MW
Heating Value 50,72 MJ/kg
Total Mass Flow Turbine 39,4 kg/s
Isentropic Efficiency Gas Turbine
90 %
Mechanical Efficiency Gas Turbine
98 %
34
Isentropic Efficiency Compressor
87 %
Mechanical Efficiency Compressor
98 %
Gearbox Efficiency 99 %
Generator Efficiency 97,2 %
Outlet Receiver Temperature 900 º C
Inlet Turbine Temperature 1344 º C
Exhaust Turbine Temperature 555 º C
Compressor Pressure Ratio 16,8 -
Receiver Pressure Drop 190 mbar
Combustion Chamber Pressure Drop
4 %
Table 8: Operational parameters of Hybrid Solar Brayton cycle
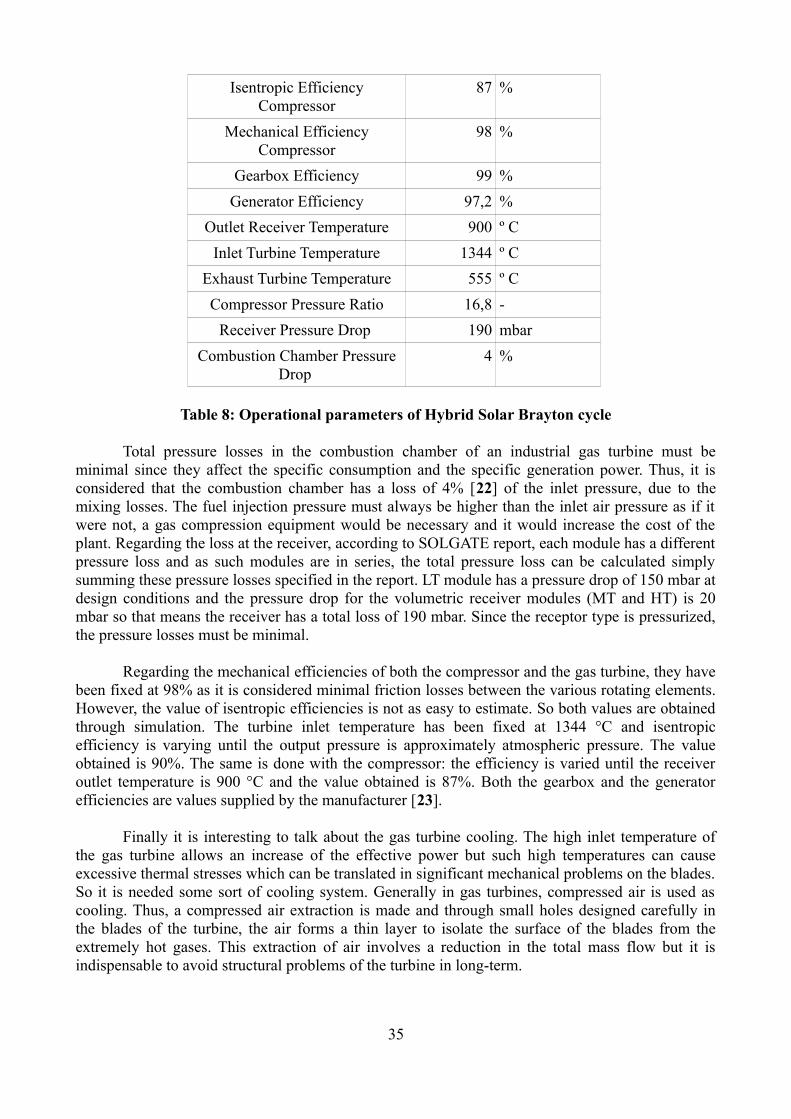
Total pressure losses in the combustion chamber of an industrial gas turbine must be minimal since they affect the specific consumption and the specific generation power. Thus, it is considered that the combustion chamber has a loss of 4% [22] of the inlet pressure, due to the mixing losses. The fuel injection pressure must always be higher than the inlet air pressure as if it were not, a gas compression equipment would be necessary and it would increase the cost of the plant. Regarding the loss at the receiver, according to SOLGATE report, each module has a different pressure loss and as such modules are in series, the total pressure loss can be calculated simply summing these pressure losses specified in the report. LT module has a pressure drop of 150 mbar at design conditions and the pressure drop for the volumetric receiver modules (MT and HT) is 20 mbar so that means the receiver has a total loss of 190 mbar. Since the receptor type is pressurized, the pressure losses must be minimal.
Regarding the mechanical efficiencies of both the compressor and the gas turbine, they have been fixed at 98% as it is considered minimal friction losses between the various rotating elements. However, the value of isentropic efficiencies is not as easy to estimate. So both values are obtained through simulation. The turbine inlet temperature has been fixed at 1344 °C and isentropic efficiency is varying until the output pressure is approximately atmospheric pressure. The value obtained is 90%. The same is done with the compressor: the efficiency is varied until the receiver outlet temperature is 900 °C and the value obtained is 87%. Both the gearbox and the generator efficiencies are values supplied by the manufacturer [23].
Finally it is interesting to talk about the gas turbine cooling. The high inlet temperature of the gas turbine allows an increase of the effective power but such high temperatures can cause excessive thermal stresses which can be translated in significant mechanical problems on the blades. So it is needed some sort of cooling system. Generally in gas turbines, compressed air is used as cooling. Thus, a compressed air extraction is made and through small holes designed carefully in the blades of the turbine, the air forms a thin layer to isolate the surface of the blades from the extremely hot gases. This extraction of air involves a reduction in the total mass flow but it is indispensable to avoid structural problems of the turbine in long-term.
35
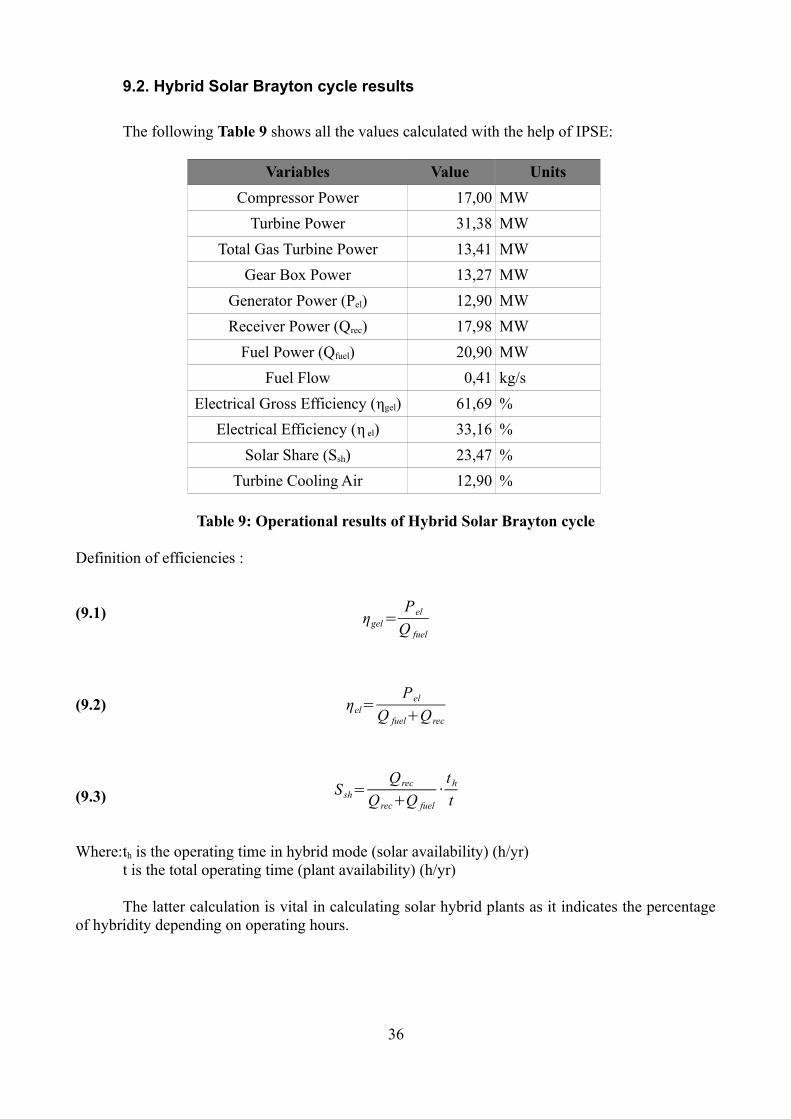
9.2. Hybrid Solar Brayton cycle results
The following Table 9 shows all the values calculated with the help of IPSE:
Variables Value Units
Compressor Power 17,00 MW
Turbine Power 31,38 MW
Total Gas Turbine Power 13,41 MW
Gear Box Power 13,27 MW
Generator Power (Pel) 12,90 MW
Receiver Power (Qrec) 17,98 MW
Fuel Power (Qfuel) 20,90 MW
Fuel Flow 0,41 kg/s
Electrical Gross Efficiency (ηgel) 61,69 %
Electrical Efficiency (η el) 33,16 %
Solar Share (Ssh) 23,47 %
Turbine Cooling Air 12,90 %
Table 9: Operational results of Hybrid Solar Brayton cycle
Definition of efficiencies :
(9.1)
(9.2)
(9.3)
Where:th is the operating time in hybrid mode (solar availability) (h/yr)t is the total operating time (plant availability) (h/yr)
The latter calculation is vital in calculating solar hybrid plants as it indicates the percentage of hybridity depending on operating hours.
36
ηel=Pel
Q fuel+Qrec
S sh=Qrec
Qrec+Q fuel
·th
t
ηgel=Pel
Q fuel
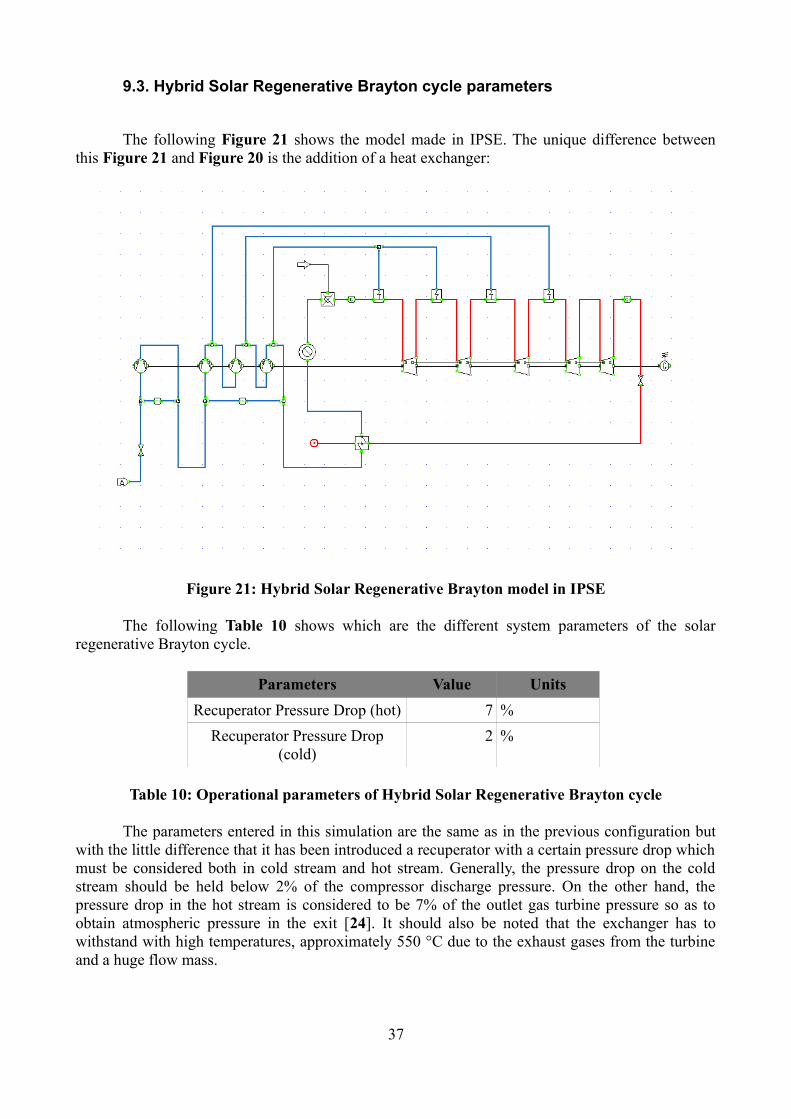
9.3. Hybrid Solar Regenerative Brayton cycle parameters
The following Figure 21 shows the model made in IPSE. The unique difference between this Figure 21 and Figure 20 is the addition of a heat exchanger:
Figure 21: Hybrid Solar Regenerative Brayton model in IPSE
The following Table 10 shows which are the different system parameters of the solar regenerative Brayton cycle.
Parameters Value Units
Recuperator Pressure Drop (hot) 7 %
Recuperator Pressure Drop (cold)
2 %
Table 10: Operational parameters of Hybrid Solar Regenerative Brayton cycle
The parameters entered in this simulation are the same as in the previous configuration but with the little difference that it has been introduced a recuperator with a certain pressure drop which must be considered both in cold stream and hot stream. Generally, the pressure drop on the cold stream should be held below 2% of the compressor discharge pressure. On the other hand, the pressure drop in the hot stream is considered to be 7% of the outlet gas turbine pressure so as to obtain atmospheric pressure in the exit [24]. It should also be noted that the exchanger has to withstand with high temperatures, approximately 550 °C due to the exhaust gases from the turbine and a huge flow mass.
37
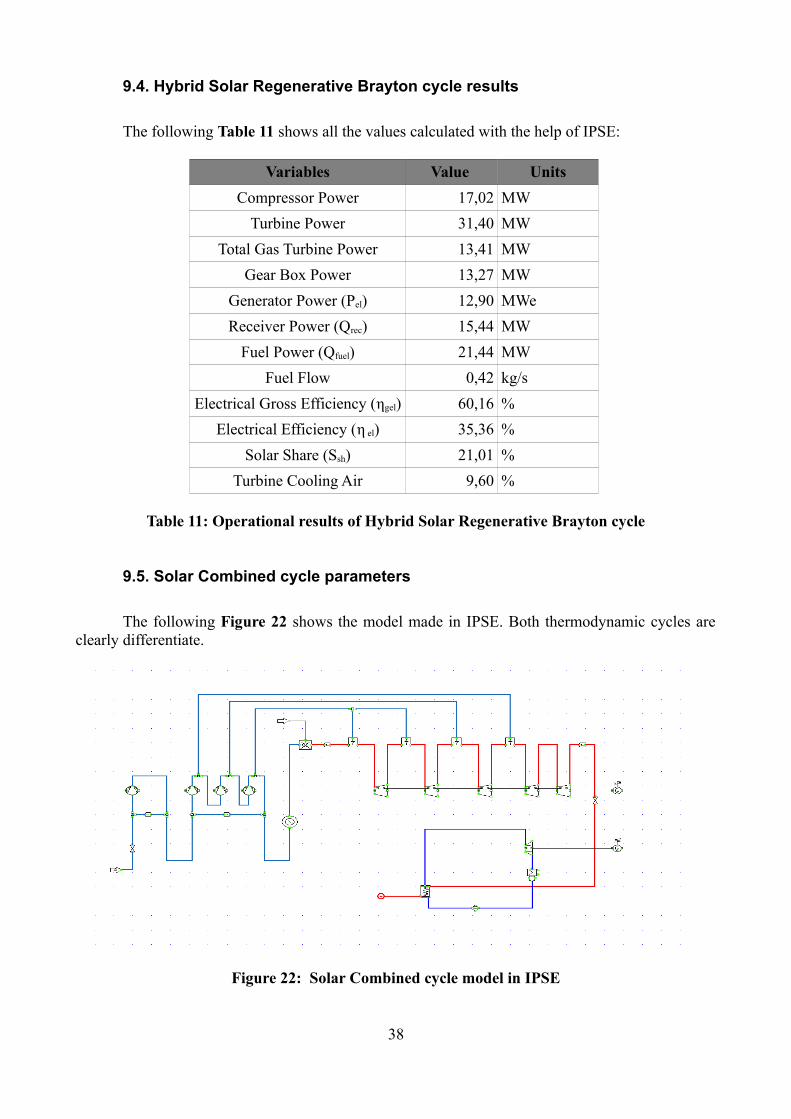
9.4. Hybrid Solar Regenerative Brayton cycle results
The following Table 11 shows all the values calculated with the help of IPSE:
Variables Value Units
Compressor Power 17,02 MW
Turbine Power 31,40 MW
Total Gas Turbine Power 13,41 MW
Gear Box Power 13,27 MW
Generator Power (Pel) 12,90 MWe
Receiver Power (Qrec) 15,44 MW
Fuel Power (Qfuel) 21,44 MW
Fuel Flow 0,42 kg/s
Electrical Gross Efficiency (ηgel) 60,16 %
Electrical Efficiency (η el) 35,36 %
Solar Share (Ssh) 21,01 %
Turbine Cooling Air 9,60 %
Table 11: Operational results of Hybrid Solar Regenerative Brayton cycle
9.5. Solar Combined cycle parameters
The following Figure 22 shows the model made in IPSE. Both thermodynamic cycles are clearly differentiate.
Figure 22: Solar Combined cycle model in IPSE
38
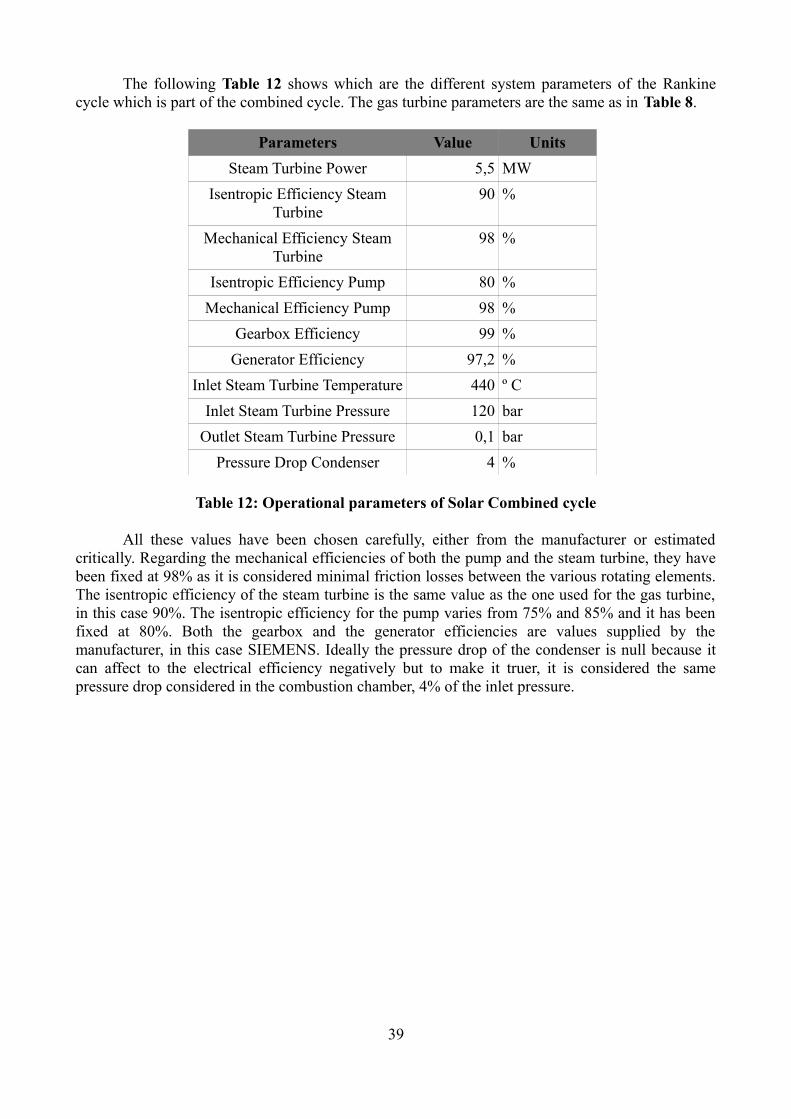
The following Table 12 shows which are the different system parameters of the Rankine cycle which is part of the combined cycle. The gas turbine parameters are the same as in Table 8.
Parameters Value Units
Steam Turbine Power 5,5 MW
Isentropic Efficiency Steam Turbine
90 %
Mechanical Efficiency Steam Turbine
98 %
Isentropic Efficiency Pump 80 %
Mechanical Efficiency Pump 98 %
Gearbox Efficiency 99 %
Generator Efficiency 97,2 %
Inlet Steam Turbine Temperature 440 º C
Inlet Steam Turbine Pressure 120 bar
Outlet Steam Turbine Pressure 0,1 bar
Pressure Drop Condenser 4 %
Table 12: Operational parameters of Solar Combined cycle
All these values have been chosen carefully, either from the manufacturer or estimated critically. Regarding the mechanical efficiencies of both the pump and the steam turbine, they have been fixed at 98% as it is considered minimal friction losses between the various rotating elements. The isentropic efficiency of the steam turbine is the same value as the one used for the gas turbine, in this case 90%. The isentropic efficiency for the pump varies from 75% and 85% and it has been fixed at 80%. Both the gearbox and the generator efficiencies are values supplied by the manufacturer, in this case SIEMENS. Ideally the pressure drop of the condenser is null because it can affect to the electrical efficiency negatively but to make it truer, it is considered the same pressure drop considered in the combustion chamber, 4% of the inlet pressure.
39
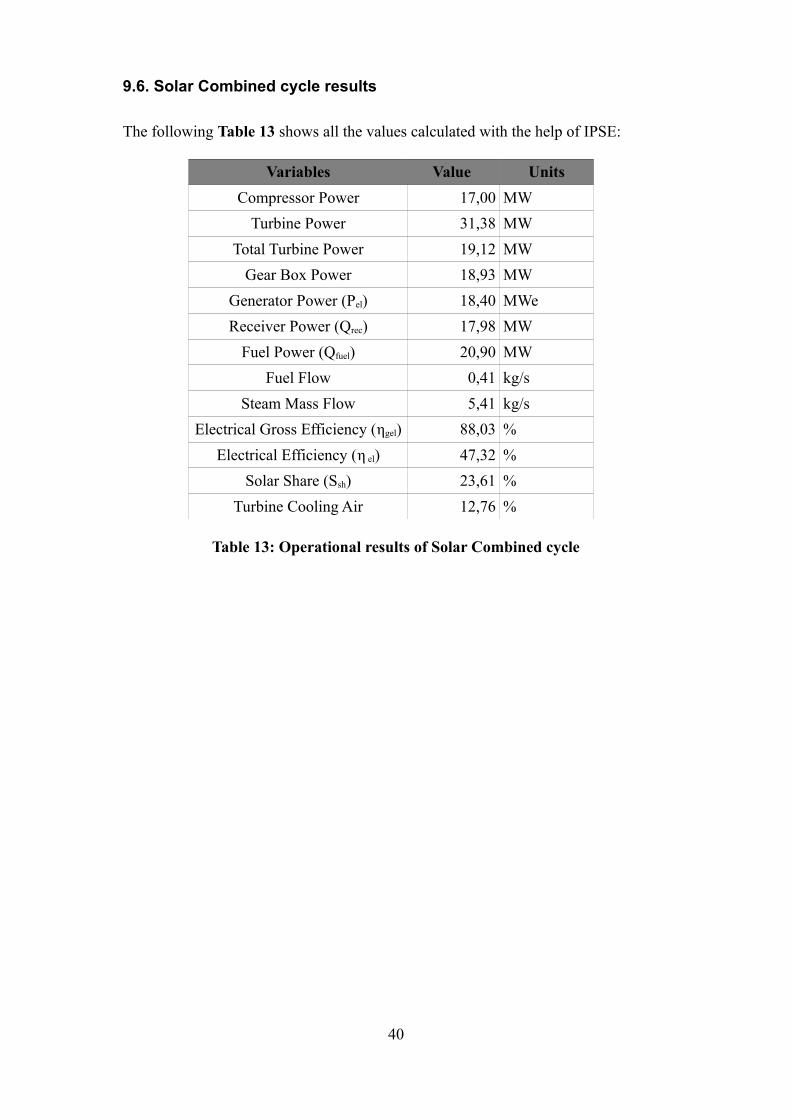
9.6. Solar Combined cycle results
The following Table 13 shows all the values calculated with the help of IPSE:
Variables Value Units
Compressor Power 17,00 MW
Turbine Power 31,38 MW
Total Turbine Power 19,12 MW
Gear Box Power 18,93 MW
Generator Power (Pel) 18,40 MWe
Receiver Power (Qrec) 17,98 MW
Fuel Power (Qfuel) 20,90 MW
Fuel Flow 0,41 kg/s
Steam Mass Flow 5,41 kg/s
Electrical Gross Efficiency (ηgel) 88,03 %
Electrical Efficiency (η el) 47,32 %
Solar Share (Ssh) 23,61 %
Turbine Cooling Air 12,76 %
Table 13: Operational results of Solar Combined cycle
40
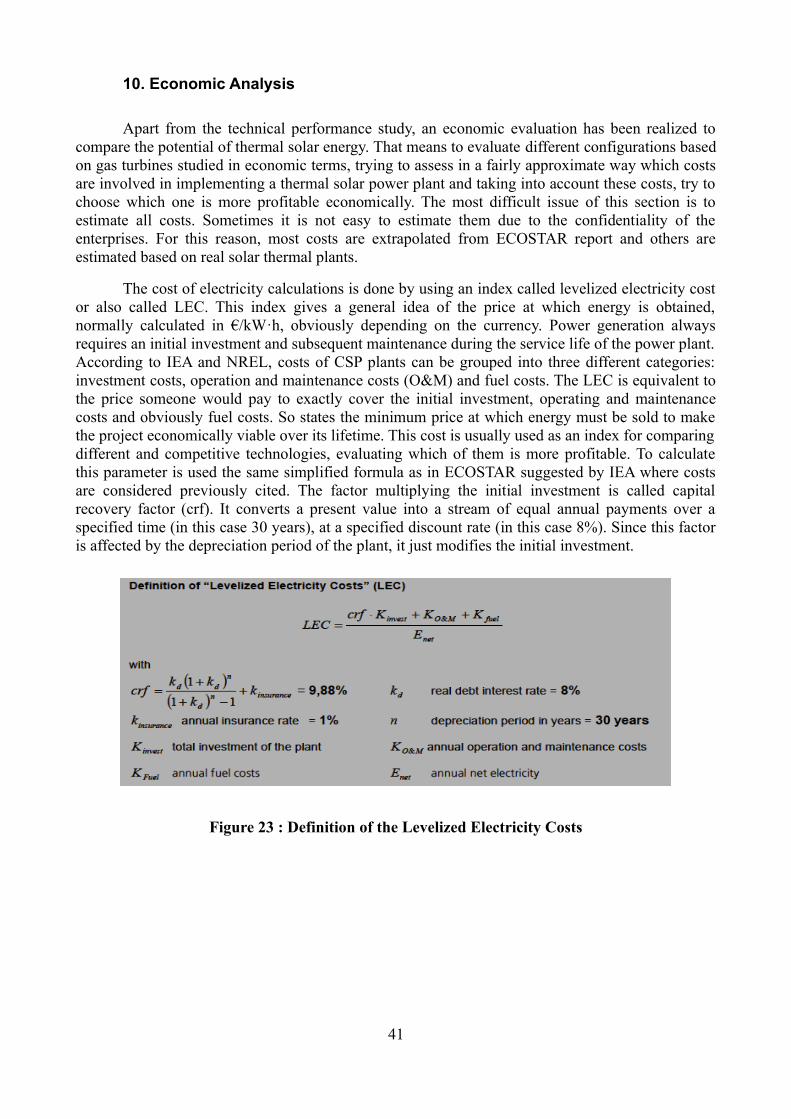
10. Economic Analysis
Apart from the technical performance study, an economic evaluation has been realized to compare the potential of thermal solar energy. That means to evaluate different configurations based on gas turbines studied in economic terms, trying to assess in a fairly approximate way which costs are involved in implementing a thermal solar power plant and taking into account these costs, try to choose which one is more profitable economically. The most difficult issue of this section is to estimate all costs. Sometimes it is not easy to estimate them due to the confidentiality of the enterprises. For this reason, most costs are extrapolated from ECOSTAR report and others are estimated based on real solar thermal plants.
The cost of electricity calculations is done by using an index called levelized electricity cost or also called LEC. This index gives a general idea of the price at which energy is obtained, normally calculated in €/kW·h, obviously depending on the currency. Power generation always requires an initial investment and subsequent maintenance during the service life of the power plant. According to IEA and NREL, costs of CSP plants can be grouped into three different categories: investment costs, operation and maintenance costs (O&M) and fuel costs. The LEC is equivalent to the price someone would pay to exactly cover the initial investment, operating and maintenance costs and obviously fuel costs. So states the minimum price at which energy must be sold to make the project economically viable over its lifetime. This cost is usually used as an index for comparing different and competitive technologies, evaluating which of them is more profitable. To calculate this parameter is used the same simplified formula as in ECOSTAR suggested by IEA where costs are considered previously cited. The factor multiplying the initial investment is called capital recovery factor (crf). It converts a present value into a stream of equal annual payments over a specified time (in this case 30 years), at a specified discount rate (in this case 8%). Since this factor is affected by the depreciation period of the plant, it just modifies the initial investment.
Figure 23 : Definition of the Levelized Electricity Costs
41
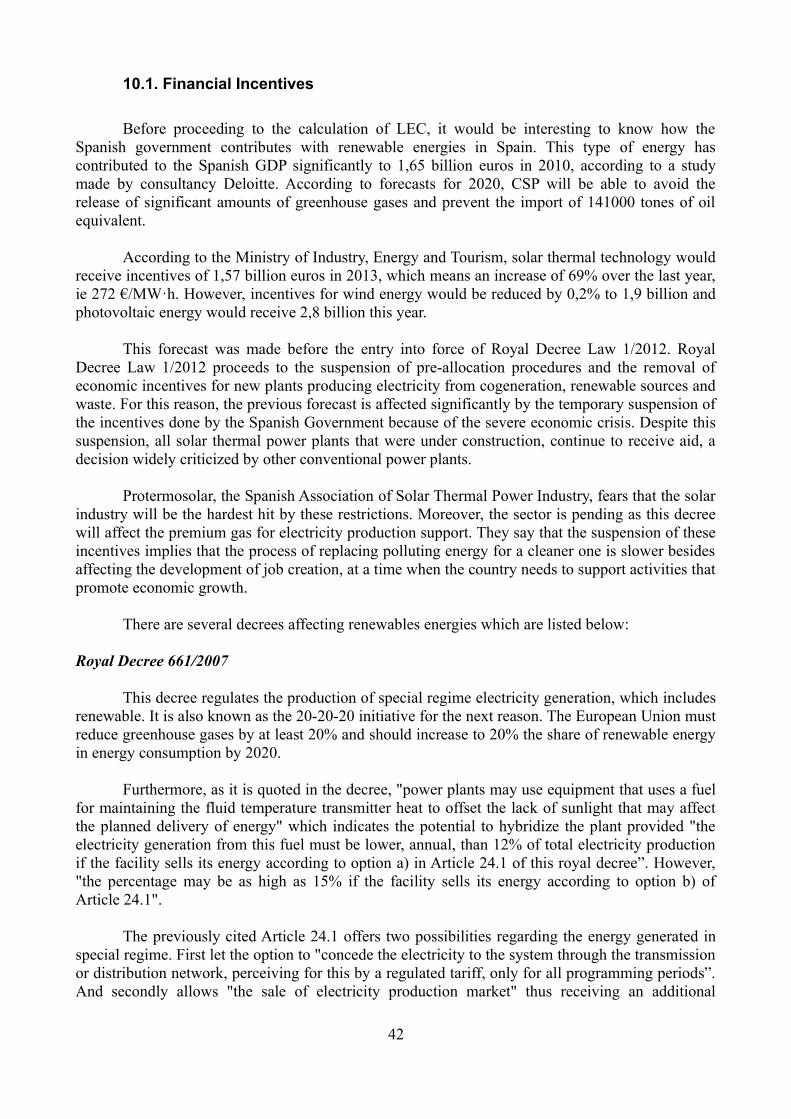
10.1. Financial Incentives
Before proceeding to the calculation of LEC, it would be interesting to know how the Spanish government contributes with renewable energies in Spain. This type of energy has contributed to the Spanish GDP significantly to 1,65 billion euros in 2010, according to a study made by consultancy Deloitte. According to forecasts for 2020, CSP will be able to avoid the release of significant amounts of greenhouse gases and prevent the import of 141000 tones of oil equivalent.
According to the Ministry of Industry, Energy and Tourism, solar thermal technology would receive incentives of 1,57 billion euros in 2013, which means an increase of 69% over the last year, ie 272 €/MW·h. However, incentives for wind energy would be reduced by 0,2% to 1,9 billion and photovoltaic energy would receive 2,8 billion this year.
This forecast was made before the entry into force of Royal Decree Law 1/2012. Royal Decree Law 1/2012 proceeds to the suspension of pre-allocation procedures and the removal of economic incentives for new plants producing electricity from cogeneration, renewable sources and waste. For this reason, the previous forecast is affected significantly by the temporary suspension of the incentives done by the Spanish Government because of the severe economic crisis. Despite this suspension, all solar thermal power plants that were under construction, continue to receive aid, a decision widely criticized by other conventional power plants.
Protermosolar, the Spanish Association of Solar Thermal Power Industry, fears that the solar industry will be the hardest hit by these restrictions. Moreover, the sector is pending as this decree will affect the premium gas for electricity production support. They say that the suspension of these incentives implies that the process of replacing polluting energy for a cleaner one is slower besides affecting the development of job creation, at a time when the country needs to support activities that promote economic growth.
There are several decrees affecting renewables energies which are listed below:
Royal Decree 661/2007
This decree regulates the production of special regime electricity generation, which includes renewable. It is also known as the 20-20-20 initiative for the next reason. The European Union must reduce greenhouse gases by at least 20% and should increase to 20% the share of renewable energy in energy consumption by 2020.
Furthermore, as it is quoted in the decree, "power plants may use equipment that uses a fuel for maintaining the fluid temperature transmitter heat to offset the lack of sunlight that may affect the planned delivery of energy" which indicates the potential to hybridize the plant provided "the electricity generation from this fuel must be lower, annual, than 12% of total electricity production if the facility sells its energy according to option a) in Article 24.1 of this royal decree”. However, "the percentage may be as high as 15% if the facility sells its energy according to option b) of Article 24.1".
The previously cited Article 24.1 offers two possibilities regarding the energy generated in special regime. First let the option to "concede the electricity to the system through the transmission or distribution network, perceiving for this by a regulated tariff, only for all programming periods”. And secondly allows "the sale of electricity production market" thus receiving an additional
42
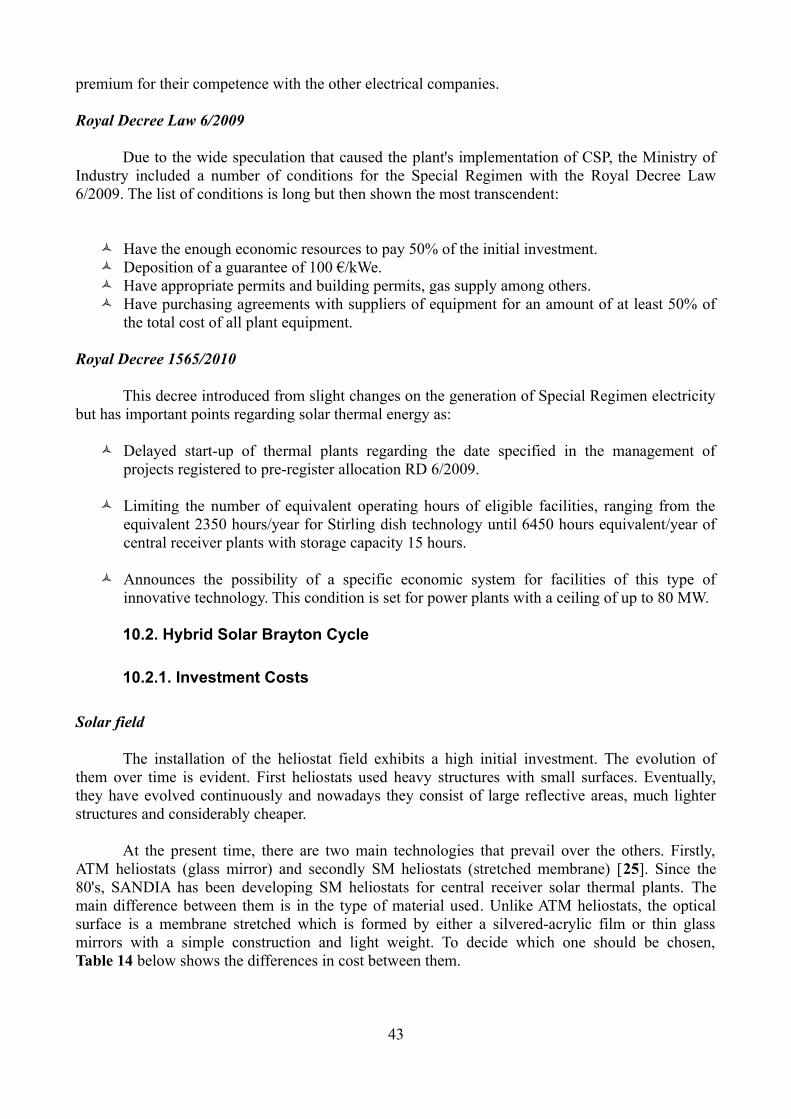
premium for their competence with the other electrical companies.
Royal Decree Law 6/2009
Due to the wide speculation that caused the plant's implementation of CSP, the Ministry of Industry included a number of conditions for the Special Regimen with the Royal Decree Law 6/2009. The list of conditions is long but then shown the most transcendent:
Have the enough economic resources to pay 50% of the initial investment. Deposition of a guarantee of 100 €/kWe. Have appropriate permits and building permits, gas supply among others. Have purchasing agreements with suppliers of equipment for an amount of at least 50% of
the total cost of all plant equipment.
Royal Decree 1565/2010
This decree introduced from slight changes on the generation of Special Regimen electricity but has important points regarding solar thermal energy as:
Delayed start-up of thermal plants regarding the date specified in the management of projects registered to pre-register allocation RD 6/2009.
Limiting the number of equivalent operating hours of eligible facilities, ranging from the equivalent 2350 hours/year for Stirling dish technology until 6450 hours equivalent/year of central receiver plants with storage capacity 15 hours.
Announces the possibility of a specific economic system for facilities of this type of innovative technology. This condition is set for power plants with a ceiling of up to 80 MW.
10.2. Hybrid Solar Brayton Cycle
10.2.1. Investment Costs
Solar field
The installation of the heliostat field exhibits a high initial investment. The evolution of them over time is evident. First heliostats used heavy structures with small surfaces. Eventually, they have evolved continuously and nowadays they consist of large reflective areas, much lighter structures and considerably cheaper.
At the present time, there are two main technologies that prevail over the others. Firstly, ATM heliostats (glass mirror) and secondly SM heliostats (stretched membrane) [25]. Since the 80's, SANDIA has been developing SM heliostats for central receiver solar thermal plants. The main difference between them is in the type of material used. Unlike ATM heliostats, the optical surface is a membrane stretched which is formed by either a silvered-acrylic film or thin glass mirrors with a simple construction and light weight. To decide which one should be chosen, Table 14 below shows the differences in cost between them.
43
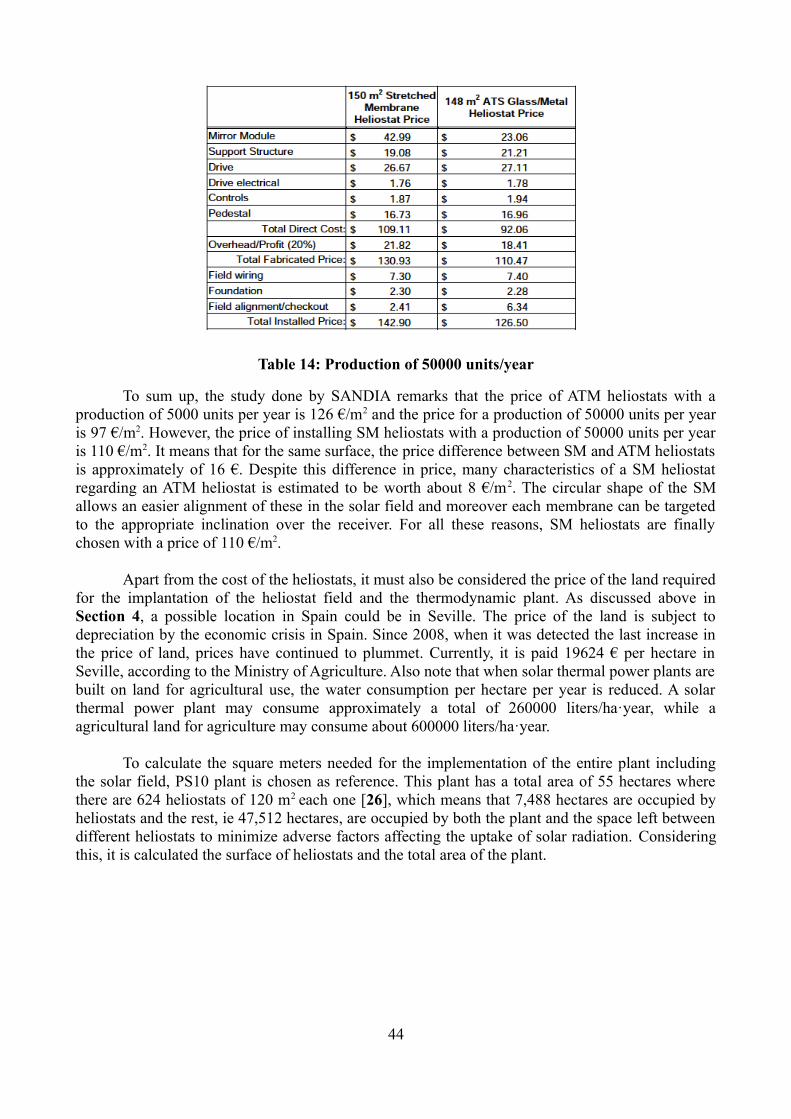
Table 14: Production of 50000 units/year
To sum up, the study done by SANDIA remarks that the price of ATM heliostats with a production of 5000 units per year is 126 €/m2 and the price for a production of 50000 units per year is 97 €/m2. However, the price of installing SM heliostats with a production of 50000 units per year is 110 €/m2. It means that for the same surface, the price difference between SM and ATM heliostats is approximately of 16 €. Despite this difference in price, many characteristics of a SM heliostat regarding an ATM heliostat is estimated to be worth about 8 €/m2. The circular shape of the SM allows an easier alignment of these in the solar field and moreover each membrane can be targeted to the appropriate inclination over the receiver. For all these reasons, SM heliostats are finally chosen with a price of 110 €/m2.
Apart from the cost of the heliostats, it must also be considered the price of the land required for the implantation of the heliostat field and the thermodynamic plant. As discussed above in Section 4, a possible location in Spain could be in Seville. The price of the land is subject to depreciation by the economic crisis in Spain. Since 2008, when it was detected the last increase in the price of land, prices have continued to plummet. Currently, it is paid 19624 € per hectare in Seville, according to the Ministry of Agriculture. Also note that when solar thermal power plants are built on land for agricultural use, the water consumption per hectare per year is reduced. A solar thermal power plant may consume approximately a total of 260000 liters/ha·year, while a agricultural land for agriculture may consume about 600000 liters/ha·year.
To calculate the square meters needed for the implementation of the entire plant including the solar field, PS10 plant is chosen as reference. This plant has a total area of 55 hectares where there are 624 heliostats of 120 m2 each one [26], which means that 7,488 hectares are occupied by heliostats and the rest, ie 47,512 hectares, are occupied by both the plant and the space left between different heliostats to minimize adverse factors affecting the uptake of solar radiation. Considering this, it is calculated the surface of heliostats and the total area of the plant.
44
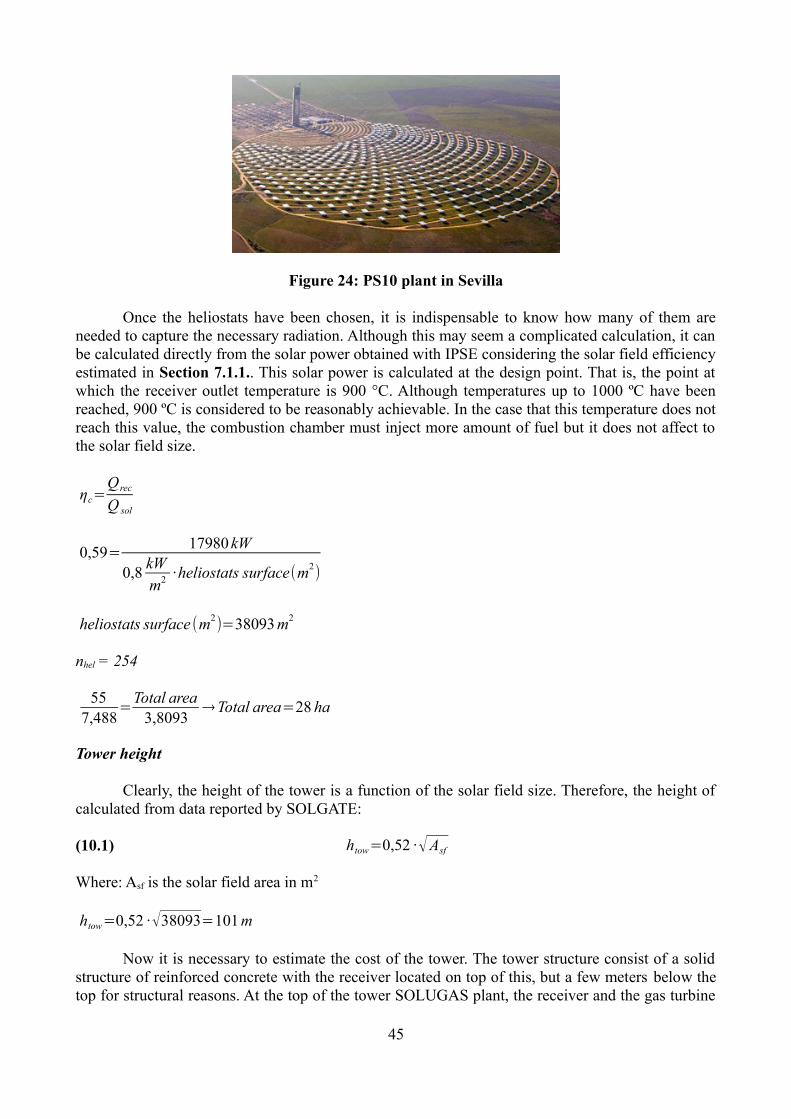
Figure 24: PS10 plant in Sevilla
Once the heliostats have been chosen, it is indispensable to know how many of them are needed to capture the necessary radiation. Although this may seem a complicated calculation, it can be calculated directly from the solar power obtained with IPSE considering the solar field efficiency estimated in Section 7.1.1.. This solar power is calculated at the design point. That is, the point at which the receiver outlet temperature is 900 °C. Although temperatures up to 1000 ºC have been reached, 900 ºC is considered to be reasonably achievable. In the case that this temperature does not reach this value, the combustion chamber must inject more amount of fuel but it does not affect to the solar field size.
ηc=Qrec
Q sol
0,59= 17980 kW
0,8kWm2 · heliostats surface(m2)
heliostats surface (m2)=38093 m2
nhel = 254
557,488
=Total area3,8093
→Total area=28 ha
Tower height
Clearly, the height of the tower is a function of the solar field size. Therefore, the height of calculated from data reported by SOLGATE:
(10.1)
Where: Asf is the solar field area in m2
htow=0,52 ·√38093=101 m
Now it is necessary to estimate the cost of the tower. The tower structure consist of a solid structure of reinforced concrete with the receiver located on top of this, but a few meters below the top for structural reasons. At the top of the tower SOLUGAS plant, the receiver and the gas turbine
45
htow=0,52 ·√Asf
have been installed [27]. On the other hand, the vast majority of CSP plants, which operate with Rankine cycle, have the power block at floor level as it is much more comfortable in the case that a fault occurs in any component. It can also be extrapolated to the case of the Brayton cycle. In this work, the power block is assumed to be at floor level. So, the only component of the entire circuit which must reach the top of the tower are the pipes through which the working fluid circulates.
The calculation of the tower investment is not complicated as it depends mostly on the own height. For this reason, it is decided to choose PS10 plant as a reference. The height of that tower is 90 m and the cost of the investment is 1312120 € [28], in which both transportation and installation costs are contemplated. Thus, it is estimated that the price per meter built is 14580 €/m.
Receiver
As discussed before, the receiver comprises three different units aligned in serial and in parallel way. The evolution of the receptors is remarkable since the beginning of solar applications. However, these still represent a high percentage of the initial investment. Materials research is essential to find materials capable of withstanding higher temperatures such as ceramics. Naturally, the cost of the receiver depends on the area of the receiver. To calculate the area of the receiver simply it is needed to know the concentration ratio of the plant. Concentration ratio is defined as the aperture area divided by the receiver area of the collector. This ratio is calculated as follows:
(10.2) C=
Asf
Arec
Where: Asf is the solar field areaArec is the receiver area
Whereas this value is usually between 500-1500 suns for central receiver plants, Gemasolar plant located in Sevilla has a concentration ratio of 1000 suns [29]. This value is adopted to calculate the receiver area for different configurations. Furthermore, as the receiver consists of 3 different modules, each module will have an area (Amod) equivalent to one third of the total area of the receiver.
Arec=Asf
1000=38,09m2→ Amod=12,7 m2
The cost of three different modules is different because the structural complexity varies depending on the discharge temperature of each module. LT module has a pressure drop of 150 mbar at design conditions with a specific cost of 15938 €/m2. The pressure drop for the volumetric receiver modules (MT and HT) is 20 mbar, with a specific cost of 32813 €/m2 and 37500 €/m2, respectively [30].
Power Block
Turbine SGT-400 has all power block in a single unit which includes the compressor, the combustion chamber, the charge system of the fuel injection of the gas turbine, the turbine cooling system, the gearbox and the generator to be connected to the electricity grid and others auxiliary systems. Given the complexity of assembling this unit, it is sure that it will be the component with the largest initial investment before the heliostat field. In addition, the assembly of this unit must be slightly modified due to the configuration of the plant as the receiver is in the top of the central
46
tower and the power block is located at ground level. This modification is called solarization and it mainly consists of a modification in the installation of the pipes leading from the outlet compressor to the inlet of the combustion chamber. Because of this large difference in height, the pipes must be calculated apart from the power block.
Because of the confidentiality of SIEMENS, it is impossible to know exactly the cost of the unit SGT-400. This is why the cost of the power block has been estimated thanks to NREL 2003 report. It reports the cost of solar plants based on tower with storage technology through Rankine cycle. They reported costs for the electrical power block (which includes steam turbine and generator, steam turbine and generator auxiliaries, feed water and condensate systems) roughly of 308 €/kWe, and values for balance of plant (which include condenser and cooling tower system, water treatment system, fire protection, piping, compressed air systems, closed cooling water system, instrumentation, electrical equipment, and cranes and hoists) roughly of 308 €/kWe for a power generation of 50 MW, which means a total amount of 616 €/kWe, which includes the gas and steam turbines.
For Hybrid Solar Brayton cycle, a cost of 350 €/kWe has been estimated to install the gas turbine, a reasonable cost comparing with other gas turbine power plants.
Piping and insulation
As previously stated, one can not disregard the calculation of the pipes through which the fluid circulates but it is true that if they are properly insulated, low thermal losses can be achieved and therefore the idea of placing the power block at the ground level gains weight by allowing greater accessibility. The pipes which transport the fluid between the compressor and the combustion chamber have been estimated apart from the power block because of the height of the tower. This distance is estimated to be twice the height of the tower.
In the same manner as piping calculation, the insulation must be calculated also to minimize losses. At design point, outlet receiver temperature is 900 °C and due to the height of the tower, if pipes are not isolated properly, there could obtain temperatures well below 900 °C at the inlet chamber combustion, something which would cause more fuel injection to achieve the desired temperature. So the pipe insulation is essential to avoid significant energy losses. In industrial applications, one of the most widely used insulation is mineral wool thanks to its excellent efficiency and thermal resistance. As its name suggests, this is a material made from volcanic rock. This material can reach temperatures up to 1000 °C . So it is considered highly suitable for the installation. The cost of pipes is assumed as 5 €/kg for alloy 253 MA while the cost of the insulation is assumed as 6 €/kg.
47
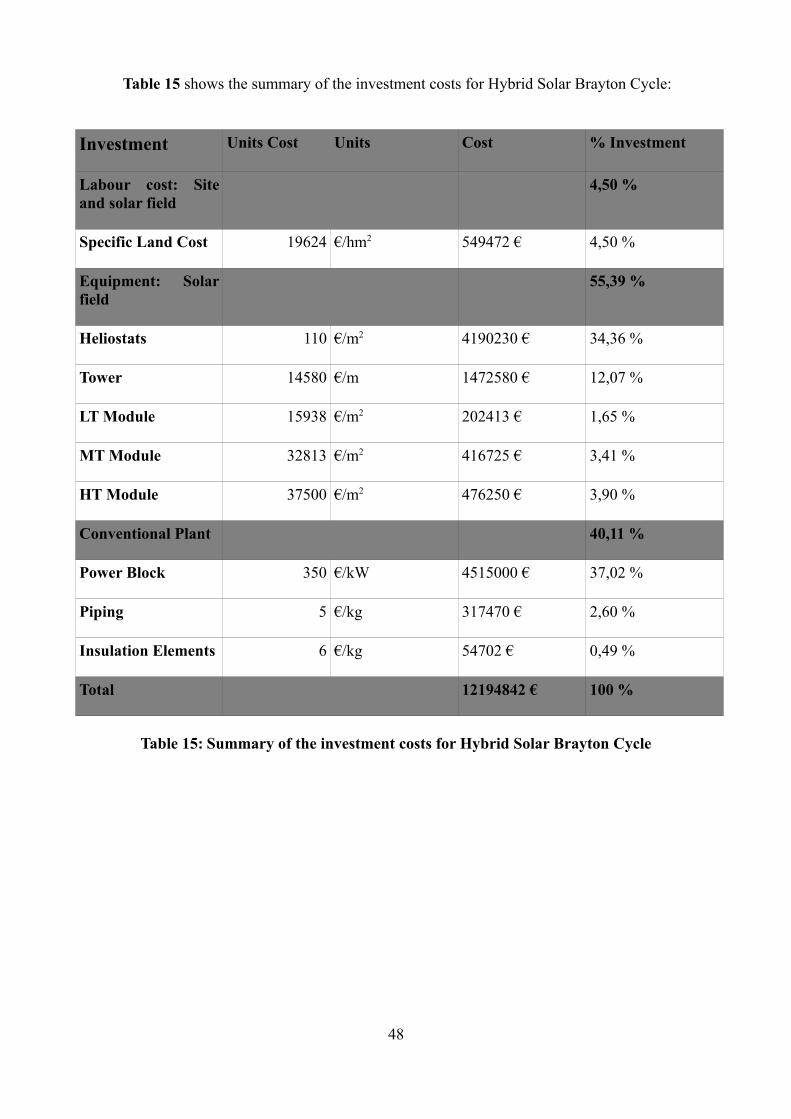
Table 15 shows the summary of the investment costs for Hybrid Solar Brayton Cycle:
Investment Units Cost Units Cost % Investment
Labour cost: Site and solar field
4,50 %
Specific Land Cost 19624 €/hm2 549472 € 4,50 %
Equipment: Solar field
55,39 %
Heliostats 110 €/m2 4190230 € 34,36 %
Tower 14580 €/m 1472580 € 12,07 %
LT Module 15938 €/m2 202413 € 1,65 %
MT Module 32813 €/m2 416725 € 3,41 %
HT Module 37500 €/m2 476250 € 3,90 %
Conventional Plant 40,11 %
Power Block 350 €/kW 4515000 € 37,02 %
Piping 5 €/kg 317470 € 2,60 %
Insulation Elements 6 €/kg 54702 € 0,49 %
Total 12194842 € 100 %
Table 15: Summary of the investment costs for Hybrid Solar Brayton Cycle
48
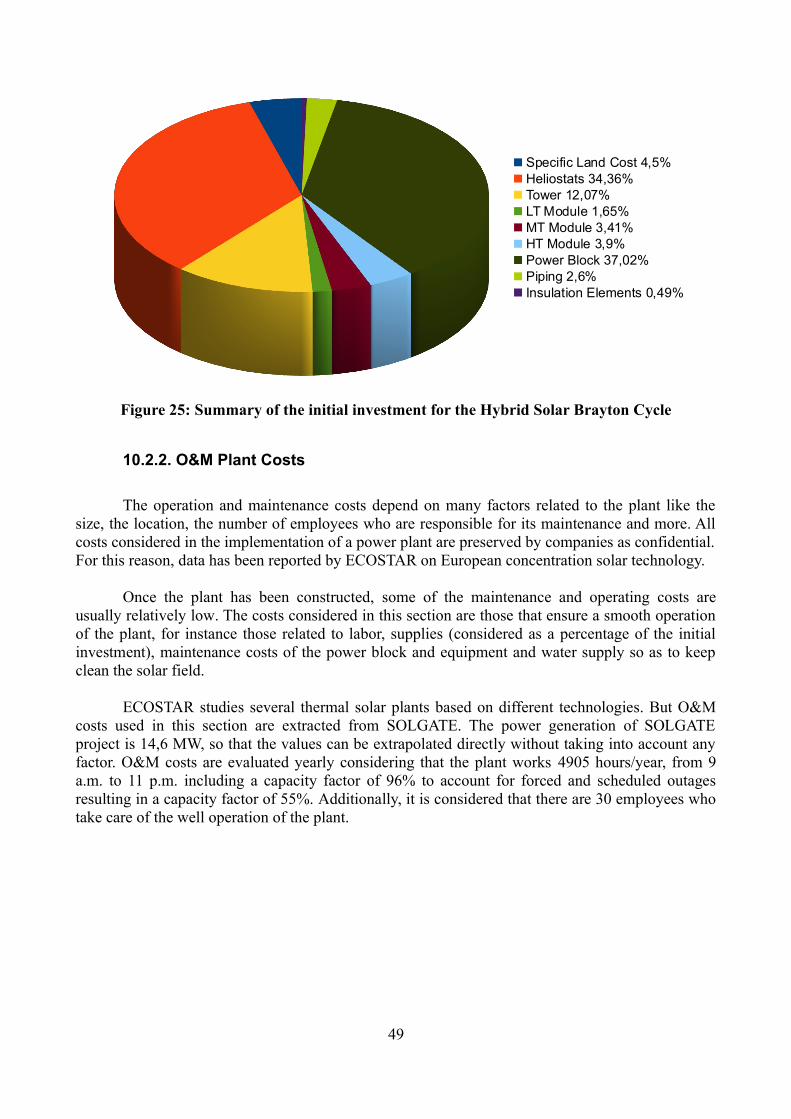
Figure 25: Summary of the initial investment for the Hybrid Solar Brayton Cycle
10.2.2. O&M Plant Costs
The operation and maintenance costs depend on many factors related to the plant like the size, the location, the number of employees who are responsible for its maintenance and more. All costs considered in the implementation of a power plant are preserved by companies as confidential. For this reason, data has been reported by ECOSTAR on European concentration solar technology.
Once the plant has been constructed, some of the maintenance and operating costs are usually relatively low. The costs considered in this section are those that ensure a smooth operation of the plant, for instance those related to labor, supplies (considered as a percentage of the initial investment), maintenance costs of the power block and equipment and water supply so as to keep clean the solar field.
ECOSTAR studies several thermal solar plants based on different technologies. But O&M costs used in this section are extracted from SOLGATE. The power generation of SOLGATE project is 14,6 MW, so that the values can be extrapolated directly without taking into account any factor. O&M costs are evaluated yearly considering that the plant works 4905 hours/year, from 9 a.m. to 11 p.m. including a capacity factor of 96% to account for forced and scheduled outages resulting in a capacity factor of 55%. Additionally, it is considered that there are 30 employees who take care of the well operation of the plant.
49
Specific Land Cost 4,5%Heliostats 34,36%Tower 12,07%LT Module 1,65%MT Module 3,41%HT Module 3,9%Power Block 37,02%Piping 2,6%Insulation Elements 0,49%
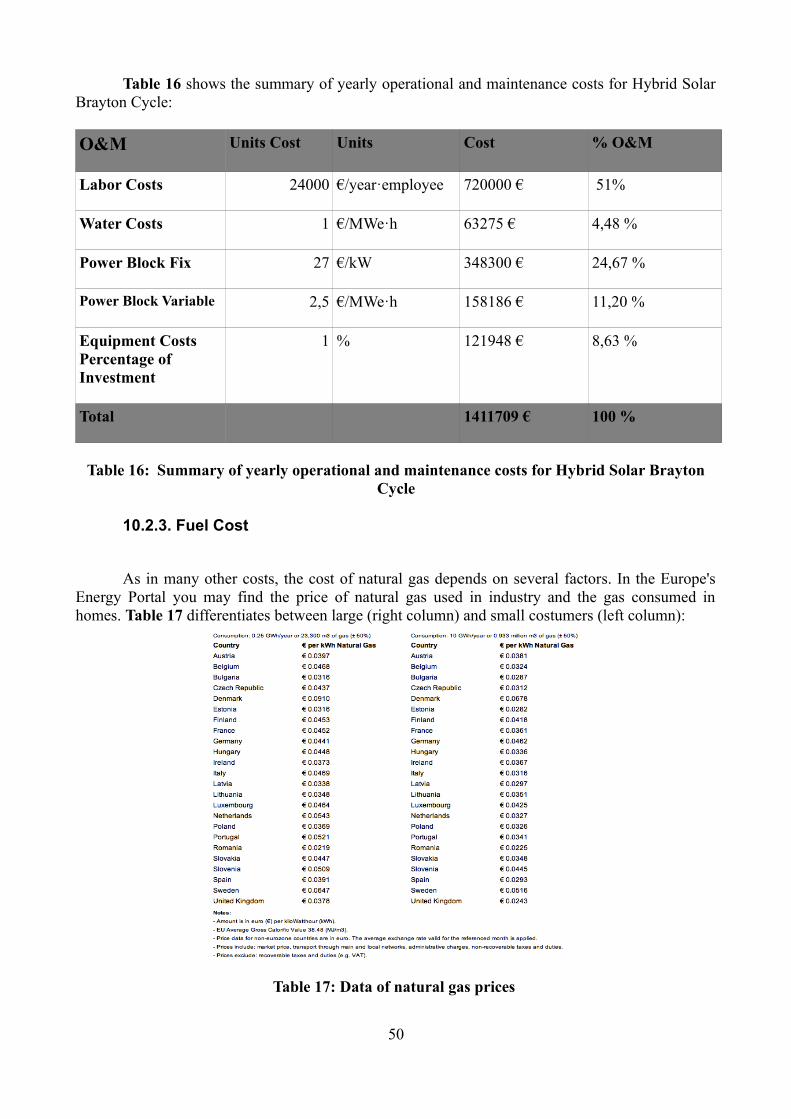
Table 16 shows the summary of yearly operational and maintenance costs for Hybrid Solar Brayton Cycle:
O&M Units Cost Units Cost % O&M
Labor Costs 24000 €/year·employee 720000 € 51%
Water Costs 1 €/MWe·h 63275 € 4,48 %
Power Block Fix 27 €/kW 348300 € 24,67 %
Power Block Variable 2,5 €/MWe·h 158186 € 11,20 %
Equipment Costs Percentage of Investment
1 % 121948 € 8,63 %
Total 1411709 € 100 %
Table 16: Summary of yearly operational and maintenance costs for Hybrid Solar Brayton Cycle
10.2.3. Fuel Cost
As in many other costs, the cost of natural gas depends on several factors. In the Europe's Energy Portal you may find the price of natural gas used in industry and the gas consumed in homes. Table 17 differentiates between large (right column) and small costumers (left column):
Table 17: Data of natural gas prices
50
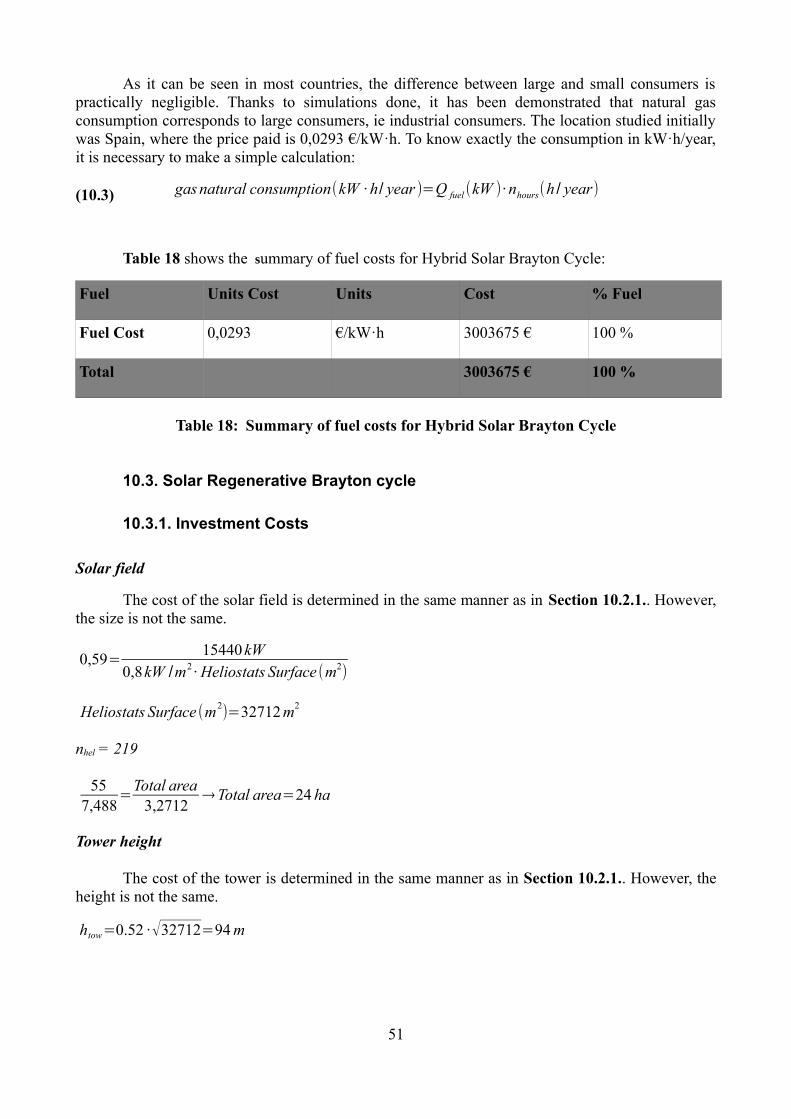
As it can be seen in most countries, the difference between large and small consumers is practically negligible. Thanks to simulations done, it has been demonstrated that natural gas consumption corresponds to large consumers, ie industrial consumers. The location studied initially was Spain, where the price paid is 0,0293 €/kW·h. To know exactly the consumption in kW·h/year, it is necessary to make a simple calculation:
(10.3) gas natural consumption(kW · h/ year )=Q fuel(kW )· nhours(h / year)
Table 18 shows the summary of fuel costs for Hybrid Solar Brayton Cycle:
Fuel Units Cost Units Cost % Fuel
Fuel Cost 0,0293 €/kW·h 3003675 € 100 %
Total 3003675 € 100 %
Table 18: Summary of fuel costs for Hybrid Solar Brayton Cycle
10.3. Solar Regenerative Brayton cycle
10.3.1. Investment Costs
Solar field
The cost of the solar field is determined in the same manner as in Section 10.2.1.. However, the size is not the same.
0,59= 15440 kW0,8kW /m2· Heliostats Surface (m2)
Heliostats Surface (m2)=32712 m2
nhel = 219
557,488
=Total area3,2712
→Total area=24 ha
Tower height
The cost of the tower is determined in the same manner as in Section 10.2.1.. However, the height is not the same.
htow=0.52 ·√32712=94 m
51
Receiver
The cost of the receiver is determined in the same manner as in Section 10.2.1.. However, the area is not the same.
Arec=Asf
1000=32,7 m2 → Amod=10,9 m2
Power Block
In this case, the only new element introduced is the heat exchanger. The vast majority of heat exchangers used in the industry are shell and tube type. They recover the heat from the exhaust gas turbine gases to cease it to the cold stream so as to increase its enthalpy. To evaluate this cost, the price is calculated depending on the area. National Energy Technology Center made a report of Process Equipment Cost Estimation [31]. It presents generic cost curves for different equipment using ICARUS Process Evaluator. The curves give an approximation of the cost. As stated before costs are generic, so this curve gives a general idea of the approximate cost. But the curve shown in Graphic 1, corresponds to specific properties calculated for a determined exchanger with the following characteristics:
Shell Temperature: 345 °C Tube Temperature: 345 °CShell Pressure: 10,3 bar Tube Pressure: 10,3 bar
Tube Length: 10–20 feet Tube Diameter: 1 inch = 0,0254 m
As it is seen, properties shown above are not the same as the ones calculated with IPSE. Despite this fact, the same Graphic is used so as to estimate the exchanger cost. In the simulation done with IPSE, following values are extracted:
Shell Temperature: 605 °C Tube Temperature: 439 °C Shell Pressure: 1,07 bar Tube Pressure: 16,90 bar
To estimate the cost, the exchanger area is crucial. The size of the exchanger is defined as the total outside surface area of the tube bundle. Before calculating the area, some heat transfer formulas are necessary, considering that the exchanger operates countercurrently:
(10.4) q=U · A ·T log
Where: q is the heat recovered by the heat exchanger U is the global heat transfer coefficient A is the total outside surface area of the tube bundle Tlog is the logarithmic mean temperature difference
(10.5) q= ˙mturbine ·(hinlet−houtlet)
Where: mturbine is the mass flow expanded in the gas turbine hinlet the enthalpy of the gases at the inlet of the heat exchanger houtlet the enthalpy of the gases at the outlet of the heat exchanger
52
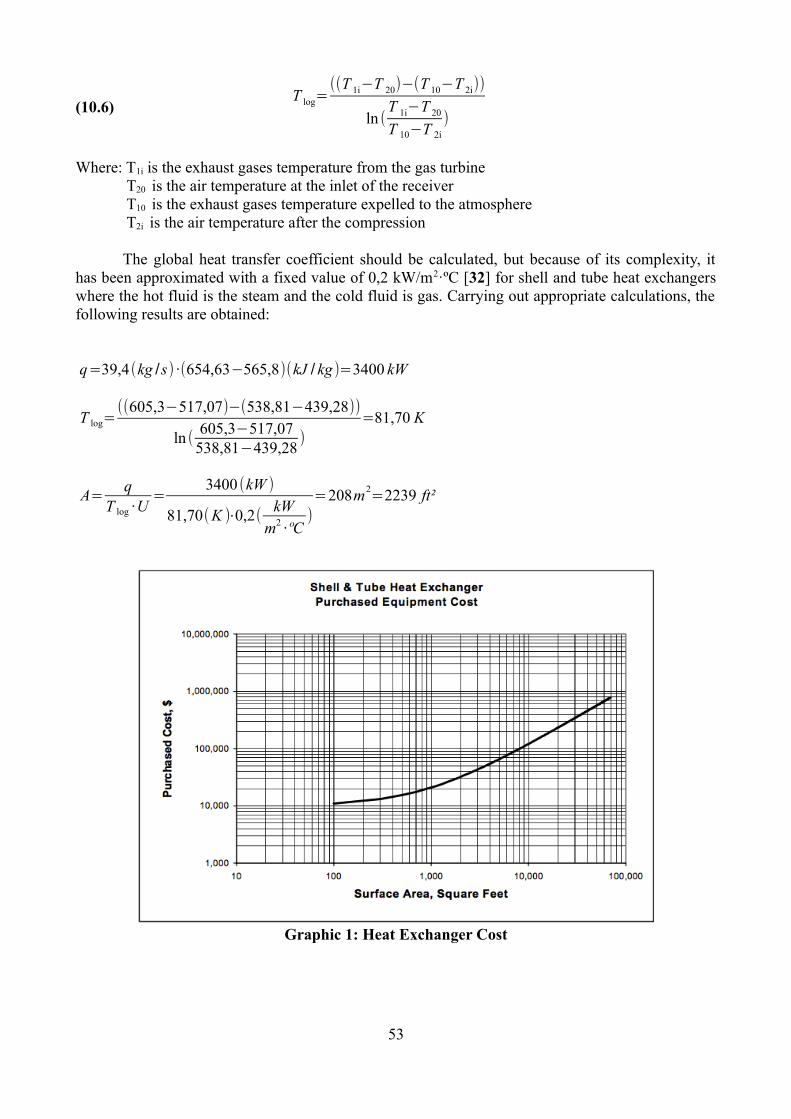
(10.6) T log=
((T 1i−T 20)−(T 10−T 2i))
ln (T 1i−T 20
T 10−T 2i
)
Where: T1i is the exhaust gases temperature from the gas turbine T20 is the air temperature at the inlet of the receiver T10 is the exhaust gases temperature expelled to the atmosphere T2i is the air temperature after the compression
The global heat transfer coefficient should be calculated, but because of its complexity, it has been approximated with a fixed value of 0,2 kW/m2·ºC [32] for shell and tube heat exchangers where the hot fluid is the steam and the cold fluid is gas. Carrying out appropriate calculations, the following results are obtained:
q=39,4(kg /s) ·(654,63−565,8)(kJ / kg )=3400 kW
T log=((605,3−517,07)−(538,81−439,28))
ln ( 605,3−517,07538,81−439,28
)=81,70 K
A= qT log ·U
=3400 (kW )
81,70(K )⋅0,2( kWm2 ·ºC
)=208m2=2239 ft²
Graphic 1: Heat Exchanger Cost
53
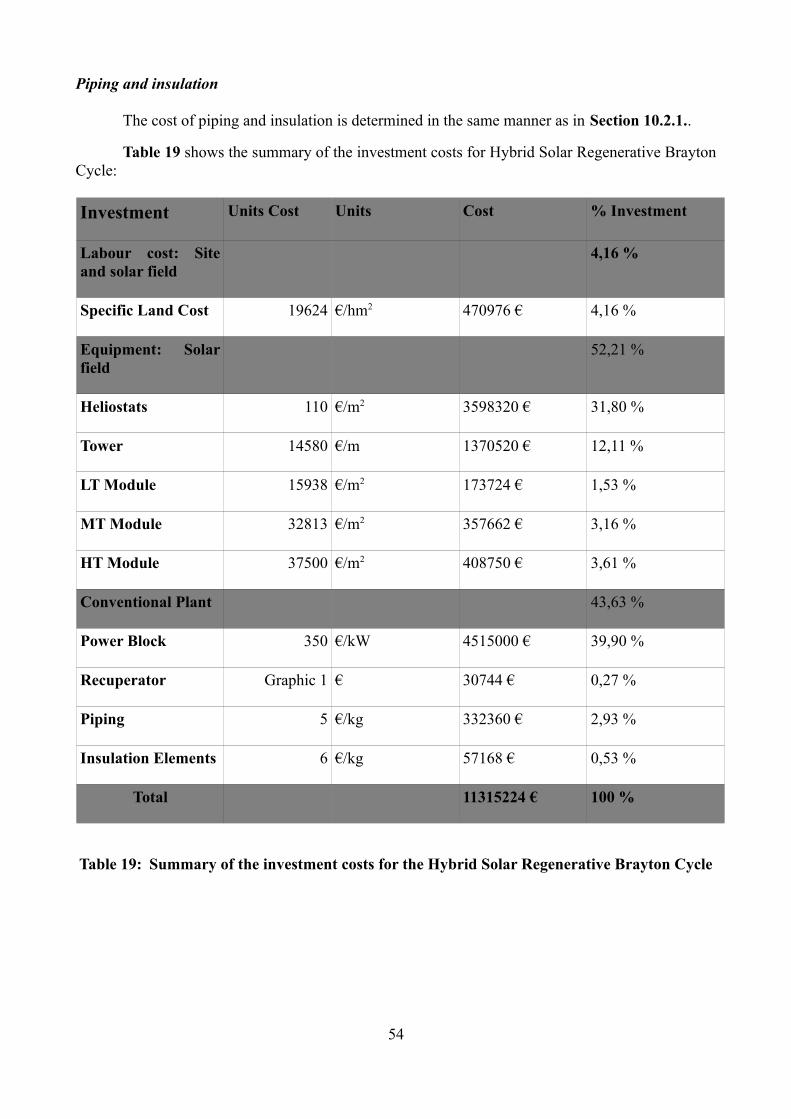
Piping and insulation
The cost of piping and insulation is determined in the same manner as in Section 10.2.1..
Table 19 shows the summary of the investment costs for Hybrid Solar Regenerative Brayton Cycle:
Investment Units Cost Units Cost % Investment
Labour cost: Site and solar field
4,16 %
Specific Land Cost 19624 €/hm2 470976 € 4,16 %
Equipment: Solar field
52,21 %
Heliostats 110 €/m2 3598320 € 31,80 %
Tower 14580 €/m 1370520 € 12,11 %
LT Module 15938 €/m2 173724 € 1,53 %
MT Module 32813 €/m2 357662 € 3,16 %
HT Module 37500 €/m2 408750 € 3,61 %
Conventional Plant 43,63 %
Power Block 350 €/kW 4515000 € 39,90 %
Recuperator Graphic 1 € 30744 € 0,27 %
Piping 5 €/kg 332360 € 2,93 %
Insulation Elements 6 €/kg 57168 € 0,53 %
Total 11315224 € 100 %
Table 19: Summary of the investment costs for the Hybrid Solar Regenerative Brayton Cycle
54
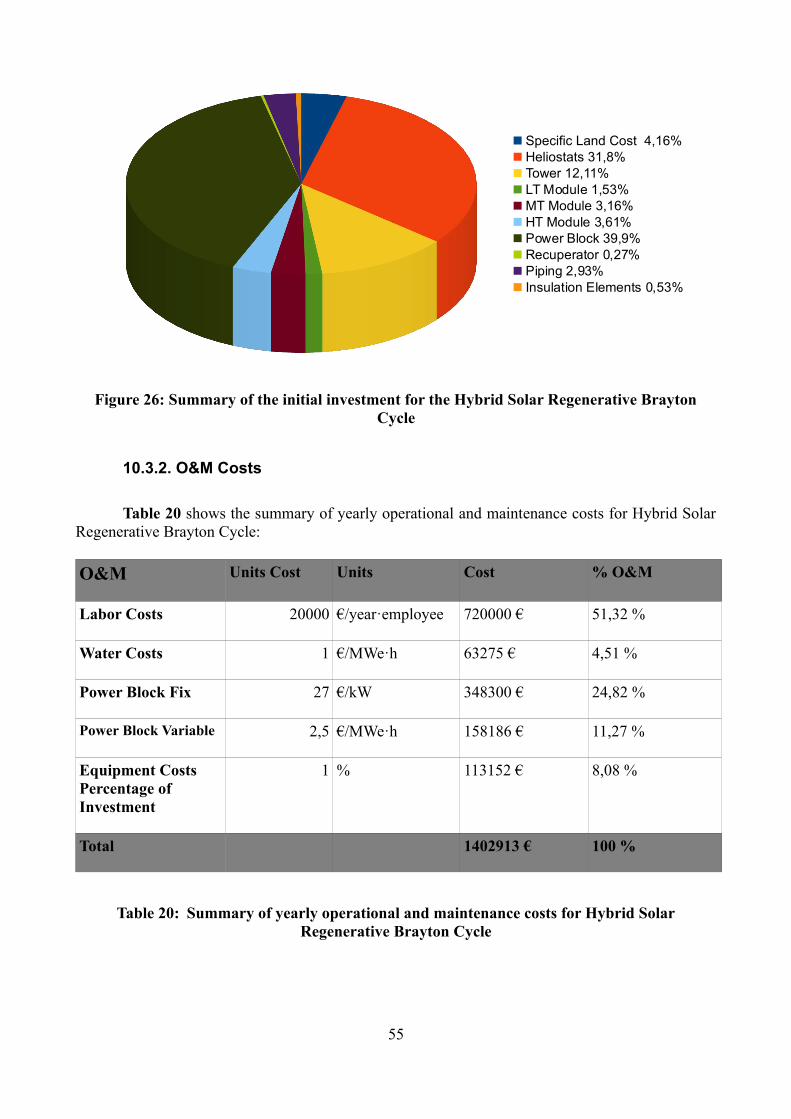
Figure 26: Summary of the initial investment for the Hybrid Solar Regenerative Brayton Cycle
10.3.2. O&M Costs
Table 20 shows the summary of yearly operational and maintenance costs for Hybrid Solar Regenerative Brayton Cycle:
O&M Units Cost Units Cost % O&M
Labor Costs 20000 €/year·employee 720000 € 51,32 %
Water Costs 1 €/MWe·h 63275 € 4,51 %
Power Block Fix 27 €/kW 348300 € 24,82 %
Power Block Variable 2,5 €/MWe·h 158186 € 11,27 %
Equipment Costs Percentage of Investment
1 % 113152 € 8,08 %
Total 1402913 € 100 %
Table 20: Summary of yearly operational and maintenance costs for Hybrid Solar Regenerative Brayton Cycle
55
Specific Land Cost 4,16%Heliostats 31,8%Tower 12,11%LT Module 1,53%MT Module 3,16%HT Module 3,61%Power Block 39,9%Recuperator 0,27%Piping 2,93%Insulation Elements 0,53%
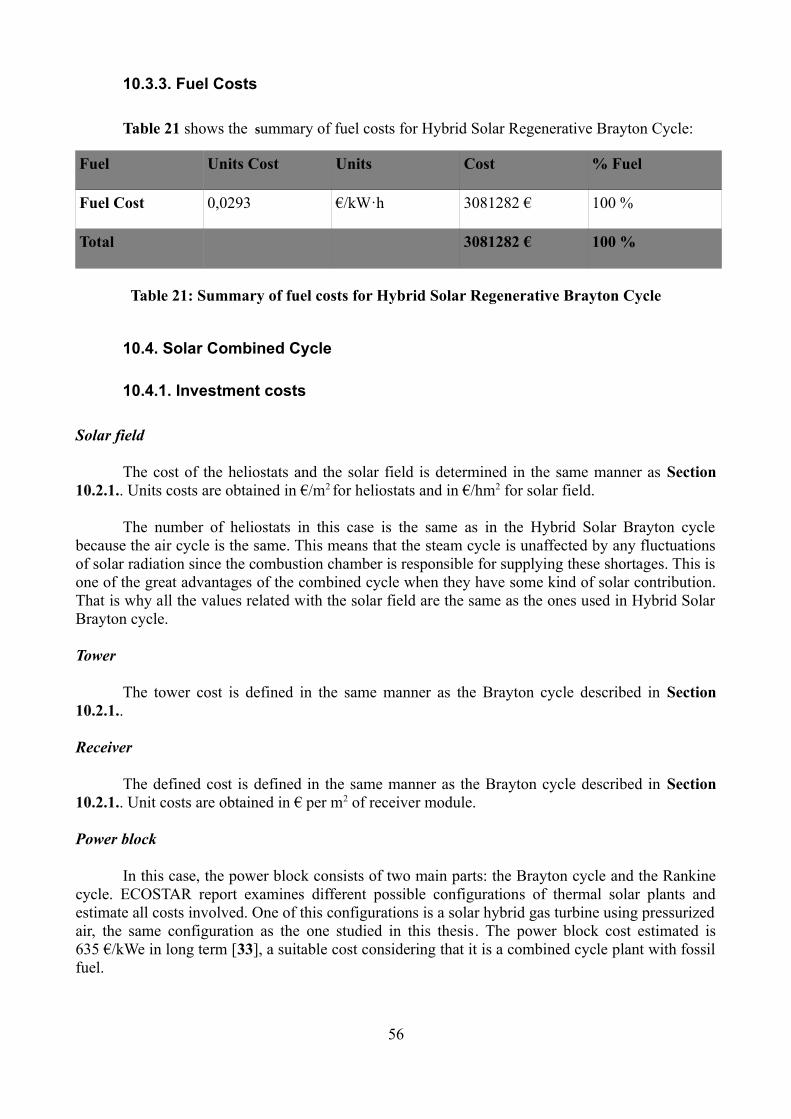
10.3.3. Fuel Costs
Table 21 shows the summary of fuel costs for Hybrid Solar Regenerative Brayton Cycle:
Fuel Units Cost Units Cost % Fuel
Fuel Cost 0,0293 €/kW·h 3081282 € 100 %
Total 3081282 € 100 %
Table 21: Summary of fuel costs for Hybrid Solar Regenerative Brayton Cycle
10.4. Solar Combined Cycle
10.4.1. Investment costs
Solar field
The cost of the heliostats and the solar field is determined in the same manner as Section 10.2.1.. Units costs are obtained in €/m2 for heliostats and in €/hm2 for solar field.
The number of heliostats in this case is the same as in the Hybrid Solar Brayton cycle because the air cycle is the same. This means that the steam cycle is unaffected by any fluctuations of solar radiation since the combustion chamber is responsible for supplying these shortages. This is one of the great advantages of the combined cycle when they have some kind of solar contribution. That is why all the values related with the solar field are the same as the ones used in Hybrid Solar Brayton cycle.
Tower
The tower cost is defined in the same manner as the Brayton cycle described in Section 10.2.1..
Receiver
The defined cost is defined in the same manner as the Brayton cycle described in Section 10.2.1.. Unit costs are obtained in € per m2 of receiver module.
Power block
In this case, the power block consists of two main parts: the Brayton cycle and the Rankine cycle. ECOSTAR report examines different possible configurations of thermal solar plants and estimate all costs involved. One of this configurations is a solar hybrid gas turbine using pressurized air, the same configuration as the one studied in this thesis. The power block cost estimated is 635 €/kWe in long term [33], a suitable cost considering that it is a combined cycle plant with fossil fuel.
56
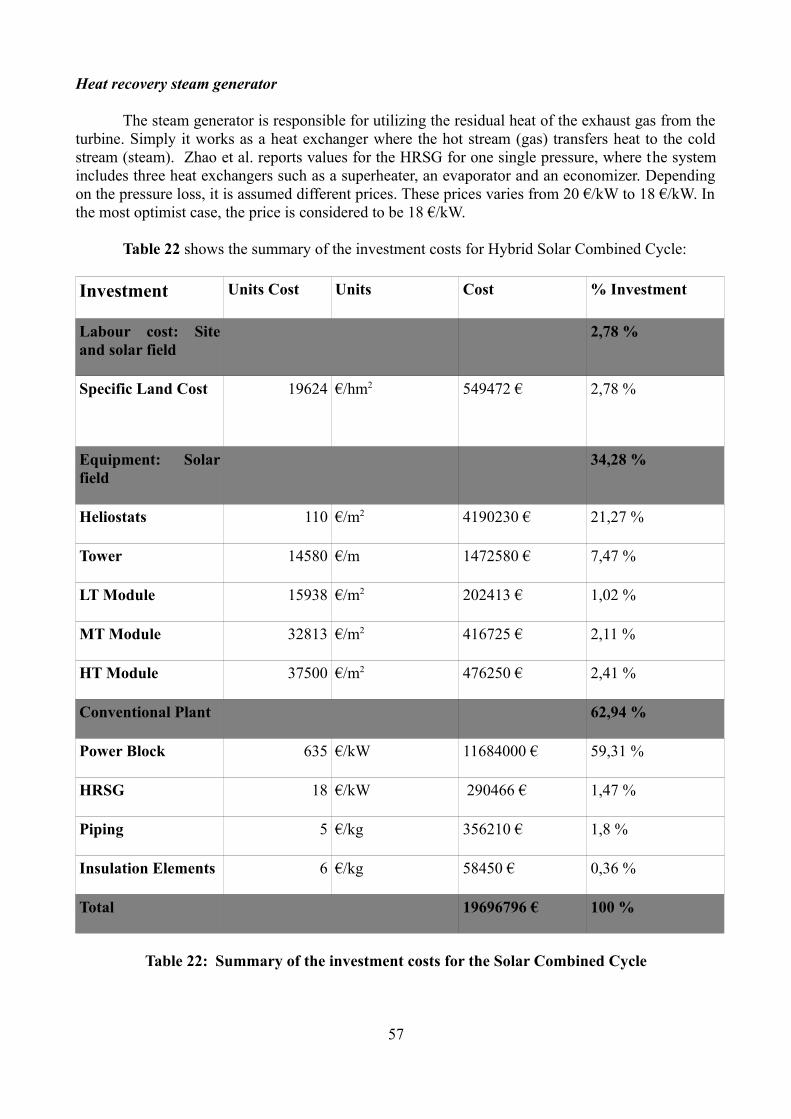
Heat recovery steam generator
The steam generator is responsible for utilizing the residual heat of the exhaust gas from the turbine. Simply it works as a heat exchanger where the hot stream (gas) transfers heat to the cold stream (steam). Zhao et al. reports values for the HRSG for one single pressure, where the system includes three heat exchangers such as a superheater, an evaporator and an economizer. Depending on the pressure loss, it is assumed different prices. These prices varies from 20 €/kW to 18 €/kW. In the most optimist case, the price is considered to be 18 €/kW.
Table 22 shows the summary of the investment costs for Hybrid Solar Combined Cycle:
Investment Units Cost Units Cost % Investment
Labour cost: Site and solar field
2,78 %
Specific Land Cost 19624 €/hm2 549472 € 2,78 %
Equipment: Solar field
34,28 %
Heliostats 110 €/m2 4190230 € 21,27 %
Tower 14580 €/m 1472580 € 7,47 %
LT Module 15938 €/m2 202413 € 1,02 %
MT Module 32813 €/m2 416725 € 2,11 %
HT Module 37500 €/m2 476250 € 2,41 %
Conventional Plant 62,94 %
Power Block 635 €/kW 11684000 € 59,31 %
HRSG 18 €/kW 290466 € 1,47 %
Piping 5 €/kg 356210 € 1,8 %
Insulation Elements 6 €/kg 58450 € 0,36 %
Total 19696796 € 100 %
Table 22: Summary of the investment costs for the Solar Combined Cycle
57
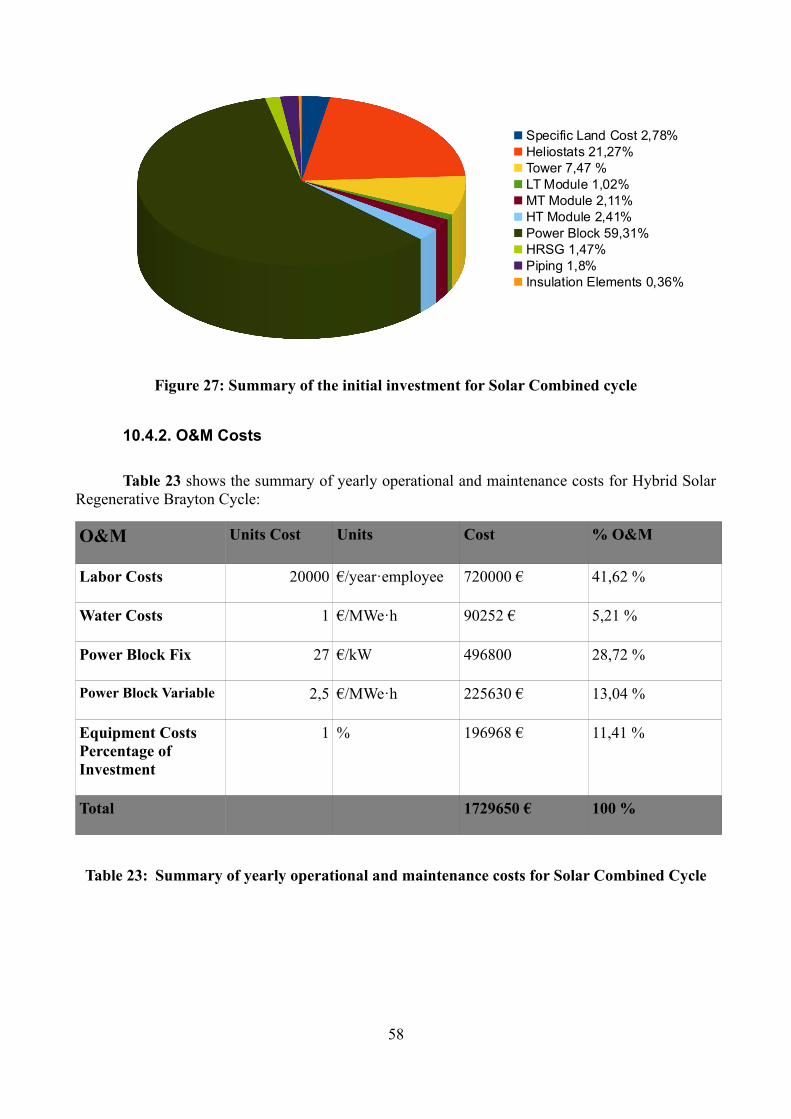
Figure 27: Summary of the initial investment for Solar Combined cycle
10.4.2. O&M Costs
Table 23 shows the summary of yearly operational and maintenance costs for Hybrid Solar Regenerative Brayton Cycle:
O&M Units Cost Units Cost % O&M
Labor Costs 20000 €/year·employee 720000 € 41,62 %
Water Costs 1 €/MWe·h 90252 € 5,21 %
Power Block Fix 27 €/kW 496800 28,72 %
Power Block Variable 2,5 €/MWe·h 225630 € 13,04 %
Equipment Costs Percentage of Investment
1 % 196968 € 11,41 %
Total 1729650 € 100 %
Table 23: Summary of yearly operational and maintenance costs for Solar Combined Cycle
58
Specific Land Cost 2,78%Heliostats 21,27%Tower 7,47 %LT Module 1,02%MT Module 2,11%HT Module 2,41%Power Block 59,31%HRSG 1,47%Piping 1,8%Insulation Elements 0,36%
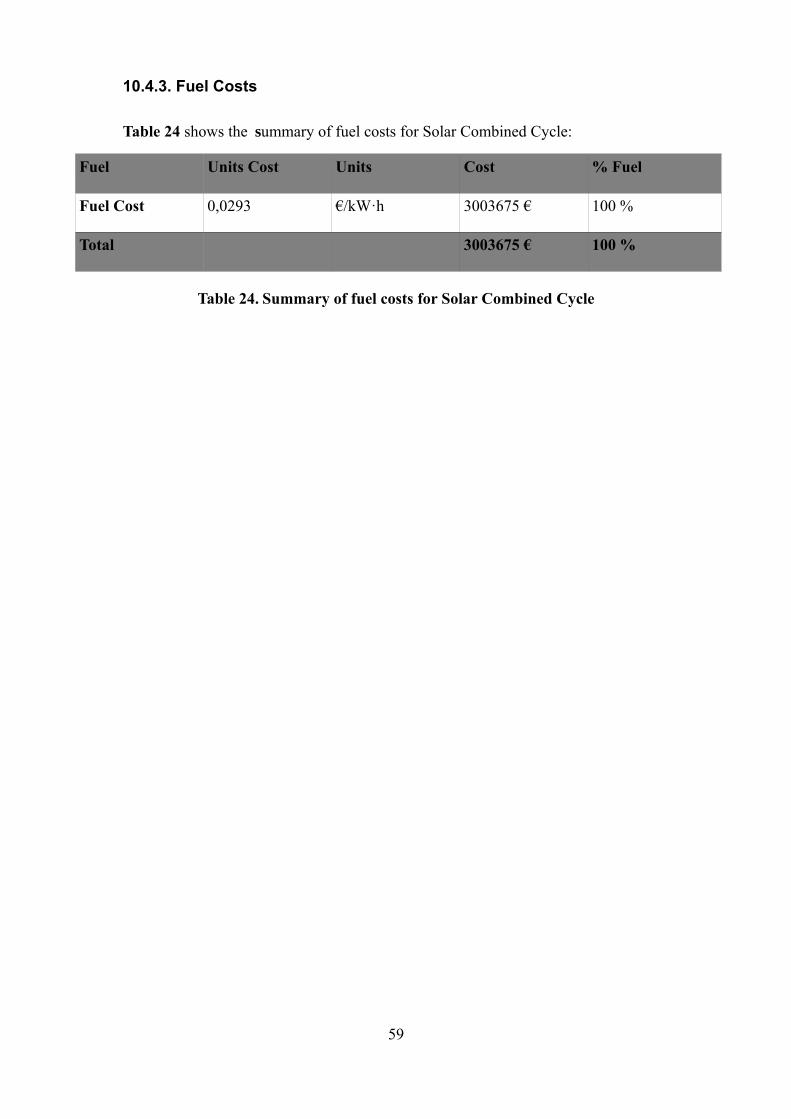
10.4.3. Fuel Costs
Table 24 shows the summary of fuel costs for Solar Combined Cycle:
Fuel Units Cost Units Cost % Fuel
Fuel Cost 0,0293 €/kW·h 3003675 € 100 %
Total 3003675 € 100 %
Table 24. Summary of fuel costs for Solar Combined Cycle
59
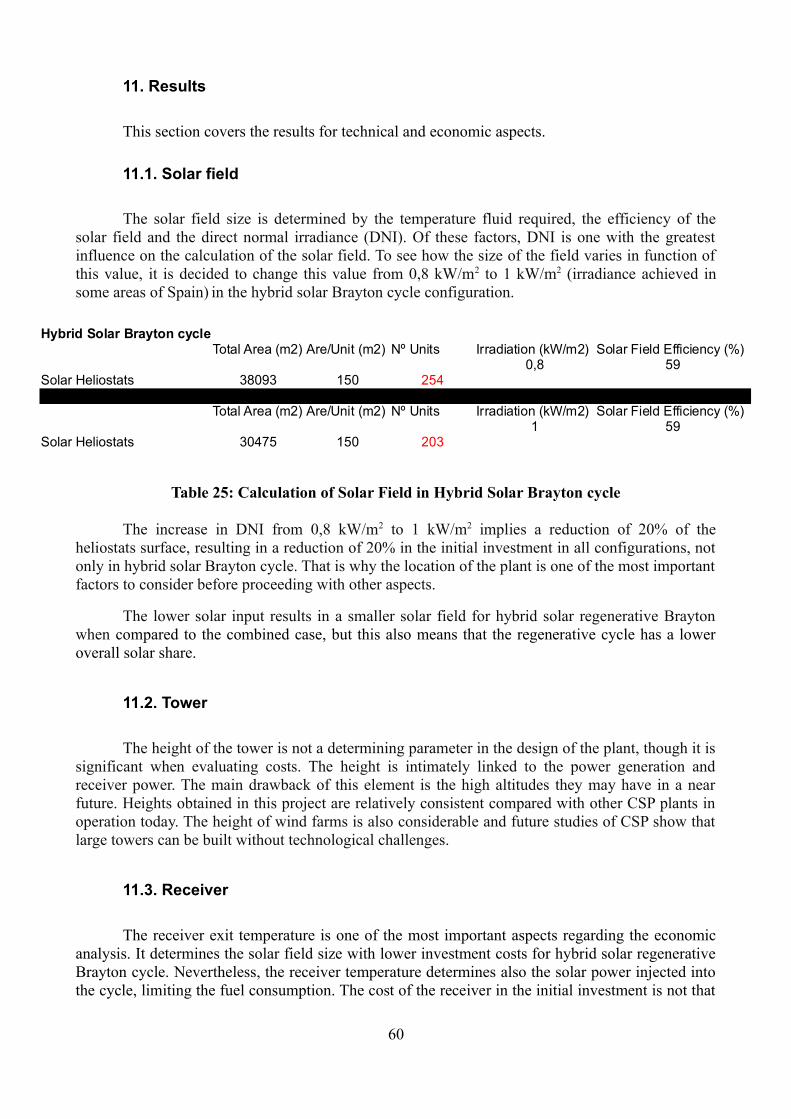
11. Results
This section covers the results for technical and economic aspects.
11.1. Solar field
The solar field size is determined by the temperature fluid required, the efficiency of the solar field and the direct normal irradiance (DNI). Of these factors, DNI is one with the greatest influence on the calculation of the solar field. To see how the size of the field varies in function of this value, it is decided to change this value from 0,8 kW/m2 to 1 kW/m2 (irradiance achieved in some areas of Spain) in the hybrid solar Brayton cycle configuration.
Table 25: Calculation of Solar Field in Hybrid Solar Brayton cycle
The increase in DNI from 0,8 kW/m2 to 1 kW/m2 implies a reduction of 20% of the heliostats surface, resulting in a reduction of 20% in the initial investment in all configurations, not only in hybrid solar Brayton cycle. That is why the location of the plant is one of the most important factors to consider before proceeding with other aspects.
The lower solar input results in a smaller solar field for hybrid solar regenerative Brayton when compared to the combined case, but this also means that the regenerative cycle has a lower overall solar share.
11.2. Tower
The height of the tower is not a determining parameter in the design of the plant, though it is significant when evaluating costs. The height is intimately linked to the power generation and receiver power. The main drawback of this element is the high altitudes they may have in a near future. Heights obtained in this project are relatively consistent compared with other CSP plants in operation today. The height of wind farms is also considerable and future studies of CSP show that large towers can be built without technological challenges.
11.3. Receiver
The receiver exit temperature is one of the most important aspects regarding the economic analysis. It determines the solar field size with lower investment costs for hybrid solar regenerative Brayton cycle. Nevertheless, the receiver temperature determines also the solar power injected into the cycle, limiting the fuel consumption. The cost of the receiver in the initial investment is not that
60
Hybrid Solar Brayton cycleTotal Area (m2) Are/Unit (m2) Nº Units Irradiation (kW/m2) Solar Field Efficiency (%)
0,8 59Solar Heliostats 38093 150 254
Total Area (m2) Are/Unit (m2) Nº Units Irradiation (kW/m2) Solar Field Efficiency (%)1 59
Solar Heliostats 30475 150 203
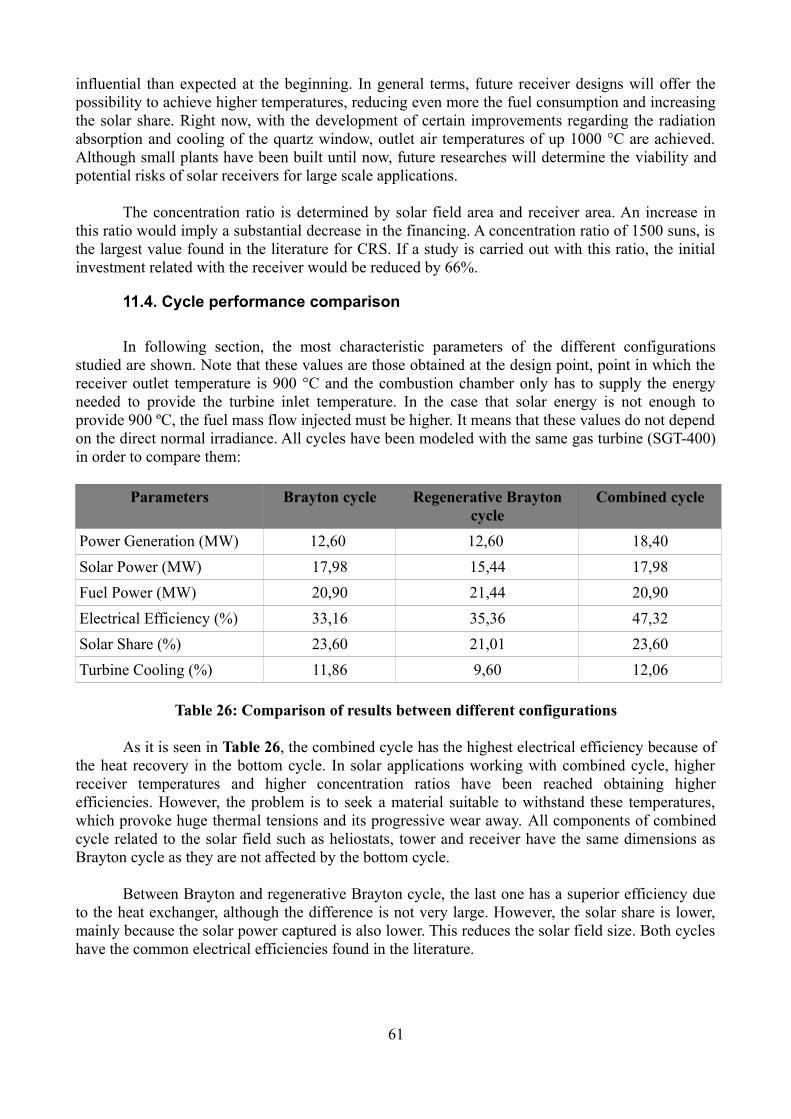
influential than expected at the beginning. In general terms, future receiver designs will offer the possibility to achieve higher temperatures, reducing even more the fuel consumption and increasing the solar share. Right now, with the development of certain improvements regarding the radiation absorption and cooling of the quartz window, outlet air temperatures of up 1000 °C are achieved. Although small plants have been built until now, future researches will determine the viability and potential risks of solar receivers for large scale applications.
The concentration ratio is determined by solar field area and receiver area. An increase in this ratio would imply a substantial decrease in the financing. A concentration ratio of 1500 suns, is the largest value found in the literature for CRS. If a study is carried out with this ratio, the initial investment related with the receiver would be reduced by 66%.
11.4. Cycle performance comparison
In following section, the most characteristic parameters of the different configurations studied are shown. Note that these values are those obtained at the design point, point in which the receiver outlet temperature is 900 °C and the combustion chamber only has to supply the energy needed to provide the turbine inlet temperature. In the case that solar energy is not enough to provide 900 ºC, the fuel mass flow injected must be higher. It means that these values do not depend on the direct normal irradiance. All cycles have been modeled with the same gas turbine (SGT-400) in order to compare them:
Parameters Brayton cycle Regenerative Brayton cycle
Combined cycle
Power Generation (MW) 12,60 12,60 18,40
Solar Power (MW) 17,98 15,44 17,98
Fuel Power (MW) 20,90 21,44 20,90
Electrical Efficiency (%) 33,16 35,36 47,32
Solar Share (%) 23,60 21,01 23,60
Turbine Cooling (%) 11,86 9,60 12,06
Table 26: Comparison of results between different configurations
As it is seen in Table 26, the combined cycle has the highest electrical efficiency because of the heat recovery in the bottom cycle. In solar applications working with combined cycle, higher receiver temperatures and higher concentration ratios have been reached obtaining higher efficiencies. However, the problem is to seek a material suitable to withstand these temperatures, which provoke huge thermal tensions and its progressive wear away. All components of combined cycle related to the solar field such as heliostats, tower and receiver have the same dimensions as Brayton cycle as they are not affected by the bottom cycle.
Between Brayton and regenerative Brayton cycle, the last one has a superior efficiency due to the heat exchanger, although the difference is not very large. However, the solar share is lower, mainly because the solar power captured is also lower. This reduces the solar field size. Both cycles have the common electrical efficiencies found in the literature.
61
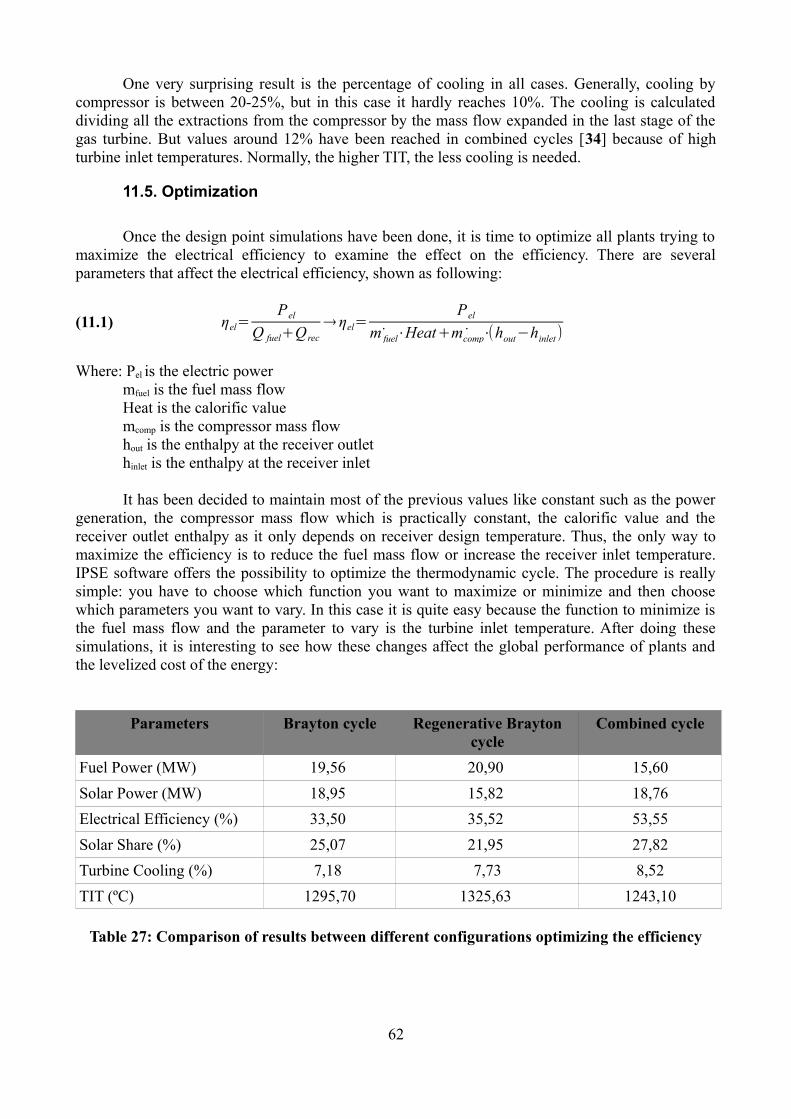
One very surprising result is the percentage of cooling in all cases. Generally, cooling by compressor is between 20-25%, but in this case it hardly reaches 10%. The cooling is calculated dividing all the extractions from the compressor by the mass flow expanded in the last stage of the gas turbine. But values around 12% have been reached in combined cycles [34] because of high turbine inlet temperatures. Normally, the higher TIT, the less cooling is needed.
11.5. Optimization
Once the design point simulations have been done, it is time to optimize all plants trying to maximize the electrical efficiency to examine the effect on the efficiency. There are several parameters that affect the electrical efficiency, shown as following:
(11.1) ηel=Pel
Q fuel+Qrec
→ηel=Pel
˙m fuel⋅Heat+ ˙mcomp⋅(hout−hinlet)
Where: Pel is the electric powermfuel is the fuel mass flowHeat is the calorific valuemcomp is the compressor mass flowhout is the enthalpy at the receiver outlethinlet is the enthalpy at the receiver inlet
It has been decided to maintain most of the previous values like constant such as the power generation, the compressor mass flow which is practically constant, the calorific value and the receiver outlet enthalpy as it only depends on receiver design temperature. Thus, the only way to maximize the efficiency is to reduce the fuel mass flow or increase the receiver inlet temperature. IPSE software offers the possibility to optimize the thermodynamic cycle. The procedure is really simple: you have to choose which function you want to maximize or minimize and then choose which parameters you want to vary. In this case it is quite easy because the function to minimize is the fuel mass flow and the parameter to vary is the turbine inlet temperature. After doing these simulations, it is interesting to see how these changes affect the global performance of plants and the levelized cost of the energy:
Parameters Brayton cycle Regenerative Brayton cycle
Combined cycle
Fuel Power (MW) 19,56 20,90 15,60
Solar Power (MW) 18,95 15,82 18,76
Electrical Efficiency (%) 33,50 35,52 53,55
Solar Share (%) 25,07 21,95 27,82
Turbine Cooling (%) 7,18 7,73 8,52
TIT (ºC) 1295,70 1325,63 1243,10
Table 27: Comparison of results between different configurations optimizing the efficiency
62
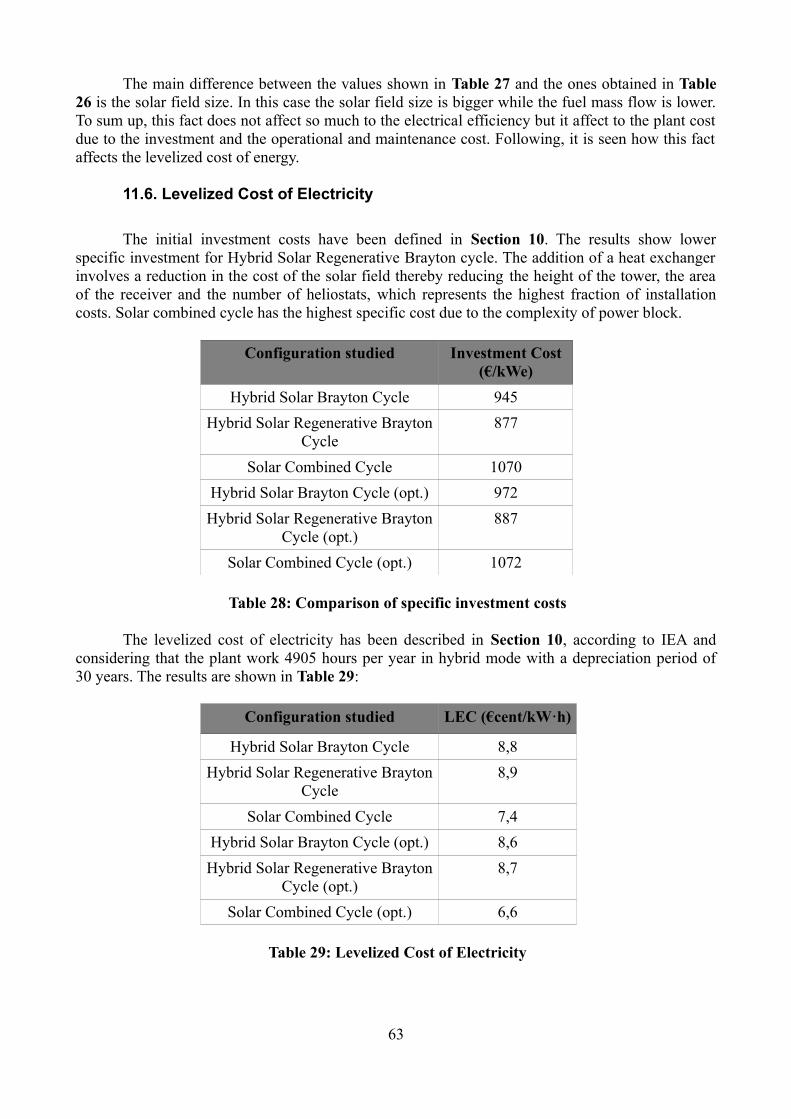
The main difference between the values shown in Table 27 and the ones obtained in Table 26 is the solar field size. In this case the solar field size is bigger while the fuel mass flow is lower. To sum up, this fact does not affect so much to the electrical efficiency but it affect to the plant cost due to the investment and the operational and maintenance cost. Following, it is seen how this fact affects the levelized cost of energy.
11.6. Levelized Cost of Electricity
The initial investment costs have been defined in Section 10. The results show lower specific investment for Hybrid Solar Regenerative Brayton cycle. The addition of a heat exchanger involves a reduction in the cost of the solar field thereby reducing the height of the tower, the area of the receiver and the number of heliostats, which represents the highest fraction of installation costs. Solar combined cycle has the highest specific cost due to the complexity of power block.
Configuration studied Investment Cost (€/kWe)
Hybrid Solar Brayton Cycle 945
Hybrid Solar Regenerative Brayton Cycle
877
Solar Combined Cycle 1070
Hybrid Solar Brayton Cycle (opt.) 972
Hybrid Solar Regenerative Brayton Cycle (opt.)
887
Solar Combined Cycle (opt.) 1072
Table 28: Comparison of specific investment costs
The levelized cost of electricity has been described in Section 10, according to IEA and considering that the plant work 4905 hours per year in hybrid mode with a depreciation period of 30 years. The results are shown in Table 29:
Configuration studied LEC (€cent/kW·h)
Hybrid Solar Brayton Cycle 8,8
Hybrid Solar Regenerative Brayton Cycle
8,9
Solar Combined Cycle 7,4
Hybrid Solar Brayton Cycle (opt.) 8,6
Hybrid Solar Regenerative Brayton Cycle (opt.)
8,7
Solar Combined Cycle (opt.) 6,6
Table 29: Levelized Cost of Electricity
63
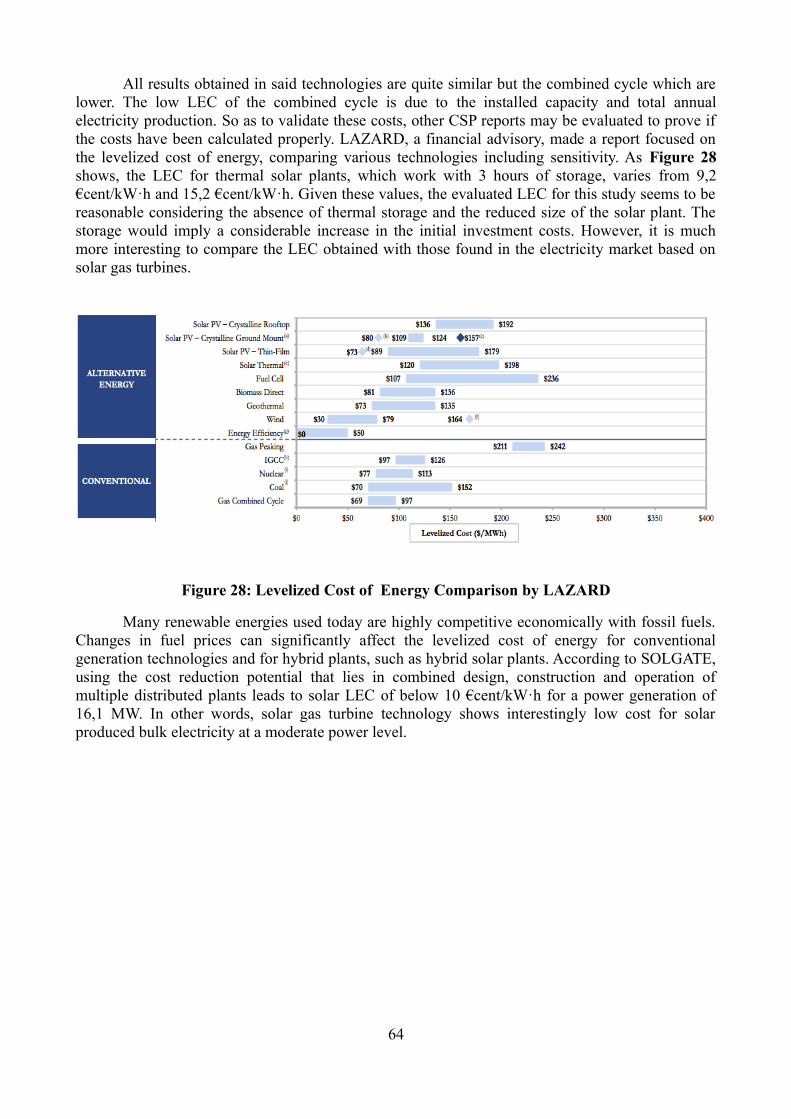
All results obtained in said technologies are quite similar but the combined cycle which are lower. The low LEC of the combined cycle is due to the installed capacity and total annual electricity production. So as to validate these costs, other CSP reports may be evaluated to prove if the costs have been calculated properly. LAZARD, a financial advisory, made a report focused on the levelized cost of energy, comparing various technologies including sensitivity. As Figure 28 shows, the LEC for thermal solar plants, which work with 3 hours of storage, varies from 9,2 €cent/kW·h and 15,2 €cent/kW·h. Given these values, the evaluated LEC for this study seems to be reasonable considering the absence of thermal storage and the reduced size of the solar plant. The storage would imply a considerable increase in the initial investment costs. However, it is much more interesting to compare the LEC obtained with those found in the electricity market based on solar gas turbines.
Figure 28: Levelized Cost of Energy Comparison by LAZARD
Many renewable energies used today are highly competitive economically with fossil fuels. Changes in fuel prices can significantly affect the levelized cost of energy for conventional generation technologies and for hybrid plants, such as hybrid solar plants. According to SOLGATE, using the cost reduction potential that lies in combined design, construction and operation of multiple distributed plants leads to solar LEC of below 10 €cent/kW·h for a power generation of 16,1 MW. In other words, solar gas turbine technology shows interestingly low cost for solar produced bulk electricity at a moderate power level.
64
12. Conclusions
The calculated levelized cost electricity seems to be reasonably logical compared with other conventional power plants. Brayton cycle is highly competitive with other technologies in long term. Obviously, a reduction in the operating hours implies low LEC costs. It is noteworthy that the main objective was to analyze all costs involved in solar thermal plants. However not all costs have been estimated. Some of them have been omitted such as engineering and development costs. However, they would not mean a significantly change in the initial investment. Additionally, if they had been considered, they would have had the same impact in all configurations. Although the technological maturity of solar gas turbines with central receiver is not the same as the combination of the Rankine cycle with parabolic trough, hybrid solar Brayton cycle is a promising future technology. Given the interest in solar energy due to high fossil fuel prices, hybridization gas turbine offers very high efficiency and good use of solar heat. A combined cycle plant has a LEC of approximately 6.3 €cents/kW·h to 20 €cents/kW·h depending on the power generation and the solar share [35], with a decrease in the specific investment future.
Central Receiver Systems complemented with hybrid systems are now mature enough to carry out the first commercial projects in sizes of 15-50 MW thanks to the development of this technology. The electric market penetration of solar thermal power plants is a reality, provoking a high competition between renewable energies and other conventional power plants. This technology provides good opportunities for the expansion of the electrical system and other sectors such as industry.
Spain has been the pioneer in the development of commercial projects, with a multitude of projects currently under development. The absence of economic incentives in Spain implies that solar companies are afraid to invest in this energy due to high initial risk. It should be noted also the emerging open projects in Australia and Portugal, as well as in countries like Egypt, Morocco, Mexico and India.
Solar technology based on gas turbines offers a high potential to reduce production costs. Experimental results extracted from this thesis show that this technology can operate in all conditions, both on cloudy days and on days when solar radiation is affected by weather factors. Regarding variations in solar radiation, the operation of this technology with the aid of a fossil fuel provides a reliable and inexpensive compared to other storage systems hybrids.
Regarding the maturity of solar gas turbines, SOLGATE report shows that the reception of these is not sufficient for immediate commercialization of the technology because the risk it poses, so that public funding would imply a reduction in the risk factor. This technology is still far from being able to generate good economies of scale with more than 15 MW, because of the structural limitations of the materials.
Brayton technology is very flexible, offering different solutions depending on the location of the plant, with numerous potential sources of fuel such as natural gas and biomass sources. Additionally, excess heat can be used not only with a regenerative Rankine cycle, but also in a combined cycle. Brayton cycle solar technology offers true capacity for utilities, a prospect of lower costs, greater efficiency and better use of land than any other solar technology.
65
References
[1] Red Eléctica Española. [Online]. http://www.ree.es
[2] Greenpeace, ESTELA and SolarPACES. "Energia Solar Térmica de Concentración", 2009.
[3] Wikipedia: Photovoltaic. [Online]. http://es.wikipedia.org/wiki/Energía_solar_fotovoltaica
[4] ESTELA, European Solar Thermal Electricity Association. [Online]. http://www.estelasolar.eu
[5] Solar Thermal Power Plants. [Online]. http://www.solarthermalpowerplant.com/index.php/c-central-parabolic-trough
[6] Renovetec, Termosolar [Online]. http://www.termosolar.renovetec.com
[7] Renovetec, Termosolar [Online]. http://centralestermosolares.com/avanzadoplantafresnel.html
[8] Schlaich Bergermann and Partner GbR. “EuroDish System description”, SBP Publication, 2002.
[9] Sunpower Inc. and Greenpeace, “The free piston Stirling cooling system”, 1995.
[10] CSP Today, Business Intelligence. [Online]. http://social.csptoday.com
[11] IDEA, Ministerio de Industria, Turismo y Comercio. “Energía Solar Térmica, Manuales de Energías Renovables”, 2006.
[12] Pitz-Paal, Robert, Jurgen Dersch and Barbara Milow. “European Concentrated Solar Thermal Road Mapping, ECOSTAR”, 2005.
[13] CSP Today, Business Intelligence. [Online]. http://social.csptoday.com
[14] Meherwan P. Boyce. “Gas Turbine Engineering HandBook”, Second Edition.
[15] Empresa Nacional de Energía y Gas, ENEGAS. [Online]. http://www.enegas.com/web/
[16] TechBriefs. “Concentrating Solar Trough Modeling: Calculating Efficiency”, A Burns & McDonnell Publication, 2009.
[17] PSA, Ministerio de Economía y Competitividad. [Online]. http://www.psa.es
[18] European Commission. "SOLGATE Solar hybrid gas turbine electric power system” 2002.
[19] CompressorTechTwo. [Online]. http://www.compressortechenespanol-digital.com
[20] I. Hischier, D. Hess, W. Lipinski, M. Modest and A. Steinfeld. “Heat Transfer Analysis of a Novel Pressurized Air Reciver Concentrated Solar Power via Combined Cycles”, ASME, 2009.
[21] D.L. Chase and P.T. Kehoe. “GE Combined-Cycle, Product Line and Performance”, GE Power Systems.
66
[22] Eugen Lutoschkin, Martin Rose and Stephan Staudacher. “Combustor assembly for gas turbine with combustion-induced total pressure gain”, 2009.
[23] “SGT-400 Industrial Gas Turbine”, SIEMENS, 2009.
[24] Denise Lane. “The Brayton Cycle with Regeneration, Intercooling, & Reheating”.
[25] Gregory J. Kolb, Scott A. Jones, Matthew W. Donnelly, David Gorman, Robert Thomas, Roger Davenport and Ron Lumia, “Heliostat Cost Reduction Study”, 2007.
[26] National Renewable Energy Laboratory. [Online]. http://www.nrel.gov/csp/solarpaces
[27] Roman Korzynietz1, Manuel Quero and Ralf Uhlig. “SOLUGAS – FUTURE SOLAR HYBRID TECHNOLOGY”.
[28] Manuel Romero, Reiner Buck and James E. Pacheco. “An Update on Solar Central Receiver Systems, Projects, and Technologies”, ASME, 2002.
[29] EnergiaBerria. “GEMASOLAR: The first commercialised plant using central tower and molten salt receiver technology”, Cluster Energía, 2011.
[30] European Commission. "SOLGATE Solar hybrid gas turbine electric power system” 2002.
[31] National Energy Technology Center. “Process Equipment Cost Estimation”, 2002.
[32] Engineering Page. [Online]. http://www.engineeringpage.com/technology/thermal/transfer.html
[33] Pitz-Paal, Robert, Jurgen Dersch and Barbara Milow. “European Concentrated Solar Thermal Road Mapping, ECOSTAR”, 2005.
[34] Jianyun Zhanga, Linwei Ma, Zheng Li and Weidou Ni. “Modeling an Air-Cooled Gas Turbine of the Integrated Gasification Combined Cycle in Aspen plus”, 2012.
[35] Schwarzbözl P., Buck R., Sugarmen C., Ring A., Marcos M.J., Altwegg P. and Enrile J.. "Solar Gas Turbine Systems: Design, Cost and Perspectives", 2004.
67
Images References
Figure 1. Red Eléctica Española. http:// w ww.ree.es
Figure 2. Red Eléctica Española. http:// w ww.ree.es
Figure 3. European Comission, Resear and Innovation. http://ec.europa.eu/research/energy/
Figure 4. EcoMena, Powering Sustainable Development. http://www.ecomena.org/
Figure 5. EcoMena, Powering Sustainable Development. http://www.ecomena.org/
Figure 6. Wikipedia, Solar thermal. http://en.wikipedia.org/wiki/Solar_thermal_energy
Figure 7. Skeptical Science, Renewable Energy. http://www.skepticalscience.com/
Figure 8. ProtermoSolar, Asociación Española de la Industria Solar Termoeléctrica. http://www.protermosolar.com
Figure 9. Wikipedia, ciclo Brayton. http://es.wikipedia.org/wiki/Ciclo_Brayton
Figure 10. Schwarzbözl, P. Buck, R. Sugarmen, C. Ring, A, Marcos Crespo, M. J. Altwegga and P. Enrile. “Solar Gas Turbine Systems: Design, Cost and Perspectives,” Sol. Energy, 2006.
Figure 11. Schwarzbözl, P. Buck, R. Sugarmen, C. Ring, A, Marcos Crespo, M. J. Altwegga and P. Enrile. “Solar Gas Turbine Systems: Design, Cost and Perspectives,” Sol. Energy, 2006.
Figure 12. Lilia Abdelhamid, Lylia Bahmed and Azzedine Benoudjit, Impact of renewable energies – environmental and economic aspects: “Case of an Algerian company”, 2012.
Figure 13. Schwarzbözl, P. Buck, R. Sugarmen, C. Ring, A, Marcos Crespo, M. J. Altwegga and P. Enrile. “Solar Gas Turbine Systems: Design, Cost and Perspectives,” Sol. Energy, 2006.
Figure 14. Matthias Russ. “Elaboration of thermo-economic models of solar gas-turbine power plants", Karlsruher Institut fur Technologie, MS Thesis 2011.
Figure 16. Rafael E. Cabanillas López. “Perspectivas de la tecnología de concentración solar en el noroeste de México”. Torres centrales.
Figure 17. F.Q. Cui, Y.L. He, Z.D. Cheng, D. Li and Y.B. Tao. “Numerical simulations of the solar transmission process for a pressurized volumetric receiver”, 2012.
Figure 18. CIEMAT. “Volumetric receivers in Solar Thermal Power Plants with Central Receiver System technology: A review”, Solar Energy, 2011.
Figure 19. I. Hischier, D. Hess, W. Lipinski, M. Modest and A. Steinfeld “Heat Transfer Analysis of a Novel Pressurized Air Reciver Concentrated Solar Power via Combined Cycles”, ASME, 2009.
Figure 23. European Commission. "SOLGATE Solar hybrid gas turbine electric power system", 2002.
68

Figure 24. SolarPaces, Solar Power and Chemical Energy Systems. http://www.solarpaces.org
Figure 28. LAZARD. “Lazard's levelized cost of energy analysis”, 2011.
*All Figures not referenced are extracted from computations: Figure 15, 20, 21, 22, 25, 26 and 27.
69

Appendix 1. IPSE files
Three IPSE software files are attached in Appendix 1 including the thermodynamic study for the differents configurations studied:
Brayton_cycle.pro
Regenerative_cycle.pro
Combined_cycle.pro
70

Appendix 2. Excell files
Three Microsoft excel files are attached in Appendix 2 including the economical calculations for the differents configurations studied:
Brayton_cycle.xls
Regenerative_cycle.xls
Combined_cycle.xls
71