Embed Size (px)
Citation preview
MASTER THESIS
The Change Process of Organizational Culture:
Validation of a Measurement Tool -
The High-Performance Organization-Analyzer
Prof. Dr. Martin Hoegl
Part-time MBA Class of 2013
Damian Beldycki
Helmholtzstr. 12
40215 Duesseldorf
- 2 -
ABSTRACT
This master thesis makes a contribution to the validation and as the case may be to the improvement of
an instrument for measuring organizational culture called the High-Performance Organization-
Analyzer (HPO) (Heidbrink & Jenewein, 2011). The HPO is based on theoretical foundation of
transactional and transformational leadership (B. M. Bass, 1985), initially measured by Organizational
Description Questionnaire ODQ (B. M. Bass & Avolio, 1993). In order to have a secured tool to
measure organizational culture reliability as well as validity has to be fulfilled. This master thesis
intends to cover the part of validity; more precisely construct validity, while the reliability part was
substantiated in detail (Brenner, 2012).
In a field study datasets of different companies in Germany and Russia were collected. This data
contains the filled ODQ and HPO-Analyzer as well as expert opinions.
Three different methods based on that data are used to quantify the validity of the current used
questionnaire and mixing console. Firstly, the evaluation of convergent validity of the HPO-Analyzer
towards the ODQ is analyzed. Secondly, the evaluation of discriminant validity of the HPO-Analyzer
towards a null model is measured. Lastly, the evaluation of accordance of the HPO-Analyzer towards
expert opinions is assessed.
- 3 -
I Contents
1 INTRODUCTION ....................................................................................................................... - 6 -
1.1 Organizational Culture as Leverage of Performance ....................................................... - 6 -
1.2 Organizational Culture as a Broad Concept ..................................................................... - 7 -
1.3 Validity of HPO Design ........................................................................................................ - 8 -
2 THEORETICAL BACKGROUND AND RESEARCH MODEL ........................................ - 10 -
2.1 Dimensions and Definition of Organizational Culture ................................................... - 10 -
2.2 Transformational and Transactional Organizational Leadership and Culture .......... - 12 -
2.3 Measurement of Organizational Leadership and Culture ............................................. - 15 -
2.4 Organizational Description Questionnaire (ODQ) ......................................................... - 17 -
2.5 The High-Performance Organization-Analyzer (HPO) ................................................. - 19 -
3 METHODS ................................................................................................................................. - 25 -
3.1 Respondents ........................................................................................................................ - 25 -
3.2 Measures.............................................................................................................................. - 27 -
4 RESULTS ................................................................................................................................... - 31 -
4.1 Descriptive and Explorative Statistics .............................................................................. - 31 -
4.2 Inferential Statistics ........................................................................................................... - 35 -
4.3 Qualitative Comparison ..................................................................................................... - 38 -
5 DISCUSSION AND FUTURE RESEARCH DIRECTIONS ................................................ - 41 -
5.1 Summary, Implications and Recommendations .............................................................. - 41 -
5.2 Limitations .......................................................................................................................... - 43 -
5.3 Final Note ............................................................................................................................ - 45 -
6 APPENDIX ................................................................................................................................. - 47 -
7 REFERENCES .......................................................................................................................... - 69 -
8 DECLARATION OF AUTHORSHIP ..................................................................................... - 72 -
- 4 -
II Table of Figures
Figure 1: The three levels of culture................................................................................................ - 11 -
Figure 2: The four Is of transformational leadership. ................................................................... - 13 -
Figure 3: The full range of leadership. ............................................................................................ - 16 -
Figure 4: Classification of the organizational culture by ODQ. ................................................... - 18 -
Figure 5: The ten levers of HPO. ..................................................................................................... - 19 -
Figure 6: Classification of the organizational culture by HPO. ................................................... - 23 -
Figure 7: Scatter plot of transformed ODQ and HPO overall scores. ......................................... - 35 -
- 5 -
III Table of Tables
Table 1: Descriptive statistics for HPO levers. ............................................................................... - 32 -
Table 2: Descriptive statistics for the ODQ dimensions. ............................................................... - 32 -
Table 3: Factor Analysis results for HPO scale transformation. ................................................. - 33 -
Table 4: Comparison of HPO and ODQ transformed overall scores. ......................................... - 34 -
Table 5: Comparison of experts’ HPO and ODQ transformed overall scores. ........................... - 34 -
Table 6: Spearman's Rank Correlation Coefficient for overall score.......................................... - 36 -
Table 7: Spearman's Rank Correlation Coefficient for all levers. ............................................... - 36 -
Table 8: Comparison of HPO data with a null model. .................................................................. - 37 -
Table 9: P-Values of Wilcoxon-Signed-Rank-Test for all levers. ................................................. - 37 -
Table 10: Test statistics of equivalence test for overall score. ...................................................... - 38 -
Table 11: Test statistics of unpaired equivalence test for all levers. ............................................ - 38 -
- 6 -
1 INTRODUCTION
First of all I aim to introduce the potency of organizational culture and the various ways how it
influences the effectiveness and efficiency of companies. I will demonstrate why it really matters to
deal with organizational culture. To utilize culture in a beneficial modality we must in the first instance
measure and quantify it, quite in the sense of the famous management guru Peter Drucker “what gets
measured gets managed”. Thus, I will touch some pitfalls regarding the culture measurement based on
its complexity. Due to these challenges I will motivate the demand for a new measurement tool.
1.1 Organizational Culture as Leverage of Performance
Every business organization will evolve its own organizational culture regardless whether we like it or
not. The key question top management needs to answer is: “Does this culture help its organization to
fulfill the intended goals?” (Heidbrink & Jenewein, 2011: 5)
The latest Gallup study for the year 2011 (Nink, 2012) based on the Gallup Engagement Index Q12®
, a
measurement for commitment to the current workplace, revealed that, low employee motivation results
in high sick day and labor turnover rates, a lack of innovations and a low readiness for recommendation
of the current employer. In Germany alone “the economic costs due to internal termination amount to a
total of 122.3 to 124.0 billion euros annually” (Nink, 2012: 11). Organizational culture is too critical
due to its power to set priorities and coordination function for employees to leave it to chance
(Chatman & Cha, 2003). As organizational culture strongly influences commitment and involvement of
personnel (Denison & Mishra, 1995; Kotter & Heskett, 1992) it is a potent instrument to increase the
emotional engagement. Firms should use culture to boost the employees’ satisfaction and, accordingly,
to anticipate the noted downsides.
Otherwise, a lot of best practice case studies, like Southwest Airlines, Toyota or the SAS Institute, were
analyzed to investigate how to achieve extraordinary performance with the help of strong
organizational culture, and are still taught in executive education, e.g. the corresponding EMBA
program of WHU- Otto Beisheim University. Those and other examples show impressively how
culture is able to motivate workers to go the extra mile (Jenewein & Heidbrink, 2008).
- 7 -
Additionally, individual leadership possesses a strong correlation with corporate culture (B. M. Bass &
Avolio, 1993). Although there is not sufficient empirical evidence, whether culture influences
leadership or the other way around (Parry & Proctor-Thomson, 2001), there is at least a common sense
that probably both mutually interfere (Schein, 2009). Consequently, it is crucial for leaders to be aware
of the prevailing culture to execute their leadership approach. Only acting in alignment with the culture
will provide an effective impact, e.g. it will not work out to empower subordinates in highly
hierarchical, former Soviet companies by transferring the full reasonability for their projects
(McCarthy, Puffer, May, Ledgerwood, & Steward, 2008).
Moreover, organizational culture is directly linked to the desired corporate strategy, modes of operating
and influences not only the behavior of individuals but also ultimately of the whole institute (Schein,
2009). Hence, one of the success factors for strategy implementation is alignment of the organizational
culture to the prepared vision (Pietersen, 2010). For instance the business model of the Service-Profit
Chain rests upon the link of culture and strategy (Heskett, Jones, Loveman, Sasser, & Schlesinger,
2008). Ultimately, understanding of the existing culture is a pre-requisite for any aspiring change (B.
M. Bass & Avolio, 1993; Schein, 1990).
In sum, organizational performance indisputably influences the bottom-line on a significant level via
different levers. Accessorily, culture forms a competitive advantage, which could sustain, because
culture is very hard to copy by other companies (Sackmann, 2006).
1.2 Organizational Culture as a Broad Concept
The recording of organizational culture as an end in itself is not worthwhile (Heidbrink & Jenewein,
2011). Organizational culture is such broad and complex concept where we can get lost easily, without
concentrating on the management implications (Schein, 2009). Therefore, it seems meaningful to
evaluate the culture with the purpose to identify the gaps between prevailing and desirable culture in
alignment to the overall strategy (Heidbrink & Jenewein, 2011). Yet, “one cannot really build, evolve,
or change culture without getting into the messy details of particular cultures” (Schein, 2009: x).
Consequently, it is important for culture measurement tools to quantify culture precisely, valid and
reliable in order to deduct tailor-made recommendations for the top management (Wunderer, 2006).
- 8 -
Another danger while dealing with culture is to oversimplify it (Schein, 2009). For this reason culture
measures have to cover both the visible and invisible part of culture as holistic as possible (Parry &
Proctor-Thomson, 2001). The High-Performance Organization-Analyzer (HPO) I discuss in this work
describes an alternative to the well-known and spread Organizational Description Questionnaire (ODQ)
(B. M. Bass & Avolio, 1993). In this vein it enables companies to evaluate the complexity of culture in-
depth in ten different dimensions and in that way offers a necessary integral approach.
Lastly, there is no superior culture existing, which could be adapted by any organization. The welcome
culture needs to be adaptive (Kotter & Heskett, 1992) and depends among other characteristics on the
development stage of organizations (B. M. Bass & Avolio, 1993), regional and national aspects (Alon
& Higgins, 2005) and founders values (Chatman & Cha, 2003). Again we need an accurate
measurement capable to determine an overall organizational culture as well as to illuminate most of its
facets.
In a nutshell, organizational culture adheres multitudinous, various layers and we must precisely
examine as much as possible of those to be able to work out cultural changes.
1.3 Validity of HPO Design
The main goal of this master thesis is to ensure that the HPO indeed measures what it supposes to
measure namely organizational culture. The convergent validity part of this validation of the HPO will
be assessed towards the ODQ, a multiple times tested tool for validity and reliability (B. M. Bass &
Avolio, 1993; Parry & Proctor-Thomson, 2001). To eliminate contingency I will test the HPO
outcomes against a random designed null model. In a third step for inspection of construct validity I
will compare the HPO results with insider expert opinions, the most valid way to assess culture for
accordance (Schein, 2009). With this work the existing gap for inevitable HPO validity will be closed
and combined with the reliability study (Brenner, 2012) we will create a secured tool to conduct
profound measurement.
Furthermore, all degrees of freedom for designing of the HPO, for instance choice of the right scale or
the selection of appropriate weights to accumulate an overall score from the ten levers, are not in the
main focus of this thesis. However, the executed analysis might explore some helpful advice to
improve the HPO. At the end the fully developed HPO represents an advanced tool to provide a
- 9 -
comprehensive analysis of the prevailing organizational culture, which serves as a necessary starting
point for cultural change. Since an assessment even of the most successful enterprise reveals space for
improvement (Sackmann, 2006).
The deduction of advice to boost the performance will be relinquished to the according experts and,
thus, are explicitly not part of this thesis. Ultimately, I will stick to the cultural theory of
transformational and transactional culture. Accordingly, I will not compare advantages or
disadvantages of the HPO with already existing measurement tools for different dimensions, like the
Organizational Cultural Profile (OCP) for cultural fit (O’Reilly III, Chatman, & Caldwell, 1991) or
Organizational Cultural Questionnaire (OCQ) for key characteristics (Sackmann, 2002).
- 10 -
2 THEORETICAL BACKGROUND AND RESEARCH MODEL
At the beginning of the research model I present a detailed explanation of organizational culture by
Schein as a holistic illustration. Afterwards I will discuss different definitions before closing with
Jenewein’s and Heidrinks’s view. The following chapter narrows the perspective on culture into the
dimensions transformational and transactional. Thirdly, I debate the principles of culture measurement.
Eventually, I lead over from the theoretical part with an exhibit of the tools HPO and ODQ.
2.1 Dimensions and Definition of Organizational Culture
Organizational culture is such complex that only the declaration might cover a whole master thesis.
Though, it is helpful to explain one theoretical approach as an example in detail in order to make the
underlying requirements for designing a measurement tool understandable. In this work the description
by Edgar Schein is used, because of the acknowledgment of his opinion among different researchers
(Sackmann, 2006). Moreover, Edgar Schein represents one of the most notable researchers in the field
of organizational culture (Heidbrink & Jenewein, 2011). Thirdly, he uses a pure business perspective
on corporates with the goal to derive management implications to change the prevailing culture
(Schein, 2009). This method is in line with the approach of the HPO research team (Heidbrink &
Jenewein, 2011). Lastly, his model coheres with other well-known definitions (Becker, 2006; Hofstede,
Neuijen, Ohayv, & Sanders, 1990; Sackmann, 2006).
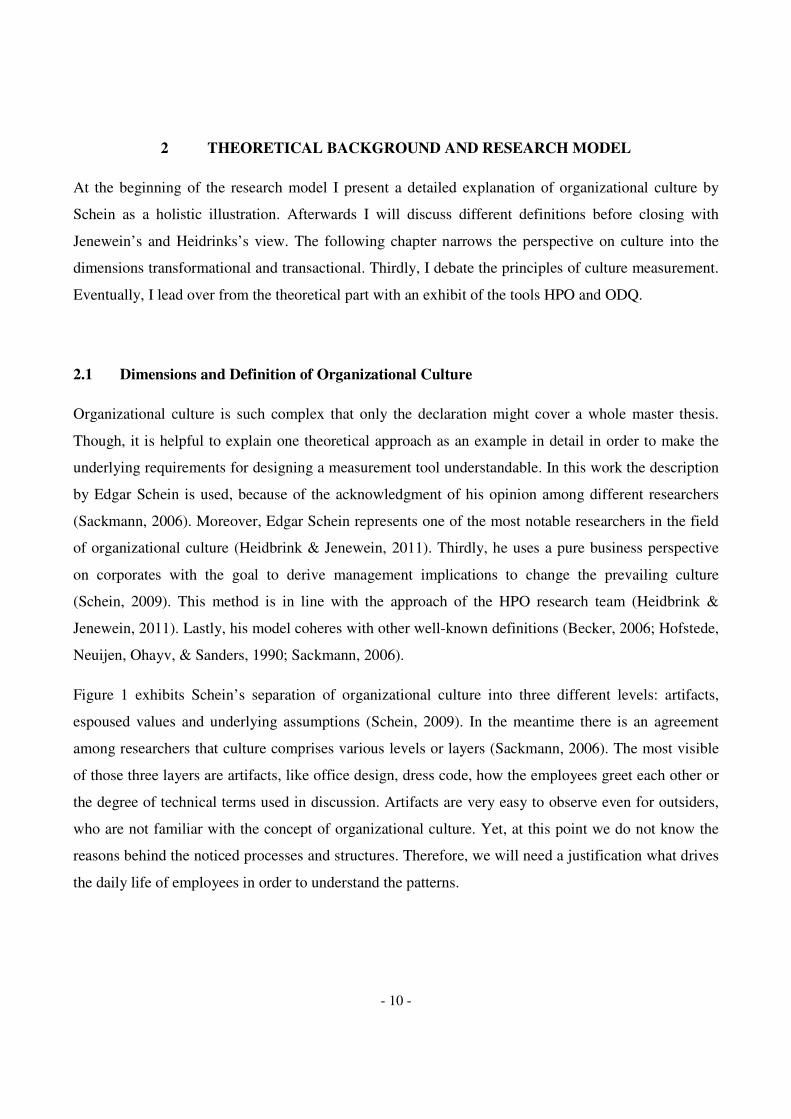
Figure 1 exhibits Schein’s separation of organizational culture into three different levels: artifacts,
espoused values and underlying assumptions (Schein, 2009). In the meantime there is an agreement
among researchers that culture comprises various levels or layers (Sackmann, 2006). The most visible
of those three layers are artifacts, like office design, dress code, how the employees greet each other or
the degree of technical terms used in discussion. Artifacts are very easy to observe even for outsiders,
who are not familiar with the concept of organizational culture. Yet, at this point we do not know the
reasons behind the noticed processes and structures. Therefore, we will need a justification what drives
the daily life of employees in order to understand the patterns.
- 11 -
Figure 1: The three levels of culture.
The dimension explaining the artifacts and containing visions, goals, ethics, philosophies, principles
and strategies is called espoused values. At this level we already require an insider, who mentors us, as
if it would be our first day in the company. Explaining the values to us the insider will answer our
question why people behave like we observed. However, we might notice some inconsistencies
between the two already discussed levels. This is because the ultimate essence for values and actions
settles even one level deeper and is defined as underlying assumptions. Those are beliefs, perceptions,
thoughts and feelings of influential leaders or founders, which were proved to be key success factors
for the company in history. In time they become tacit, granted and jointly shared assumptions among
all employees. As people adapt these patterns unconsciously, we need to pick the right questions to our
insider to uncover this essence. Additionally, all underlying assumptions are interconnected with each
other in different strengths. They might be based on national backgrounds, personal traits and
educational background of important personnel, views about human nature and many other varying
factors.
We can imagine this whole cultural organization model as an iceberg. What we see is solely the top
above the water, but we are not able to guess how broad or deep it is without an abyssal dive into the
cold water.
- 12 -
Altogether Schein defines culture more precisely as “a pattern of shared tacit assumptions that was
learned by a group as it solved its problems of external adaptation and internal integration that has
worked well enough to be considered valid and, therefore, to be taught to new members as the correct
way to perceive, think, and feel in relation to those problems” (Schein, 1990: 27)
This is far from being the only reference for definitions and characteristics of organizational culture.
One supplemental, wide spread naming (Becker, 2006: 4) for culture is “the entirely of norms, ideals
and mindsets, which form the behavior of employees’ from any hierarchical level and, thus, the
appearance of a company” (Puempin & Seminar, 1982). Another attempt to define culture is not
directly, however, rather indirectly by recognition features, e.g. Hofstede six characteristics: holistic,
historically determined, related to anthropological concepts, socially constructed, soft and difficult to
change (Hofstede et al., 1990). Those are examples from the economic sciences, there are over and
above countless denotations in various research fields. Just to touch on one somewhat dissenting, the
system theorist Simon reconsiders organizational culture as the sum of communications and channels
(Simon, 2009).
Eventually, it is fundamental to explain Jenewein’s and Heidbrink’s point of view by reason that the
HPO is based on it. They define organizational culture as “the sum of all prevailing behavioral patterns
of people, which constitute the organization” (Heidbrink & Jenewein, 2011: 7). Despite of their
acceptance and consideration of Schein’s definition of organizational culture, they rather try to reveal
the concept with a practical approach (Heidbrink & Jenewein, 2011). They follow the current scientific
discussions while looking for common patterns of successful high performance organizations
(Jenewein & Heidbrink, 2008).
2.2 Transformational and Transactional Organizational Leadership and Culture
Burns introduces the idea of transformational and transactional leadership in political research studies
(Burns, 1978). Bass adapted this leadership theory, based on the key proposition, that change is in the
center of leadership, into economic sciences (B. M. Bass, 1985). He conceptualized the full range of
leadership model with four transformational, two transactional leadership items and the supplementary
add-on of laissez-faire (B. M. Bass, 1985). Yet, laissez-faire is rather an own dimension than a factor
- 13 -
and should be handled separately (Judge & Ronald F Piccolo, 2004). Ultimately, Bass embedded the
leadership concept into organizational culture (B. M. Bass & Avolio, 1993).
As noted above leadership and culture are inextricably connected. Hence, it is essential to understand
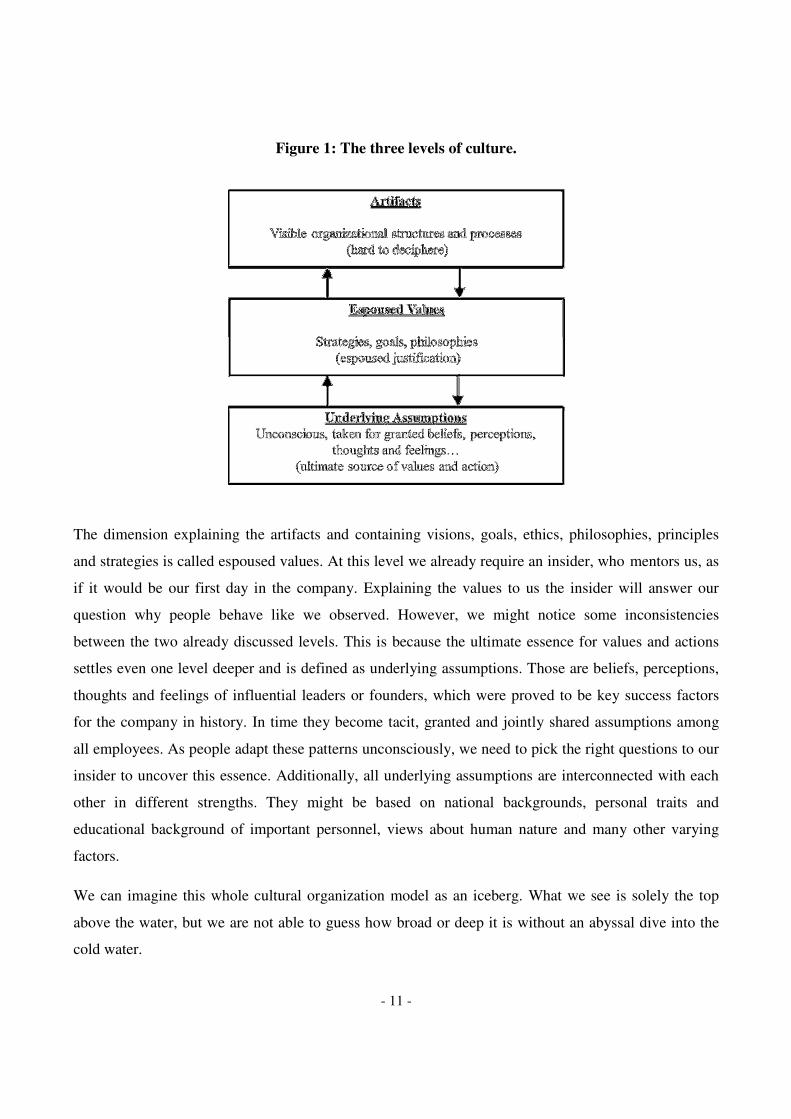
the underlying leadership theory in order to recognize the derived culture concept. Transformational
leadership is defined by four factors, called the “Four Is” in dependence on their first letter (B. M. Bass
& Riggio, 2012). Figure 2 shows a short summary of the main key description (Jenewein & Heidbrink,
2008) .
Figure 2: The four Is of transformational leadership.
Idealized influence also known as charismatic leadership with a good character means compendiously
for transformational leaders to act as a role model. This includes also high integrity, ethical behavior,
moral standards, risk taking and consistency in all actions. Good character leaders reap trust, respect
and finally identification. In this vein they are able to attract followers (Maccoby, 2000). The root for
the charisma may be both behavior, best summarized by the trite phrase “to walk the talk”, and
attributes of appealing charm.
The next component is called inspirational motivation. Leaders spawn commitment to a shared team
vision and challenging goals, comparable to goal-setting theory of stretch goals (Kerr & Landauer,
2004). They not only provide a purpose to the task, inspire the followers, but also communicate it
convincingly. Simultaneously, leaders radiate confidence, reliance and optimism about the achievement
of objectives. Due to the inspiration subordinates are willing to excel oneself. Transformational
leadership is in a figurative sense sparking motivation from inside out, i.e. pulling the intrinsic triggers
by the leader. On the opposite site it is outside in, i.e. motivation by incentives in particular monetary
bonus, which could be attached to transactional leadership,
- 14 -
In transformational leadership each follower is contemplated individually. The leader serves as a
mentor and coach to the various needs and desires. Leaders practice a respectful two-way
communication, listen carefully to concerns and take them seriously. Additionally, the leader identifies
the strength, weaknesses and potentials of subordinates and evolves collectively with the followers a
development plan. Finally, leaders show authentic empathy and empower the subordinates to the
development of higher levels of potential through the individualized consideration.
The last item is named intellectual stimulation, which is the challenging of the current status quo
including all underlying assumptions. Leaders create an atmosphere of creativity, exchange and the
possibility of mutual criticism. The team analyzes problems from different perspectives. The leaders
encourage their followers to strike out in a new direction, actually even if this implies to fail.
Transformational leaders contradict the slogan “trust be verify”.
On the basis of the four Is Bass created a definition for transformational organizational culture. “In a
transformational culture, one fitting with the model of the four Is, there is generally a sense of purpose
and a feeling of family. Commitments are long-term. Leaders and followers share mutual interests and
a sense of shared fates and interdependence. A transformational culture like leadership can build on or
augment the transactional culture of the organization. The inclusion of assumptions, norms, and values
which are transformationally based does not preclude individuals pursuing their own goals and
rewards. This can occur at the same time where there is alignment with a central purpose and the
coordination required to achieve it. Leaders and followers go beyond their self-interests or expected
rewards for the good of the team and the good of the organization. […]. There is a rich set of norms
which cover a wide range of behaviors, norms that will adapt to and change with external changes in
the organization's environment. There is much talk at all levels in the organization about purposes,
visions, and meeting challenges” (B. M. Bass & Avolio, 1993: 116–118). The whole organization
shares one common long-term vision, accepts that future is not predictable and, consequently, focus on
adaptiveness (Heidbrink & Jenewein, 2011).
On the other hand transactional culture is reported as a market place (Heidbrink & Jenewein, 2011). All
internal services and efforts are traded quid pro quo and this mechanism is also embedded into the three
cultural levels. Accessorily, the relationship of supervisors and subordinates is rational and all tasks,
duties, conditions are explicitly formulated (B. M. Bass & R. Bass, 2008). Besides, punishment and
reward predominate the culture (McCarthy et al., 2008). All above, monetary incentives foster
- 15 -
motivation whereas low output is punished by minor earnings. Bass explains transactional culture as
follows: “Commitments are short-term. Self-interests are stressed. […] Employees work as
independently as possible from their colleagues. Cooperation depends on negotiations not problem
solving or a common mission. Commitment is as deep as the organization's ability to reward members
for successful performance. There is little identification of the employees with the organization, its
mission or vision. Superiors primarily are negotiators and resource allocators. Relatively few behaviors
are determined by the norms of the organization, unless those norms reflect the transactional basis for
doing business in the organization” (B. M. Bass & Avolio, 1993: 116),
Transactional leadership is described by two items at which the second is executed in two dissimilar
ways (B. M. Bass & Riggio, 2012).
Contingent reward is the clear conceptual formulation and communication of expectations by the
leaders. The leaders reach an agreement with the followers of the existing objectives and,
contemporaneously, about the possible incentives offered in exchange.
The second item management by exception initiates leaders to carry out corrective action to avoid
deviations from the norm. Leaders might gear into the process actively, i.e. management by exception –
active, controlling and monitoring the performance of their subordinates tightly before serious
difficulties occur. Otherwise leaders may wait until an engagement is inevitable to avoid harm, i.e.
management by exception – passive.
The presented dimensions explained the extreme, pure theory of transformational and transactional
culture, however, typically companies possess a mixture of both (Heidbrink & Jenewein, 2011)
2.3 Measurement of Organizational Leadership and Culture
Bass developed a tool for measurement of the three leadership dimensions transformational,
transactional and laissez-faire named Multifactor Leadership Questionnaire (MLQ) (B. M. Bass, 1985).
The very first version consists of six factors – three transformational, two transactional and laissez-
faire. There was also evidence for two higher-order dimensions, which Bass entitled active and passive
leadership (Avolio, B. M. Bass, & Jung, 1999). In this way he was able to rearrange the original items
- 16 -
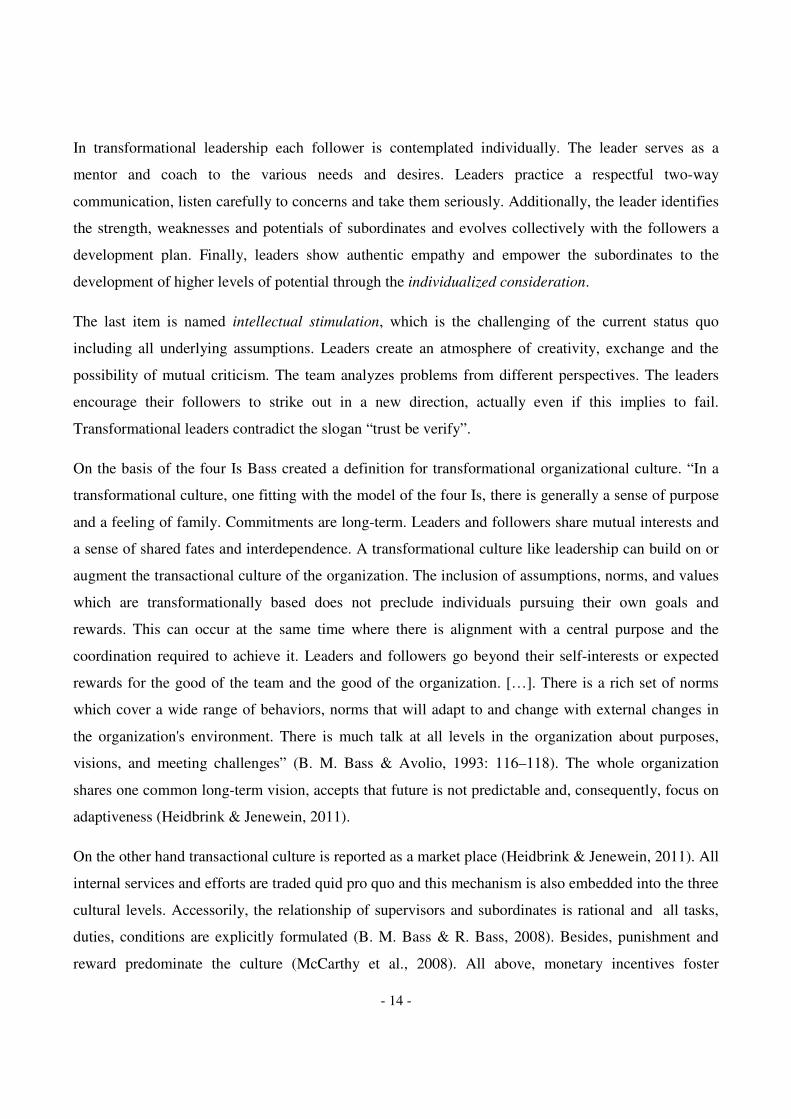
by ranking them in the scales effectiveness and degree of activity. Figure 3 portrays the resulting order
from effective and active to ineffective and passive items (B. M. Bass & Riggio, 2012).
Figure 3: The full range of leadership.
Since its introduction Bass and his research group revised and re-validated the MLQ (Avolio et al.,
1999) as a response to critique. Despite of the discussions about the MLQ (Judge & Ronald F Piccolo,
2004; Yukl, 1999) it seems to be an appropriate tool (R F Piccolo & Colquitt, 2006) for
transformational and transactional leadership measurement and to be feasible in practice (Heidbrink &
Jenewein, 2011).
In contrary to the theoretical part it is not possible without further ado to copy the design of a
measurement tool from leadership to culture, due to the manifold complexity of culture. It already
starts with the difficulty of agreeing to the definition of culture (Sackmann, 2006a). After passing the
first hurdle in applying, e.g. Schein’s definition it is important to clearly distinct in which dimensions
culture should be evaluated (Hofstede et al., 1990). There are a lot of various completive or even
conflicting approaches reaching from four to fifteen dimensions (Sackmann, 2006b). While all those
models are arguable, this works uniquely focuses on organizational culture as the main part of a change
processes spanned by the two dimensions transactional and transformational (B. M. Bass & Avolio,
1993), as the HPO is based on it. The next emerging question about the perspective of culture
(Nerdinger, 2007) is also answered thereby, with culture modeled as a changeable construct. In this
- 17 -
way the measurement of culture is the beginning of a whole process in order to make the organization
more effective by adapting the culture to the environment (Kotter & Heskett, 1992). Thus, the needed
purpose for assessment (Schein, 2009) is evidently to develop and change the current culture.
Eventually, the levels of culture, which should be investigated have to be assigned (Nerdinger, 2007). It
is crucial to record the visible and invisible parts (Parry & Proctor-Thomson, 2001) and to survey all
three levels to identify possible inconsistencies (Schein, 1990).
Altogether, the HPO fits into the theoretical model estimating culture on the horizontal axis, i.e.
theoretical models, based on transactional and transformational model and on the vertical axis, i.e.
cultural levels, holistically. Though, a questionnaire is only a first step to get a feeling of the as-is
situation and has to be succeeded by a workshops (Heidbrink & Jenewein, 2011). The best approach to
do that is by a mixture of quantitative surveys and questionnaires, interviews combined with workshops
(Nerdinger, 2007).
2.4 Organizational Description Questionnaire (ODQ)
Despite of the key role of culture for performance little efforts in research has been made to examine
culture in contrast to leadership evaluation (Parry & Proctor-Thomson, 2001). Bass introduced a
possible approach for assessment of organizational culture in analogy to the MLQ, namely the ODQ
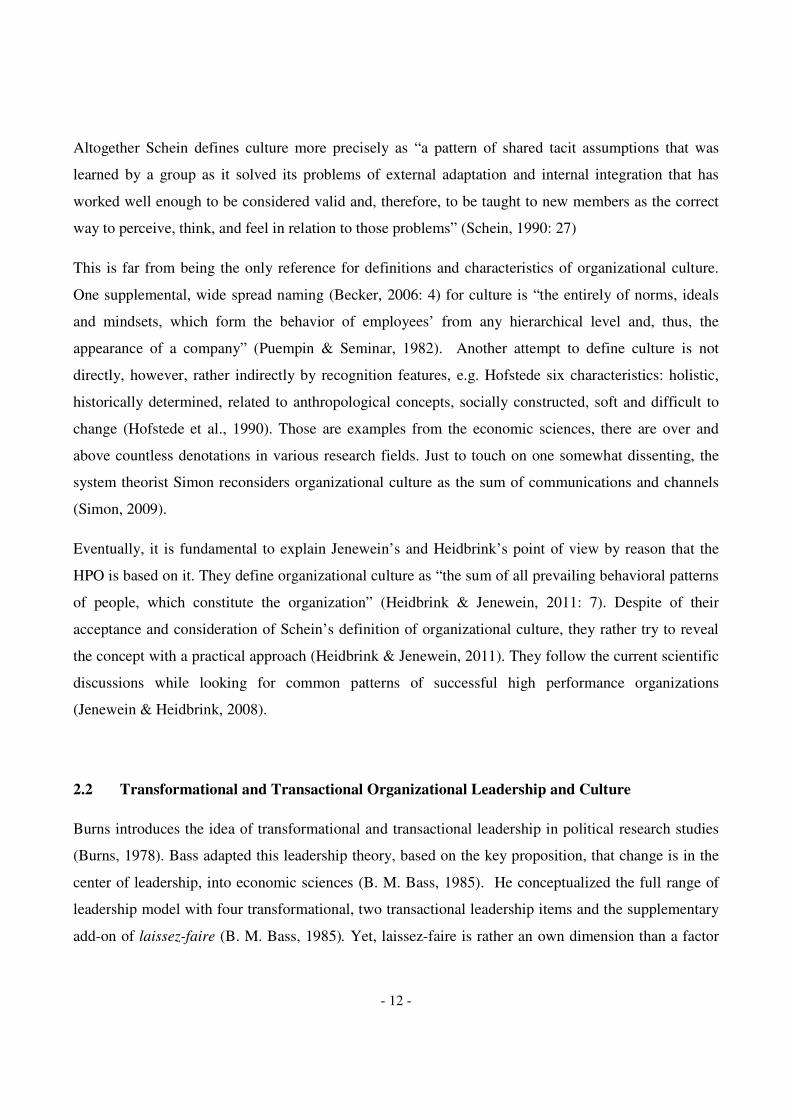
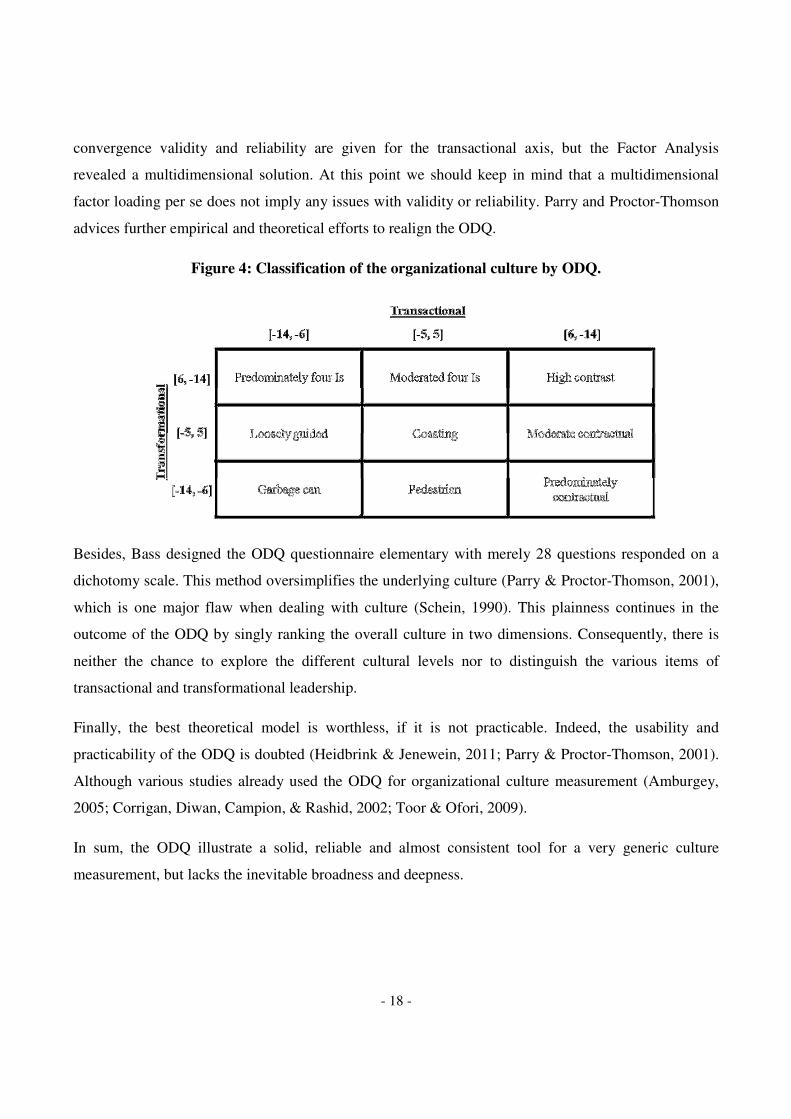
(B. M. Bass & Avolio, 1993). The ODQ consists of a 28 item questionnaire, half for the transactional
and half for transformational dimension (cf. Appendix 6.1). The participants have to decide among
three answers “true”, “false” and “undecided”. For every “true” a point is added to the corresponding
dimension, while for any “false” a point is subtracted. At the end, the ODQ pictures every organization
to a [-14, 14] interval, represented in Figure 4 (B. M. Bass & Avolio, 1993).
Parry and Proctor-Thomson reexamined the validity and reliability of the ODQ (Parry & Proctor-
Thomson, 2001). The ODQ highlights a grand reliability with the standard measurement for internal
consistency Cronbach’s alpha amounts 0.74 for the transactional dimension and even 0.88 for the
transformational. Furthermore, the item-to-total correlation provides a satisfying result with the
exception of item 19, which is negatively correlated. Lastly, the factor loadings point in the very same
directions like the correlation analysis and reveals consistency in all items with exclusion of item 19.
This implies that the transformational scale features very accurate outcomes. On the other hand,
- 18 -
convergence validity and reliability are given for the transactional axis, but the Factor Analysis
revealed a multidimensional solution. At this point we should keep in mind that a multidimensional
factor loading per se does not imply any issues with validity or reliability. Parry and Proctor-Thomson
advices further empirical and theoretical efforts to realign the ODQ.
Figure 4: Classification of the organizational culture by ODQ.
Besides, Bass designed the ODQ questionnaire elementary with merely 28 questions responded on a
dichotomy scale. This method oversimplifies the underlying culture (Parry & Proctor-Thomson, 2001),
which is one major flaw when dealing with culture (Schein, 1990). This plainness continues in the
outcome of the ODQ by singly ranking the overall culture in two dimensions. Consequently, there is
neither the chance to explore the different cultural levels nor to distinguish the various items of
transactional and transformational leadership.
Finally, the best theoretical model is worthless, if it is not practicable. Indeed, the usability and
practicability of the ODQ is doubted (Heidbrink & Jenewein, 2011; Parry & Proctor-Thomson, 2001).
Although various studies already used the ODQ for organizational culture measurement (Amburgey,
2005; Corrigan, Diwan, Campion, & Rashid, 2002; Toor & Ofori, 2009).
In sum, the ODQ illustrate a solid, reliable and almost consistent tool for a very generic culture
measurement, but lacks the inevitable broadness and deepness.
- 19 -
2.5 The High-Performance Organization-Analyzer (HPO)
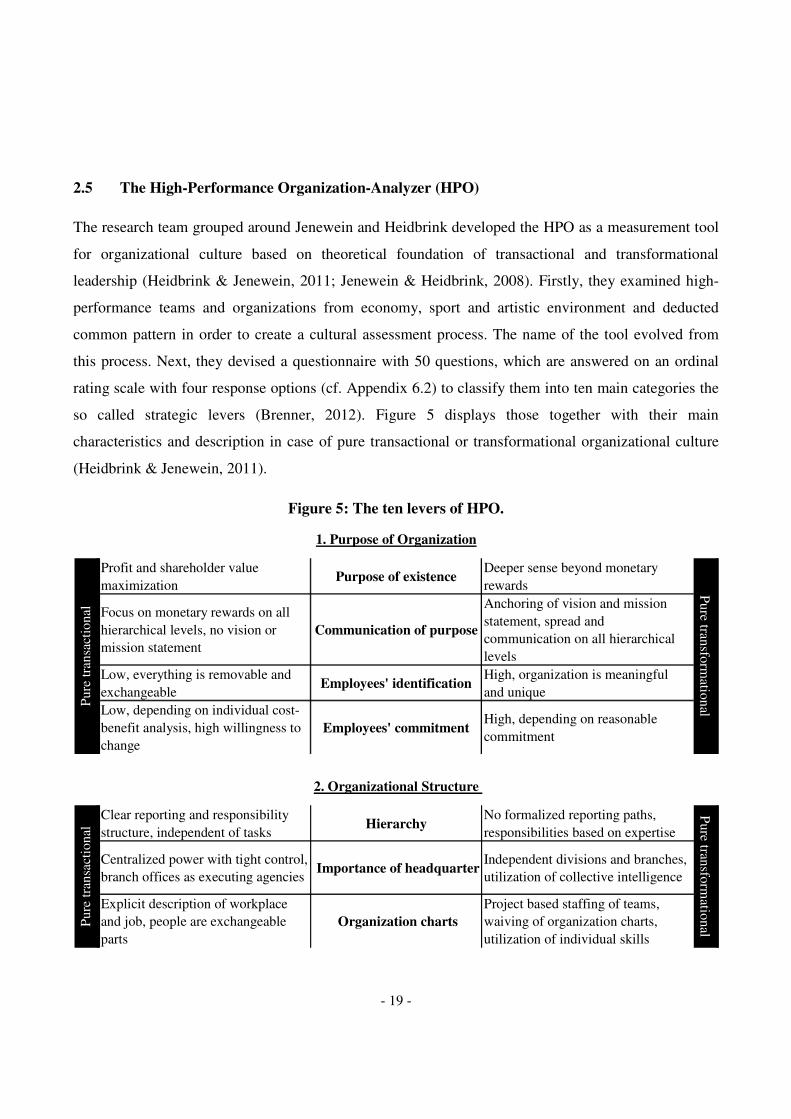
The research team grouped around Jenewein and Heidbrink developed the HPO as a measurement tool
for organizational culture based on theoretical foundation of transactional and transformational
leadership (Heidbrink & Jenewein, 2011; Jenewein & Heidbrink, 2008). Firstly, they examined high-
performance teams and organizations from economy, sport and artistic environment and deducted
common pattern in order to create a cultural assessment process. The name of the tool evolved from
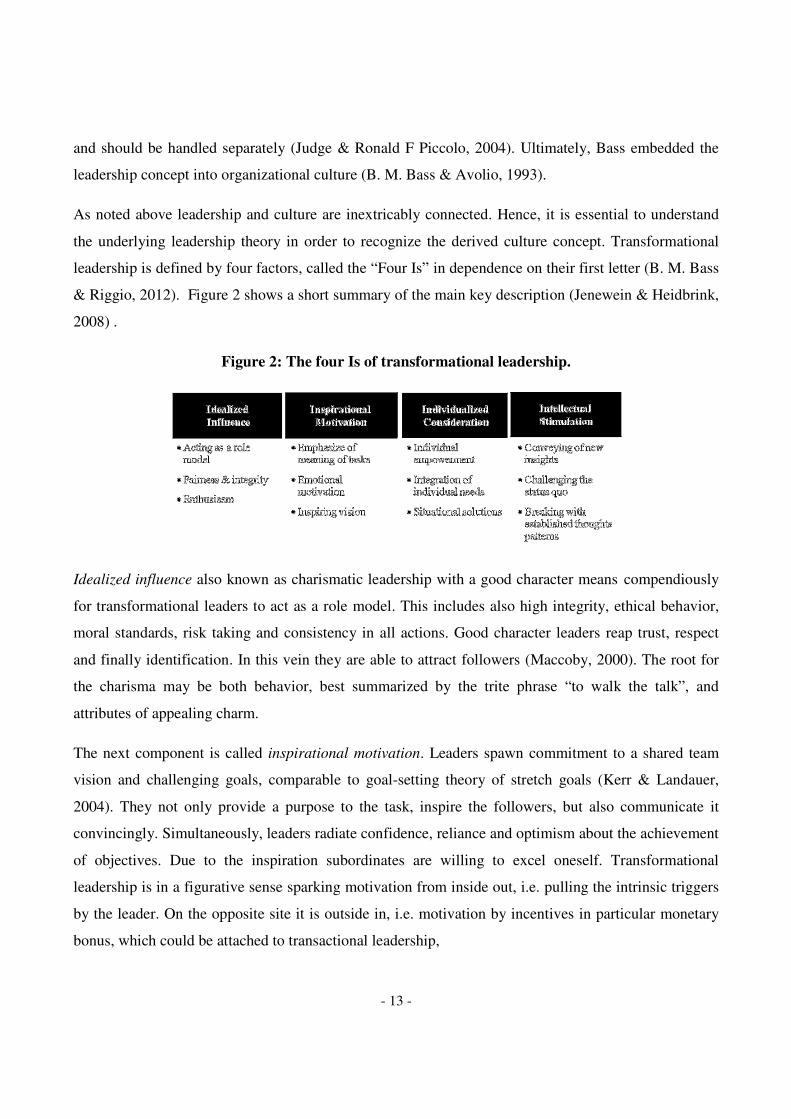
this process. Next, they devised a questionnaire with 50 questions, which are answered on an ordinal
rating scale with four response options (cf. Appendix 6.2) to classify them into ten main categories the
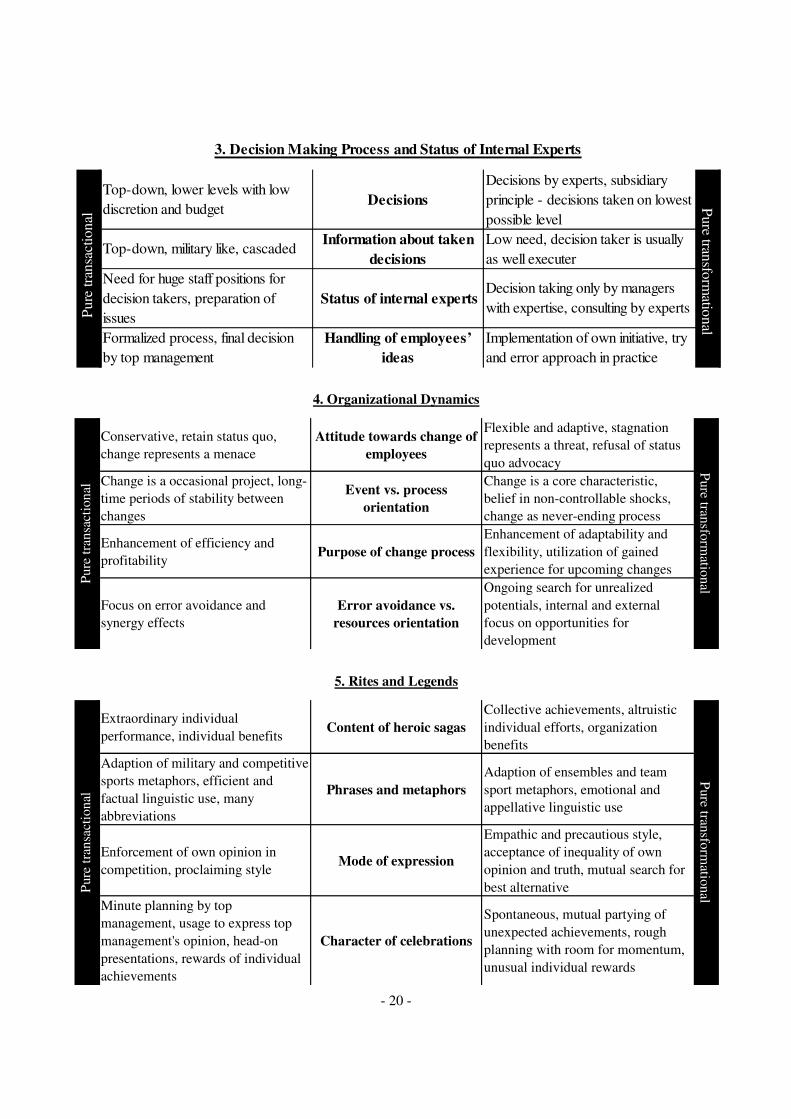
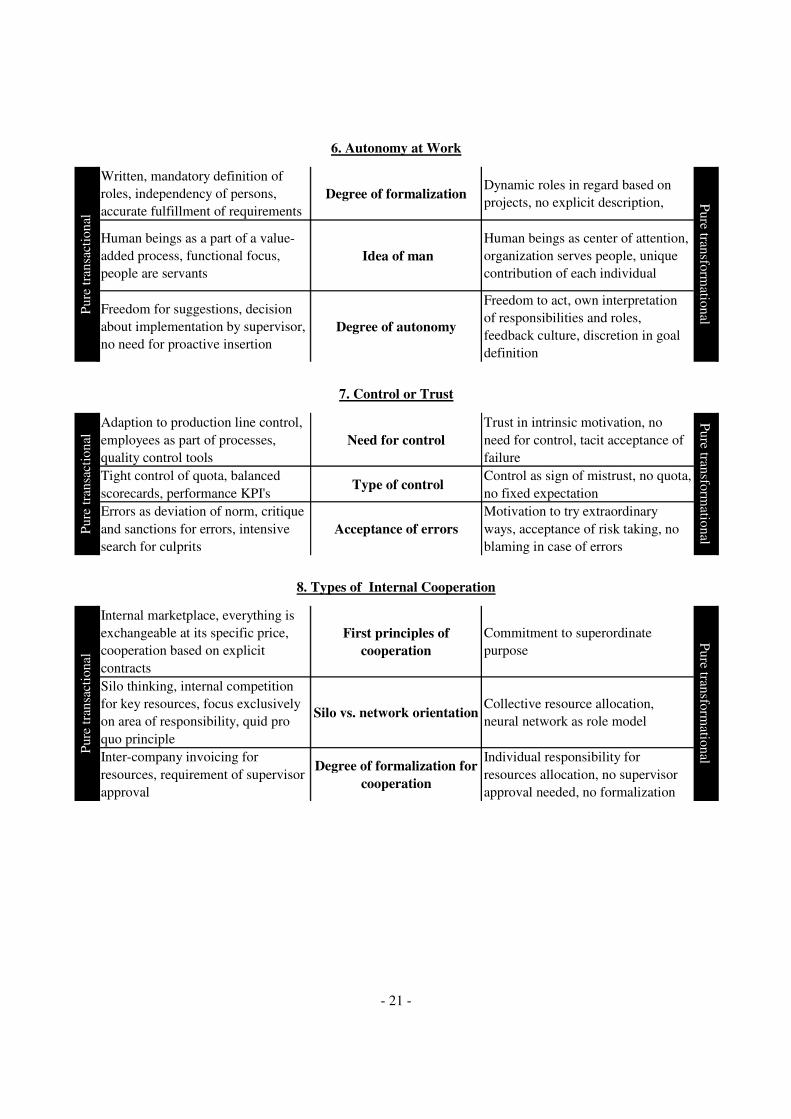
so called strategic levers (Brenner, 2012). Figure 5 displays those together with their main
characteristics and description in case of pure transactional or transformational organizational culture
(Heidbrink & Jenewein, 2011).
Figure 5: The ten levers of HPO.
Profit and shareholder value
maximizationPurpose of existence
Deeper sense beyond monetary
rewards
Focus on monetary rewards on all
hierarchical levels, no vision or
mission statement
Communication of purpose
Anchoring of vision and mission
statement, spread and
communication on all hierarchical
levels
Low, everything is removable and
exchangeableEmployees' identification
High, organization is meaningful
and unique
Low, depending on individual cost-
benefit analysis, high willingness to
change
Employees' commitmentHigh, depending on reasonable
commitment
1. Purpose of Organization
Pu
re t
ran
sact
ion
al
Pu
re transfo
rmatio
nal
Clear reporting and responsibility
structure, independent of tasksHierarchy
No formalized reporting paths,
responsibilities based on expertise
Centralized power with tight control,
branch offices as executing agencies Importance of headquarter
Independent divisions and branches,
utilization of collective intelligence
Explicit description of workplace
and job, people are exchangeable
parts
Organization charts
Project based staffing of teams,
waiving of organization charts,
utilization of individual skills
2. Organizational Structure
Pu
re t
ran
sact
ion
al
Pure tran
sform
ational
- 20 -
Top-down, lower levels with low
discretion and budgetDecisions
Decisions by experts, subsidiary
principle - decisions taken on lowest
possible level
Top-down, military like, cascaded Information about taken
decisions
Low need, decision taker is usually
as well executer
Need for huge staff positions for
decision takers, preparation of
issues
Status of internal expertsDecision taking only by managers
with expertise, consulting by experts
Formalized process, final decision
by top management
Handling of employees’
ideas
Implementation of own initiative, try
and error approach in practice
3. Decision Making Process and Status of Internal Experts
Pure
tra
nsa
ctio
nal
Pure tran
sform
ational
Conservative, retain status quo,
change represents a menace
Attitude towards change of
employees
Flexible and adaptive, stagnation
represents a threat, refusal of status
quo advocacy
Change is a occasional project, long-
time periods of stability between
changes
Event vs. process
orientation
Change is a core characteristic,
belief in non-controllable shocks,
change as never-ending process
Enhancement of efficiency and
profitabilityPurpose of change process
Enhancement of adaptability and
flexibility, utilization of gained
experience for upcoming changes
Focus on error avoidance and
synergy effects
Error avoidance vs.
resources orientation
Ongoing search for unrealized
potentials, internal and external
focus on opportunities for
development
4. Organizational Dynamics
Pu
re t
ran
sact
ion
al
Pure tran
sform
ation
al
Extraordinary individual
performance, individual benefitsContent of heroic sagas
Collective achievements, altruistic
individual efforts, organization
benefits
Adaption of military and competitive
sports metaphors, efficient and
factual linguistic use, many
abbreviations
Phrases and metaphors
Adaption of ensembles and team
sport metaphors, emotional and
appellative linguistic use
Enforcement of own opinion in
competition, proclaiming styleMode of expression
Empathic and precautious style,
acceptance of inequality of own
opinion and truth, mutual search for
best alternative
Minute planning by top
management, usage to express top
management's opinion, head-on
presentations, rewards of individual
achievements
Character of celebrations
Spontaneous, mutual partying of
unexpected achievements, rough
planning with room for momentum,
unusual individual rewards
5. Rites and Legends
Pure
tra
nsa
ctio
nal
P
ure tran
sform
ation
al
- 21 -
Written, mandatory definition of
roles, independency of persons,
accurate fulfillment of requirements
Degree of formalizationDynamic roles in regard based on
projects, no explicit description,
Human beings as a part of a value-
added process, functional focus,
people are servants
Idea of man
Human beings as center of attention,
organization serves people, unique
contribution of each individual
Freedom for suggestions, decision
about implementation by supervisor,
no need for proactive insertion
Degree of autonomy
Freedom to act, own interpretation
of responsibilities and roles,
feedback culture, discretion in goal
definition
6. Autonomy at Work
Pu
re t
ran
sact
ion
al
Pure tran
sform
ation
al
Adaption to production line control,
employees as part of processes,
quality control tools
Need for control
Trust in intrinsic motivation, no
need for control, tacit acceptance of
failure
Tight control of quota, balanced
scorecards, performance KPI's Type of control
Control as sign of mistrust, no quota,
no fixed expectation
Errors as deviation of norm, critique
and sanctions for errors, intensive
search for culprits
Acceptance of errors
Motivation to try extraordinary
ways, acceptance of risk taking, no
blaming in case of errors
7. Control or Trust
Pu
re t
ran
sact
ion
al
Pu
re transfo
rmatio
nal
Internal marketplace, everything is
exchangeable at its specific price,
cooperation based on explicit
contracts
First principles of
cooperation
Commitment to superordinate
purpose
Silo thinking, internal competition
for key resources, focus exclusively
on area of responsibility, quid pro
quo principle
Silo vs. network orientationCollective resource allocation,
neural network as role model
Inter-company invoicing for
resources, requirement of supervisor
approval
Degree of formalization for
cooperation
Individual responsibility for
resources allocation, no supervisor
approval needed, no formalization
8. Types of Internal Cooperation
Pure
tra
nsa
ctio
nal
P
ure tran
sform
ation
al
- 22 -
The separation into ten levers endows the needed in-depth view on the culture. There is no clear
mapping of HPO levers with corresponding levels of Schein or other authors. As mentioned before the
team rather focuses on a practical than a theoretical course of action (Jenewein & Heidbrink, 2008). To
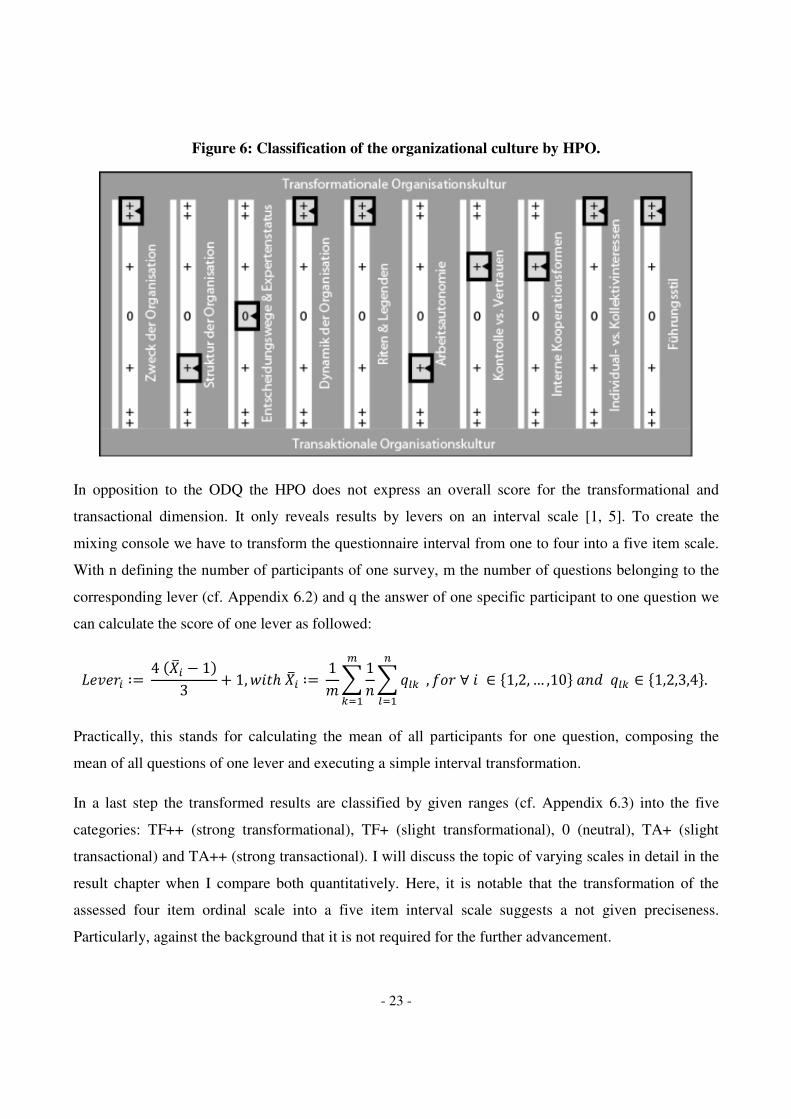
visualize the originated levers the team uses a mixing console as Figure 6 illustrates exemplary
(Heidbrink & Jenewein, 2011).
With this picture it is easy to identify the gap between the current organizational culture and a desirable
composition of the levers. Moreover, it is possible to differentiate among various employee groups, for
instance by age, job tenure and hierarchical level, or to benchmark the company within the industry.
This customized approach emphasizes the practicability of the HPO and the top management team to
provide tailor-made recommendations by levers for an action plan. It has already been used to assess
the culture of several organizations. In a first step the HPO evaluated the culture. Next, the
performance was discussed with the top management, which simultaneously served as a validation for
the tool.
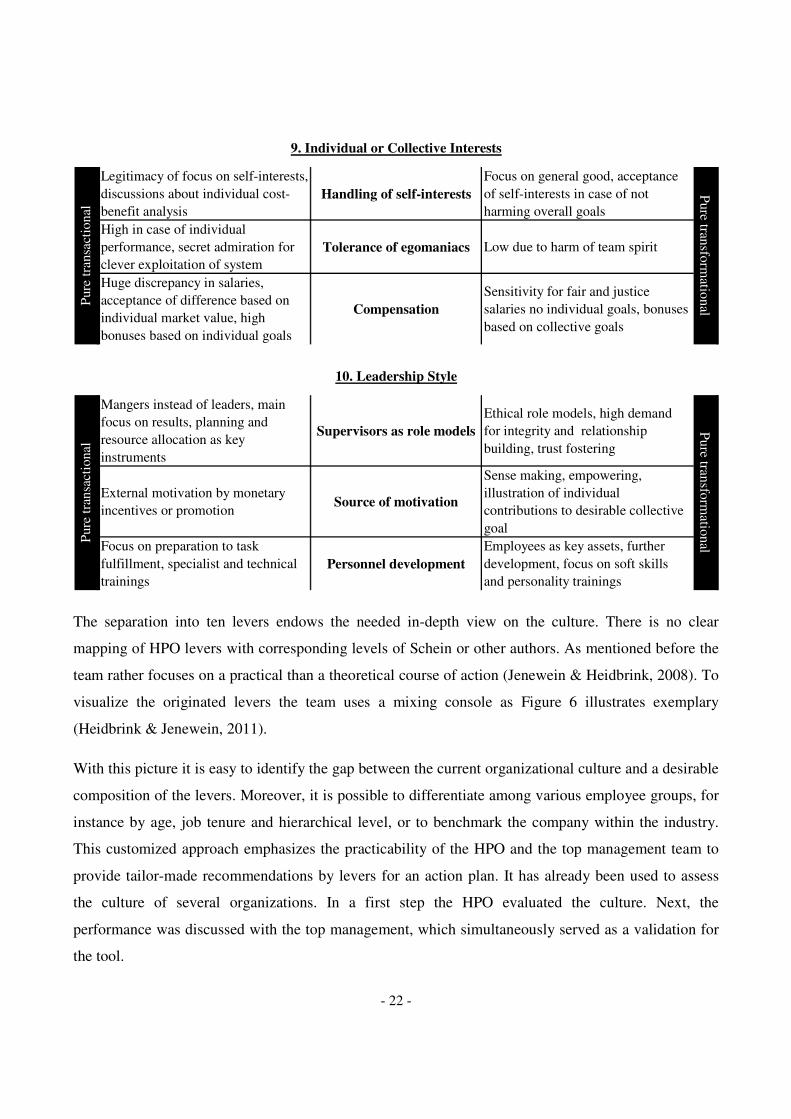
Legitimacy of focus on self-interests,
discussions about individual cost-
benefit analysis
Handling of self-interests
Focus on general good, acceptance
of self-interests in case of not
harming overall goals
High in case of individual
performance, secret admiration for
clever exploitation of system
Tolerance of egomaniacs Low due to harm of team spirit
Huge discrepancy in salaries,
acceptance of difference based on
individual market value, high
bonuses based on individual goals
Compensation
Sensitivity for fair and justice
salaries no individual goals, bonuses
based on collective goals
9. Individual or Collective Interests
Pure
tra
nsa
ctio
nal
P
ure tran
sform
ation
al
Mangers instead of leaders, main
focus on results, planning and
resource allocation as key
instruments
Supervisors as role models
Ethical role models, high demand
for integrity and relationship
building, trust fostering
External motivation by monetary
incentives or promotionSource of motivation
Sense making, empowering,
illustration of individual
contributions to desirable collective
goal
Focus on preparation to task
fulfillment, specialist and technical
trainings
Personnel development
Employees as key assets, further
development, focus on soft skills
and personality trainings
10. Leadership Style
Pure
tra
nsa
ctio
nal
P
ure tran
sform
ation
al
- 23 -
Figure 6: Classification of the organizational culture by HPO.
In opposition to the ODQ the HPO does not express an overall score for the transformational and
transactional dimension. It only reveals results by levers on an interval scale [1, 5]. To create the
mixing console we have to transform the questionnaire interval from one to four into a five item scale.
With n defining the number of participants of one survey, m the number of questions belonging to the
corresponding lever (cf. Appendix 6.2) and q the answer of one specific participant to one question we
can calculate the score of one lever as followed:
������ ∶�4��� 1�3 � 1,������� ∶� 1��
1������
���
��� , !"�∀� ∈ %1,2, … ,10)*�+��� ∈ %1,2,3,4).
Practically, this stands for calculating the mean of all participants for one question, composing the
mean of all questions of one lever and executing a simple interval transformation.
In a last step the transformed results are classified by given ranges (cf. Appendix 6.3) into the five
categories: TF++ (strong transformational), TF+ (slight transformational), 0 (neutral), TA+ (slight
transactional) and TA++ (strong transactional). I will discuss the topic of varying scales in detail in the
result chapter when I compare both quantitatively. Here, it is notable that the transformation of the
assessed four item ordinal scale into a five item interval scale suggests a not given preciseness.
Particularly, against the background that it is not required for the further advancement.
- 24 -
Accessorily, the team altered the suggested dimensions in a significant sense. Jenewein and Heidbrink
see transactional and transformational as two antithetic values of one single continuum (Heidbrink &
Jenewein, 2011), conflicting with Bass’ approach of coexistent within the same continuum (B. M. Bass
& Avolio, 1993), yet, being in line with the primordial description of Burns (Burns, 1978). This means
the HPO records exclusively either transactional or transformational culture. In the ODQ may appear
simultaneously transactional and transformational culture. In the beginning Bass believed that
transformational culture is an extension or an add-on to transactional culture (B. M. Bass, 1985). In
time the two conflicting positions seem to accord slowly (Avolio et al., 1999). Besides, both research
groups forfeit the dimension laissez-faire completely (B. M. Bass & Avolio, 1993; Heidbrink &
Jenewein, 2011).
After all, in order to have a secured tool to measure culture, reliability as well as validity have
isochronally to be fulfilled. The HPO reliability was tested in detail (Brenner, 2012). Up to know it is
clear that all questions and levers point into the same direction, but we do not know, whether the HPO
really evaluates what it intends to assess, that is to say organizational culture. Hence, the concord of the
theoretical model and practical approach must be investigated.
- 25 -
3 METHODS
Initially, I will familiarize the participating four companies of the field study and the collected data
sample. Secondly, I elucidate the statistical models, simulations and tests I used for the analysis.
3.1 Respondents
In total we investigated four companies from very distinct industries. We collected the data in the
fourth quarter of 2012. Consecutively, the anonymous short profiles of the field study:
Company 1 is a long-year experienced non-governmental organization (NGO) based in Germany. The
company is staffed with over 20 full-time employees as well as with over 600 volunteers. For nearly
one century the organization acts as a broker for intercultural exchange programs. They offer a broad
range of possibilities to get in touch with foreign cultures.
Company 2 is a German based subsidiary enterprise of a Swiss technology group. The company
operates mainly in high-growth emerging markets and concentrates on certain systems for mass
production in photovoltaic industries. The key success factor in this fast paced industry is a quick time
to market process in order to become a market leader. After six years of rapid growth, the growth rate
begins to decelerate. The company was founded approximately twenty years ago and was formed by
the founder’s values representing the typical German engineering.
Company 3 is joint venture of a former Russian state-owned enterprise and a French multinational
conglomerate. Three-fourths of the 150 employees come from Russia the other fourth from European
Union countries. The goal of this joint venture is the implementation of a competitive challenger with
core activities in railway industry in order to acquire new projects focused on the development of
customer-oriented products.
Company 4 is a German research organization with three field offices focusing on applied science.
Recently, the company consists of four project teams, but one was integrated within the other existing.
The approximately 300 employees from various disciplines create interdisciplinary, complete,
innovative solutions combining science and engineering. The German government and industry
contracts are the financial base of this company.
- 26 -
Regardless the company each respondent filled in the HPO and contemporarily the ODQ within a
computer based questionnaire. The data sample of company 1 accounts nineteen respondents, whereof
five executives, 26%. Data quality was extraordinary high with only one missing value out of required
1482 answers (19 respondents with 50 HPO questions and 28 ODQ questions). The interviewees
represent a broad cross-section of job types: six from administration and management, four volunteers
and interns, four of the group and short-time program department, two from finance and one each of
school attendance Germany, school attendance abroad and miscellaneous.
We received 61 answers of company 2, but have to skip one, where at least all questions for one lever
of HPO or all questions for one ODQ dimension were not replied. After this elimination data quality
was in turn outstanding with solely one missing value out of required 4680 fields. Ten out of the
remaining 60 were replied by executives, which accounts for 17%. The respondents’ job tenure is
below two years for 28%, two up to five years for 55% and above five years for 17%. They worked for
research and development in case of 43%, in production 27%, in sales and services 15% and in
administration 15%.
For company 3 we collected 137 out of 150 possible fulfilled questionnaires amounting in an overall
response rate of 91%. Here we have to omit ten answer sheets due to missing values. This reduces the
response rate to still salient 85%. For the residual 127 persons we got 12 missing values out of the
needed 9906 queries. In this case before the handover we translated both questionnaires into Russian.
For the other three companies we inserted German versions. The sample consists of nineteen
executives resulting in 14% of total. Their seniority varies between below two years for 61%, two up to
five years for 26% and above five years for 13%. The business areas are represented as followed: 21%
operate for research and development, 77% for production and the remaining 2% in administration.
Nineteen employees returned the distributed questionnaire for company 4. Just as for company 2 we
need to eliminate one answer sheet. The remaining results contained two missing values out of all 1404
single values. Sixteen staff member with managerial responsibility, enumerating 89%, and two without
participated in the survey. Among them were fourteen or 78% with a permanent employment
relationship. 28% of employees work two up to five years and the remaining 72% above five years for
company 4.
Furthermore, we asked the insider experts in charge of the data assessment to reply the questionnaires
as well. Those are people being familiar with the topic of organizational culture and working or
- 27 -
accompanying the regarding companies for several years. Of course they executed the evaluation a
priori to originate independent and unbiased results. They returned a paper and pencil version of the
HPO and ODQ. Accessorily, they evaluated the organizational culture in a qualitative way guided by
the description of the ten strategic levers as presented in Figure 6. We inquire them for a narration of
their own company using their own words. As a help they had a short specification of pure
transactional and transformational culture. Unfortunately, we could not obtain a qualitative analysis for
company 3 from the expert. Altogether, I believe that the deliverables are suitable to serve as a data
base for the study.
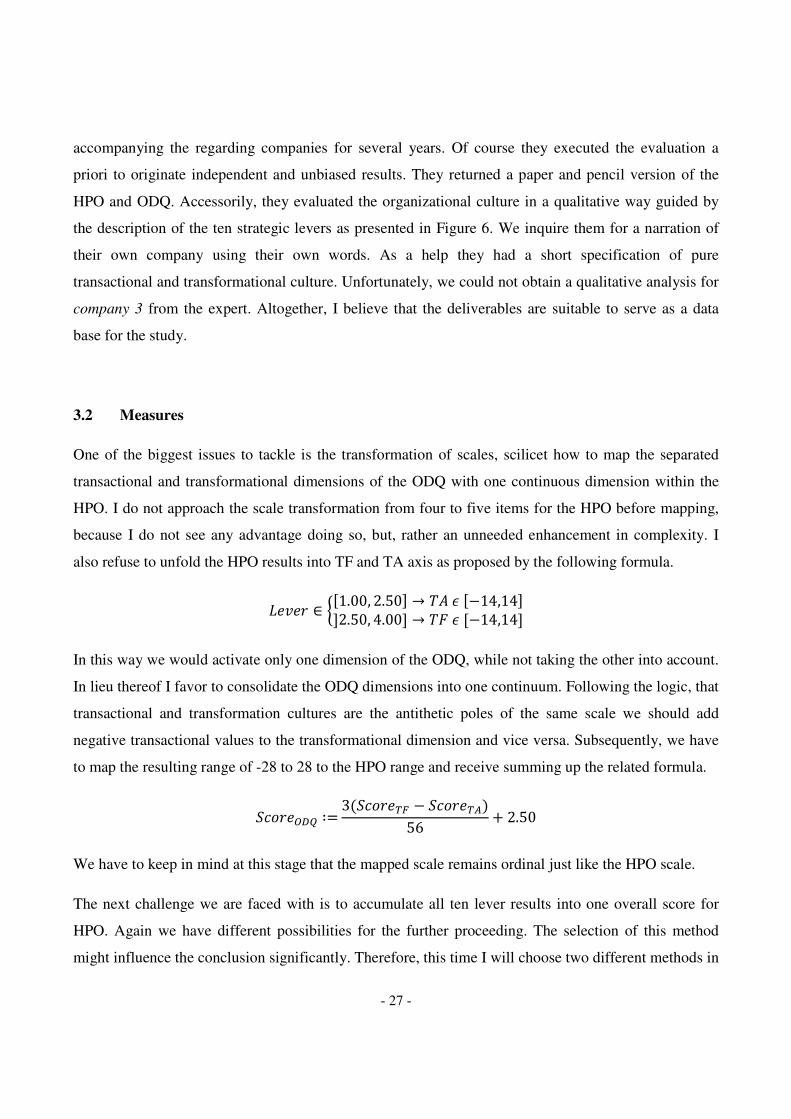
3.2 Measures
One of the biggest issues to tackle is the transformation of scales, scilicet how to map the separated
transactional and transformational dimensions of the ODQ with one continuous dimension within the
HPO. I do not approach the scale transformation from four to five items for the HPO before mapping,
because I do not see any advantage doing so, but, rather an unneeded enhancement in complexity. I
also refuse to unfold the HPO results into TF and TA axis as proposed by the following formula.
����� ∈ -.1.00, 2.500 → 234. 14,14002.50, 4.000 → 254. 14,140
In this way we would activate only one dimension of the ODQ, while not taking the other into account.
In lieu thereof I favor to consolidate the ODQ dimensions into one continuum. Following the logic, that
transactional and transformation cultures are the antithetic poles of the same scale we should add
negative transactional values to the transformational dimension and vice versa. Subsequently, we have
to map the resulting range of -28 to 28 to the HPO range and receive summing up the related formula.
67"��89: ∶� 367"��;< 67"��;=�56 � 2.50
We have to keep in mind at this stage that the mapped scale remains ordinal just like the HPO scale.
The next challenge we are faced with is to accumulate all ten lever results into one overall score for
HPO. Again we have different possibilities for the further proceeding. The selection of this method
might influence the conclusion significantly. Therefore, this time I will choose two different methods in
- 28 -
order not to bias the test by this decision. As the creation of an overall score is still pending for the
Jenewein and Heidbrink research team the results might help them and the discussion may deliver
some new insights.
The simplest estimator to aggregate the individual lever score is to weight all equally, i.e. arithmetical
mean. The disadvantage for this technique is that levers with ten questions and levers with four
questions will be treated with equal measures. Further, we do not take discrepancies in sensitivity or
underlying frequency distributions into consideration. Though, without availability of continuative
information it is still a best a priori estimator.
Alternatively, we could estimate the lever weights by a non-parametric regression with the experts’
opinion as a dependent variable (Hartung, Elpelt, & Klösener, 1998). In the event of accepting the
ODQ as the reference we could also use the ODQ score as a dependent variable. The downside of this
modus operandi is that we optimize the measure in regard to the expected estimators and, accordingly,
distort the later used test statistic. That is why this procedure is not applicable for this study. Whereas it
might be the most suitable method in order to generate an overall score.
Another solution determined by the surveyed data is the selection of weights by Factor Analysis (Falk,
Marohn, & Tewes, 2002). In this case we are going to use the underlying statistical spread of the levers
as weights. We have to force the number of resultant factors to one for this procedure. Besides, I will
not constraint the model by any further specifications. Hence, the implemented Factor Analysis
portrays an explorative modality. As a technique for factoring I choose the Principle Component
Analysis (PCA). This is the most common and intuitive way to estimate the factors. Since we can
assume that our observations are real numbers as a sum of at least four natural numbers we fulfill all
necessary conditions for Factor Analysis via PCA. Empirically the factors are not very sensitive in
regard to the applied technique anyway. For matrix diagonalization I prefer to use the correlation
matrix instead of the covariance matrix, because it makes the interpretation of the results plainer.
Certainly, the determination of any rotation makes no sense owing to the one factor hypothesis. I
interpolate the rare missing values by means of the other respondents’. Thereinafter, we again have to
map the results to a one to four item scale to make them comparable with the raw levers. Finally, I
decide to weight all four companies equally and to calculate the final weights as an average of four
company’s weights, in place of weighting by participants or deviation. From my perspective the main
distinguishing feature is the intercompany assessment rather than interpersonal assessment.
- 29 -
If possible, I will try to use non-parametric methods for tests of significance, because from my point of
view both questionnaires produce ordinal scaled data. On the one hand there is no doubt about the scale
for the HPO, on the other hand the overall scores for both ODQ dimensions are a sum of 14 dichotomy
variables and, therefore, very unlikely to be accurate enough to deduct quantitative metrics. For
instance, one company is three times as transformational as the other company. Moreover, Bass
originally used merely nine types capable of being differentiated as presented in Figure 4. In general
this acknowledgment forces the results and methods to be more conservative. Eventually, we are not
able to maintain a normal distribution approximation for the smallest two data sets with eighteen and
nineteen observations (Sachs & Hedderich, 2009).
Although we are allowed to skip the underlying parametrical distribution assumption for non-
parametric procedures, by definition we need independent and identically distributed random (i.i.d.)
variables with a continuous distribution function. I do not see any issues for the i.i.d. proposition, but
we cannot presume a continuous distribution without loss of generality. Nevertheless, for discrete i.i.d.
variables we are free to use most non-parametric statistic approaches, if we do not have a sufficient
amount of rank ties (Hartung et al., 1998). Due to the fact, that we do not test the raw data, but rather a
linear combination rank ties become rare. I mention this issue separately for any test statistic in case of
numerously rank ties appearance.
To evaluate the correlation and, therefore, to ensure the convergent validity of the HPO-Analyzer
towards the ODQ I will use Spearman's Rank Correlation Coefficient in order to respect effects of all
orders (Hartung et al., 1998).
I assign the null model for the discriminant validity as a simple discrete uniform distribution of the
numbers one, two, three and four, i.e. four-sided dice. It might be possible to generate a more
sophisticated model, for instance by choosing the probabilities according to the appearance among the
survey. Yet, the ultimate purpose of a null model is to represent a pure by chance outcome without any
in-depth premises.
To test the validity of the questionnaires against the null model I accomplish the Wilcoxon-Signed-
Rank-Test, the standard non-parametric alternative for matched-pairs and one sample tests (Hartung et
al., 1998). After defining the test statistic, we need to cope with the mass of data and adjust the level of
significance to our multiple tests. Hence, where required I will make use of the Holm-Bonferroni
method also known as Sequential Bonferroni Correction (SBC) (Sachs & Hedderich, 2009). This
- 30 -
practice enables us to consider the issues in regard to multiple tests while solving the problem feasibly
without harming the level by the gravity of the often approached, pure Bonferroni correction (Sachs &
Hedderich, 2009).
From a statistical perspective the test of accordance is very challenging. Notwithstanding, most of the
literature alludes tests of equality, there are few solutions suggested for such problems (Bortz, 2005;
Falk et al., 2002; Hartung et al., 1998). The common way to test the null hypothesis of inequality is to
control the test power or effect size, but this represents a less-than-ideal solution (Bortz, 2005; Sachs &
Hedderich, 2009). The developed test statistic for this issue is based on a normal distribution called two
one-sided tests (TOST), which belongs to the family of equivalence tests (Sachs & Hedderich, 2009).
In this event, we need to fulfill the regular pre-condition as for the Student's t-test (Sachs & Hedderich,
2009). As we only test the accumulated data on a lever base, we have at least a sum of four ordinal
variables for a minimum amount of eighteen persons. The data sets might not be normal distributed, but
at least do not profoundly violate the requirements. I deliberately do not test for normality of the
distribution, since regardless to the result there are no alternatives to the equivalence test. Eventually, I
determine the thresholds for tolerance with a value of 0.5, which is very broad by reason that the
experts' data set consists only of one opinion and, consequently, might not be balanced out in
comparison to the employees’ evaluation. This border allows us to test a positive and negative
dispersion of 20% about the mean.
As alternative statistical hypothesis testing we might execute a goodness of fit test for discrete
variables, e.g. Chi-Square (Falk et al., 2002). Though, with this procedure we rather validate the item
classification (cf. Appendix 6.3) and not the raw data collected by the questionnaire. Based on this
noted bias I refuse this possibility.
In a last step, I will check the expert’s HPO results against their qualitative assessment of the ten
strategic levers. This qualitative accordance test will not contain any judgment about the predominant
culture. Its exclusive purpose is to identify disagreements among the description and answers.
For the sake of completeness I like to refer, that I carry out all statistical routines with IBM® SPSS®
Version 21, with exception of the equivalence test. This test statistic I had to execute manually with R
Version 2.15.2 (Sachs & Hedderich, 2009), because SPSS is not capable to provide this test.
- 31 -
4 RESULTS
Prior of drawing conclusions with statistical tests and dive deep into the main study I like to summarize
the prevailing data samples as well as to generate easily interpretable graphic. This groundwork is
necessary in order to fully understand the data before executing the right test. Besides, I prepare the
data for the statistical tests. In a last step I am going to compare the qualitative expert description with
the questionnaire results.
4.1 Descriptive and Explorative Statistics
The simplest way to visualize the expert valuation with the employees’ assessment for the HPO is to
mark them both in the HPO mixing console at the same time (cf. Appendix 6.4 – 6.7). However, due to
the classification into fixed five categories we are not able to quantify the gaps in this graphics
precisely.
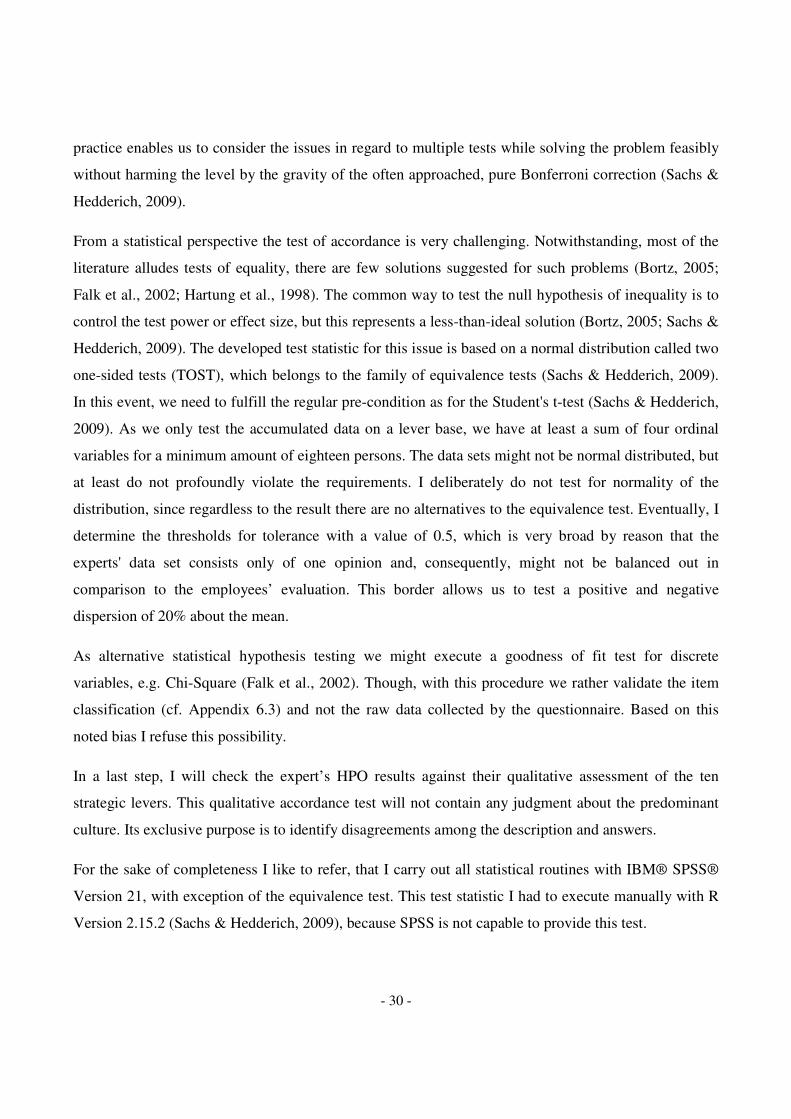
We grasp them as a relative measure of deviation among experts and employees in percent (Delta)
together with mean, standard deviation (S.D.) and raw expert opinion in Table 1 by company and lever.
For company 1 the difference ranges from -7% up to -27%. Interestingly, the expert constantly
overestimates the transformational dimension, represented by the negative algebraic sign. The second
expert creates much lower margins with a maximum amount of -15 percentage points. Overall
company 2 displays a more transactional culture in comparison to company 1 in regard to the experts as
well as employees’ view. Thirdly, company 3 represents an even more transactional culture. The expert
overestimates this time in contrast to company 1 the transactional component. The expert’s belief varies
from -14% up to 31% from the respondents’ average. The range of the delta for company 4 is the
largest among all. It reaches from -16% to 30%. In total the expert evaluates the company’s culture as
more transactionally formed than the participants.
In sum, the standard deviations are quite stable within companies’ levers, but vary among companies.
There are no patterns, whether the employees under- or overestimates one dimension in regard to the
experts’ opinions.
- 32 -
Table 1: Descriptive statistics for HPO levers.
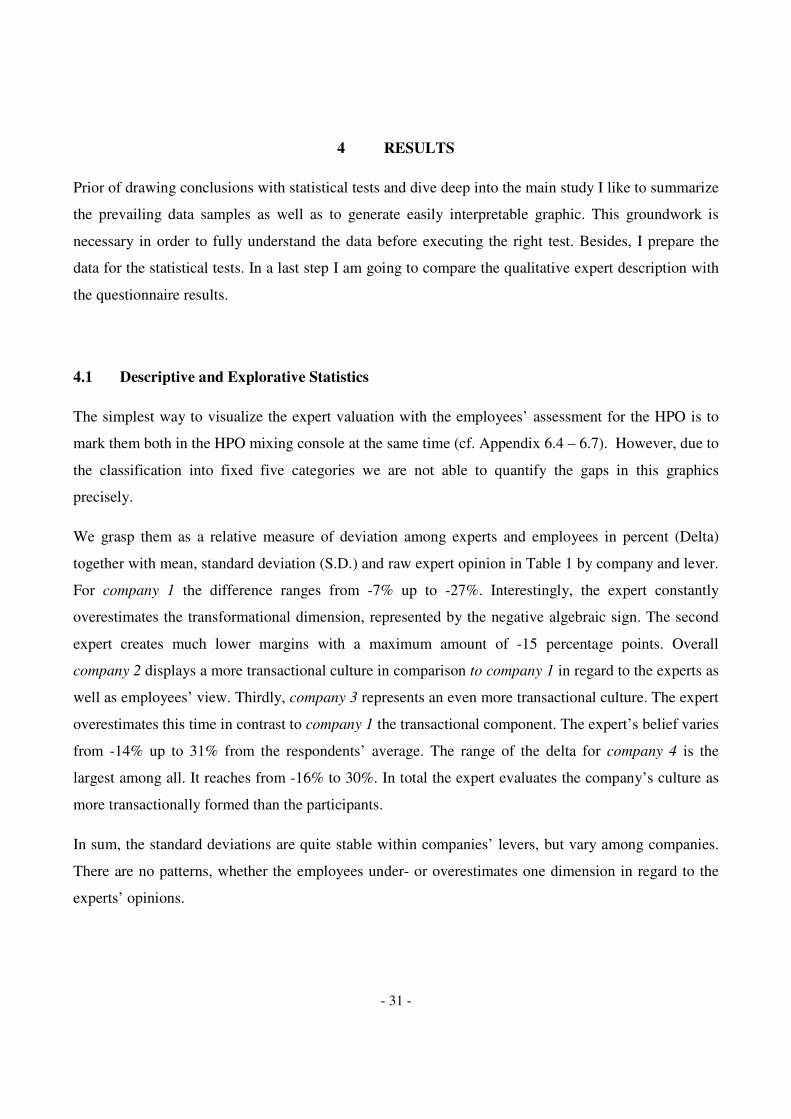
Table 2 displays the descriptive statistics for the ODQ. For company 1 we see a very strong
transformational culture in combination with an underrepresented transactional influence. According to
the classification of Figure 4 company 1 is predominated by the four Is concordantly by expert’s and
participants’ view. The table reveals for company 2 increasing inter (between expert’s and participants’
beliefs) and intra (between participants) deviation in comparison to company 1. If we trust in the
expert’s point of view we have again a four I company. On the other hand the respondents rather group
company 2 into the coasting group. Transactional and transformational impacts contemporarily can be
observed for company 3. The employees declare the company as infused by moderate four Is while the
expert accredits it as moderate contractual. For company 4 as for the HPO we have the biggest
disagreement between the expert’s classification into predominately contractual and employees’
judgment of moderated four Is. Another visualized, explorative interpretation for the data is presented
by their scatter plots (cf. Appendix 6.8 – 6.11).
In addition to the classifications we are able to see at first glance a severe departure of experts’
evaluations from questionnaire results for the transactional dimension (TA) and a lower difference for
the transformational (TF). The high discrepancy of up to -1350% is owed by the larger scale of the
ODQ and, consequently, not comparable one-to-one with the outcomes of Table 1.
Table 2: Descriptive statistics for the ODQ dimensions.
Mean S.D. Expert Delta Mean S.D. Expert Delta Mean S.D. Expert Delta Mean S.D. Expert Delta
Lever 1 3.16 0.36 4.00 -27% 2.46 0.46 2.60 -6% 2.46 0.44 2.00 19% 2.52 0.41 2.40 5%
Lever 2 2.79 0.52 3.00 -8% 2.60 0.61 3.00 -15% 1.95 0.61 1.75 10% 2.38 0.48 2.75 -16%
Lever 3 3.18 0.55 3.40 -7% 2.45 0.67 2.80 -14% 2.32 0.52 1.60 31% 2.48 0.55 2.60 -5%
Lever 4 3.04 0.50 3.60 -18% 2.44 0.54 2.20 10% 2.72 0.41 2.40 12% 2.56 0.44 2.60 -2%
Lever 5 3.11 0.50 3.75 -21% 2.76 0.43 2.50 9% 2.38 0.52 1.75 26% 2.08 0.52 2.00 4%
Lever 6 3.03 0.46 3.50 -16% 2.83 0.48 3.00 -6% 2.31 0.45 2.50 -8% 2.74 0.49 2.50 9%
Lever 7 3.20 0.49 3.75 -17% 3.05 0.48 2.75 10% 2.41 0.50 2.75 -14% 2.64 0.71 2.25 15%
Lever 8 3.28 0.56 4.00 -22% 2.76 0.61 3.00 -9% 2.60 0.45 1.80 31% 2.98 0.56 2.40 19%
Lever 9 3.03 0.43 3.75 -24% 2.84 0.48 2.75 3% 2.79 0.59 2.00 28% 2.86 0.42 2.50 13%
Lever 10 3.23 0.45 3.90 -21% 2.82 0.44 2.70 4% 2.68 0.45 2.70 -1% 2.87 0.55 2.00 30%
Company 4 (n = 18)Company 2 (n = 60)Company 1 (n = 19) Company 3 (n = 127)
Company n Mean TA S.D. TA Expert TA Delta Mean TF S.D. TF Expert TF Delta
C1 19 -6.84 4.18 -9 -32% 9.58 3.88 12 -25%
C2 60 -1.68 6.04 -9 -436% 4.73 5.56 8 -69%
C3 127 2.35 3.62 8 -240% 6.13 5.27 2 67%
C4 18 -0.56 6.53 7 -1350% 6.61 5.65 -7 206%
- 33 -
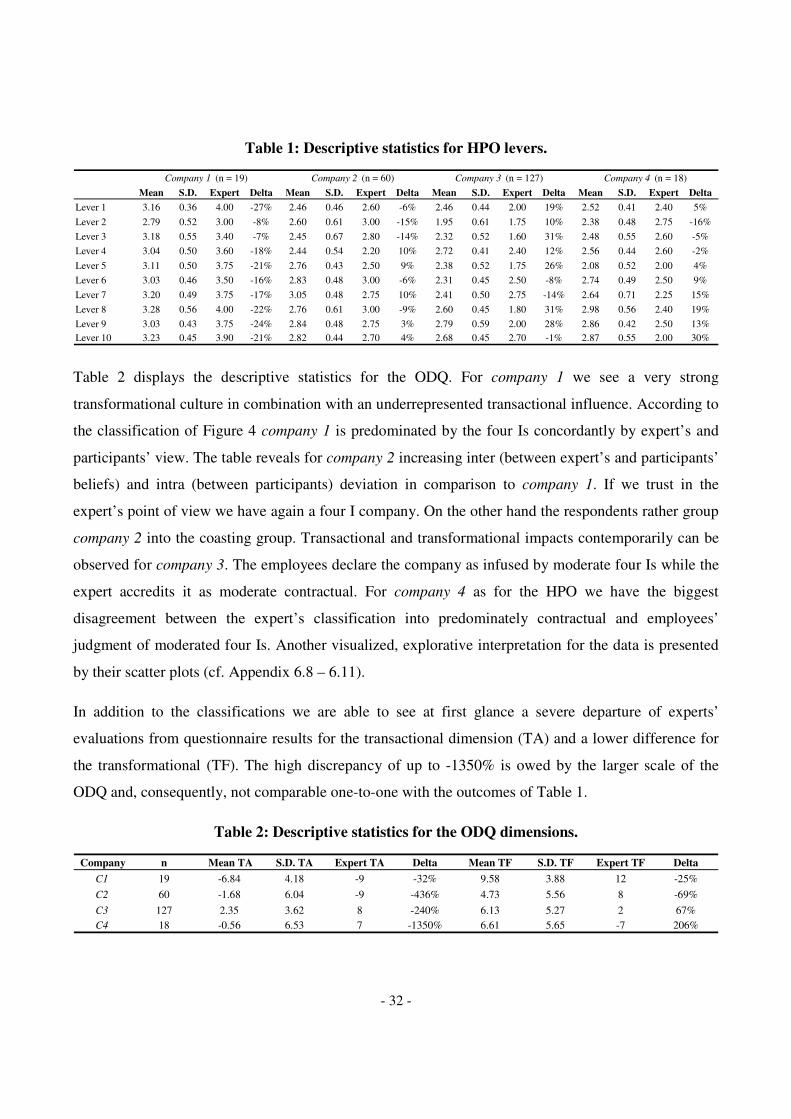
To confront both tools directly we execute the transforming and mapping methods noted in chapter 3.2
for both scales. Table 3 indicates the weights and communalities provided by the Factor Analysis. The
negative weights for two levers of company 3 surprise in this context. By this reason we achieve
unsatisfying communalities particularly for levers 2 and 6. The other eight levers possess excellent
positive factor loadings with a minimum of 0.59. However, taking the communalities into account our
one factor model is not capable of explaining the deviation of the data set. A multifactor model is also
suggested by the scree plots of the Factor Analysis with at least two eigenvalues above one (cf.
Appendix 6.12 – 6.15). We achieve to model 49% of the total variance for company 1, 39% for
company 2, 30% for company 3 and 53% for company 4. Accordingly, at this stage we lose a portion of
the power to predict the organizational culture, but without this simplification we would not be able to
enforce a one-on-one comparison of both questionnaires.
Table 3: Factor Analysis results for HPO scale transformation.
Ultimately, Table 4 presents the relation between the HPO and the ODQ with their transformed mean
and standard deviation. We receive model 1 for the HPO (HPO1) while applying the results from
Factor Analysis and converting the range of the HPO overall score into the interval one to four. The
exact weights are presented in Appendix 6.16. We obtain HPO2 by using equal weights for all strategic
levers. The ODQ overall scores are formed by a combination of the transactional and transformational
dimension and subsequently a simple scale transformation. We observe that the methods of
transformation for the HPO do not influence the results severely. It is explainable that the standard
deviation of HPO1 exceeds HPO2 based on the variance modeling of the Factor Analysis. More
important the standard deviation of the HPO is lower for every company independent of the method.
We might conclude that a smaller variance attests a better measurement tool. Hence, the HPO owns an
advantage for measuring of organizational culture, especially for small data samples.
Company 1 Company 2 Company 3 Company 4 Mean Company 1 Company 2 Company 3 Company 4 Mean
Lever 1 0.85 0.56 0.37 0.66 0.61 0.72 0.32 0.13 0.43 0.40
Lever 2 0.48 0.47 -0.12 0.73 0.39 0.23 0.22 0.01 0.54 0.25
Lever 3 0.79 0.68 0.69 0.66 0.70 0.62 0.46 0.48 0.43 0.50
Lever 4 0.72 0.59 0.56 0.79 0.67 0.53 0.35 0.32 0.63 0.46
Lever 5 0.67 0.39 0.41 0.84 0.58 0.45 0.16 0.17 0.70 0.37
Lever 6 0.21 0.51 -0.18 0.34 0.22 0.04 0.26 0.03 0.11 0.11
Lever 7 0.73 0.73 0.36 0.88 0.68 0.53 0.53 0.13 0.77 0.49
Lever 8 0.67 0.79 0.72 0.79 0.74 0.46 0.63 0.51 0.62 0.55
Lever 9 0.80 0.63 0.76 0.60 0.70 0.64 0.40 0.57 0.36 0.49
Lever 10 0.83 0.78 0.83 0.84 0.82 0.69 0.61 0.68 0.71 0.67
Weights Communality
- 34 -
Table 4: Comparison of HPO and ODQ transformed overall scores.
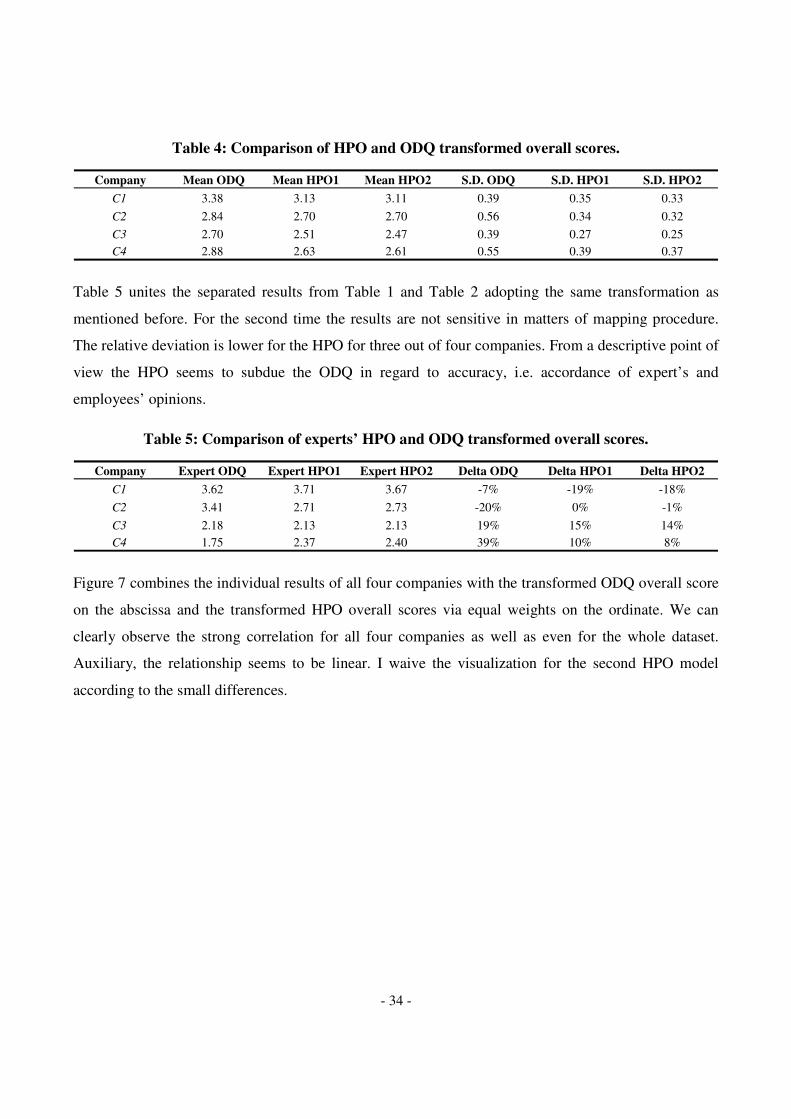
Table 5 unites the separated results from Table 1 and Table 2 adopting the same transformation as
mentioned before. For the second time the results are not sensitive in matters of mapping procedure.
The relative deviation is lower for the HPO for three out of four companies. From a descriptive point of
view the HPO seems to subdue the ODQ in regard to accuracy, i.e. accordance of expert’s and
employees’ opinions.
Table 5: Comparison of experts’ HPO and ODQ transformed overall scores.
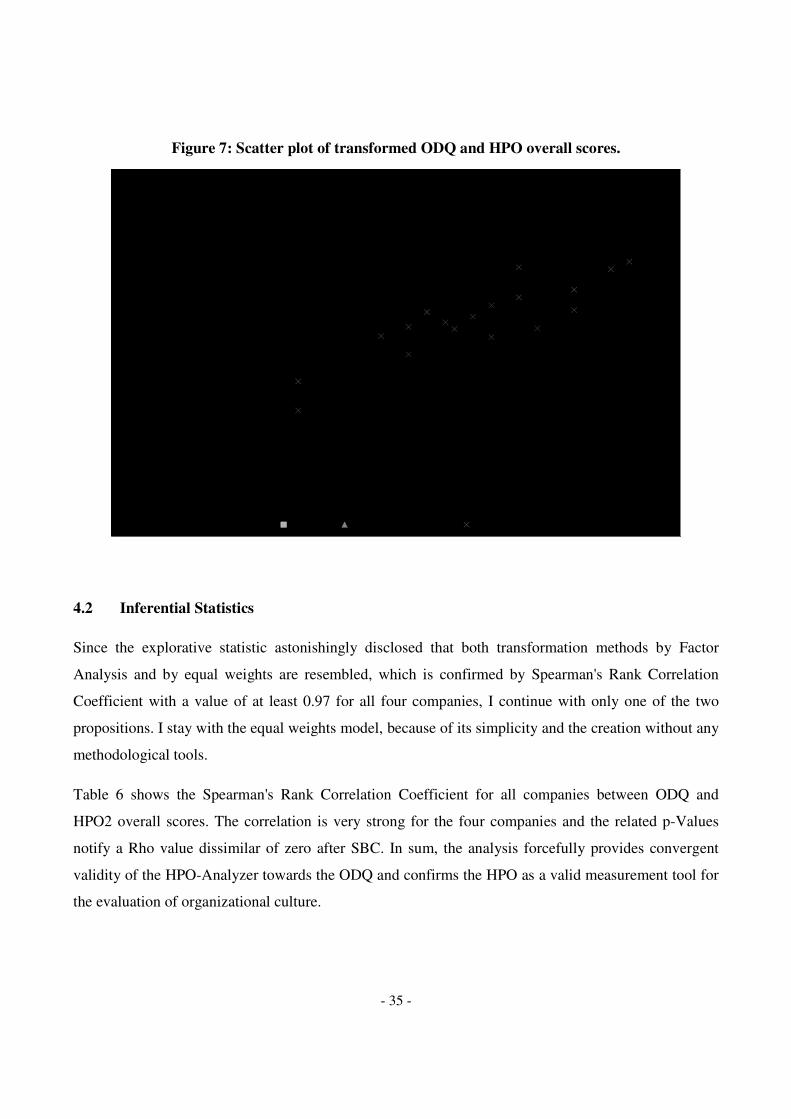
Figure 7 combines the individual results of all four companies with the transformed ODQ overall score
on the abscissa and the transformed HPO overall scores via equal weights on the ordinate. We can
clearly observe the strong correlation for all four companies as well as even for the whole dataset.
Auxiliary, the relationship seems to be linear. I waive the visualization for the second HPO model
according to the small differences.
Company Mean ODQ Mean HPO1 Mean HPO2 S.D. ODQ S.D. HPO1 S.D. HPO2
C1 3.38 3.13 3.11 0.39 0.35 0.33
C2 2.84 2.70 2.70 0.56 0.34 0.32
C3 2.70 2.51 2.47 0.39 0.27 0.25
C4 2.88 2.63 2.61 0.55 0.39 0.37
Company Expert ODQ Expert HPO1 Expert HPO2 Delta ODQ Delta HPO1 Delta HPO2
C1 3.62 3.71 3.67 -7% -19% -18%
C2 3.41 2.71 2.73 -20% 0% -1%
C3 2.18 2.13 2.13 19% 15% 14%
C4 1.75 2.37 2.40 39% 10% 8%
- 35 -
Figure 7: Scatter plot of transformed ODQ and HPO overall scores.
4.2 Inferential Statistics
Since the explorative statistic astonishingly disclosed that both transformation methods by Factor
Analysis and by equal weights are resembled, which is confirmed by Spearman's Rank Correlation
Coefficient with a value of at least 0.97 for all four companies, I continue with only one of the two
propositions. I stay with the equal weights model, because of its simplicity and the creation without any
methodological tools.
Table 6 shows the Spearman's Rank Correlation Coefficient for all companies between ODQ and
HPO2 overall scores. The correlation is very strong for the four companies and the related p-Values
notify a Rho value dissimilar of zero after SBC. In sum, the analysis forcefully provides convergent
validity of the HPO-Analyzer towards the ODQ and confirms the HPO as a valid measurement tool for
the evaluation of organizational culture.
1,00
1,20
1,40
1,60
1,80
2,00
2,20
2,40
2,60
2,80
3,00
3,20
3,40
3,60
3,80
4,00
1,00 1,20 1,40 1,60 1,80 2,00 2,20 2,40 2,60 2,80 3,00 3,20 3,40 3,60 3,80 4,00
HP
O
ODQ
Company 1 Company 2 Company 3 Company 4
- 36 -
Table 6: Spearman's Rank Correlation Coefficient for overall score.
A detailed analysis for any lever is presented in Table 7 for information purposes. In this case it does
not make sense to denote the p-Values, as we are not able to derive any implication or collateral
information from those as well as the correction for multiple tests would force us to test on alpha levels
starting at 0.00125. Once more, lever 2 and 6 diverge from the overall very good correlation. Although
the issues rather pertain the reliability than the validity a revision of both might be helpful in order to
improve the validity. Accessorily, the validity for the levers of company 3 is the weakest, which was
already reported by the lowest overall correlation, though it was not indicated by the descriptive
statistics.
Table 7: Spearman's Rank Correlation Coefficient for all levers.
The next step to achieve construct validity for the HPO is to confirm discriminant validity, i.e. differ
from a pure random model. I used the Wilcoxon-Signed-Rank-Test for matched pairs and received for
company 1 (z = -3.42, p < 0.001) and for company 2 (z = 3.41, p < 0.001) significant differences from
the null model after SBC. Admittedly, the measurement of organizational culture for company 3 (z = -
0.22, p = 0.82, one rank tie) and for company 4 (z = 1.90, p = 0.06) does not vary from by chance
answers. This result is even more alarming in terms of our very simple null model. These observed
patterns, presented in Table 8 might be a sign of low predictive power for balanced, i.e. near 2.50,
organizational cultures. To eliminate possible biases by transforming method I re-executed the test with
HPO1 model, however, the conclusions about acceptance or rejection of the null hypothesis did not
change. For the unlikely event of an extreme distribution of the random number in the null model I also
rerun the test with a new random data set and repeatedly got the same evidence for HPO1 and HPO2.
Rho
* p < 0.005
0.63* 0.82* 0.52* 0.81*
Company 4 (n = 18)Company 3 (n = 127)Company 2 (n = 60)Company 1 (n = 19)
Lever 1
Lever 2
Lever 3
Lever 4
Lever 5
Lever 6
Lever 7
Lever 8
Lever 9
Lever 10
0.50
0.51
0.49
0.650.59 0.59 0.70
Mean
0.48
0.28
0.45
0.53
0.42
0.10
0.58 0.43 0.50
0.59 0.53 0.35
0.40 -0.17 0.24
0.55 0.14 0.83
0.36 0.43
0.50 0.35 0.61
0.20 0.22 0.69
0.52
0.47
0.71
0.45 0.21 0.74
0.36 -0.03 0.54
0.59
0.53
0.25
0.44
0.65
0.56
-0.06
0.49
Company 1 (n = 19) Company 2 (n = 60) Company 3 (n = 127) Company 4 (n = 18)
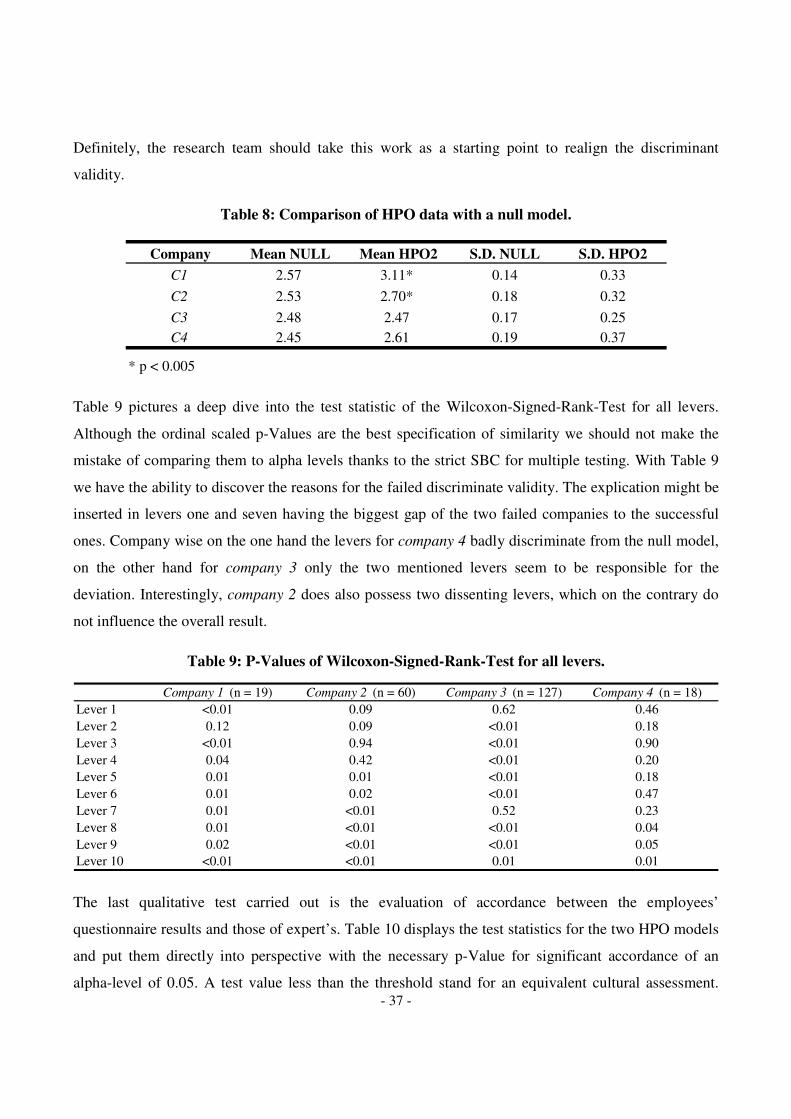
- 37 -
Definitely, the research team should take this work as a starting point to realign the discriminant
validity.
Table 8: Comparison of HPO data with a null model.
Table 9 pictures a deep dive into the test statistic of the Wilcoxon-Signed-Rank-Test for all levers.
Although the ordinal scaled p-Values are the best specification of similarity we should not make the
mistake of comparing them to alpha levels thanks to the strict SBC for multiple testing. With Table 9
we have the ability to discover the reasons for the failed discriminate validity. The explication might be
inserted in levers one and seven having the biggest gap of the two failed companies to the successful
ones. Company wise on the one hand the levers for company 4 badly discriminate from the null model,
on the other hand for company 3 only the two mentioned levers seem to be responsible for the
deviation. Interestingly, company 2 does also possess two dissenting levers, which on the contrary do
not influence the overall result.
Table 9: P-Values of Wilcoxon-Signed-Rank-Test for all levers.
The last qualitative test carried out is the evaluation of accordance between the employees’
questionnaire results and those of expert’s. Table 10 displays the test statistics for the two HPO models
and put them directly into perspective with the necessary p-Value for significant accordance of an
alpha-level of 0.05. A test value less than the threshold stand for an equivalent cultural assessment.
Company Mean NULL Mean HPO2 S.D. NULL S.D. HPO2
C1 2.57 3.11* 0.14 0.33
C2 2.53 2.70* 0.18 0.32
C3 2.48 2.47 0.17 0.25
C4 2.45 2.61 0.19 0.37
* p < 0.005
Lever 1
Lever 2
Lever 3
Lever 4
Lever 5
Lever 6
Lever 7
Lever 8
Lever 9
Lever 10 <0.01 <0.01 0.01 0.01
0.01 <0.01 <0.01 0.04
0.02 <0.01 <0.01 0.05
0.01 0.02 <0.01 0.47
0.01 <0.01 0.52 0.23
0.04 0.42 <0.01 0.20
0.01 0.01 <0.01 0.18
0.12 0.09 <0.01 0.18
<0.01 0.94 <0.01 0.90
Company 1 (n = 19) Company 2 (n = 60) Company 3 (n = 127) Company 4 (n = 18)
<0.01 0.09 0.62 0.46
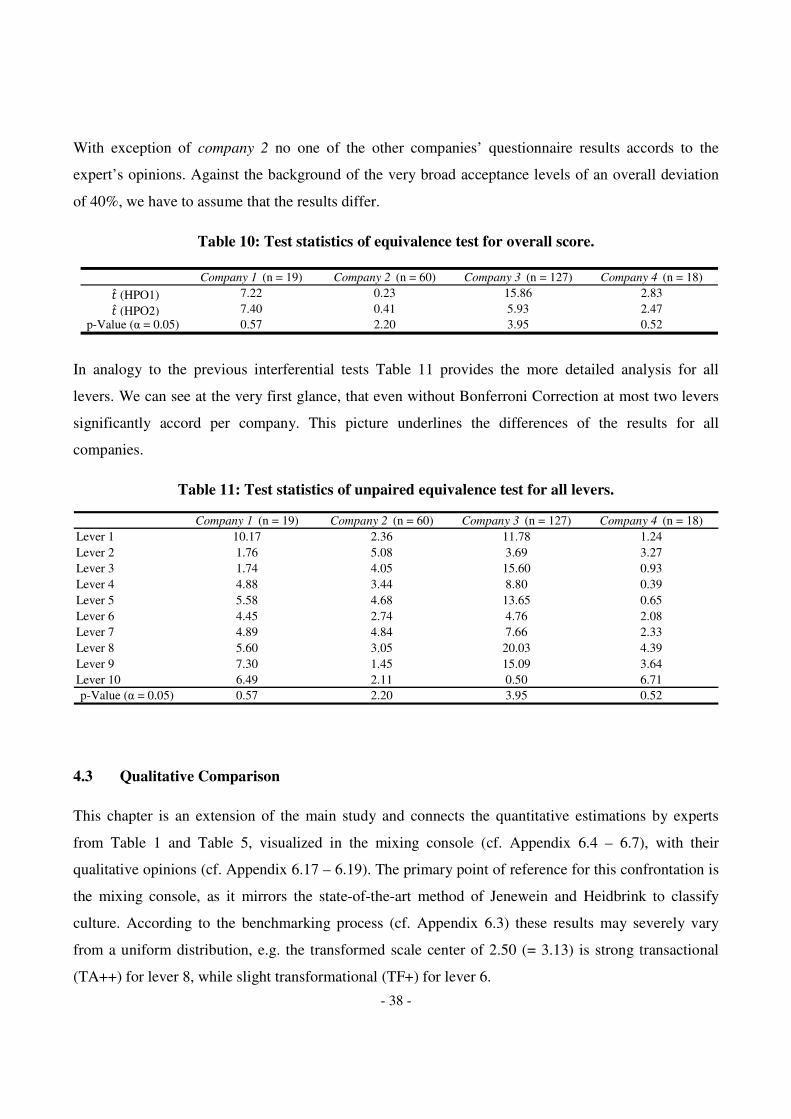
- 38 -
With exception of company 2 no one of the other companies’ questionnaire results accords to the
expert’s opinions. Against the background of the very broad acceptance levels of an overall deviation
of 40%, we have to assume that the results differ.
Table 10: Test statistics of equivalence test for overall score.
In analogy to the previous interferential tests Table 11 provides the more detailed analysis for all
levers. We can see at the very first glance, that even without Bonferroni Correction at most two levers
significantly accord per company. This picture underlines the differences of the results for all
companies.
Table 11: Test statistics of unpaired equivalence test for all levers.
4.3 Qualitative Comparison
This chapter is an extension of the main study and connects the quantitative estimations by experts
from Table 1 and Table 5, visualized in the mixing console (cf. Appendix 6.4 – 6.7), with their
qualitative opinions (cf. Appendix 6.17 – 6.19). The primary point of reference for this confrontation is
the mixing console, as it mirrors the state-of-the-art method of Jenewein and Heidbrink to classify
culture. According to the benchmarking process (cf. Appendix 6.3) these results may severely vary
from a uniform distribution, e.g. the transformed scale center of 2.50 (= 3.13) is strong transactional
(TA++) for lever 8, while slight transformational (TF+) for lever 6.
p-Value (α = 0.05)
5.93
15.86
0.41
0.23
7.40
7.22
Company 1 (n = 19) Company 2 (n = 60) Company 3 (n = 127) Company 4 (n = 18)
0.57 2.20 3.95 0.52
2.47
2.83(HPO1)
(HPO2)
Lever 1
Lever 2
Lever 3
Lever 4
Lever 5
Lever 6
Lever 7
Lever 8
Lever 9
Lever 10
p-Value (α = 0.05)
6.49 2.11 0.50 6.71
0.57 2.20 3.95 0.52
5.60 3.05 20.03 4.39
7.30 1.45 15.09 3.64
4.45 2.74 4.76 2.08
4.89 4.84 7.66 2.33
4.88 3.44 8.80 0.39
5.58 4.68 13.65 0.65
1.76 5.08 3.69 3.27
1.74 4.05 15.60 0.93
Company 1 (n = 19) Company 2 (n = 60) Company 3 (n = 127) Company 4 (n = 18)
10.17 2.36 11.78 1.24
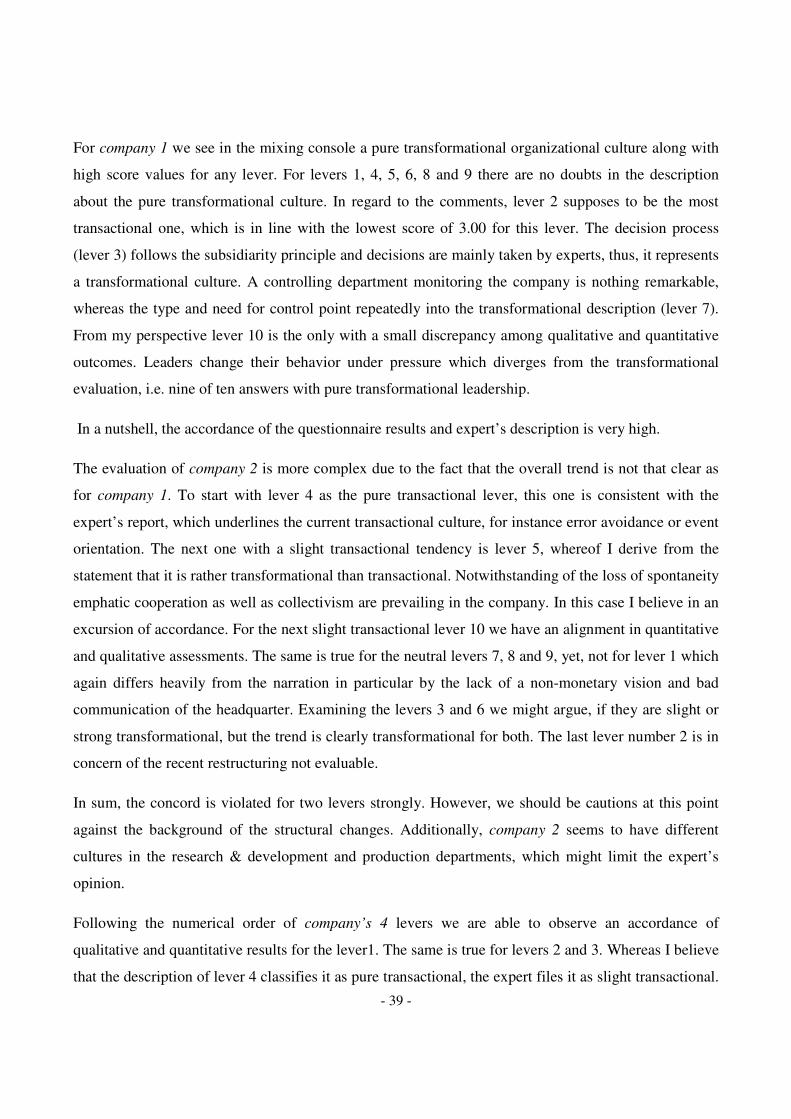
- 39 -
For company 1 we see in the mixing console a pure transformational organizational culture along with
high score values for any lever. For levers 1, 4, 5, 6, 8 and 9 there are no doubts in the description
about the pure transformational culture. In regard to the comments, lever 2 supposes to be the most
transactional one, which is in line with the lowest score of 3.00 for this lever. The decision process
(lever 3) follows the subsidiarity principle and decisions are mainly taken by experts, thus, it represents
a transformational culture. A controlling department monitoring the company is nothing remarkable,
whereas the type and need for control point repeatedly into the transformational description (lever 7).
From my perspective lever 10 is the only with a small discrepancy among qualitative and quantitative
outcomes. Leaders change their behavior under pressure which diverges from the transformational
evaluation, i.e. nine of ten answers with pure transformational leadership.
In a nutshell, the accordance of the questionnaire results and expert’s description is very high.
The evaluation of company 2 is more complex due to the fact that the overall trend is not that clear as
for company 1. To start with lever 4 as the pure transactional lever, this one is consistent with the
expert’s report, which underlines the current transactional culture, for instance error avoidance or event
orientation. The next one with a slight transactional tendency is lever 5, whereof I derive from the
statement that it is rather transformational than transactional. Notwithstanding of the loss of spontaneity
emphatic cooperation as well as collectivism are prevailing in the company. In this case I believe in an
excursion of accordance. For the next slight transactional lever 10 we have an alignment in quantitative
and qualitative assessments. The same is true for the neutral levers 7, 8 and 9, yet, not for lever 1 which
again differs heavily from the narration in particular by the lack of a non-monetary vision and bad
communication of the headquarter. Examining the levers 3 and 6 we might argue, if they are slight or
strong transformational, but the trend is clearly transformational for both. The last lever number 2 is in
concern of the recent restructuring not evaluable.
In sum, the concord is violated for two levers strongly. However, we should be cautions at this point
against the background of the structural changes. Additionally, company 2 seems to have different
cultures in the research & development and production departments, which might limit the expert’s
opinion.
Following the numerical order of company’s 4 levers we are able to observe an accordance of
qualitative and quantitative results for the lever1. The same is true for levers 2 and 3. Whereas I believe
that the description of lever 4 classifies it as pure transactional, the expert files it as slight transactional.
- 40 -
Admittedly, it is hard to precisely rate discrepancies of one class. The expert’s overall narration for the
levers 5, 7, 8, 9 and 10 of a transactional company fits to the HPO mixing console, but the expert
constraints that there are transformational teams within the organization. From my perspective the
arguments for lever 4 can be transferred to lever 6. I consider it more transactional than the HPO.
Concentrating company’s 4 comparisons the general tendency is given for most of the levers.
Particularly, in this case it is not possible to contrast the transactional description of the whole company
against the transactional characterization of certain teams.
- 41 -
5 DISCUSSION AND FUTURE RESEARCH DIRECTIONS
In the final discussion I want to establish a reference to the aspiring main and supplementary goals. I
also like to emphasize the implications of this work for further research in order to improve the HPO.
Secondly, I will refer to the constraints of this work as well as the weaknesses due to the taken
assumptions. In the end I like to add a short personal note on the necessity of the development of
measurement tools for organizational culture in its entirety.
5.1 Summary, Implications and Recommendations
To approach the HPO unscrupulously and deduct implications this tool needs to be validated. This
study examined thoroughly different facets of a validation process. Above, all ten levers were
investigated in all descriptive and analytical steps. Doing so, we are able to link all findings directly to
their sources. Altogether, this HPO validation exceeds the usual validation studies for comparable tools
methodically by far (B. M. Bass & Avolio, 1993; O’Reilly III et al., 1991).
Moreover, the validation was carried out not only on one data sample (Hofstede et al., 1990), but for
four different companies from various industries. We achieved in general a very good coverage of the
whole firm with an outstanding data quality. The database is not biased by different points of time and
all comparisons were carried out by the same frameworks and circumstances within all four firms. In a
nutshell, this diversification helps to underline the robustness of this study as well as it enables to test
the applicability on different settings.
Firstly, this study confirms the convergent validity of the HPO towards the ODQ on a significant level.
There are no doubts that the HPO and the ODQ measure the same characteristics of organizational
culture. If we believe that the ODQ quantifies organizational culture appropriately (Parry & Proctor-
Thomson, 2001) than the HPO does the same. Though, the HPO possesses a lower volatility among
participants’ results and, hence, might be the more appropriate tool for small companies. Another
benefit of the HPO is the separation into ten strategic levers which allows a more detailed analysis of
organizational culture. Eight out of ten levers seems to be concordant with the ODQ measures.
Based on the convergent validity assessment I think that, especially the reliability for levers 2 and 6
should be revised with the new database. The utilized Factor Analysis supports this conclusion as well.
- 42 -
In general, the Factor Analysis findings with a multifactor model reveal that adjustments of the
questionnaire might lead to a higher reliability. In an accustomed procedure the reliability and validity
tests should be carried out on a regular base in case of a data base extension. I recommend making use
of non-parametric methods for the item selection by replacing the Pearson Product-Moment Correlation
coefficients by Spearman's Rank Correlation Coefficient. Alternatively, the Jenewein and Heidbrink
research team may employ Rausch-Models to solve the issues implied by an ordinal scale (Rasch,
1961). Unfortunately, a regular validation cycle is rarely executed for the existing measurement tools
for cultural assessment (Parry & Proctor-Thomson, 2001).
Secondly, the discriminant validity is not fulfilled for the HPO. The HPO questionnaire responses from
employees do not significantly differ from complete random patterns. There might be different causes
for this failure. From my point of view the most probable one is that the scale of one to four within the
questionnaire occupies too low prediction power, in particular close-by the center of the data. The two
companies with a mixed organizational culture do not fulfill the discriminant validity. A possible
solution might be the widening of the scale or a conversion of the deliverables by a non-linear variance
de-stabilizing transformation. Supplementary, the number of questions per levers ranges from four ten.
It could improve the prediction power to balance the number of questions in a manner using the
minimum required number in order to ensure validity and reliability. An additional explanation for the
collapse could be that the participants did not fully understand the questionnaires and, therefore,
answered randomly. Notably, for company 3 the translation of the queries may dilute the discrimination
power. Basically, a low item difficulty is the most obvious reason for the bad prediction power, but it
could be foreclosed for the HPO (Brenner, 2012). It is worth to mention that most of the existing
cultural measurement tools, e.g. the ODQ, were not tested for discriminant validity (B. M. Bass &
Avolio, 1993; Parry & Proctor-Thomson, 2001). The collected data offers the possibility to convey
such a study for the ODQ.
Thirdly, the accordance of the experts’ HPO questionnaire answers and the employees’ responses could
not be confirmed significantly. There are no patterns noticeable, weather this disagreement is based on
certain levers, wrong scale setting or not given discriminant validity. It is important to note, that this is
not per se an impairment of the HPO. This result might be biased by a wrong selection of the experts as
well as by the sheer fact that one expert per company might be to less. Furthermore, the not met
methodical test pre-requirements are another source of errors, which might manipulate the test
performance. Although it is not part of the main study I complementarily performed the equivalence
- 43 -
test for the transactional and transformational dimension of the ODQ and received permanent
disagreements for all four companies. This could indicate as well that the test set up is defective.
Besides, the statistical implication differs completely from the mixing console classification. Those
rather signal that company 1 and company 3 possess agreement in contrast to company 2. In this
context it might be interesting to incorporate the findings of this thesis into the item classification (cf.
Appendix 6.3). In particular, the adopted scale is not centered and, therefore, a distortive skewness
prevails. It seems also thinkable to rather utilize an continuous scale instead of an discrete scale for the
mixing console. In this way also the transformation from a four item scale to a five item scale can be
avoided. I believe that the whole item classification is an artificial help to overcome the incurred
deficiencies within the questionnaire scale. This issue could rather be solved in the beginning with a
wider questionnaire range as noted above. Overall the benchmarking process might be readjusted to the
broader data base.
Ultimately, the desirable qualitative validation was briefly executed (Schein, 2009). This approach is
merely a supplement in this work, yet, should be extended to utilize the evaluated date efficiently. The
comparison does not reveal a tendency. It suggests that in general the mixing console reflects the
intended organizational cultural description. I suggest accomplishing in-depth mini case studies for any
of the four companies by practiced experts in this research fields. The methods to tackle those are
already established with the framework of the ten levers (cf. Figure 5). Additionally, the main part of
data collection is already completed. In this vein the described subcultures might be assessed more
precisely and even a comparison with the regarding questionnaire results, i.e. clustered by business
unit, is doable.
In sum, this study does not fully attest construct validity for the HPO.
5.2 Limitations
One of the key decisions to examine the convergence validity was to pool the transactional and
transformational scales of the ODQ into a single figure within one continuum. Definitely, there are
other feasibilities to solve the issue in comparison to the provided approach. For example, I could
instead unfold the HPO continuum into two dimension. However, from my perspective it makes more
sense to map against the HPO scale as the point of interest of this work. Accessorily, the negative
- 44 -
transactional points might not be added to the transactional dimension and vice versa. Indeed, this
would contradict the model, that transactional and transformation cultures are the antithetic poles of the
same scale (Burns, 1978; Heidbrink & Jenewein, 2011). Furthermore, the question about the number of
dimensions is still in discussion and not finally resolved (Avolio et al., 1999; B. M. Bass & Avolio,
1993; Burns, 1978). Besides, the HPO completely ignores the postulated third dimension of
transactional and transformational organizational culture, namely Laissez-faire (B. M. Bass & Avolio,
1993).
Moreover, we have to consider that nearly half of the predication power gets lost through the
accumulation of the strategic levers. With all this manipulations in order to make the HPO and the
ODQ comparable we oversimplify the already truncated organizational culture. Nevertheless, even
with all this limitations the convergence validity is still proven.
A second big issue is the small data sample for expert evaluations. Having solely one expert per
company makes the results very dependent to subjectivity. Especially, the test of accordance is highly
affected by this restraint. The addition of further participants will lead to more robust implications.
Over and above the selection of the expert might be diversified by combining an insider with an
outsider.
Next, we did not take sub-cultures for this study into consideration, yet, there are strong signs that they
exist in the examined companies (cf. Appendix 6.17 - 6.19) as well as they could even be more
powerful than the overall culture (Schein, 1990). For instance if an expert works in a small department
with a different culture than the overall company culture, the expert surely tends to describe his
department culture. Hence, sub-cultures could influence the results of this validity test.
Another not covered topic is the investigation, if the practical approach of the HPO development
touches the holistic theoretical concept of transactional and transformational culture. For example the
last strategic lever should at least describe the full range of leadership (cf. Figure 3). Not only the
broadness, but also the deepness namely the three levels of organizational culture (Schein, 1990)
should be evaluated sufficiently.
Lastly, the data sample might not be representative. Especially for company 2 and company 4 we do
not get an appropriate coverage of the companies’ workforce. Again this could contradict with the
experts’ point of view.
- 45 -
5.3 Final Note
The research team of Jenewein and Heidbrink developed a new tool to have the capability to measure
organizational culture in ten key dimensions based on the theory of transactional and transformational
culture (Heidbrink & Jenewein, 2011). They are aware that in detail neither the deepness nor the
broadness of culture are quantifiable (Heidbrink & Jenewein, 2011). Nevertheless, such a survey
method is helpful to benchmark roughly different companies or industries, to sensibilize employees to
think about this topic and to serve as a starting-point for an in-depth analysis. Though, a quantitative
measurement tool always oversimplifies culture (Schein, 2009), the HPO at least enables the top
management to evaluate ten different topics. The tradeoff between complexity of such a broad and deep
concept as organizational culture on the one hand and the requirement of simplicity represented by a
single KPI on the other hand is balanced quite well with the HPO mixing console.
From my perspective this classification combined with the visual display improves the usability in
comparison to prevailing tools of transactional and transformational culture measurement. Furthermore,
the criticized dichotomy of the ODQ questionnaire (Parry & Proctor-Thomson, 2001) combined with
the lack of an in-depth validation like discriminant validity offer space for improvement. Therefore,
from my point of view the HPO represents the next evolutional step for quantification of organizational
culture in the dimensions of transactional and transformational.
I myself had the chance to assistant during such a workshop of mid management in a huge German
financial advisory company to get in touch with the practical site of cultural assessment. The HPO
accompanied the cultural change process as an accessory tool for measurement. It was successfully
utilized among others to reveal differences between different branches.
Although, there might still be a lot of work to be done to measure organizational culture sufficient
enough, it is worth the effort. Every small step will be leveraged by the enormous power that culture
emerges.

- 46 -
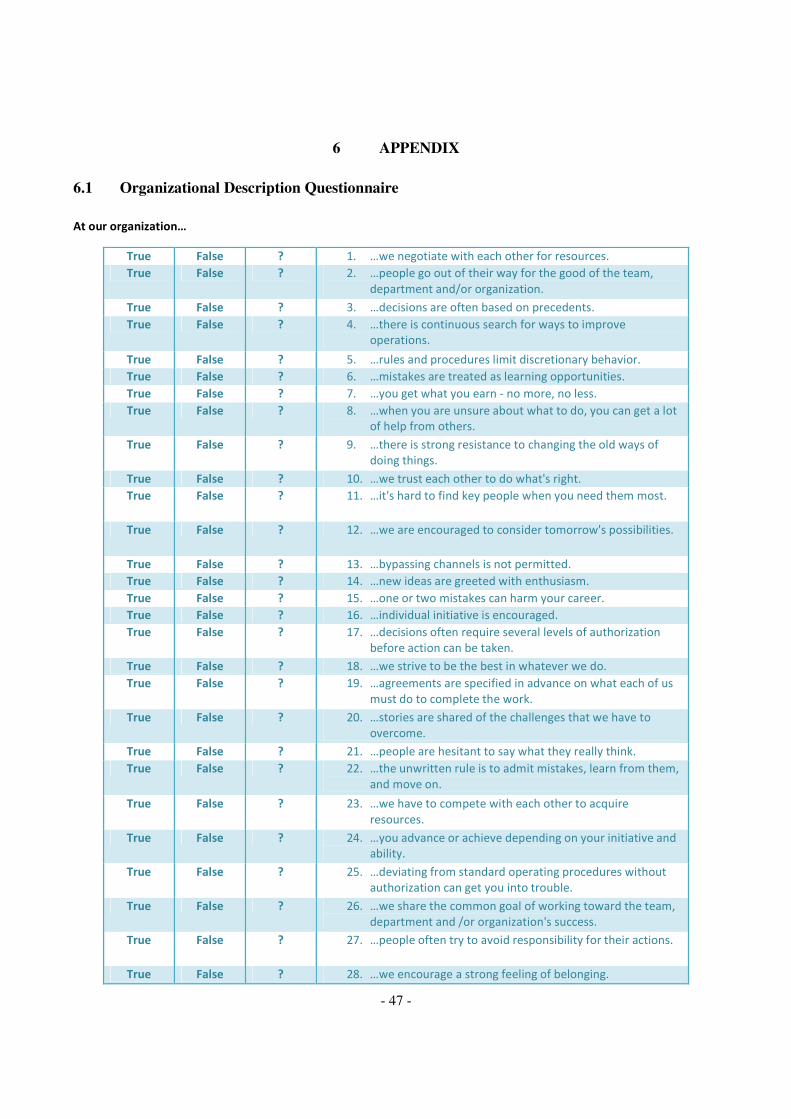
- 47 -
6 APPENDIX
6.1 Organizational Description Questionnaire
At our organization…
True False ? 1. …we negotiate with each other for resources.
True False ? 2. …people go out of their way for the good of the team,
department and/or organization.
True False ? 3. …decisions are often based on precedents.
True False ? 4. …there is continuous search for ways to improve
operations.
True False ? 5. …rules and procedures limit discretionary behavior.
True False ? 6. …mistakes are treated as learning opportunities.
True False ? 7. …you get what you earn - no more, no less.
True False ? 8. …when you are unsure about what to do, you can get a lot
of help from others.
True False ? 9. …there is strong resistance to changing the old ways of
doing things.
True False ? 10. …we trust each other to do what's right.
True False ? 11. …it's hard to find key people when you need them most.
True False ? 12. …we are encouraged to consider tomorrow's possibilities.
True False ? 13. …bypassing channels is not permitted.
True False ? 14. …new ideas are greeted with enthusiasm.
True False ? 15. …one or two mistakes can harm your career.
True False ? 16. …individual initiative is encouraged.
True False ? 17. …decisions often require several levels of authorization
before action can be taken.
True False ? 18. …we strive to be the best in whatever we do.
True False ? 19. …agreements are specified in advance on what each of us
must do to complete the work.
True False ? 20. …stories are shared of the challenges that we have to
overcome.
True False ? 21. …people are hesitant to say what they really think.
True False ? 22. …the unwritten rule is to admit mistakes, learn from them,
and move on.
True False ? 23. …we have to compete with each other to acquire
resources.
True False ? 24. …you advance or achieve depending on your initiative and
ability.
True False ? 25. …deviating from standard operating procedures without
authorization can get you into trouble.
True False ? 26. …we share the common goal of working toward the team,
department and /or organization's success.
True False ? 27. …people often try to avoid responsibility for their actions.
True False ? 28. …we encourage a strong feeling of belonging.
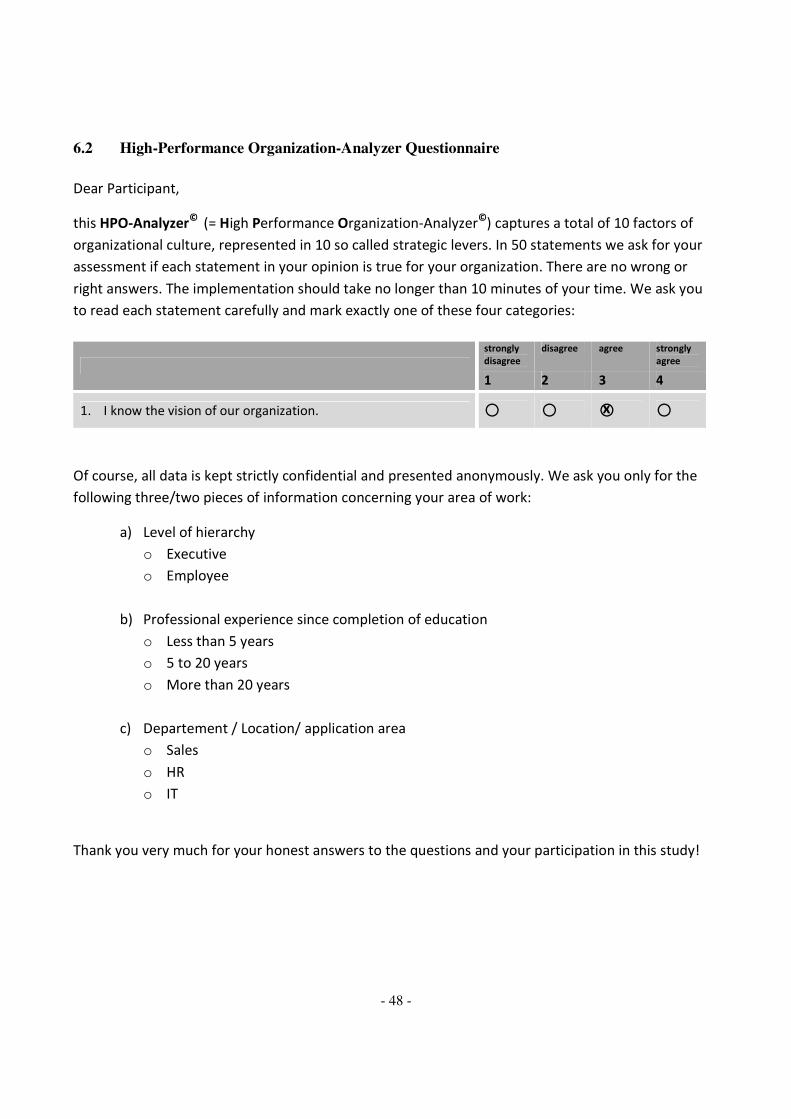
- 48 -
6.2 High-Performance Organization-Analyzer Questionnaire
Dear Participant,
this HPO-Analyzer©
(= High Performance Organization-Analyzer©
) captures a total of 10 factors of
organizational culture, represented in 10 so called strategic levers. In 50 statements we ask for your
assessment if each statement in your opinion is true for your organization. There are no wrong or
right answers. The implementation should take no longer than 10 minutes of your time. We ask you
to read each statement carefully and mark exactly one of these four categories:
Of course, all data is kept strictly confidential and presented anonymously. We ask you only for the
following three/two pieces of information concerning your area of work:
a) Level of hierarchy
o Executive
o Employee
b) Professional experience since completion of education
o Less than 5 years
o 5 to 20 years
o More than 20 years
c) Departement / Location/ application area
o Sales
o HR
o IT
Thank you very much for your honest answers to the questions and your participation in this study!
strongly
disagree
disagree agree strongly
agree
1 2 3 4
1. I know the vision of our organization. � � � � x
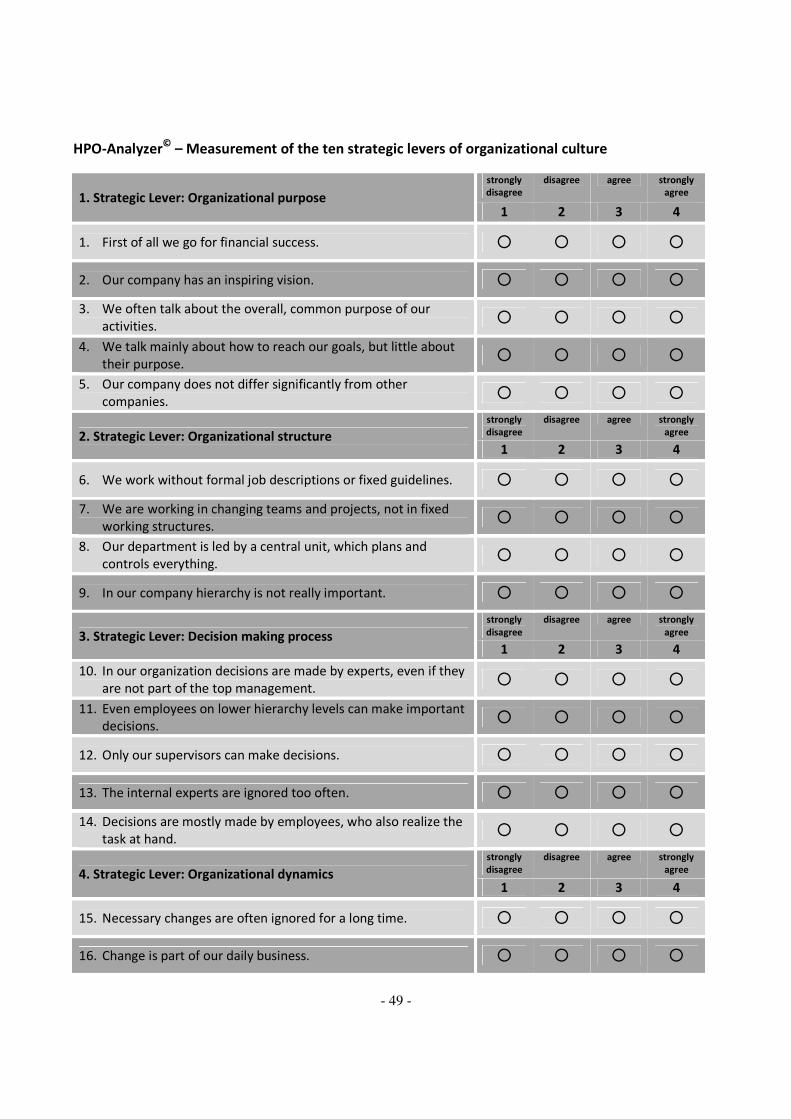
- 49 -
HPO-Analyzer©
– Measurement of the ten strategic levers of organizational culture
1. Strategic Lever: Organizational purpose
strongly
disagree
disagree agree strongly
agree
1 2 3 4
1. First of all we go for financial success. � � � �
2. Our company has an inspiring vision. � � � �
3. We often talk about the overall, common purpose of our
activities. � � � �
4. We talk mainly about how to reach our goals, but little about
their purpose. � � � �
5. Our company does not differ significantly from other
companies. � � � �
2. Strategic Lever: Organizational structure
strongly
disagree
disagree agree strongly
agree
1 2 3 4
6. We work without formal job descriptions or fixed guidelines. � � � �
7. We are working in changing teams and projects, not in fixed
working structures. � � � �
8. Our department is led by a central unit, which plans and
controls everything. � � � �
9. In our company hierarchy is not really important. � � � �
3. Strategic Lever: Decision making process
strongly
disagree
disagree agree strongly
agree
1 2 3 4
10. In our organization decisions are made by experts, even if they
are not part of the top management. � � � �
11. Even employees on lower hierarchy levels can make important
decisions. � � � �
12. Only our supervisors can make decisions. � � � �
13. The internal experts are ignored too often. � � � �
14. Decisions are mostly made by employees, who also realize the
task at hand. � � � �
4. Strategic Lever: Organizational dynamics
strongly
disagree
disagree agree strongly
agree
1 2 3 4
15. Necessary changes are often ignored for a long time. � � � �
16. Change is part of our daily business. � � � �
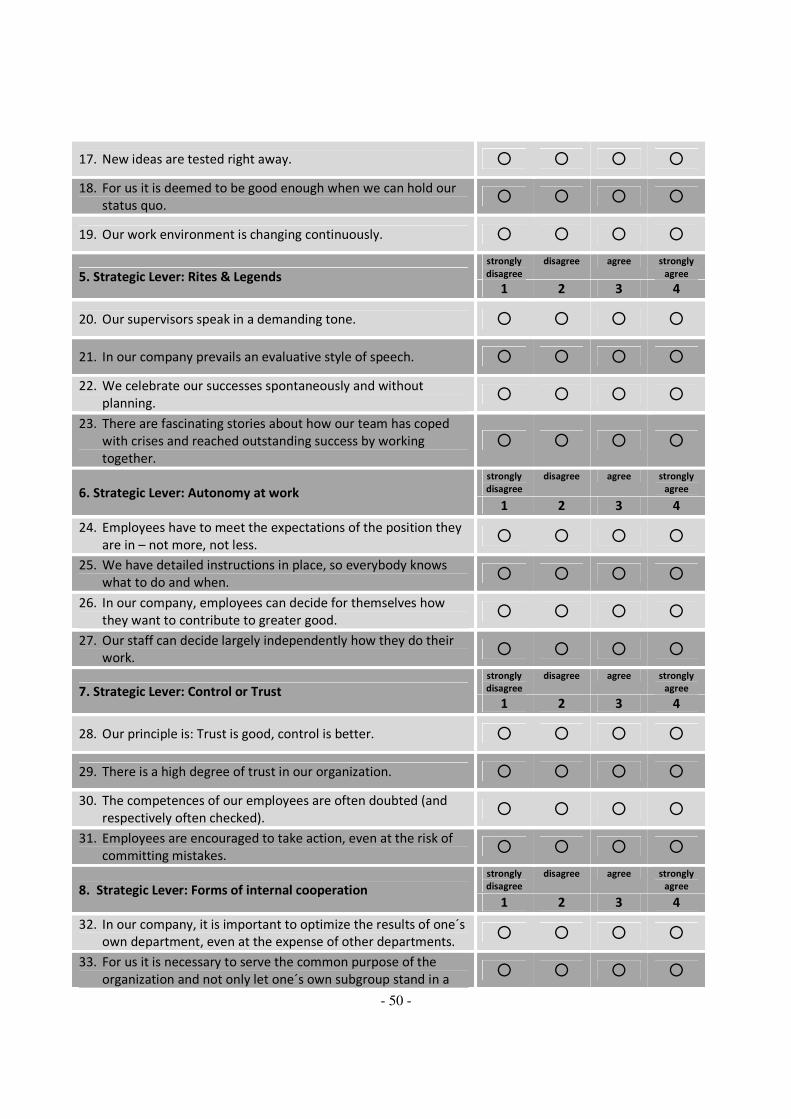
- 50 -
17. New ideas are tested right away. � � � �
18. For us it is deemed to be good enough when we can hold our
status quo. � � � �
19. Our work environment is changing continuously. � � � �
5. Strategic Lever: Rites & Legends
strongly
disagree
disagree agree strongly
agree
1 2 3 4
20. Our supervisors speak in a demanding tone. � � � �
21. In our company prevails an evaluative style of speech. � � � �
22. We celebrate our successes spontaneously and without
planning. � � � �
23. There are fascinating stories about how our team has coped
with crises and reached outstanding success by working
together. � � � �
6. Strategic Lever: Autonomy at work
strongly
disagree
disagree agree strongly
agree
1 2 3 4
24. Employees have to meet the expectations of the position they
are in – not more, not less. � � � �
25. We have detailed instructions in place, so everybody knows
what to do and when. � � � �
26. In our company, employees can decide for themselves how
they want to contribute to greater good. � � � �
27. Our staff can decide largely independently how they do their
work. � � � �
7. Strategic Lever: Control or Trust
strongly
disagree
disagree agree strongly
agree
1 2 3 4
28. Our principle is: Trust is good, control is better. � � � �
29. There is a high degree of trust in our organization. � � � �
30. The competences of our employees are often doubted (and
respectively often checked). � � � �
31. Employees are encouraged to take action, even at the risk of
committing mistakes. � � � �
8. Strategic Lever: Forms of internal cooperation
strongly
disagree
disagree agree strongly
agree
1 2 3 4
32. In our company, it is important to optimize the results of one´s
own department, even at the expense of other departments. � � � �
33. For us it is necessary to serve the common purpose of the
organization and not only let one´s own subgroup stand in a � � � �
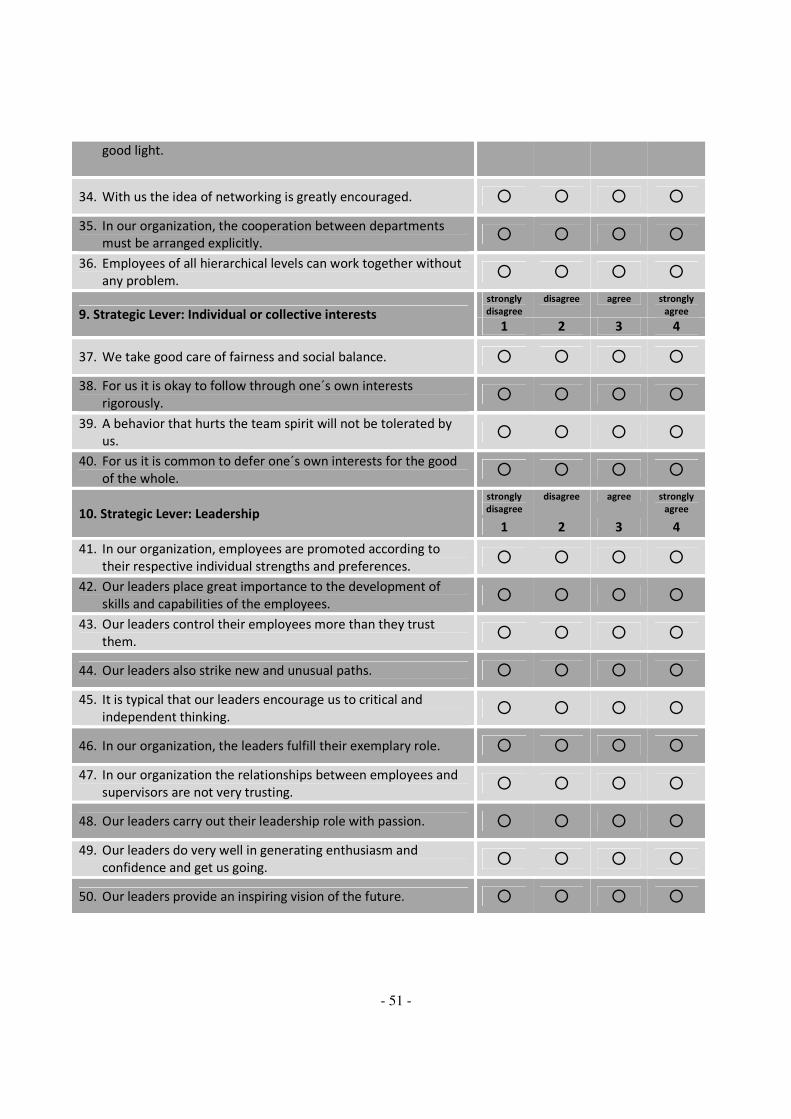
- 51 -
good light.
34. With us the idea of networking is greatly encouraged. � � � �
35. In our organization, the cooperation between departments
must be arranged explicitly. � � � �
36. Employees of all hierarchical levels can work together without
any problem. � � � �
9. Strategic Lever: Individual or collective interests
strongly
disagree
disagree agree strongly
agree
1 2 3 4
37. We take good care of fairness and social balance. � � � �
38. For us it is okay to follow through one´s own interests
rigorously. � � � �
39. A behavior that hurts the team spirit will not be tolerated by
us. � � � �
40. For us it is common to defer one´s own interests for the good
of the whole. � � � �
10. Strategic Lever: Leadership
strongly
disagree
disagree agree strongly
agree
1 2 3 4
41. In our organization, employees are promoted according to
their respective individual strengths and preferences. � � � �
42. Our leaders place great importance to the development of
skills and capabilities of the employees. � � � �
43. Our leaders control their employees more than they trust
them. � � � �
44. Our leaders also strike new and unusual paths. � � � �
45. It is typical that our leaders encourage us to critical and
independent thinking. � � � �
46. In our organization, the leaders fulfill their exemplary role. � � � �
47. In our organization the relationships between employees and
supervisors are not very trusting. � � � �
48. Our leaders carry out their leadership role with passion. � � � �
49. Our leaders do very well in generating enthusiasm and
confidence and get us going. � � � �
50. Our leaders provide an inspiring vision of the future. � � � �
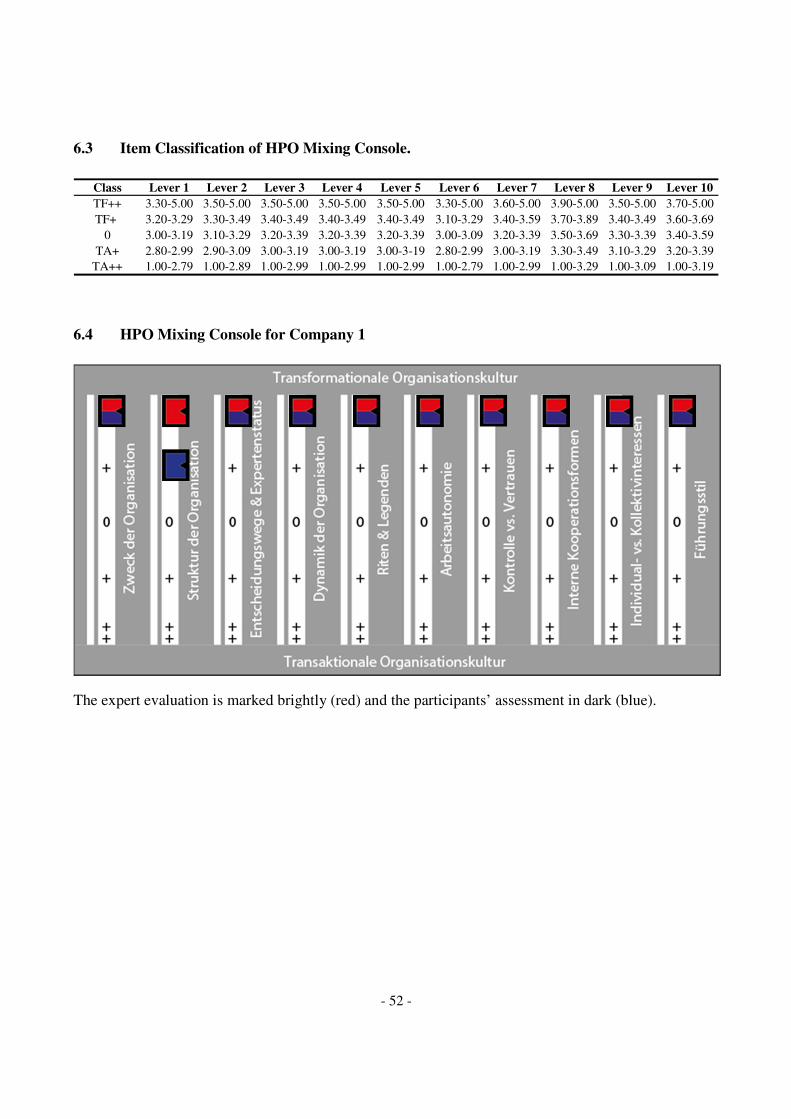
- 52 -
6.3 Item Classification of HPO Mixing Console.
6.4 HPO Mixing Console for Company 1
The expert evaluation is marked brightly (red) and the participants’ assessment in dark (blue).
Class Lever 1 Lever 2 Lever 3 Lever 4 Lever 5 Lever 6 Lever 7 Lever 8 Lever 9 Lever 10
TF++ 3.30-5.00 3.50-5.00 3.50-5.00 3.50-5.00 3.50-5.00 3.30-5.00 3.60-5.00 3.90-5.00 3.50-5.00 3.70-5.00
TF+ 3.20-3.29 3.30-3.49 3.40-3.49 3.40-3.49 3.40-3.49 3.10-3.29 3.40-3.59 3.70-3.89 3.40-3.49 3.60-3.69
0 3.00-3.19 3.10-3.29 3.20-3.39 3.20-3.39 3.20-3.39 3.00-3.09 3.20-3.39 3.50-3.69 3.30-3.39 3.40-3.59
TA+ 2.80-2.99 2.90-3.09 3.00-3.19 3.00-3.19 3.00-3-19 2.80-2.99 3.00-3.19 3.30-3.49 3.10-3.29 3.20-3.39
TA++ 1.00-2.79 1.00-2.89 1.00-2.99 1.00-2.99 1.00-2.99 1.00-2.79 1.00-2.99 1.00-3.29 1.00-3.09 1.00-3.19
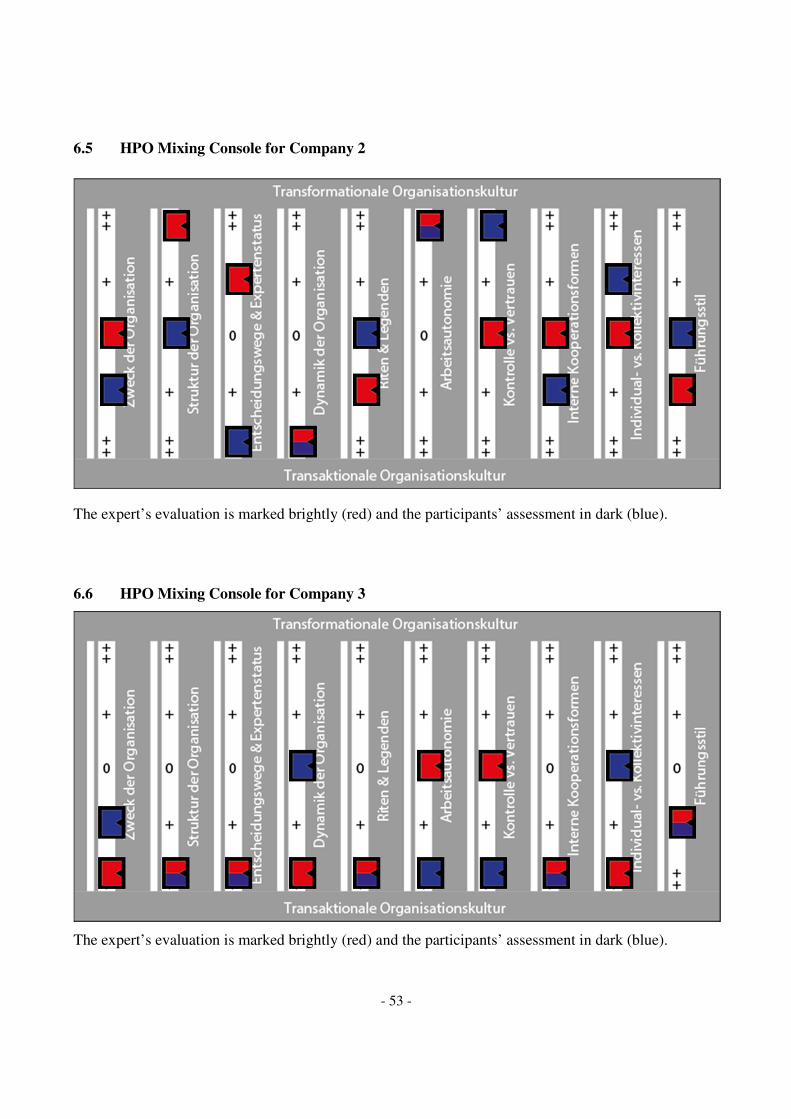
- 53 -
6.5 HPO Mixing Console for Company 2
The expert’s evaluation is marked brightly (red) and the participants’ assessment in dark (blue).
6.6 HPO Mixing Console for Company 3
The expert’s evaluation is marked brightly (red) and the participants’ assessment in dark (blue).
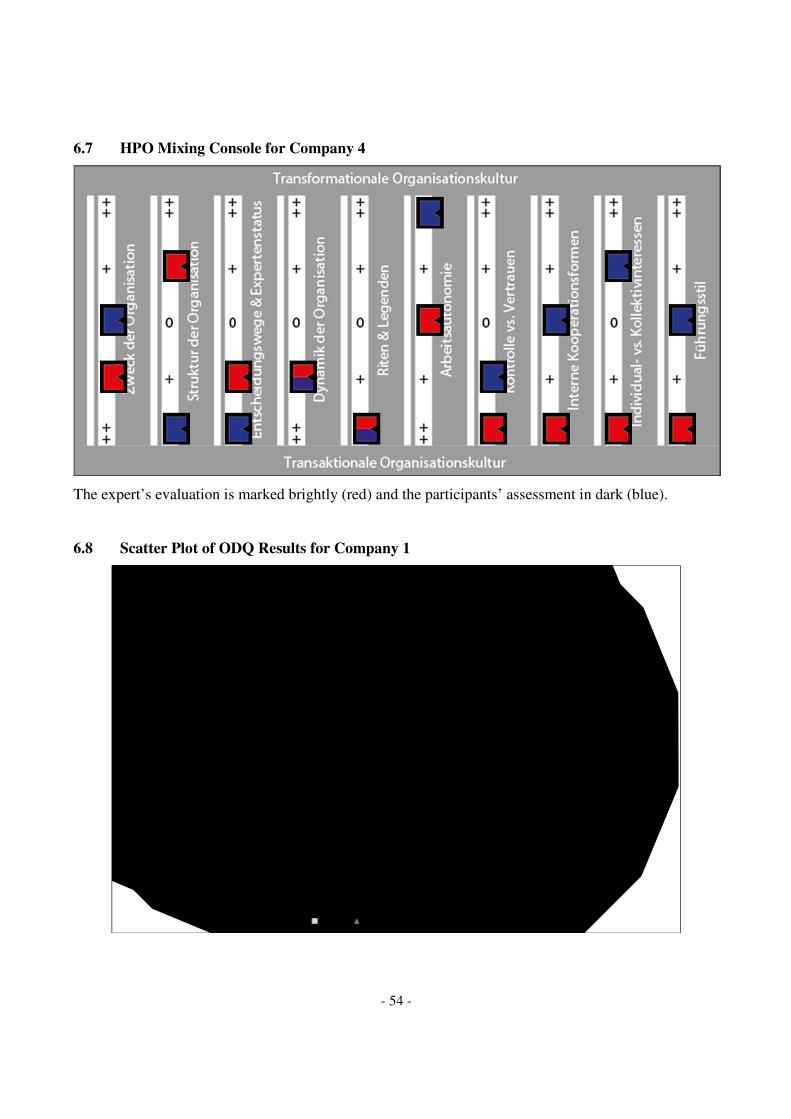
- 54 -
6.7 HPO Mixing Console for Company 4
The expert’s evaluation is marked brightly (red) and the participants’ assessment in dark (blue).
6.8 Scatter Plot of ODQ Results for Company 1
-14
-13
-12
-11
-10
-9
-8
-7
-6
-5
-4
-3
-2
-1
0
1
2
3
4
5
6
7
8
9
10
11
12
13
14
-14 -13 -12 -11 -10 -9 -8 -7 -6 -5 -4 -3 -2 -1 0 1 2 3 4 5 6 7 8 9 10 11 12 13 14
Tra
nsa
ctio
nal
Transformational
Expert Average Individual Answers
- 55 -
6.9 Scatter Plot of ODQ Results for Company 2
6.10 Scatter Plot of ODQ Results for Company 3
-14
-13
-12
-11
-10
-9
-8
-7
-6
-5
-4
-3
-2
-1
0
1
2
3
4
5
6
7
8
9
10
11
12
13
14
-14 -13 -12 -11 -10 -9 -8 -7 -6 -5 -4 -3 -2 -1 0 1 2 3 4 5 6 7 8 9 10 11 12 13 14
Tra
nsa
ctio
nal
Transformational
Expert Average Individual Answers
-14
-13
-12
-11
-10
-9
-8
-7
-6
-5
-4
-3
-2
-1
0
1
2
3
4
5
6
7
8
9
10
11
12
13
14
-14 -13 -12 -11 -10 -9 -8 -7 -6 -5 -4 -3 -2 -1 0 1 2 3 4 5 6 7 8 9 10 11 12 13 14
Tra
nsa
ctio
nal
Transformational
Expert Average Individual Answers
- 56 -
6.11 Scatter Plot of ODQ Results for Company 4
6.12 Scree Plot for Factor Analysis of Company 1
-14
-13
-12
-11
-10
-9
-8
-7
-6
-5
-4
-3
-2
-1
0
1
2
3
4
5
6
7
8
9
10
11
12
13
14
-14 -13 -12 -11 -10 -9 -8 -7 -6 -5 -4 -3 -2 -1 0 1 2 3 4 5 6 7 8 9 10 11 12 13 14
Tra
nsa
ctio
nal
Transformational
Expert Average Individual Answers
- 57 -
6.13 Scree Plot for Factor Analysis of Company 2
6.14 Scree Plot for Factor Analysis of Company 3
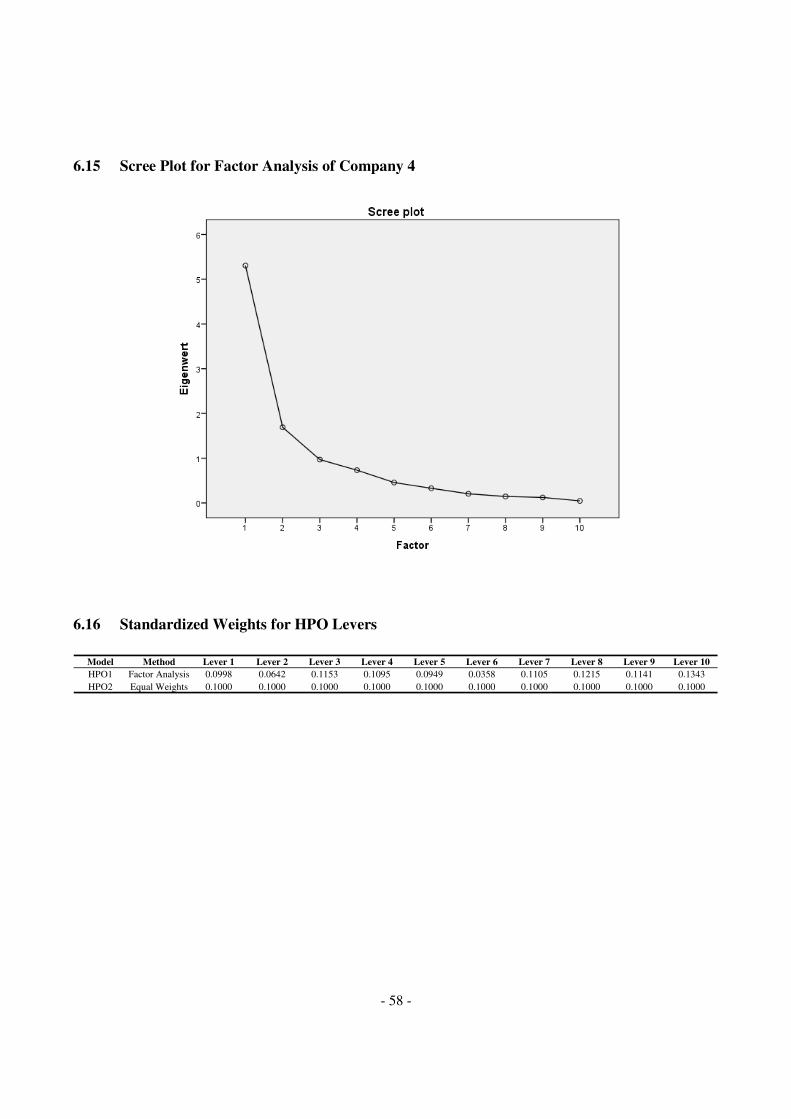
- 58 -
6.15 Scree Plot for Factor Analysis of Company 4
6.16 Standardized Weights for HPO Levers
Model Method Lever 1 Lever 2 Lever 3 Lever 4 Lever 5 Lever 6 Lever 7 Lever 8 Lever 9 Lever 10
HPO1 Factor Analysis 0.0998 0.0642 0.1153 0.1095 0.0949 0.0358 0.1105 0.1215 0.1141 0.1343
HPO2 Equal Weights 0.1000 0.1000 0.1000 0.1000 0.1000 0.1000 0.1000 0.1000 0.1000 0.1000
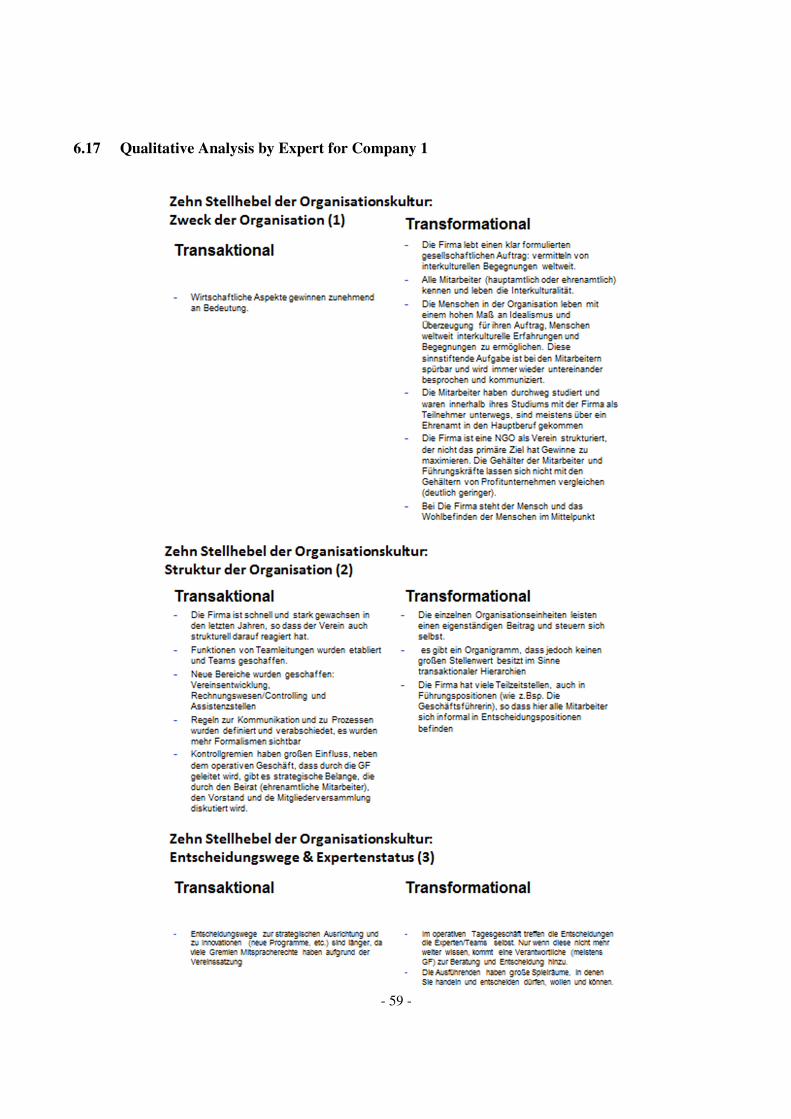
- 59 -
6.17 Qualitative Analysis by Expert for Company 1
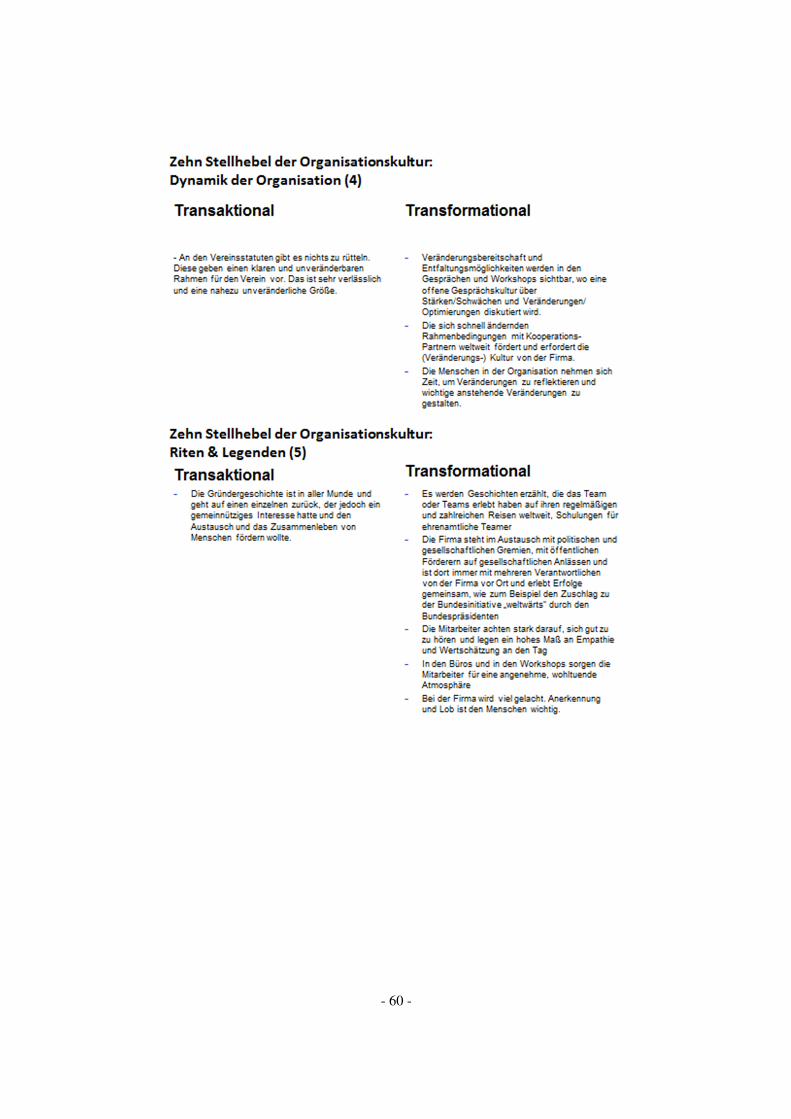
- 60 -
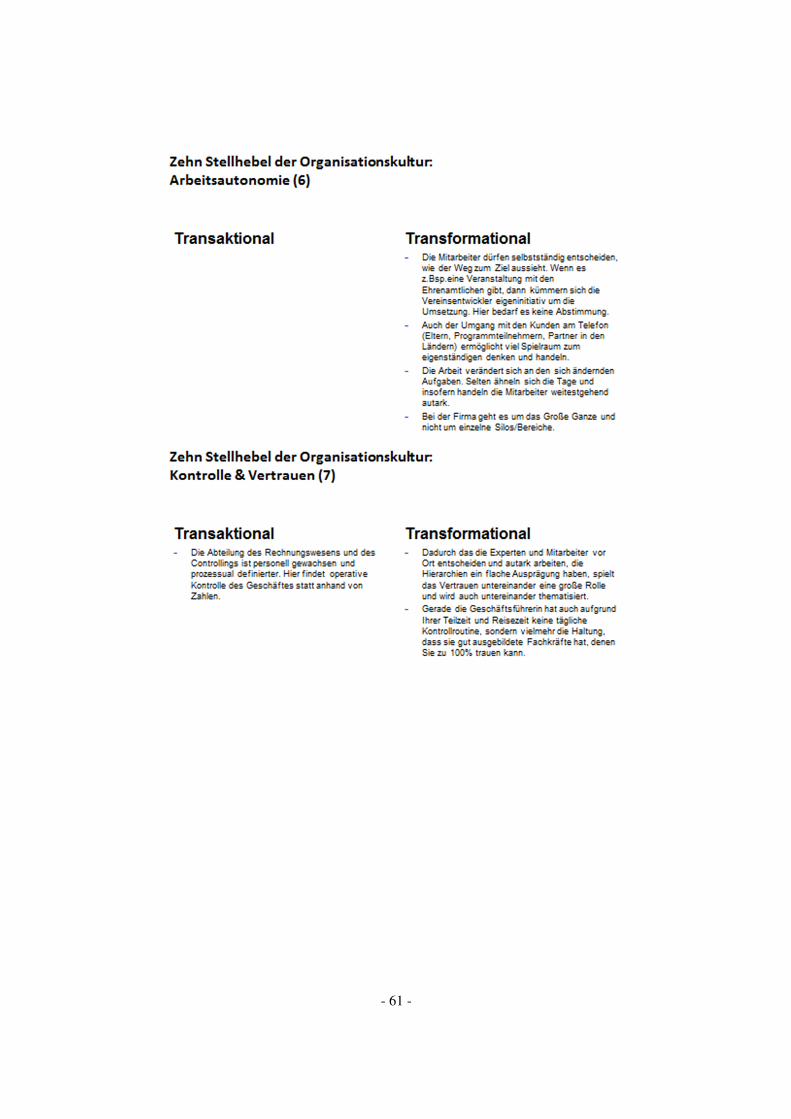
- 61 -
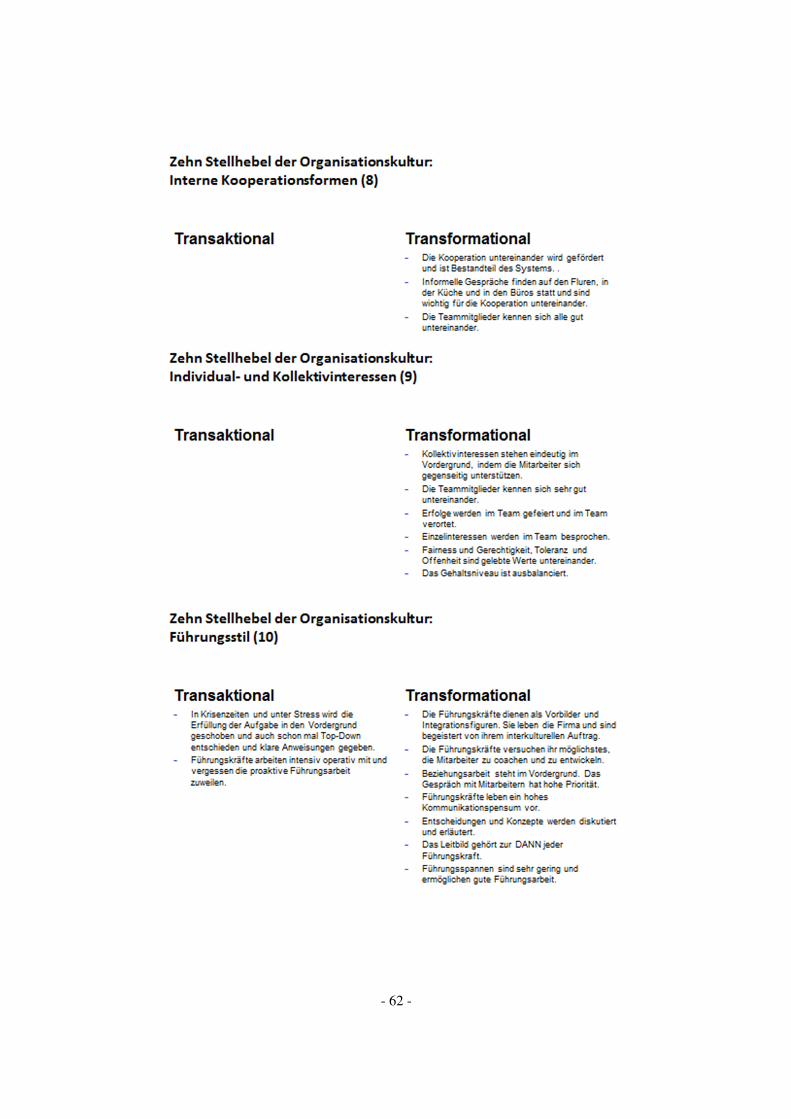
- 62 -
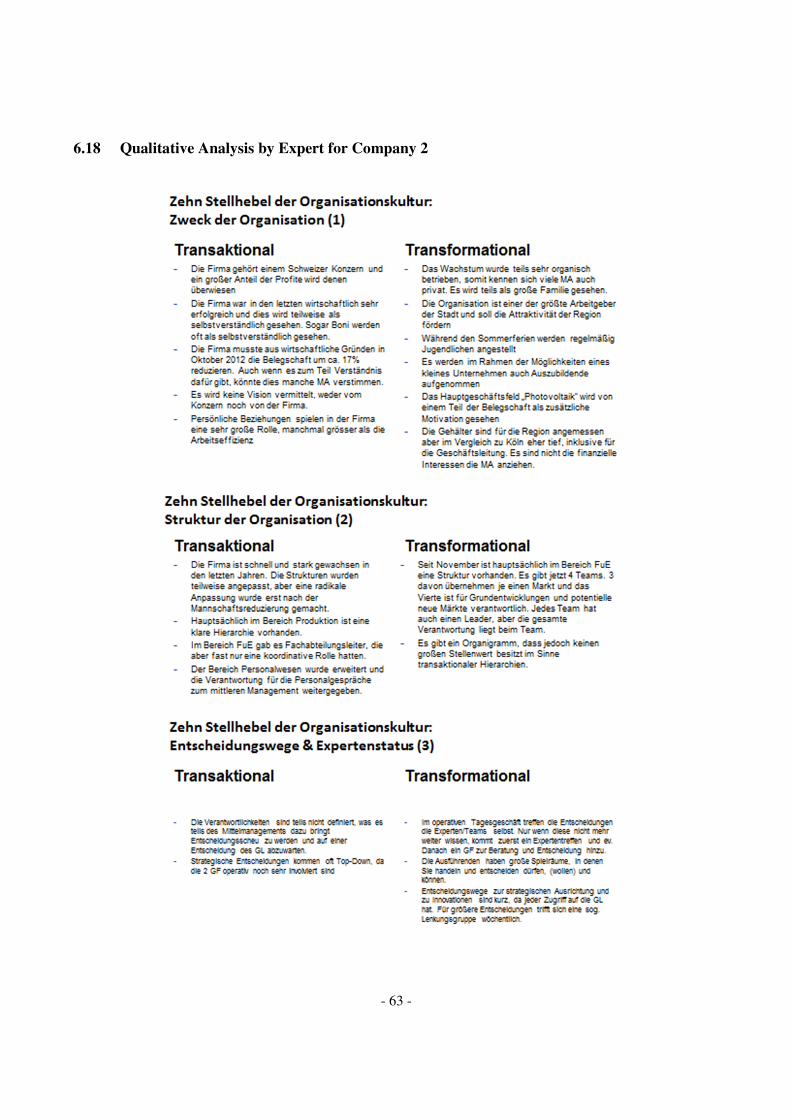
- 63 -
6.18 Qualitative Analysis by Expert for Company 2
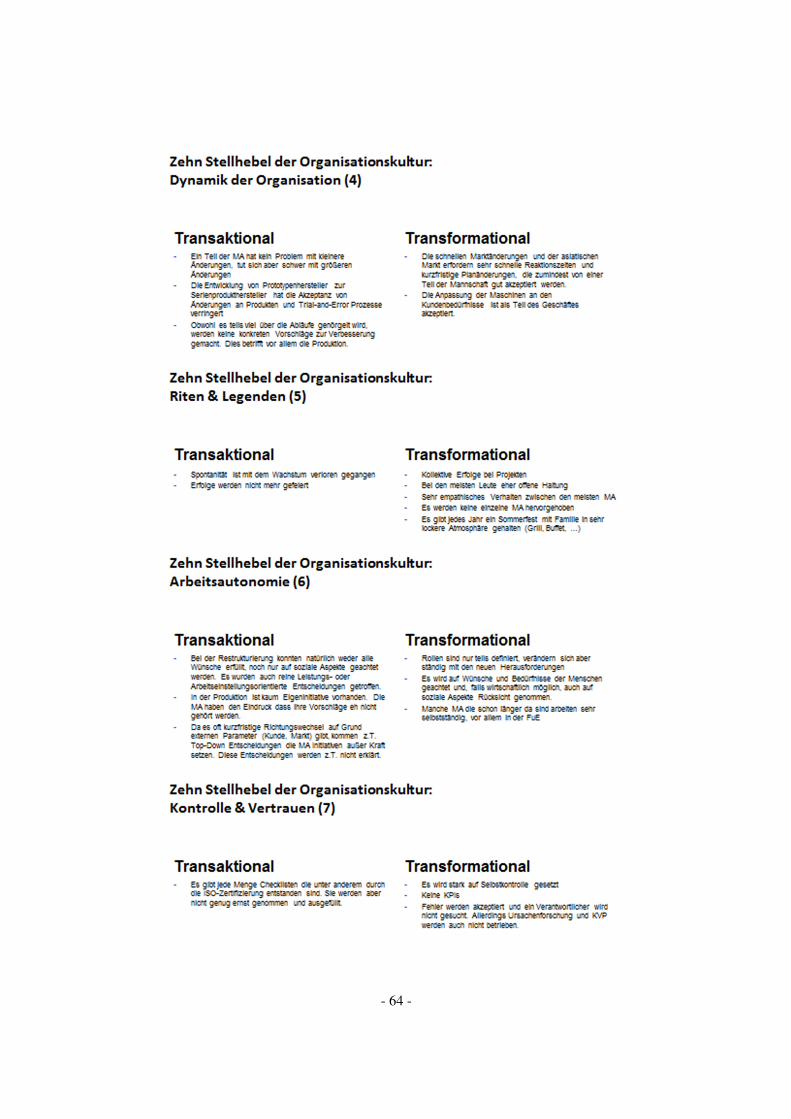
- 64 -
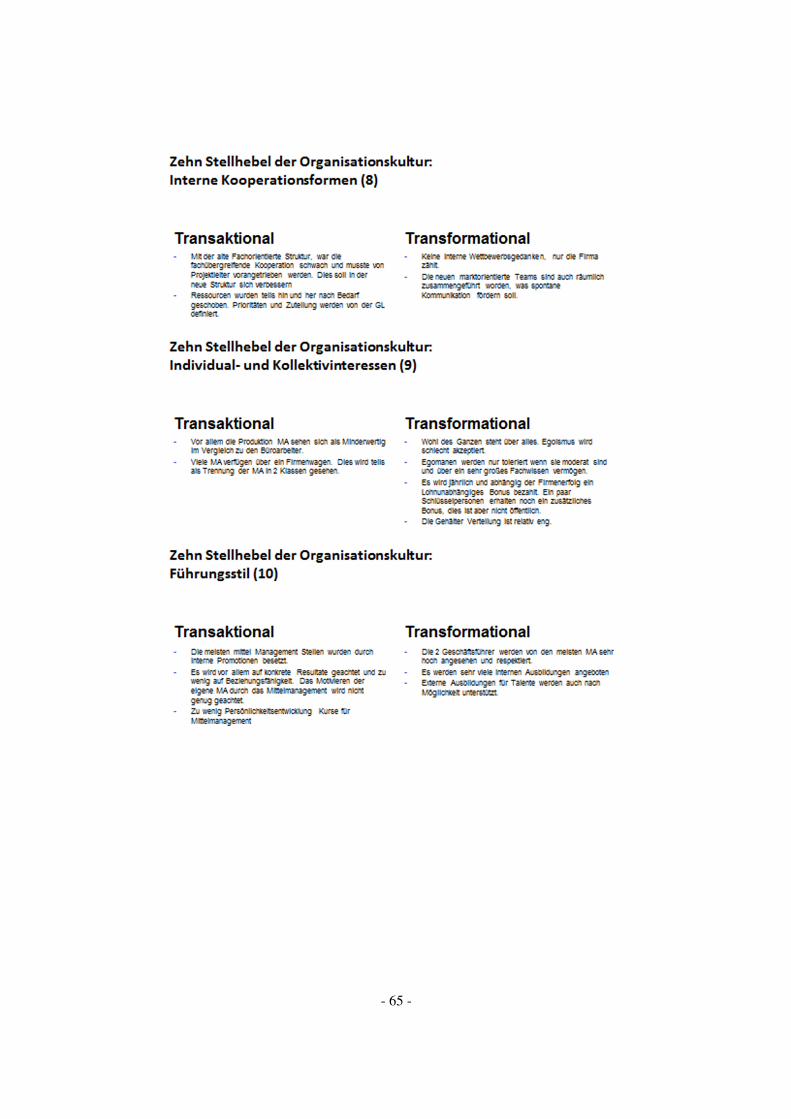
- 65 -
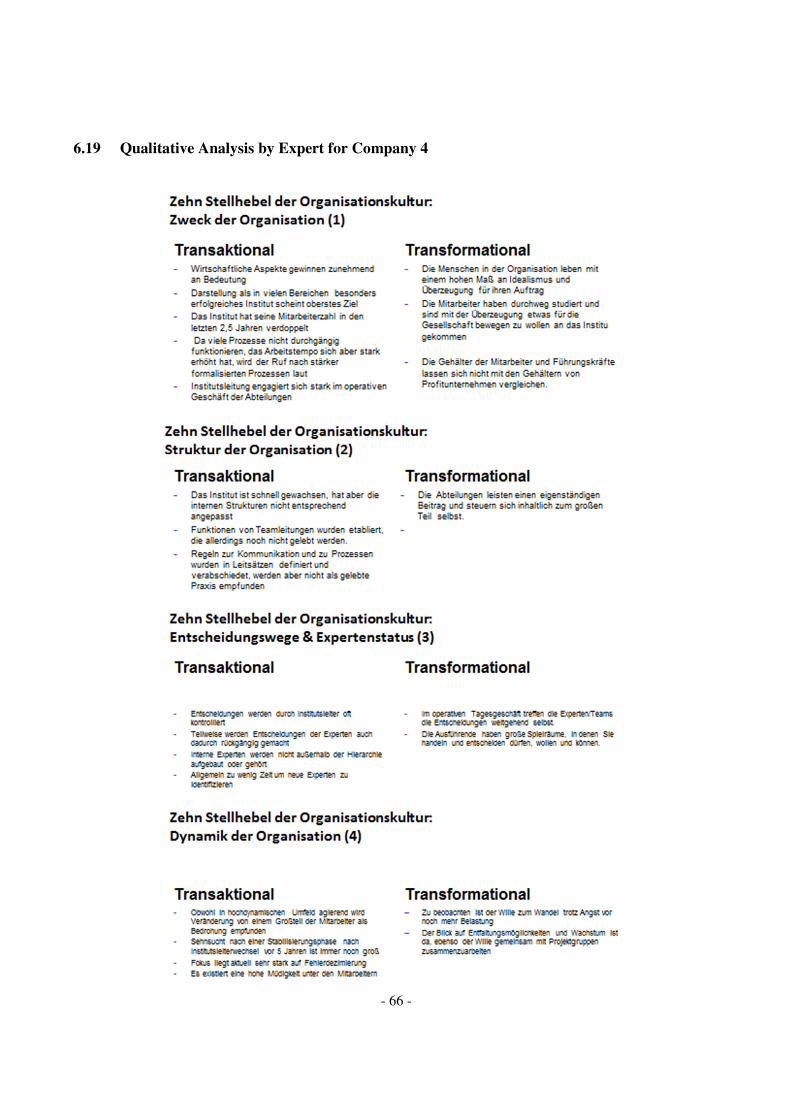
- 66 -
6.19 Qualitative Analysis by Expert for Company 4
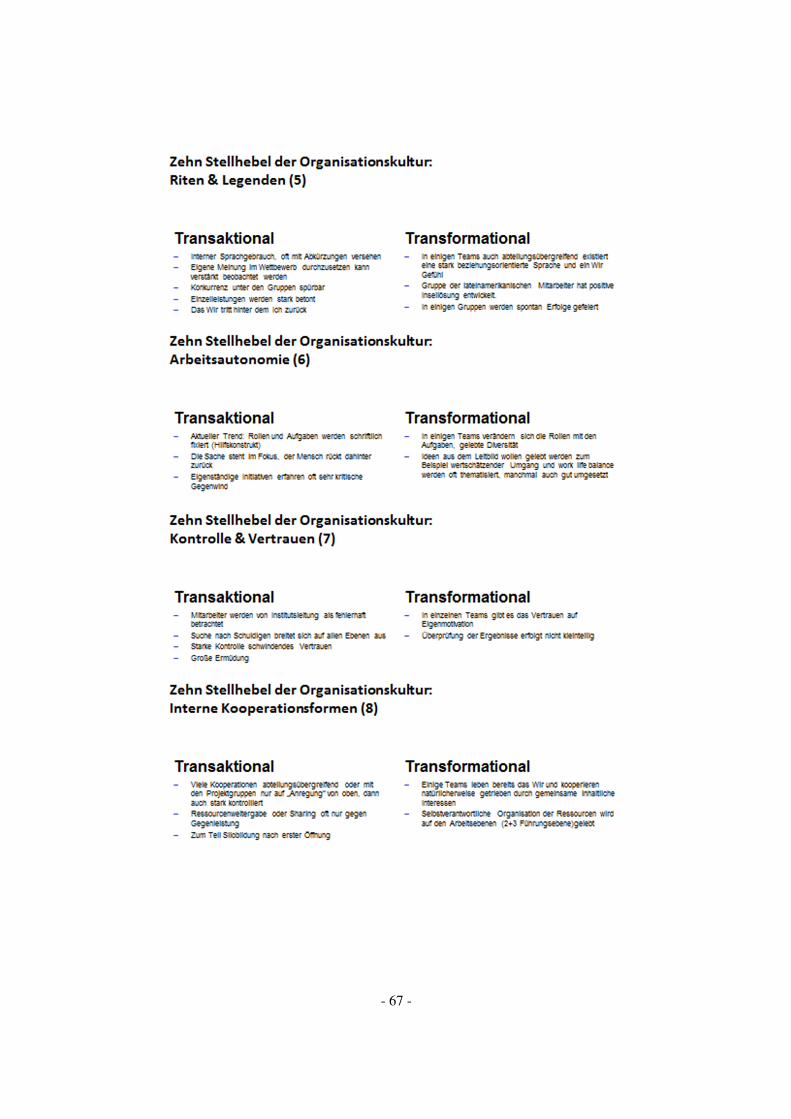
- 67 -
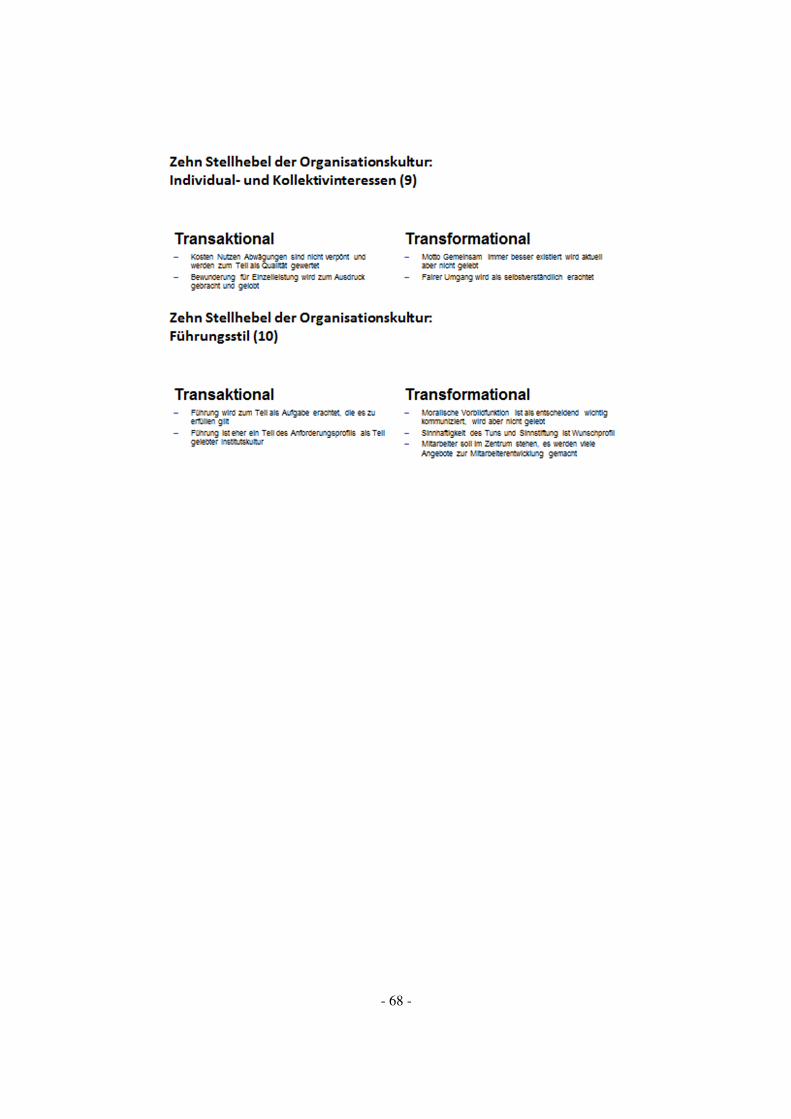
- 68 -
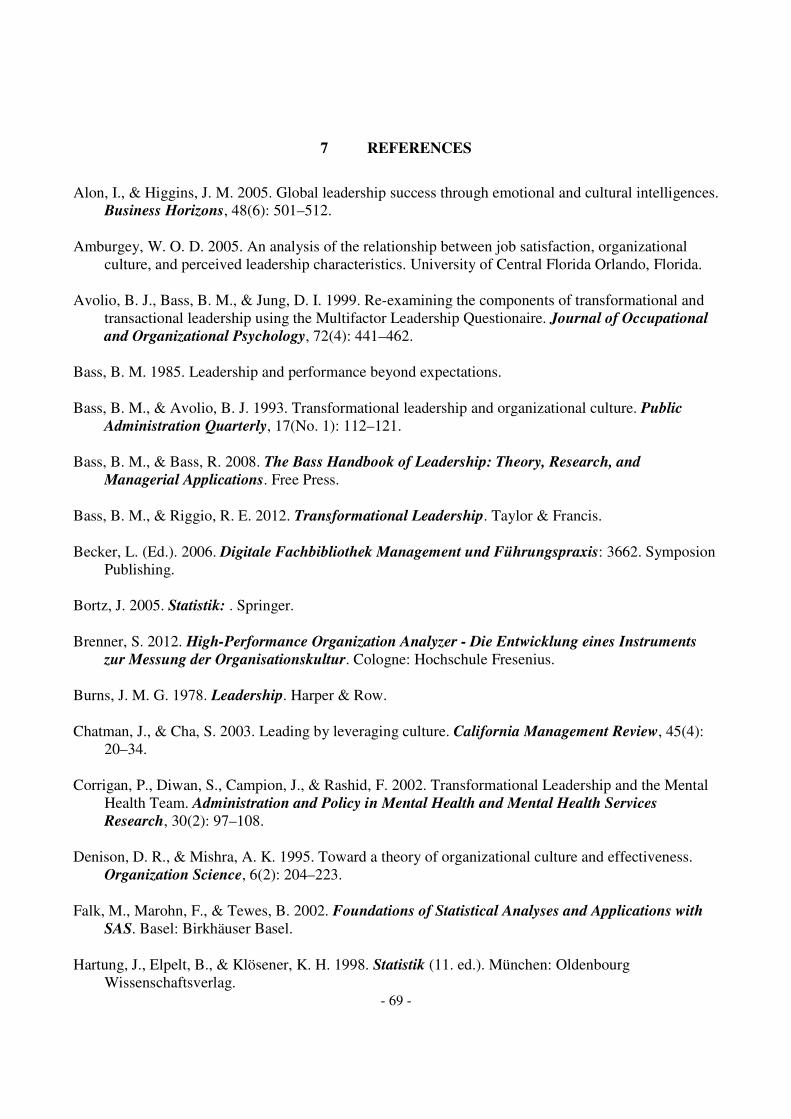
- 69 -
7 REFERENCES
Alon, I., & Higgins, J. M. 2005. Global leadership success through emotional and cultural intelligences.
Business Horizons, 48(6): 501–512.
Amburgey, W. O. D. 2005. An analysis of the relationship between job satisfaction, organizational
culture, and perceived leadership characteristics. University of Central Florida Orlando, Florida.
Avolio, B. J., Bass, B. M., & Jung, D. I. 1999. Re-examining the components of transformational and
transactional leadership using the Multifactor Leadership Questionaire. Journal of Occupational
and Organizational Psychology, 72(4): 441–462.
Bass, B. M. 1985. Leadership and performance beyond expectations.
Bass, B. M., & Avolio, B. J. 1993. Transformational leadership and organizational culture. Public
Administration Quarterly, 17(No. 1): 112–121.
Bass, B. M., & Bass, R. 2008. The Bass Handbook of Leadership: Theory, Research, and
Managerial Applications. Free Press.
Bass, B. M., & Riggio, R. E. 2012. Transformational Leadership. Taylor & Francis.
Becker, L. (Ed.). 2006. Digitale Fachbibliothek Management und Führungspraxis: 3662. Symposion
Publishing.
Bortz, J. 2005. Statistik: . Springer.
Brenner, S. 2012. High-Performance Organization Analyzer - Die Entwicklung eines Instruments
zur Messung der Organisationskultur. Cologne: Hochschule Fresenius.
Burns, J. M. G. 1978. Leadership. Harper & Row.
Chatman, J., & Cha, S. 2003. Leading by leveraging culture. California Management Review, 45(4):
20–34.
Corrigan, P., Diwan, S., Campion, J., & Rashid, F. 2002. Transformational Leadership and the Mental
Health Team. Administration and Policy in Mental Health and Mental Health Services
Research, 30(2): 97–108.
Denison, D. R., & Mishra, A. K. 1995. Toward a theory of organizational culture and effectiveness.
Organization Science, 6(2): 204–223.
Falk, M., Marohn, F., & Tewes, B. 2002. Foundations of Statistical Analyses and Applications with
SAS. Basel: Birkhäuser Basel.
Hartung, J., Elpelt, B., & Klösener, K. H. 1998. Statistik (11. ed.). München: Oldenbourg
Wissenschaftsverlag.
- 70 -
Heidbrink, M., & Jenewein, W. 2011. High-Performance-Organisationen: Wie Unternehmen eine
Hochleistungskultur aufbauen. Schäffer-Poeschel Verlag.
Heskett, J. L., Jones, T. O., Loveman, G. W., Sasser, W. E., & Schlesinger, L. A. 2008. Putting the
service-profit chain to work. Harvard Business Review.
Hofstede, G., Neuijen, B., Ohayv, D. D., & Sanders, G. 1990. Measuring organizational cultures: A
qualitative and quantitative study across twenty cases. Administrative Science Quarterly, 35(2):
286.
Jenewein, W., & Heidbrink, M. 2008. High-Performance-Teams: Die fünf Erfolgsprinzipien für
Führung und Zusammenarbeit. Schäffer-Poeschel Verlag.
Judge, T. A., & Piccolo, Ronald F. 2004. Transformational and transactional leadership: a meta-
analytic test of their relative validity. The Journal of Applied Psychology, 89(5): 755–68.
Kerr, S., & Landauer, S. 2004. Using stretch goals to promote organizational effectiveness and personal
growth: General Electric and Goldman Sachs. The Academy of Management Executive, 18(4):
134–138.
Kotter, J. P., & Heskett, J. L. 1992. Corporate culture and performance. New York: Free Press.
Maccoby, M. 2000. Narcissistic leaders: The incredible pros, the inevitable cons. Harvard Business
Review, 78(1): 68–78.
McCarthy, D. J., Puffer, S. M., May, R. C., Ledgerwood, D. E., & Steward, W. H. 2008. Overcoming
Resistance to Change in Russian Organizations: Organizational Dynamics, 37(3): 221–235.
Nerdinger, F. W. (Ed.). 2007. Ansätze zur Messung von Unternehmenskultur: Möglichkeiten,
Einordnung und Konsequenzen für ein neues Instrument. Univ., Lehrstuhl für Wirtschafts- und
Organisationspsychologie.
Nink, M. 2012. Engagement Index Deutschland 2011. Berlin.
O’Reilly III, C. A., Chatman, J., & Caldwell, D. F. 1991. People and Organizational Culture: A Profile
Comparison Approach to Assessing Person-Organization Fit. Academy of Management Journal,
34(3): 487–516.
Parry, K. W., & Proctor-Thomson, S. B. 2001. Testing the Validity and Reliability of the
Organizational Description Questionnaire (ODQ). International Journal of Organizational
Behaviour, 4(3): 111–124.
Piccolo, R F, & Colquitt, J. A. 2006. Transformational leadership and job behaviors: The mediating
role of core job characteristics. Academy of Management Journal, 49(2): 327–340.
Pietersen, W. 2010. Strategy as learning. The European Business Review, July - Aug: 24–27.
- 71 -
Puempin, C., & Seminar, H. S. G. W. 1982. Management strategischer Erfolgspositionen:
Lösungskonzepte für eine wirkungsvolle Unternehmungsführung : Seminar vom 22. und 23. Juni 1982. HSG-Weiterbildungsstufe.
Rasch, G. 1961. On general laws and the meaning of measurement in psychology. Proceedings of the
fourth Berkeley symposium on mathematical statistics and probability: 321–333. University of
California Press Berkeley, CA.
Sachs, L., & Hedderich, J. 2009. Angewandte Statistik: Methodensammlung Mit R. Springer.
Sackmann, S. 2002. Unternehmenskultur.: Erkennen - Entwickeln - Verändern. Luchterhand Verlag
GmbH.
Sackmann, S. 2006. Assessment, evaluation, improvement: success through corporate culture (2nd
ed.). Guetersloh: Bertelsmann Stiftung.
Schein, E. H. 1990. Organizational culture. American Psychologist, 45(2): 109–119.
Schein, E. H. 2009. The corporate culture survival guide. San Francisco: Wiley.
Simon, F. B. 2009. Einführung in die systemische Organisationstheorie (2nd ed.). Heidelberg: Auer-
System-Verlag Carl.
Toor, S.-R., & Ofori, G. 2009. Ethical Leadership: Examining the Relationships with Full Range
Leadership Model, Employee Outcomes, and Organizational Culture. Journal of Business Ethics,
90(4): 533–547.
Wunderer, R. 2006. Führung und Zusammenarbeit. Luchterhand.
Yukl, G. 1999. An evaluation of conceptual weaknesses in transformational and charismatic leadership
theories. The Leadership Quarterly, 10(2): 285–305.
- 72 -
8 DECLARATION OF AUTHORSHIP