Embed Size (px)
Citation preview
Master Thesis
ANALYSIS AND EVALUATION TOOLS DEVELOPMENT OF
PHOTOVOLTAIC MODULES AND SYSTEM PERFORMANCE
UNDER JORDANIAN AND GERMAN CLIMATIC CONDITIONS
By
Laith Sa’d Basha
Submitted to
Faculty of Engineering at Cairo University
and
Faculty of Electrical Engineering and Computer Science at University of Kassel
in partial fulfillment of the requirements for M.Sc. degree in Renewable Energy and
Energy Efficiency for the MENA region
Faculty of Engineering
Giza, Egypt Kassel, Germany
Cairo University Kassel University
March, 2012
Master Thesis
ANALYSIS AND EVALUATION TOOLS DEVELOPMENT OF
PHOTOVOLTAIC MODULES AND SYSTEM PERFORMANCE
UNDER JORDANIAN AND GERMAN CLIMATIC CONDITIONS
By Laith Sa’d Basha
Submitted to
Faculty of Engineering at Cairo University
and
Faculty of Electrical Engineering and Computer Science at University of Kassel
in partial fulfillment of the requirements for M.Sc. degree in Renewable Energy and
Energy Efficiency for the MENA region
March, 2012
__________________________________________________________________________________
[Reviewers] [Supervisors]
Prof. Dr. –Ing. habil. Josef Börcsök
Member
Faculty of Electrical Engineering and Computer Science
University of Kassel
Dr. –Ing. Norbert Henze
Head of group Engineering and Measurement Technology
Department of Systems Engineering and Grid Integration
Fraunhofer- IWES, Kassel
Prof. Ahmad El Koussi
Member
Faculty of electrical power and machines
Cairo University
Dipl.-Ing. Siwanand Misara
Member
Group of Engineering and Measuring Technology
Fraunhofer- IWES, Kassel
March, 2012
Master Thesis
ANALYSIS AND EVALUATION TOOLS DEVELOPMENT OF
PHOTOVOLTAIC MODULES AND SYSTEM PERFORMANCE
UNDER JORDANIAN AND GERMAN CLIMATIC CONDITIONS
By
Laith Sa’d Basha
Submitted to
Faculty of Engineering at Cairo University
and
Faculty of Electrical Engineering and Computer Science at University of Kassel
in partial fulfillment of the requirements for M.Sc. degree in Renewable Energy and
Energy Efficiency for the MENA Region
March, 2012
Approved by the Examining Committee
Prof. Dr. –Ing. habil. Josef Börcsök Member Faculty of Electrical Engineering and Computer Science
University of Kassel
Prof. Ahmad El Koussi Member Electrical power and machines department, Faculty of Engineering
Cairo University Prof. Adil Khalil Member Mechanical Power Department,Faculty of Engineering
Cairo University
Faculty of Engineering
Giza, Egypt Kassel, Germany
Cairo University Kassel University March, 2012

I
Table of Contents
Table of Contents ..................................................................................................................................... I
List of Figures ........................................................................................................................................ III
List of Tables .......................................................................................................................................... V
List of Symbols ...................................................................................................................................... VI
List of Greek letters .............................................................................................................................. VIII
List of Abbreviations .............................................................................................................................. IX
Acknowledgment .................................................................................................................................... 1
Abstract ................................................................................................................................................... 2
1. Introduction ........................................................................................................................................ 4
2. Photovoltaic Overview........................................................................................................................ 8
2.1 Photovoltaic characteristics ............................................................................................................ 8
2.2 Photovoltaic module technologies ................................................................................................ 11
2.2.1 Crystalline technology .......................................................................................................... 12
2.2.2 Thin film Technology ........................................................................................................... 13
2.3 Performance factors ..................................................................................................................... 17
2.4 Photovoltaic Economics and market ............................................................................................. 22
2.4.1 Photovoltaic economics ........................................................................................................ 22
2.4.2 Photovoltaic Market ............................................................................................................. 23
2.4.3 Market forecasts until 2015 .................................................................................................. 24
3 Approach .......................................................................................................................................... 27
3.1 Technique .................................................................................................................................... 27
3.2 Site specifications ........................................................................................................................ 29
3.2.1 Kassel .................................................................................................................................. 29
3.2.2 Ma’an .................................................................................................................................. 30
3.3 Photovoltaic under study .............................................................................................................. 30
4 Methodology .................................................................................................................................... 34
4.1 Module level model ..................................................................................................................... 34
4.1.1 Input power .......................................................................................................................... 34
4.1.2 Optical loss .......................................................................................................................... 42
II
4.1.3 Thermal power .................................................................................................................... 46
4.1.4 Electrical DC output power .................................................................................................. 59
4.2 Balance of System (BOS) model .................................................................................................. 61
4.2.1 Inverter ................................................................................................................................ 61
4.3 Simulation model ......................................................................................................................... 64
4.4 Boundary conditions .................................................................................................................... 65
5 Results and Discussion ..................................................................................................................... 68
5.1 Simulation results and evaluation in Kassel .................................................................................. 68
5.1.1 Solar Irradiation evaluation .................................................................................................. 68
5.1.2 Module temperature ............................................................................................................. 71
5.1.3 Output power ....................................................................................................................... 73
5.1.4 Energy yield ......................................................................................................................... 80
5.2 Simulation results in Ma’an .......................................................................................................... 92
6 Conclusion and recommendation ...................................................................................................... 99
Outlook ............................................................................................................................................... 101
Appendices.......................................................................................................................................... 106
Appendix A: Photovoltaic Environmental Impact Assessment (EIA) ................................................... 107
Appendix B: Glass guide, SAINT- GOBIAN, Edition2000 .................................................................. 112
Appendix C: Sunny boy, SMA Solar Technology AG .......................................................................... 113
Appendix D: Simulation model ........................................................................................................... 115
Appendix E: Ma’an module and system levels monthly energy yields at different tilt angle. ................. 116
Arabic summary .................................................................................................................................. 118
III
List of Figures Figure 2.1: Photovoltaic systems applications
[8] ....................................................................................... 8
Figure 2.2: Effects of the incident irradiation on module voltage and current [9] ........................................ 9
Figure 2.3: Effect of ambient temperature on module voltage and current [9]
. ........................................... 9
Figure 2.4: Maximum power point [10] .................................................................................................... 10
Figure 2.5: Fill Factor [10] ...................................................................................................................... 10
Figure 2.6: PV module layers [11] ............................................................................................................ 11
Figure 2.7: monocrystalline PV module and cell layered structure [13] ..................................................... 12
Figure 2.8: Polycrystalline cell and module [8] ........................................................................................ 13
Figure 2.9: Comparison of cell thickness, material consumption and energy expenditure for thin-film cells
(left) and crystalline silicon cells (right) [8] ............................................................................................. 14
Figure 2.10: Flexible amorphous modules and layered structure of an amorphous cell [8] ........................ 15
Figure 2.11: CIS modules based on copper indium disulphide and layered structure of a CIS cell [8] ....... 15
Figure 2.12: CdTe module and layered structure of a CdTe cell Source [8] ............................................... 16
Figure 2.13: Micromorphous layered structured and its spectrum response [14]........................................ 16
Figure 2.14: Spectral sensitivity of different solar cell types [15] .............................................................. 17
Figure 2.15: PV module conversion losses ............................................................................................. 21
Figure 2.16:: Module Pricing, driven by efficiency [23] ........................................................................... 22
Figure 2.17: Global cumulative installed capacity [24] ............................................................................. 23
Figure 2.18: expected annual PV market growth [24] ............................................................................... 24
Figure 2.19: Evolution of global cumulative installed capacity 2010-2015 [24] ......................................... 25
Figure 3.1: yearly global horizontal radiation in Kassel [27] ..................................................................... 29
Figure 3.2: Distribution of daily average solar radiation in Jordan [1] ...................................................... 30
Figure 3.3: PV test field infrastructure in IWES (left: Polycrystalline. center and right: Micromorphous) [1] ... 31
Figure 3.4: PV test field infrastructure in Ma’an [3] ................................................................................. 32
Figure 4.1: Angles to define the position of the sun and the orientation of a tilted plane [13]
. .................... 35
Figure 4.2: Variation of angle of incidence (θAOI) and zenith angles (θZ) for 30°South orientations and
horizontal surface for Ma’an and Kassel cities. ...................................................................................... 36
Figure 4.3: Solar spectrum distribution [32]
. ............................................................................................. 37
Figure 4.4: Various Airmass [33] ............................................................................................................. 38
Figure 4.5: Incident solar irradiation [34] ................................................................................................. 39
Figure 4.6: Pyranometer, Rotating Shadowband Radiometer Instrumentation and silicon cell sensors .... 41
Figure 4.7: Wind measurement system and ambient temperature measurements ..................................... 42
Figure 4.8: PV modules front side sheet layers [41] .................................................................................. 43
Figure 4.9: reflection and transmission in the media ............................................................................... 45
Figure 4.10: Relation between the transmittance and angle of incidence [41] ............................................ 46
Figure 4.11: Thermal heat process inside the PV module [44] ................................................................... 47
Figure 4.12: Energy flow in the PV module [17] ...................................................................................... 48
Figure 4.13: Heat loss from PV module [11]............................................................................................. 49
Figure 4.14: Photovoltaics heat dissipation [44] ........................................................................................ 50
Figure 4.15: Total heat transfer resistance [45] ......................................................................................... 51
IV
Figure 4.16: Convection heat transfer flow chart [46] ............................................................................... 51
Figure 4.17: Real time power balance for PV module [45] ........................................................................ 64
Figure 4.18: Simulation model block diagram ........................................................................................ 64
Figure 5.1: Solar irradiation measurement in Kassel by ISET and pyranometer sensors at 30o south
orientation ............................................................................................................................................. 69
Figure 5.2: Monthly solar irradiation measurement in Kassel by ISET sensor and pyranometer at 30o
south orientation (pyranometer with and without optical loss) ................................................................ 69
Figure 5.3: Monthly solar irradiation measurement in Kassel by silicon sensor and Pyranometer sensor at
30o south orientation (pyranometer converted from 0
o to 30
o, and at 30
o orientation) .............................. 70
Figure 5.4: Two days module temperature measurement by using ISET sensor irradiation measurement 72
Figure 5.5: ISET irradiation measurement and DC output power for four different days ......................... 75
Figure 5.6: Pyranometer irradiation measurement and DC output power for four different days ............. 76
Figure 5.7 : ISET irradiation measurement and AC output power for four different days ........................ 79
Figure 5.8 a: Monthly DC energy yield of poly-cr module, 162Wp without back isolation ..................... 84
Figure 5.8 b: Monthly DC energy yield of poly-cr module, 162Wp with back isolation .......................... 84
Figure 5.9 a: Monthly DC energy yield of μ-Si module, 85Wp without back isolation ............................ 85
Figure 5.9 b: Monthly DC energy yield of μ-Si module, 85Wp with back isolation ................................ 85
Figure 5.10: Monthly AC energy yield of poly-cr system, 1134Wp with and without back isolation cover... 89
Figure 5.11: Monthly AC energy yield of μ-Si system, 1020Wp with and without back cover isolation .. 90
Figure 5.12: Global horizontal irradiation in Ma’an ............................................................................... 92
Figure 5.13: DC energy yield at different tilt angles for 230Wp polycrystalline ‘A’ ............................... 94
Figure 5.14: AC energy yield at different tilt angles for 230Wp polycrystalline ‘A’ ............................... 94
Figure 5.15: DC and AC specific energy yield for the module and system level ..................................... 97
V
List of Tables Table 2.1: Summary of some studies on PV module field degradation around the world
[18] .................... 20
Table 3.1: Specification of PV module under test ................................................................................... 32
Table 4.1: Refractive indices and thickness for PV modules layers [41] .................................................... 43
Table 4.2: Equivalent refractive indices for different PV module layer [43] .............................................. 44
Table 4.3: Air physical specification [46] ................................................................................................. 57
Table 4.4: Physical specification of PV materials ................................................................................... 59
Table 4.5: PV module efficiency regarding different irradiance and temperature table [48] ....................... 60
Table 4.6: Inverter efficiency with respect to the inverter loading “sunnyboy 1200W” [Appendix C] ..... 62
Table 4.7: Relation between ambient temperature and inverter derating [Appendix C] ........................... 63
Table 5.1: Solar irradiation Deviation .................................................................................................... 71
Table 5.2: Modules temperature deviation by using ISET sensor and pyranometer as a solar irradiation
measurements ........................................................................................................................................ 72
Table 5.3: maximum instantaneous output DC power of the module level .............................................. 73
Table 5.4: DC output power deviation based on 15 seconds time resolution ........................................... 77
Table 5.5: maximum instantaneous output AC power of the system level ............................................... 78
Table 5.6: AC output power deviation for 15 seconds time resolution .................................................... 80
Table 5.7: DC energy yield of the module level ..................................................................................... 81
Table 5.8: Specific DC energy yield ...................................................................................................... 82
Table 5.9: Accumulated DC power evaluation among the year ............................................................... 83
Table 5.10: MBE and RMSE for hourly, daily and monthly DC energy yield ......................................... 86
Table 5.11: AC energy yield of the system level .................................................................................... 87
Table 5.12: Specific AC energy yield .................................................................................................... 88
Table 5.13: Difference between Specific AC energy and Specific DC energy. ........................................ 88
Table 5.14: Accumulated AC power evaluation ..................................................................................... 89
Table 5.15: MBE for hourly, daily and monthly AC energy yield ........................................................... 91
Table 5.16: DC and AC energy yield for the module and system level ................................................... 93
Table 5.17: Monthly DC energy yield at different tilt angles for 230Wp polycrystalline ‘A’ ................... 95
Table 5.18: Monthly AC energy yield at different tilt angles for 230Wp polycrystalline ‘A’ ................... 95
Table 5.19: DC and AC specific energy yield for the module and system level...................................... 96
VI
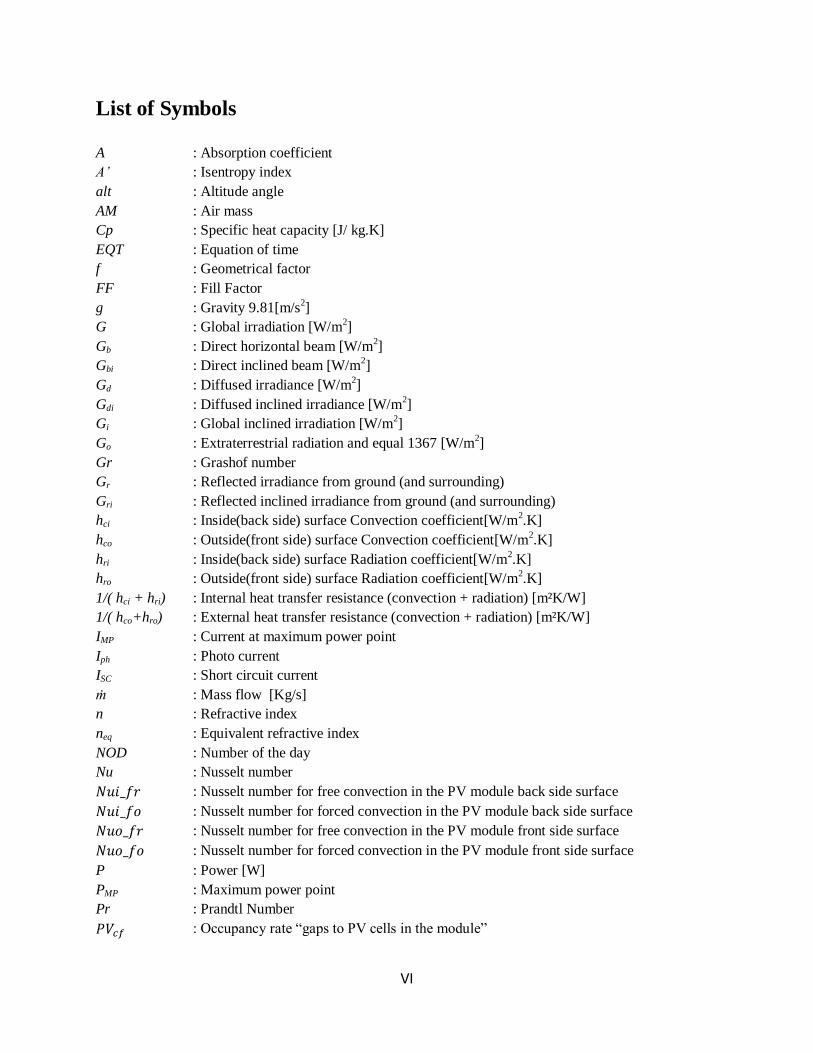
List of Symbols
A : Absorption coefficient
A’ : Isentropy index
alt : Altitude angle
AM : Air mass
Cp : Specific heat capacity [J/ kg.K]
EQT : Equation of time
f : Geometrical factor
FF : Fill Factor
g : Gravity 9.81[m/s2]
G : Global irradiation [W/m2]
Gb : Direct horizontal beam [W/m2]
Gbi : Direct inclined beam [W/m2]
Gd : Diffused irradiance [W/m2]
Gdi : Diffused inclined irradiance [W/m2]
Gi : Global inclined irradiation [W/m2]
Go : Extraterrestrial radiation and equal 1367 [W/m2]
Gr : Grashof number
Gr : Reflected irradiance from ground (and surrounding)
Gri : Reflected inclined irradiance from ground (and surrounding)
hci : Inside(back side) surface Convection coefficient[W/m2.K]
hco : Outside(front side) surface Convection coefficient[W/m2.K]
hri : Inside(back side) surface Radiation coefficient[W/m2.K]
hro : Outside(front side) surface Radiation coefficient[W/m2.K]
1/( hci + hri) : Internal heat transfer resistance (convection + radiation) [m²K/W]
1/( hco+hro) : External heat transfer resistance (convection + radiation) [m²K/W]
IMP : Current at maximum power point
Iph : Photo current
ISC : Short circuit current
ṁ : Mass flow [Kg/s]
n : Refractive index
neq : Equivalent refractive index
NOD : Number of the day
Nu : Nusselt number
: Nusselt number for free convection in the PV module back side surface
: Nusselt number for forced convection in the PV module back side surface
: Nusselt number for free convection in the PV module front side surface
: Nusselt number for forced convection in the PV module front side surface
P : Power [W]
PMP : Maximum power point
Pr : Prandtl Number
: Occupancy rate “gaps to PV cells in the module”
VII
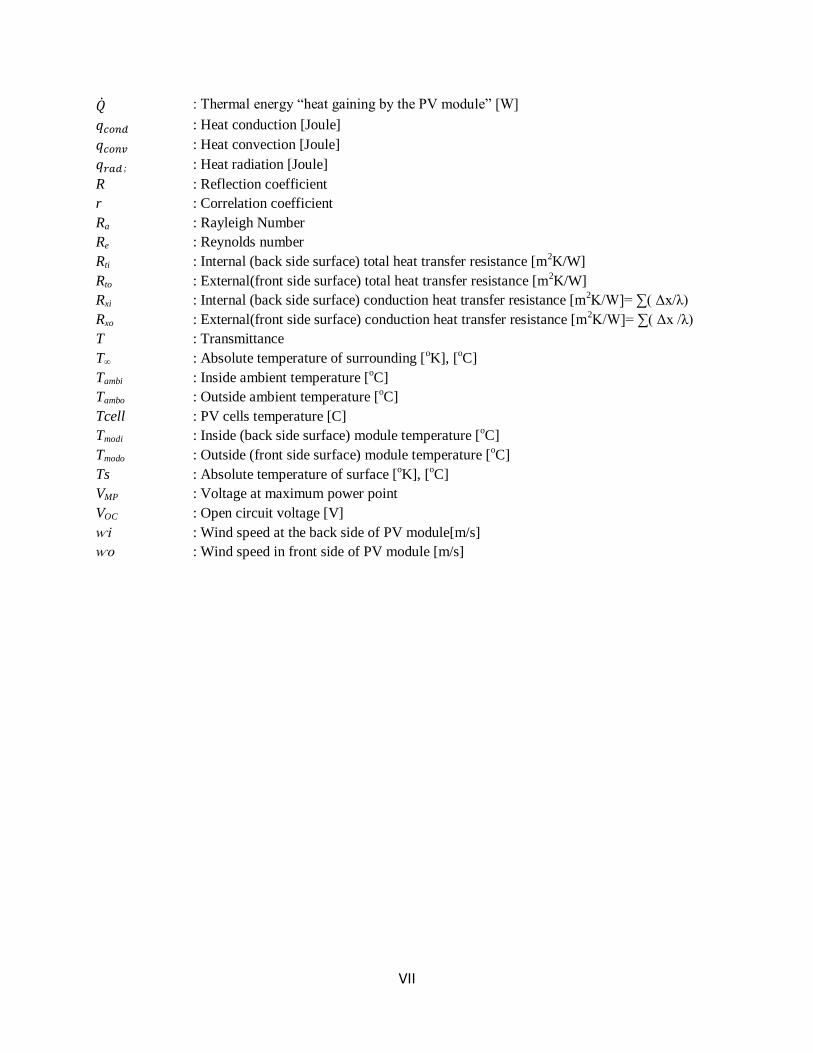
: Thermal energy “heat gaining by the PV module” [W]
: Heat conduction [Joule]
: Heat convection [Joule]
; : Heat radiation [Joule]
R : Reflection coefficient
r : Correlation coefficient
Ra : Rayleigh Number
Re : Reynolds number
Rti : Internal (back side surface) total heat transfer resistance [m2K/W]
Rto : External(front side surface) total heat transfer resistance [m2K/W]
Rxi : Internal (back side surface) conduction heat transfer resistance [m2K/W]= ∑( Δx/λ)
Rxo : External(front side surface) conduction heat transfer resistance [m2K/W]= ∑( Δx /λ)
T : Transmittance
T∞ : Absolute temperature of surrounding [oK], [
oC]
Tambi : Inside ambient temperature [oC]
Tambo : Outside ambient temperature [oC]
Tcell : PV cells temperature [C]
Tmodi : Inside (back side surface) module temperature [oC]
Tmodo : Outside (front side surface) module temperature [oC]
Ts : Absolute temperature of surface [oK], [
oC]
VMP : Voltage at maximum power point
VOC : Open circuit voltage [V]
ⱳi : Wind speed at the back side of PV module[m/s]
ⱳo : Wind speed in front side of PV module [m/s]
VIII
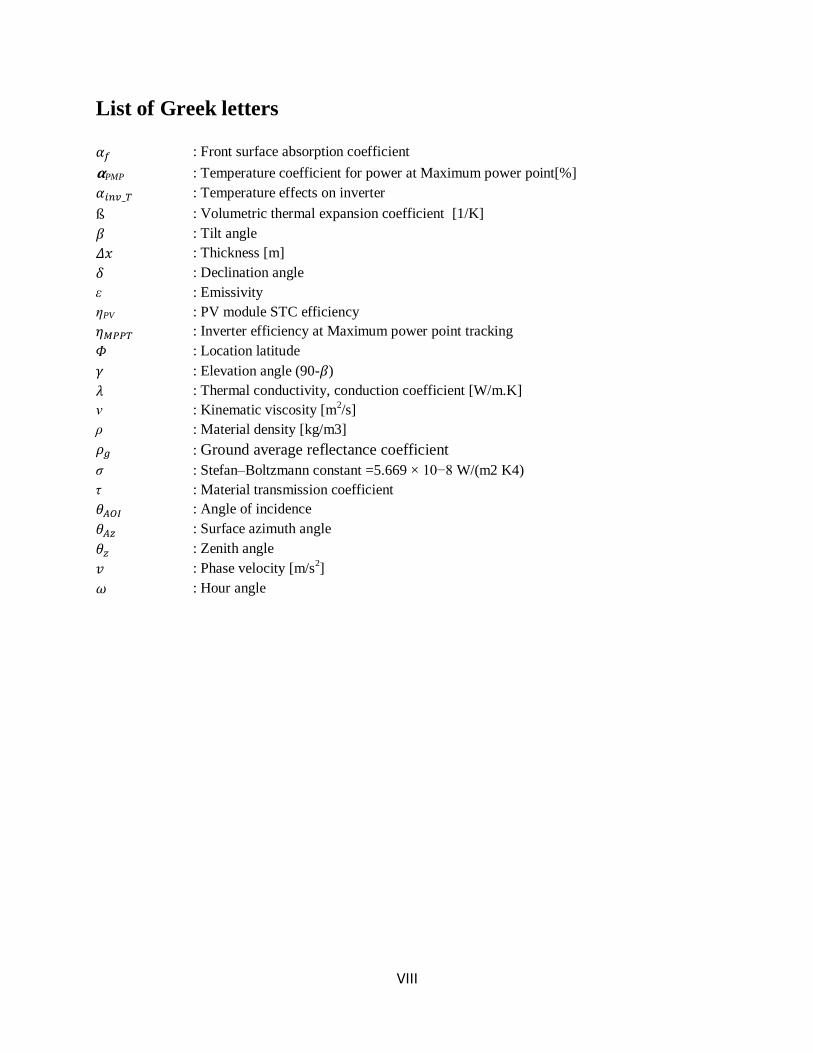
List of Greek letters
: Front surface absorption coefficient
PMP : Temperature coefficient for power at Maximum power point[%]
: Temperature effects on inverter
: Volumetric thermal expansion coefficient [1/K]
: Tilt angle
: Thickness [m]
: Declination angle
ε : Emissivity
ηPV : PV module STC efficiency
: Inverter efficiency at Maximum power point tracking
: Location latitude
: Elevation angle (90- )
: Thermal conductivity, conduction coefficient [W/m.K]
ν : Kinematic viscosity [m2/s]
ρ : Material density [kg/m3]
: Ground average reflectance coefficient
σ : Stefan–Boltzmann constant =5.669 × 10⁻⁸ W/(m2 K4)
τ : Material transmission coefficient
: Angle of incidence
: Surface azimuth angle
: Zenith angle
: Phase velocity [m/s2]
: Hour angle
IX
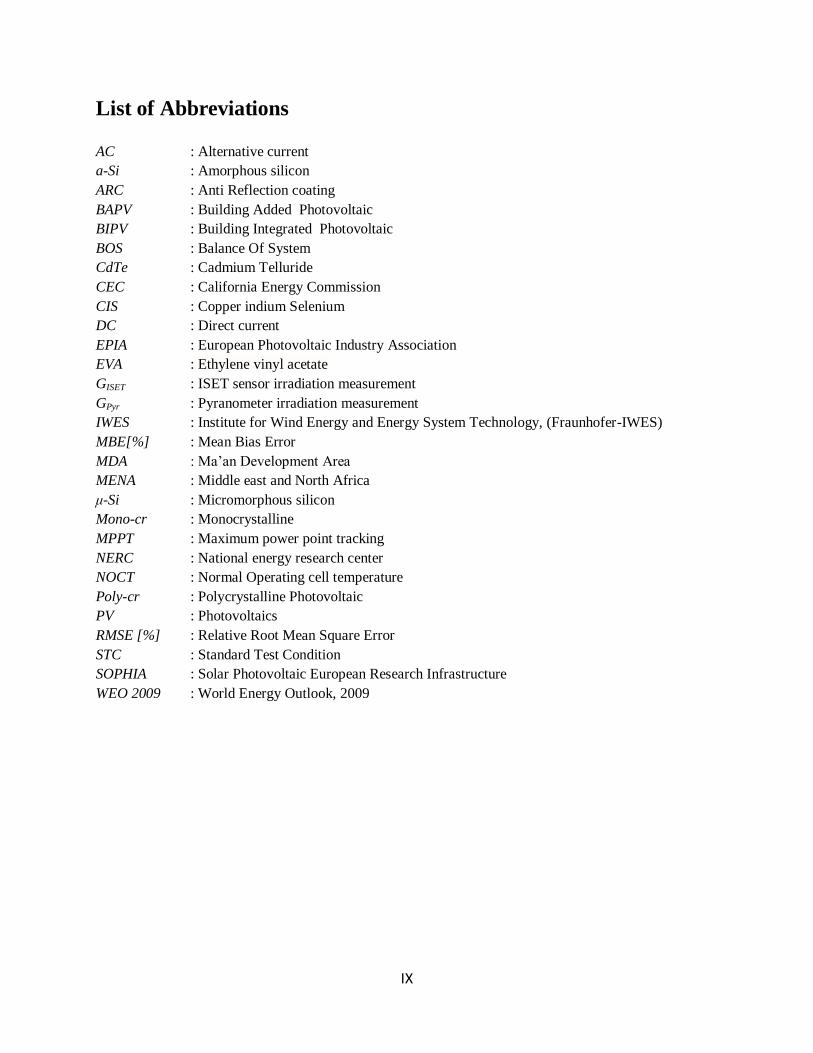
List of Abbreviations
AC : Alternative current
a-Si : Amorphous silicon
ARC : Anti Reflection coating
BAPV : Building Added Photovoltaic
BIPV : Building Integrated Photovoltaic
BOS : Balance Of System
CdTe : Cadmium Telluride
CEC : California Energy Commission
CIS : Copper indium Selenium
DC : Direct current
EPIA : European Photovoltaic Industry Association
EVA : Ethylene vinyl acetate
GISET : ISET sensor irradiation measurement
GPyr : Pyranometer irradiation measurement
IWES : Institute for Wind Energy and Energy System Technology, (Fraunhofer-IWES)
MBE[%] : Mean Bias Error
MDA : Ma’an Development Area
MENA : Middle east and North Africa
μ-Si : Micromorphous silicon
Mono-cr : Monocrystalline
MPPT : Maximum power point tracking
NERC : National energy research center
NOCT : Normal Operating cell temperature
Poly-cr : Polycrystalline Photovoltaic
PV : Photovoltaics
RMSE [%] : Relative Root Mean Square Error
STC : Standard Test Condition
SOPHIA : Solar Photovoltaic European Research Infrastructure
WEO 2009 : World Energy Outlook, 2009

1
Acknowledgment I would like to express my thanks to Prof. Josef Börcsök and Prof. Ahmad Al Koussi for their
review works.
Furthermore, I would like to thank Dr. Ali Hayek for his helpfulness and efforts during my
Master thesis.
I have been very fortunate to perform my master thesis at Fraunhofer- IWES institute in Kassel; I
owe my deepest gratitude to Mr. Sing Misara for allowing me to explore an important scientific
area regarding my interest under the supervision of Dr. Norbert Henze.
I would like to appreciate Mr. Malik Al Kabariti for his guidance and his helpfulness. Also, I am
deeply thankful the Invaluable people who supported me during performing my thesis, Mr. Firas
Al Alawneh and Mr. Salah Al Azzam (National energy research center NERC)-Jordan. Also,
further thanks for Mr. Emil Al Assi for sharing his experience.
I acknowledge Dr. Ahmad Al Salaymeh (University of Jordan) for giving me the needed
information to accomplish my thesis.
I would like to show appreciation for the people who were involved in organizing and
coordinating this program in Kassel University and Cairo University.
I would like to thank my class mates in our master program, especially Ahmad Al-Tawafsheh for
his collaboration and assistance. Moreover. I am thanking Nuha Sad for her helpfulness.
Finally, I would to thank my parents and siblings for their moral support and prays and letting
me become who I am today.
2
Abstract Photovoltaic (PV) is growing at a rapid pace in the last decade, and it achieved a considerable
attention as one of the low carbon most promising renewable energy alternatives. The
Photovoltaic’s performance depends mainly on the incident irradiation, ambient temperature and
thermal characteristic of the PV technology.
The aim is to develop an evaluation tool for analyzing the performance of the different
photovoltaic technologies. This thesis was performed for two different sites, Kassel in Germany
and Ma’an in Jordan. For the Kassel site, a comparison between two different irradiation
measurement sensors (Pyranometer and ISET sensor) was performed, then an estimation of
electrical and thermal characteristics for the two photovoltaic technologies (polycrystalline
Silicon and micromorphous silicon μ-Si) has been investigated by the simulation model.
Moreover, the outputs of the simulation were evaluated by using a real measured data for the
module and system level.
The evaluation of the output power for the module and system levels show less deviation by
using ISET senor as the base of irradiation measurement, while it was deviated more when
measuring the irradiation via pyranometer. Therefore ISET sensor was more accurate than
pyranometer for irradiation measurement.
On the other hand, for the Ma’an site, estimation of electrical and thermal characteristics for the
two photovoltaic technologies (polycrystalline Silicon and Cadmium Telluride CdTe) has been
determined by the simulation model. The estimated output power shows that the highest energy
yield was occurred at the optimum tilt angle (32o). Generally, in the both sites the results show
that, thin film technology achieves a higher specific energy yield than polycrystalline
technology.

3
Chapter 1
Introduction
4
1. Introduction Photovoltaic power generation has been receiving considerable attention as one of the most
promising energy generation alternatives. It can hold the world electricity consumptions.
Photovoltaic (PV) industry has been continuously growing at a rapid pace over the recent years.
Silicon crystalline PV modules are widely used in the world. New PV technologies with cheaper
manufacturing cost compared to traditional silicon crystalline based modules are available in the
international market these days such as; amorphous silicon (a-Si), Cadmium Telluride (CdTe)
and Copper Indium Selenium (CIS). In addition, new standards and testing schemes are
developed to be comparable with the new or improved technologies.
Photovoltaic can be recognized as one of the most promising renewable energy sources.
Germany is the technology leader in photovoltaic field where research and studies are performed
to optimize the PV performance for different technologies to achieve the maximum power and
energy production under different conditions. Fraunhofer (IWES) institute, which is located in
Kassel-Germany, is one of the leaders in photovoltaic researches and it has the PV testing
facilities for such a research.
On the other hand, Jordan is located within the world solar belt and has more than 300 sunny
days per year [1]
. The lack of conventional resources forces Jordan to utilize abundant renewable
energy recourses such as solar energy. Studies related to sun irradiation in Ma'an site in Jordan
introduce that it is blessed with a high insulation during the year, the generated electricity could
reach more than 10 GWh/year from 5MW PV grid connected power plant [2]
. Companies started
to invest and test many PV technologies to study large-scale projects such as Shams Ma’an
project with a 100MWp initial capacity and the project target is to expand the capacity to
500MWp in the future [3]
.
Due to increasing in the electricity price; Domestic PV systems could be used and implemented
with a low system cost when compared to the previous years. Because of the noticeable drop in
the PV system cost, it could compete the utility electricity price especially in the region with a
high irradiation such as the solar belt regions. However, PV installations are mainly ground
mounted; in Germany Building Integrated Photovoltaic (BIPV) and roof top installations have a
big role in PV projects and people benefit from these projects through reducing the energy bill.
Many countries started to issue a special legislation to encourage investing in PV projects.
Two PV modules with the same rated power – even with the same technology- will not provide
the same output power and energy yield. Also, the different thermal characteristics play an
important role in module efficiency as well as the output power; this is because the PV module is
influenced by a variety of environmental factors and solar cell physics. Hence, testing and
modelling the PV module/system in the outdoor environment with specifying the influences of
all significant factors, are very important to check the system performance and to facilitate
5
efficient troubleshooting for photovoltaic module/system through considering hourly, daily and
monthly or annual basis [4]
. This is performed through the European project (SOPHIA) which
defines the relevant aspects and deficits of the module and system performances in order to
benchmark a standardized test procedure data base.
Photovoltaic output power depends on many factors; such as sun position, weather conditions,
module temperature, thermal characteristics, module material composition and mounting
structure.
Real time power generation should be investigated precisely for grid performance, because a
high penetration of PV production could create instability in the grid [5]
. It is very important to
measure the produced PV systems peak power to protect the grid and power needed at high
consumption. The costs of the generated electricity from photovoltaic’s decrease year by year
and it is expected to be cheaper than conventional recourses, and this leads the customers to
install their PV systems instead of using the expensive conventional electricity from the utility [6]
.
In future, real time power especially from domestic systems will be more important to take into
consideration because higher penetration of PV systems will affect the grid performance.
Furthermore, it is the base of controlling energy management systems for the smart homes.
The uncertainty of the photovoltaic performance models is still too high; the early existing PV
performance models mainly deal with the ideal PV module characteristics rather than the
dynamic situation under the surrounding conditions [7]
. Also, researches are mainly conducted for
evaluating PV module performance rather than system performance. In Jordan there are a lack
of studies concerning the dynamic operation of PV modules and systems.
The objective is to develop an evaluation tool for analyzing the performance of different
photovoltaic technologies; electrical and thermal performance photovoltaic model based on the
PV module characteristics is simulated, under consideration of the different irradiation sensor
measurement and different PV modules technologies. Module level and system level are
simulated regarding the compatible information and surrounding boundary conditions.
The study is performed by considering the maximum efficiency of the PV module and the effect
of module temperature on the output power as well as energy yield, the utilized tools for the
study is Matlab Simulink and it can be used for different PV module/system mounting structures
such as ground mounting, Building Integrated Photovoltaic (BIPV) and Building Added
Photovoltaic (BAPV). In this thesis the evaluations and measurements are based on ground
mounted structures. The simulation is performed under physical, thermal and electrical
characteristics of the PV modules. Moreover, the degradation is considered in the simulation for
the PV modules under test.
6
Two locations are considered; Kassel in Germany and Ma’an in Jordan based on available
meteorological data. In relation to Kassel site the model is evaluated based on two different PV
Technologies; polycrystalline Silicon and micromorphous silicon μ-Si. Also, with introducing
isolation material at the back cover of the PV module to study the effects of the low ventilation at
the backside of the module, which is the branch of the Building Integrated Photovoltaic (BIPV).
DC and AC output power and energy yield at 30o south orientation are predicted and evaluated
with the available measured data of the PV test filed in Fraunhofer-IWES.
In relation to Ma’an, two PV technologies are considered; polycrystalline Silicon and Cadmium
telluride CdTe technologies. DC and AC output power and energy yield for different south
orientation are predicted. Also an investigation for the two different brands of polycrystalline
technology with the same output power is performed to compare the different performances. The
available meteorological data belongs to Ma’an Development Area (MDA)1. The PV modules
which are under study, belong to the PV test field of (Kawar Group company2), they are now in
the measuring stage to specify the most efficient PV technology in the site.
1 MDA: Ma’an Development Area , [www.mda.jo]
2 Kawar Group: is a Jordanian company, they own a PV test field in Ma’an (www.Kawar.com)
7
Chapter 2
Photovoltaic Overview
8
2. Photovoltaic Overview In this chapter, an introduction about the main PV electrical characteristic is explained, different
technologies specifications with the main performance factor are investigated. At the end of this
chapter a brief economical and market survey is introduced.
2.1 Photovoltaic characteristics Photovoltaic systems are mainly grouped in two categories; Stand-alone system (also called off-
grid) and grid connected system (also called on-grid). Stand alone systems can be integrated with
another energy source such as Wind energy or a diesel generator which is known as hybrid
system. The storage is the main difference between these categories, where the produced
electrical energy is stored in batteries in off-grid system and the public grid utility is the storage
tank for the excessive produced energy from on-grid systems.
On-grid systems are installed more often nowadays, some countries offer incentives to encourage
people to invest in Photovoltaic and to reduce green house gas emissions. Feed-in-tariff was
introduced in European countries such as Germany and Greece. “Net metering” mechanism was
introduced in USA, and it is now under parliament discussion in Jordan.
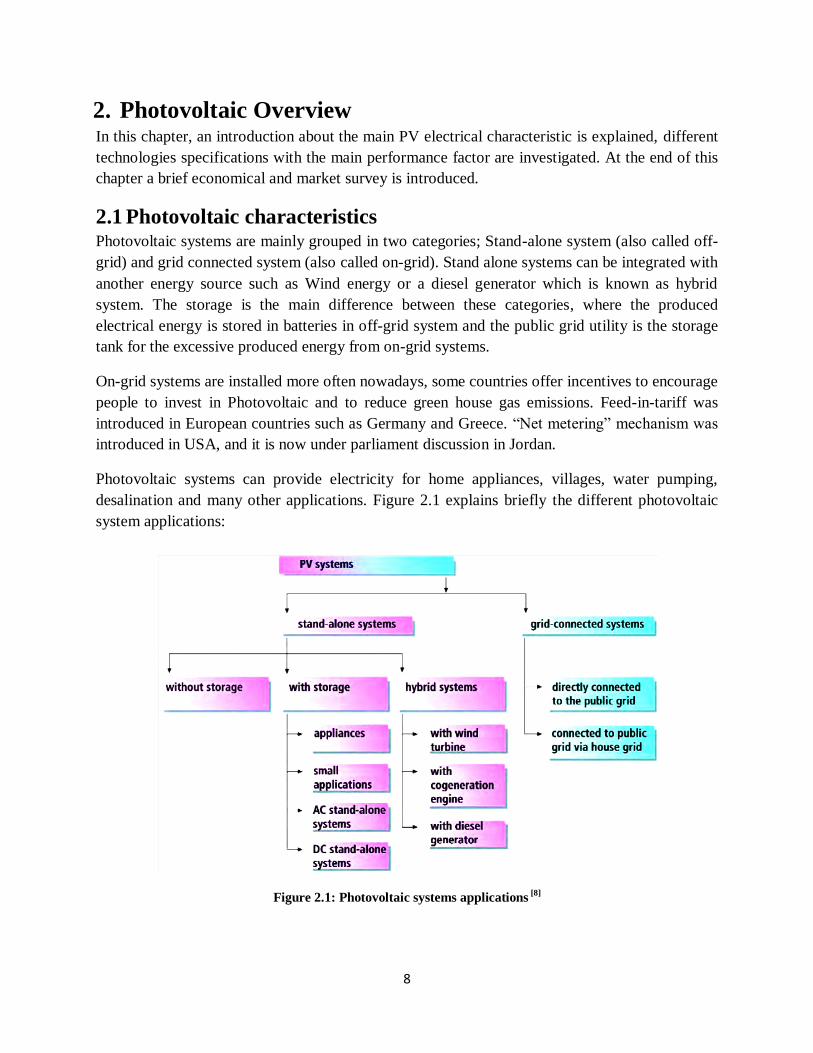
Photovoltaic systems can provide electricity for home appliances, villages, water pumping,
desalination and many other applications. Figure 2.1 explains briefly the different photovoltaic
system applications:
Figure 2.1: Photovoltaic systems applications [8]