Embed Size (px)
Citation preview

Master Thesis
Factors that impact firm`s profitability: Evidence
from European Biotech
Submitted by:
Marija Nikolikj
Supervisor:
Dr. Imke Keimer
Co-supervisor:
Prof. Dr. Ulrich Egle
Lucerne University of Applied Sciences and Arts, School of Business, Master of Science in Business Administration, Major in Business Development and Promotion
June 2016
1
Master Thesis
Factors that impact firm`s profitability: Evidence from
European Biotech
Student:
Marija Nikolikj
marija.nikolikj @stud.hslu.ch
Supervisor:
Dr. Imke Keimer
Co-supervisor:
Prof. Dr. Ulrich Egle
[email protected] Master Thesis is submitted as part of the requirements for the Msc in Business Administration, Major in Business Development and Promotion, School of Business, Lucerne University of Applied Sciences and Arts.
June 2016

2
Acknowledgement
I would like to express my gratitude to my supervisor Dr. Imke Keimer, for all
her support and motivation during the writing process of this thesis.
I would also like to thank my parents and brother for their enormous moral
and financial support during the period of my studies. Finally, I thank to all
my friends who inspired me and encouraged me in challenging times.
Marija Nikolikj
3
Abstract
This study investigates the impact of R&D expenditure on firm`s profitability
in the biotech sector in Europe. In this study, I examine the relationship
between company`s profitability and R&D expenses, controlled for firm`s
size, age, outsourcing, liquidity, long-term debt and country of origin. The
analysis is done using a multiple linear regression model, with a sample data
from 30 biotech companies from France, Germany, Sweden, Switzerland and
UK. The main findings of this research oppose the majority of the previous
findings and confirm a non-significant relationship between R&D expenses
and firm`s profitability.
Keywords: Research and Development, R&D, R&D expenses,
profitability, performance, high-tech industry, knowledge-
intensive industry, biotech industry.

4
Table of Contents:
ABSTRACT………………………………………………………………………………………………3
TABLE OF CONTENTS……………………………………………………………………………….4
LIST OF ABBREVIATIONS…………………………………………………………………………5
LIST OF TABLES ………………………………………………………………………………………6
LIST OF FIGURES …………………………………………………………………………………….6
LIST OF ABBREVIATIONS .................................................................................................................. 5
1. INTRODUCTION ....................................................................................................................... 7
1.1 BACKGROUND .......................................................................................................................... 7 1.2 RESEARCH QUESTION AND HYPOTHESIS DEVELOPMENT .................................................................... 8 1.3 RESEARCH OBJECTIVES ............................................................................................................... 9 1.4 ORGANIZATION OF THE STUDY ................................................................................................... 10
2. LITERATURE REVIEW ............................................................................................................. 11
2.1 BIOTECH INDUSTRY ................................................................................................................. 11 2.2 DEFINITION OF R&D AND INNOVATION, THEIR DISTINCTION AND INTERCONNECTION ........................... 19 2.3 DEFINITION OF R&D EXPENSES .................................................................................................. 20 2.4 DEFINITION OF PROFITABILITY ................................................................................................... 22
3. METHODOLOGY .................................................................................................................... 28
3.1 RESEARCH DESIGN AND METHOD ............................................................................................... 28 3.2 DECLARATION OF VARIABLES ..................................................................................................... 29 3.3 MODEL DESCRIPTION .............................................................................................................. 31 3.4 SAMPLE SELECTION .................................................................................................................. 34 3.5 DATA PRESENTATION ............................................................................................................... 35
4. DATA ANALYSIS ..................................................................................................................... 36
4.1 DESCRIPTIVE STATISTICS ........................................................................................................... 36 4.2 ASSUMPTIONS OF MULTIPLE LINEAR REGRESSION ........................................................................... 37 4.3 ANALYSIS OF RESULTS .............................................................................................................. 38 4.4 LIMITATIONS .......................................................................................................................... 42 4.5 DISCUSSION AND RECOMMENDATIONS ........................................................................................ 43
5. CONCLUSION ......................................................................................................................... 45
6. REFERENCES .......................................................................................................................... 46
7. APPENDICES .......................................................................................................................... 54

5
List of Abbreviations
COGS=Cost of Goods Sold
EBIT= Earnings before interest and taxes
EU=European Union
FDA= Food and Drug Administration
DNA= Deoxyribonucleic acid
IAS= International Accounting Standards
IT=Information Technology
NACE=Statistical classification of economic activities in the European
Community
NASDAQ= National Association of Securities Dealers Automated Quotations
OECD= Organisation for Economic Co-Operation and Development
PwC= Pricewaterhouse Coopers
R&D= Research and Development
ROA=Return on Assets
SCP= Structure-Conduct-Performance
SME- Small and Medium Enterprises
SSAP=Statement of standard accounting practice
UK= United Kingdom
USA= United States of America

6
List of Tables
Table 1…………………………………………………………………………………………………17
Table 2………………………………………………………………………………………………..18
Table 3………………………………………………………………………………………………..22
Table 4………………………………………………………………………………………………..34
List of Figures
Figure 1...……………………………………………………………………………………….……13
Figure 2...…………………………………………………………………………………………….15
Figure 3...………………………………………………………………………………………….…16
Figure 4 ……………………………………………………………………………………………...18
Figure 5 ………………………………………………………………………………………………19

7
1. Introduction
1.1 Background
What makes the biotech industry nowadays to be considered among the
most profitable industries in recent decade? Is it its intensive R&D
structure or are there other factors that contribute to its financial
performance? In recent decades, the field of economics, strategic
management, accounting and finance have elaborated numerous academic
findings of determinants influencing firm`s profitability (Goddard,
Tavakoli and Wilson, 2005, p.1269). Number of these studies derive from
traditional price theory and the structure-conduct-performance (SCP)
paradigm of the modern industrial organization literature (Grinyer and Mc
Kiernan, 1991, p.17).
The reality of new global division between OECD countries and the newly
industrialized economies, implies even greater dependence on European
economies on the function of the knowledge intensive industries (Antonelli,
1998, p.15).
Within the last decade, the biotech industry has been one of the centres of
attention of the financial media worldwide (Vaishampayan, 2015; Grant,
2015; Cheng and Lee, 2015). Many renowned journal articles have
elaborated the topic of the rising market share prices, the recent years high
profits for investors in the industry (Crow and Bullock, 2016; The
Economist, 2014). This fact is not surprising, taken into consideration the
numbers behind profit margins in the industry in the recent period and the
number of FDA drug approvals (Zueckerman, 2015). The large profits, on
the other hand, add to the speculation about a new potential `` biotech
bubble``, forcing investors to give a second thought before deciding to
invest (Shubber, 2015). According to an article reported in the Financial
Times, the NASDAQ Biotech Index has risen up to 570 % since March 2009,
nearly double more than the NASDAQ Composite Index, making
investments in the biotech sector by large more profitable than other
industries (Shubber, 2015). The same source reports that the expectations
of new blockbuster drugs are the one who drive the biotech sector high
growth (Shubber). The biotech is considered to be one of the most

8
innovative and research-intensive industrial sectors (Burrone, 2006). As
stated in the report from European Commission, (The 2014 EU Industrial
R&D Investment Scoreboard, p.74), the Pharmaceutical and Biotechnology
sectors has been among the leading in its investments in the R&D. The
value of innovation is also being recognized among executive mangers in
various companies as stated in a survey conducted by PwC (Global
Innovation Survey, Executive Summary, 2013, p.4). As reported, 43% of
the interviewed executive managers, confirm that innovation is vital for
their organizations (Global Innovation Survey, Executive Summary, 2013,
p.4).
A number of previous studies have attempted to investigate the relevance
of R&D and additional factors that add to firm`s profitability, however,
little research is done to investigate this matter in the biotech sector
particularly in Europe. Moreover, the conclusions among academics do not
go in the same direction, meaning the debate whether the higher proportion
of R&D investments actually contribute to higher profits is still open.
1.2 Research Question and Hypothesis development
Considering the importance of innovation in the fast growing industries
nowadays (Coad et al., p.633), and the lack of academic literature to address
this issue specifically to the biotech industry, this research will focus on the
impact of R&D on firm`s profitability, controlling for other factors that
might also have an influence. Even though there is an ongoing debate
whether R&D contributes to higher level of firm`s financial performance,
majority of previous academic findings on the relationship between R&D,
innovation and firm`s profitability confirms a positive relationship
(Branch, 1974; Coad and Rao, 2006; Cozza, Malerba, Mancusi, Perani and
Vezzuli, 2012; Geroski, Machin and Van Reenen, 1993; Grabowski, Vernon
and Dimasi, 2002; Hall and Bagchi-Sen, 2002; Jefferson, Huanmao,
Xiaojing and Xiaoyun, 2006)

9
With this in mind, the main research question of this paper will be
formulated as:
Does firm`s profitability in the biotech sector increase with
more investment in the R&D?
Based on the majority of the previous academic findings, I am thus
examining the validity of the positive effects that increase in R&D expenses
have on firm`s profitability. Hence, I formulate the following hypothesis:
Hypothesis 1a: R&D expenses have a positive effect on firm`s
profitability in the biotech industry.
1.3 Research Objectives
The research objectives of this study are the following:
To explore existing literature, with goal to develop foundation on what
are the previous findings related to factors that impact firm’s
profitability in general, within the high-technology and biotech industry
in particular;
To explore existing literature, with goal to discover previous findings on
the relationship between the firm`s profitability and the R&D expenses;
To identify a measure for the main dependent and independent
variables;
To identify controlling variables, for which it is found that have an
impact on firm’s profitability;
To develop statistical model for measuring the impact on R&D on firm’s
profitability;
To define the geographical scope of the countries from which the sample
size will be collected;

10
To obtain corresponding data of 100+ observations from representative
companies from the defined sample data;
To conduct relevant statistical analysis of the data obtained, to explore
the results and to report the findings of the research;
To draw conclusions with respect to the impact of R&D expenses on
firm`s profitability in the biotech sector.
1.4 Organization of the study
This Master Thesis is organized in three core sections as follows:
In section one, the Introduction, I present the background of the study, the
research question, the research objectives and the hypothesis development
of the research. In section two, the Literature Review, I provide an
overview of the biotech industry and its business model nowadays, a
definition for profitability and R&D, differentiation and interconnection of
R&D from the innovation process. Further, I provide existing academic
findings on the impact of R&D expenses on firm`s profitability.
In section three, the Methodology, I provide explanation of the research
design, the selected model for conduction of this research, the sample
definition and the criteria for selection, the data collection process and
interpretation of the results. Further, in section four, I provide analysis of
the data obtained from this research and the main findings, along with a
list of the main limitation of the research and discussion of the findings.
In Section five, I present a conclusion of the overall findings in this
research.
11
2. Literature review
In the literature review part of the Preliminary Master Thesis, I present the
definitions and review of the academic literature on the key topics and main
variables in this research. First, I present general overview of the biotech
industry, its business model and its main specificities. Second, I provide
definition of R&D activities and its differentiation and interconnection with
the innovation processes, its relevance in the biotech industry, followed by
definition of the scope of R&D expenses. Third, I present definition for
profitability. Fourth, I provide evidence on main academic findings on the
impact of R&D expenses on firm`s profitability.
2.1 Biotech Industry
The use of traditional biotechnology can be tracked thousands of year ago in
use of producing products for daily use (Clark and Pazdernik 2016,
Introduction section, para.1). It is only until recent times, when genetics has
been incorporated in this field of study (Clark et al., 2016, Introduction
section, para 1-3). According to Clark et al., (Introduction section, para 3.)
the nowadays modern biotechnology incorporates modern genetics but also
other fields such as informational technology and molecular biology. Hence,
biotechnology must not be seen as a separate science, but should be regarded
as a blend that includes other scientific fields (Keegan, 2008, p.5)
The Organisation for Economic Co-Operation and Development (OECD,
2005), defines biotechnology as:
” The application of science and technology to living organisms, as well as
parts, products and models thereof, to alter living or non-living materials
for the production of knowledge, goods and services” (A Framework for
Biotechnology Statistics, 2005, p.9).
The industrial application of biotech discoveries is a broad term, applicable
to many industries such as agriculture, health care and the industry sector,
also known as green, red and white biotechnology respectively

12
(Biotechnology in Europe. The tax, finance and regulatory framework
and global policy comparison, 2014, p.4).
According to European Commission (“Biotechnology-European
Commission”, n.d), the main application of biotechnology in the EU
economy can be classified in three broad groups:
1. Healthcare and pharmaceutical applications – in this field, the biotech
industry has made contribution to discovery and development of new
types of medicines, therapies, diagnostics and vaccines. Among the
most eminent discoveries are the new medicines for treatment of
growth and metabolic diseases, multiple sclerosis, cancer and
Alzheimer`s disease (“Biotechnology-European Commission”, n.d);
2. Agriculture, livestock, veterinary products and aquaculture- where
biotechnology has improved the animal feed, the food processing and
breeding of plants (“Biotechnology-European Commission”, n.d);
3. Industrial processing and manufacturing- use of enzymes in production
of detergents, pulps and paper, textiles and biomass, contributing to
improvement of process efficiency, decreased energy use and water
consumption and reduction in toxic waste (“Biotechnology-European
Commission”, n.d).
1970s are an important decade for the development of biotechnology and are
considered to be the birth of the biotech industry (Keegan, 2008. p.5). Among
the discoveries notable for the period are the use of a new recombinant DNA
technique, and the discovery on how to fuse an anti-body producing cell with
a cancer cell (Keegan, p.5). Further, the founding of Genentech in year 1976 is
considered to be the birth of health-care biotech industry (Keegan, p.5)
Stefanec (2011, p.343) describes the biotech industry as sector comprised of
mainly small research focused firms, specialized in the diagnostic and the
therapeutic area.
Van Beuzekom and Arundel (2009, p.14), define a biotechnology firm as a:

13
“firm that is engaged in biotechnology by using at least one biotechnology
technique to produce goods or services and/or to perform biotechnology
R&D”.
Nowadays, the biotech companies can be separated into two subgroups (Van
Beuzekom et.al, 2009, p.14):
1. “dedicated biotechnology firms: defined as a biotechnology firms whose
predominant activity involves the application of biotechnology techniques to
produce goods or services and/or to perform biotechnology R&D” (Van
Beuzekom et al., 2009, p.14);
2. “biotechnology R&D firms: defined as a firm that performs biotechnology
R&D”. Dedicated biotechnology R&D firms, a subset of this group, are
defined as firms that devote 75% or more of their total R&D to biotechnology
R&D” (Van Beuzekom et al., p.14).
Figure 1
Figure 1. Segmentation of biotech firms. From “Biotechnology Statistics 2009” by Van
Beuzekom and Arundel, (2009, p.10).
Retrieved March 3, 2016 from http://www.oecd.org/sti/sci-tech/42833898.pdf
According to Jonsson (2007, p.3), as of year 2007, the European dedicated
biotechnology industry employs 96 500 people in total, mostly in SMEs. The

14
industry is highly research-intensive with 44% of employees (42 500)
involved in research and development functions (Jonsson, 2007, p.3).
In terms of industry specificities, the sector is characterized with using
innovative, new “cutting-edge” techniques, experimental “know-how” and
external source for R&D financing (Keegan, 2008, p.6).
The main difficulties in the biotech industry nowadays, are the long time for
product development with high costs until product is brought to the market,
fuelled by high level of technical uncertainty and risk (Keegan, p.7). The time
to develop a product for a biotech start-up company is estimated to range
between 8-12 years (Tsai, W., & Erickson, S. 2006). This timeframe can
extend up to 10-15 years according to Shimasaki (2010).
Hine and Kapeleris (2006, p.20) define the main characteristics of the
biotech industry as following:
● “Medium to very long product development lead times;
● Capital-intensive;
● Highly regulated;
● Extensive skill sets and technical knowledge required;
● One of the most research-intensive industries in the world;
● In many cases ethical clearance is essential, especially for any animal/
human testing;
● Intellectual property protection is an essential element of success for
most biotechnology companies;
● Strong linkages and strategic alliances established with universities,
institutions and other biotechnology companies;
● Capital raising is essential and consumes a significant amount of time
and resources throughout an organization’s life cycle (Hine et al., 2006,
p.20)”.
The choice of the business model among the biotech companies, can depend
on various factors such as technical challenges, barriers to entry, and the
level of competition (Keegan, 2008, p.152).

15
As presented in Figure 2 below, the pillar of traditional business model in
the biotech industry are the start-up companies, whose sustainability is
based on successive rounds of financing until IPO (Keegan, 2008, p.152).
According to a report from Pricewaterhouse Coopers, this typical biotech
model, based on external sources, usually venture capital, nowadays is
breaking down (Biotech reinvented. Where do you go from here? 2010, p.4).
As stated in the same report, many of the external conditions who enabled
the biotech companies to succeed in the past no longer exist (Biotech
reinvented. Where do you go from here? 2010, p.5). In addition, the research
nowadays is spread globally, emerging economies are becoming powerful
competitors and financial investors more reserved (Biotech reinvented.
Where do you go from here? 2010, p.5). Despite this fact, the traditional
business model still remains the main model for most of the biotech business
strategies Keegan (2008, p.152).
Figure 2
Figure 2. Biotech`s business model. From “Biotech reinvented. Where do you go from
here? “by PricewaterhouseCoopers (2010, p.4). Retrieved April 19, 2016 from
http://www.forschungsnetzwerk.at/downloadpub/pwc_Studie_Biotech_reinvented.pdf
Damodaran (2016) states that the average annual revenue growth rate in
the last five years, in the global biotech sector is 20.3 %, with a 10.04 %
growth in net income. As reported by Ernst and Young (Beyond Borders.

16
Biotechnology Industry Report 2015, p.20), the publicly listed companies
in the US biotech sector completed the year 2014, with total revenues of
93,1 billion US Dollars. As of year 2014, the total number of companies in
the biotech industry in the United Stated is documented to be 2519 (Beyond
Borders. Biotechnology Industry Report, 2015, p.20). In terms of number
of companies, as of year 2014, the European biotech sector is falling behind
US, with a total number of 2136 companies (Beyond Borders.
Biotechnology Industry Report, 2015, p.28). In this respect, the difference
between the US and the European biotech sectors comes both discrepancy
in their revenues, as the revenues of the publicly listed European biotech
companies are reported to be 23, 992 billion US Dollars with US biotech
firms leading in both aspects (Beyond Borders. Biotechnology Industry
Report, 2015, p. 28).
According to Figure 3, biotech companies has shown a steady growth in
terms of revenue and R&D expenses from year 2010 until year 2014, with
less stable level of net income for the same period.
The approximate level of R&D expenses ranges between 23 and 26 % from
the revenue reported in the same period.
Figure 3
Figure 3. Revenues, R&D expenses and Net Income in mil. USD for publicly listed European biotech
firms. “Beyond borders. Global biotechnology report 2012“by Ernst and Young (2012)”, “Beyond

17
Borders. Biotechnology Industry Report” by Ernst and Young (2013, 2014, 2015). Figure completed
by author. Retrieved March 1, 2016 from
http://www.ub.unibas.ch/digi/a125/sachdok/2012/BAU_1_6031975 .pdf
http://www.ey.com/Publication/vwLUAssets/Beyond_borders/$FILE/Beyond_borders.pdf
http://www.ey.com/Publication/vwLUAssets/EY-beyond-borders- unlocking- value/$FILE/EY-
beyond-borders-unlocking-value.pdf
http://www.ey.com/Publication/vwLUAssets/EY-beyond-borders-2015/$FILE/EY-beyond-
borders-2015.pdf
Table 1, gives a draft estimation of the main financial highlights for the
European biotech companies. As reported in Table 1, UK is a leader in
Europe according to all the mentioned parameters, with France and
Sweden ranking second and third respectively, in terms of reported revenue
and R&D investments (Beyond Borders. Biotechnology Industry Report,
2014, p.49). Further, Switzerland and Denmark rank second and third in
terms of reported net income, while Sweden and France rank second, third,
excluded of other countries (Beyond Borders. Biotechnology Industry
Report, 2014, p.49). Finally, in terms of number of public biotech
companies, UK is followed by Sweden, France and Germany, other
countries excluded (Beyond Borders. Biotechnology Industry Report,
2014, p.49).
Table 1
Table 1. Financial highlights of public European biotech companies by country, year 2013 (in mil.
USD). “Beyond Borders. Biotechnology Industry Report” by Ernst and Young (2014, p.49). Retrieved
March 14, 2016 from
Country Number of public
companies
Market capiltalization 31 December
2013
Revenue R&D
Net
Income (loss)
Total assets
UK 30 $32,825 $5,774 $1,217 $547 $10,652
Sweden 24 $9,451 $2,627 $658 $34 $7,281
France 23 $11,532 $3,919 $692 -$1 $5,105
Germany 13 $3,469 $286 $147 -$108 $1,070
Norway 9 $3,070 $157 $59 -$94 $508
Denmark 9 $15,766 $2,463 $541 $339 $3,719
Switzerland 8 $10,614 $1,989 $556 $382 $3,779
Belgium 6 $2,483 $423 $254 -$59 $1,098
Netherlands 3 $5,813 $1,329 $184 $27 $4,251
Other countries 17 $16,850 $1,827 $384 $124 $5,572
Financial highlights of public European biotech companies by country, year 2013 (in mil. USD)

18
http://www.ey.com/Publication/vwLUAssets/EY-beyond-borders-unlocking-value/$FILE/EY-
beyond-borders-unlocking-value.pdf
In terms of global market share position, according to Datamonitor (2011)
the European biotech companies rank second after American biotech
companies. Figures are presented in Table 2 below.
Table 2
Table 2. Global Biotech market segmentation by % of market share. From
“Biotechnology: Global Industry Guide” by Datamonitor (2011).
Retrieved May 2, 2016 from http://www.pharmavision.co.uk/uploads/rp_97.pdf
Further, in terms of company size, according to OECD (2015), as of 2013,
majority of European biotech companies fall in the rank of small companies
with less than 50 employees. The figures are presented in Figure 4 below.
Figure 4
Figure 4. Percentage of small biotech firms. From “Key Biotechnology Indicators”, by OECD
(2015). Retrieved March 15, 2016 from
http://www.oecd.org/sti/inno/keybiotechnologyindicators.htm
Continent/Region % Market share Americas 46.2
Europe 26.2
Asia-Pacific 25.2
Middle East & Africa 2.4
Total 100
Global biotech market segmentation by % market share (year 2010)

19
In terms of field of application, majority of the European biotech companies
are focused on R&D of products in the medical (health) biotech, followed by
industrial processing biotech (Figure 5).
Figure 5
Figure 5. Biotech R&D by field of application in Europe. “Key Biotechnology Indicators”, by
OECD (2015). Retrieved March 15, 2016 from
http://www.oecd.org/sti/inno/keybiotechnologyindicators.htm
2.2 Definition of R&D and Innovation, their distinction and
interconnection
According to Keegan (2008, p.40) in the context of the biotech industry,
R&D encompasses the processes by which drugs are discovered, tested and
brought to market and has traditionally been seen as the core competency
of pharmaceutical companies. The biotech sector is characterized with a
high level of technological innovation (Pisoni, Onetti, Fratocchi and Talaia,
2010, p.40). According to Pisoni et al. (2010, p.40) the biotech companies
record R&D investments of 30 % or more, on total sales.
These facts do not come as surprise taken into account the immense
number of research projects at early stage of the R&D process (Pisoni et al.,
p.40). To set a frame for the scope of which activities can be classified as
R&D from a holistic perspective I use the definition from Frascati Manual

20
(Frascati Manual 2002. The Measurement of Scientific and Technological
Activities, 2002, p.30):
“Research and experimental development (R&D) comprise creative work
undertaken on a systematic basis, to increase the stock of knowledge,
including knowledge of man, culture and society, and the use of this stock
of knowledge to devise new applications”.
It is important however that the processes of innovation and R&D to be
differentiated (Frascati Manual 2002. The Measurement of Scientific and
Technological Activities, 2002, p.42):
“If the primary objective is to make further technical improvements on the
product or process, then the work comes within the definition of R&D. If,
on the other hand, the product, process or approach is substantially set and
the primary objective is to develop markets, to do pre-production planning
or to get a production or control system working smoothly, the work is no
longer R&D” (as cited in Frascati Manual 2002. The Measurement of
Scientific and Technological Activities, 2002, p.42).
Though as previously stated that R&D and innovation are different
processes within a company, only for the purpose of providing relevant
theoretical background from previous academic researchers, I assume the
R&D and innovation to be interconnected processes since R&D is
considered to be an input of the innovation process of the firms (ac cited in
Zachariadis, 2003, p.2). This will not be replicated however in the
quantitative part of the research, as I use the measure for R&D expenses for
the level of R&D in the company.
2.3 Definition of R&D expenses
The treatment and the definition of the R&D expenses can vary between
countries, based on the accounting rules they have adopted. In a statement
of accounting for research and development (Statement of standard
accounting practice 13. Accounting for research and development, 1989,
p.3) the Financial Reporting Council in UK distinguishes between research
and development phase when it comes to treatment of the expenses.

21
According to it, the expenditures incurred on pure and applied research
should be written off as they are incurred (Statement of standard accounting
practice 13. Accounting for research and development, 1989, p.3). Further,
the development costs can be deferred to be matched against the future
revenue, provided that there is a reasonable expectation of specific
commercial success and of future benefits arising from the work, the project
is clearly defined and the related expenditure is separately identifiable
(Statement of standard accounting practice 13. Accounting for research
and development, 1989, p.3).
According to International Accounting Standards, IAS 38 (International
financial reporting standards as issued at 1 January 2009 [IFRS] 2009),
R&D are comprised of all expenditure that is directly attributable to
research and development activities (IFRS, 2009 p.1944, para. 127). IAS 38
(IFRS, p.1930, para. 54) states that no intangible asset during the research
phase shall be recognized and expenditure shall be recognized when it is
incurred. Further IAS 38 (IFRS, pp.1930-1931, para. 57) states that an
intangible asset can be recognized during the research and development
phase provided that an entity can demonstrate the technical feasibility and
intention of completing the intangible asset, its ability to use it or sell it. In
addition, an entity needs to provide an evidence of probable future
economic benefits, adequate technical, financial and other resources for
completion and reliable measure of the expenditure incurred in the
development phase (IFRS, pp.1930-1931, para. 57). According to
Alexander, Britton and Jorissen (2007, p.298), SSAP 13 and IAS 38 in
general specify the same criteria in respect of treatment of development
costs, however SSAP 13 states that the costs “may” be capitalized, provided
that all criterias are met. In this respect, according to Ernst and Young (US
GAAP versus IFRS, 2013, p.18) the IAS 38 differs from US GAAP due to the
fact that US GAAP treats costs incurred in the development phase as
expenses.
For the purpose of providing a relevant definition of R&D expenses, I use
the definition of IAS 38 for R&D expenses, due to the fact that majority of
the companies selected in this research fall under these accounting
22
standards, and hence the information provided on their financial statement
are reflected in the scope of IAS 38.
2.4 Definition of Profitability
As the majority of the countries represented in this research are falling under
IFRS Accounting standards, for the purpose of the defining profitability I use
the definition for profitability from IFRS under which profitability can be
defined as the residual amount that remains after expenses (including capital
maintenance adjustments, where appropriate) have been deducted from
income (International financial reporting standards as issued at 1 January
2009, 2009 p. 2789). Any amount over and above that required the capital
at the beginning of the period is profit (International financial reporting
standards as issued at 1 January 2009, 2009 p. 2789).
2.4.1 Profitability and its relationship with R&D
A number of previous studies have been undertaken to discuss the issue of
the impact of the R&D on firm`s profitability. The relationship between the
firm`s profit and its R&D expenses can be presented in at least three
possible ways (Branch, 1974, p.1000). First, the company`s profits may
influence subsequent R&D (Branch, 1974, p.1000). Second, R&D may
influence subsequent profits and as third, R&D and profits can be
influenced at the same time by some third factor (Branch, p.1000). A large
number of empirical studies conducted worldwide have made an attempt
to analyse the impact of R&D expenses on firm`s profitability. These
studies differ from one another in different perspectives. In terms of the
period in which the relationship is analysed, the studies are conducted in a
time frame ranging from one year (Jefferson, Huamao, Xiaojing and
Xiaoyun, 2006) up to thirty-five years (Coad and Rao, 2008). In terms of
sample size, the studies vary from samples as low as 20 firms (Chiou and
Lee, 2011) up to a sample size of 15512 firms (Cozza, Malerba, Mancusi,
Perani, and Vezzulli, 2012). With regards to the industry scope, roughly half
of the studies are taking cross industry approach, while the rest focus on

23
manufacture and the high technology industry. In Table 3 below, I present
a comprehensive view of these studies.
Table 3
No. Author TimeSample
SizeCountry Industry
R&D and
profitability Relationship
1 Branch (1974) 1950-1965 111 USA Cross Industry Positive Linear
2Chiou and Lee
(2011)2004-2009 20 Taiwan Biotechnology
Positive /
Negative Non-Linear
3Coad and Rao
(2006)1963-1998 2113 USA Cross Industry
Positive for high
tech industryLinear
4
Cozza,
Malerba,
Mancusi,
Perani and
Vezzuli (2012)
1998-2003 15512 Italy Manufacturing Positive Linear
5Del Monte and
Papagni (2002)1992-1997 496 Italy Cross Industry Not significant Linear
6
Geroski,
Machin and
Van Reenen
(1993)
1972-1983 721 UK Cross Industry Positive Linear
7
Grabowski,
Vernon and
Dimasi (2002)
1990-1994 118 USA Pharmaceutical Positive Linear
8Hall and Bagchi-
Sen (2002)1997-1998 400 Canada Biotechnology Positive Linear
9
Jefferson,
Huanmao,
Xiaojing and
Xiaoyun
(2006)
1997-1999 5451 China Cross Industry Positive Linear
10
Mank and
Nystrom
(2001)
1993-1997 718 USA Technology Negative Linear

24
Table 3. Summary of previous research. Table completed by author
As presented in Table 3, the previous research is mostly dominated by USA
and the cross industry analysis, however the scope of the research
conducted spreads between different countries and industry sectors.
Among the first studies on this topic conducted by Branch (1974, p.1000),
provides evidence for the simultaneous and recursive relationship between
R&D and profitability. With a sample size of 111 companies, across time
frame of 15 years, using a pooled time-series and cross-section data, Branch
(1974, p.1008) finds that R&D has positive impact on profitability. This
study is conducted using distributed lag technique for R&D, when it
measures its impact on profitability (Branch, p.1004) and lagged
profitability when it measures the impact of profitability on R&D (Branch,
pp.1007-1008). The study of Chiou and Lee (2011, p.16), goes one step
further providing evidence for threshold value of R&D in order to
investigate how does the level of R&D impacts firm`s profitability among
the biotech companies in Taiwan. Using a panel smooth transition
regression with data envelopment analysis, the authors measures the
impact of R&D on firm`s net sales as a proxy for profitability (Chiou et al.,
p.1). The authors find that the R&D expenses below USD 191,815 have
positive impact on firm`s profitability, due to reduction of operating costs
(Chiou et al., p.6). The relationship identified in this study, between R&D
expenses and profitability is non-linear (Chiou et al., p.1). The authors find
that an increase of R&D expenses up to a certain level will positively
11Morbey and
Reitner (1990)1976-1985 727 USA Cross Industry
No direct
relationship/
12Yang, Chiao
and Kuo (2010)
2000-
2001/
2000-
2007
564/377 Taiwan Cross Industry
Negative-
Positive
Negative
Non-Linear
13
Nunes and
Serrasqueiro
(2014)
2002-2009 187 PortugalKnowledge-
intensive Industry Positive Linear

25
influence profitability, however every additional investment above might
result in diminishing returns (Chiou et al., p.6). Further, according to Coad
and Rao, (2008, p.646), the innovation can have different impact on the
firm`s growth. Using a quantile regression in a sample of more than 2000
companies in the high-tech sector (Coad et al., p.633), the authors try to
estimate the relationship between the number of patents and R&D
expenditure as a proxy for level of innovation and firms`s sales as a proxy
for firm`s growth (Coad et al., p.637). According to Coad et al (p.645), for
average firm, innovation activities have very little impact in terms of sales
growth, but fast-growth firms, owe a lot of their success to innovation. This
study finds that innovation is of crucial importance for a handful of
“superstar” fast-growth firms (Coad et al., p.633)
Among the studies that specifically target the biotech industry is the one by
Hall and Bagchi-Sen (2002). Hall et al. (2002, p.238) measure the impact
of innovation on total revenues growth, growth in sales, growth in exports
and pretax profit growth among biotech firms in Canada. The data for the
research are collected using a questionnaire (Hall et al., p.233). and chi-
square test for measuring the relationship (Hall et al., p.238). The authors
find a positive association between firms`s new product introduction, total
revenue growth, sales growth and growth in exports (Hall et al., p.238).
However, the study shows very little association between patent-related
innovation and firm performance (Hall et al., p.238). These findings oppose
the findings of Coad and Rao (2008).
It is important to note that the use of patents and R&D expenses has certain
drawbacks, among which are that small firms who innovate but still are
unable to apply for patents or engage in risky R&D projects could be
dismissed as innovative even though they use innovation in their course of
work (Cozza et al., 2012, p.1968). In order to mitigate this shortage, (Cozza
et al., p.1968) investigate the impact of innovation on firm`s profitability
and growth, taking different approach using survey in which companies
declare whether they innovate or not, as a proxy for innovation.
In addition, they use operating profit ratio (Cozza et al., p.1967), return on
total assets as a proxy for firm`s profitability and a survey in which
companies declare whether they innovate or not, as a proxy for innovation

26
(Cozza et al., p.1968). Their findings go in line with the previous studies,
stating that more innovative firms exercise higher level of both profit and
growth on short run (Cozza et al., p.1963). The study also finds that the
innovative premium is particularly high for small and new established
companies (Cozza et al., p.1963). Del Monte and Papagni (2002) take a
similar approach like Coad et al., and Cozza et al. On a sample of nearly five
hundred Italian companies the authors use R&D expenses as a proxy for
firm`s innovation (Del Monte et al., 2002, p.1010), and return on sales as
a proxy for profitability (Del Monte et al., p.1008). Using a regression
model, the authors find that the relationship between R&D expenses and
return on sales is not significant (Del Monte et al., p.1008), hence they
conclude that innovation does not provide financial benefits to the firms
which engage in more R&D, because the innovative firms will be followed
by many imitators (Del Monte et al. p.1012). The findings of Geroski,
Machin and Van Reenen (1993, p.208), go in line with the previous findings
about a positive relationship between the R&D and firm`s financial
performance. The authors use a lagged variable to measure return on
revenue as a proxy for firm`s profit margin (Geroski et al., 1993, p.202) and
number of technologically and commercially significant innovations
(Geroski et al., p.200). Unlike previous authors, Geroski et al., (p.200)
allow for the innovations to have an effect on profitability for up to six years
after their introduction on the market. The results of this study give
evidence that the number of innovations have a positive but modest effect
on firm`s profit margins (Geroski et al., p.208). The authors further argue
that this could be due to the fact the innovations, are innovation for the firm
itself but are not originally introduced to the market (Geroski et al., p.208).
Mank and Nystrom (2001, p.3) identify the relationship between R&D and
shareholders return to be negative for a dataset of companies from
computer industry. In a regression analysis, using a compound annual
return to shareholder as a proxy for the shareholder return and a ratio of
R&D spending and net sales as a proxy for R&D intensity, the authors
report a negative relationship between shareholders return and R&D
intensity (Mank et al., 2001, p.6). Based on this, Mank et al., (p.6) conclude
that the computer industry is overspending on R&D.

27
Morbey and Reitner (1998, p.14), find the relationship between the R&D
intensity and firm`s profits to be rather complex and suggest that it should
not be examined exclusively. Instead, they suggest that additional factors
should be included Morbey et al., (1998, p.14). They find that a company
might benefit from increased level of R&D only if its productivity level is
high (Morbey et al., p.14). Further, according to their study, there is no
direct relationship between R&D intensity and firm`s financial
performance (Morbey et al., 1998, p.13).
In addition to authors who find only linear positive and negative
relationship among R&D expenditure and firms profitability, certain
studies find that the relationship is both positive and negative i.e. non-
linear, depending on the level of R&D expenses. Yang, Chiao and Kuo
(2010) try to bridge the gap in the commonly used linear modeling
methods, in order to capture the full dynamics of the R&D intensity and its
impact of the firm`s performance. Using a three-stage S-curve model, Yang
et al. (2010) find that the relationship between R&D intensity and firm`s
profitability is negative at low levels of R&D, due to low marginal
productivity and positive at medium levels of R&D investments (Yang et
al.). Finally once the certain threshold has been exceeded, the relationship
between R&D investment and profitability becomes negative again (Yang
et al.). Yang et al., conclude that once the optimal level of R&D is reached,
further expenditure on R&D is harmful for the company. This study uses a
sample of 377 publicly listed Taiwanese high-tech firms and 179 low-tech
firms (Yang et al.). The findings of this study are only relevant for the high-
tech industry, while for the low-tech industry the results are mixed and
insignificant (Yang et al.). The study of Nunes and Serrasqueiro (2014), is
the only one from the sample presented in the literature review of this
research that targets specifically the knowledge intensive industries in a
European country. Nunes et al. (2014, p.52) adopt dynamic panel
estimators in order to investigate the impact on R&D expenditure on firm’s
profitability, among other variables. The study is conducted on a sample of
187 companies from knowledge-intensive industries in Portugal (Nunes et
al., p.52). According to Nunes et al., (p.52), measuring the relationship with
dynamic estimator adds to more correct determination of the persistence

28
of the independent variables, and hence has an advantage over traditional
panel models. This study confirms the previous findings of a positive
relationship between R&D expenses and profitability (Nunes et al., p.55)
3. Methodology
In this chapter I describe the methodology used to investigate the relationship
between the firm`s profitability and R&D expenses. First I present the
research design followed by declaration of the variables. Second, I provide
description of the econometric model used and the data selection strategy and
data presentation.
3.1 Research Design and Method
This research is conducted using positivism research philosophy as uses
existing academic literature to support the academic relevance of the
research (Saunders, Lewis and Thornhill, 2012, p. 134) as well as
quantitative methods to conduct further analysis (Saunders, Lewis and
Thornhill, 2012, p.160) This research is exploratory (Saunders et al., p.
171-172). and uses deductive approach as it tries to explain the causal
relationship between firm`s profitability and R&D expenses (Saunders et
al., 2012, p. 145). In addition, the data set will contain sufficient number of
data to derive a generalised conclusion (Saunders et al., p. 146). In terms of
characteristics, this research mono method-quantitative as it uses single
technique for data collection and data is quoted numerically (Saunders et
al., pp.162-164). The data used for this research are secondary data, and are
acquired from Orbis (Bureau Van Dijk) database. Further, this research is
quantitative and the relationship between the variables will be tested using
multiple linear regression analysis (Saunders et al., p.162). In terms of time
horizon, this research is longitudinal as it measures the relationship
between the variables in a time frame of 10 years (Saunders et al., pp.190-
191)

29
3.2 Declaration of variables
For the purpose of analysing the relationship between R&D expenses and
firm`s profitability, I define the variables included in the econometric model.
In this chapter I present the dependent, the independent and the control
variables that will be included in the model.
3.2.1 Dependent Variable.
For measurement of firm`s profitability as a proxy I use the ratio between
EBIT, and total assets (Pattitoni, Petracci and Spisni, 2014, p. 6). As stated
the formula for this variable is defined as:
PROF i,t= EBIT i,t/ Total Assets i,t
3.2.2 Independent Variable
For measurement of R&D expenses as a proxy I use the expenditure in R&D
in the current year, measured as ratio between R&D expenses and total assets
in the current year (Nunes, Serrasqueiro, 2014, p.53) denoted as R&D EXP 𝑖, 𝑡.
Despite the fact that literature suggest that R&D expenses do not capture all
companies who innovate (Cozza et al., p.1968), being limited to use a
secondary data from the Orbis platform does not allow to use other measures
of R&D.
The formula for the R&D expenses is as follows:
R&D EXP i,t= R&D expenses i,t / Total Assets i,t
3.2.3 Controlling Variables
Firm`s profitability can be built upon different micro and macro level factors
(Pattitoni, Petracci and Spisni, 2014, p.2). Considering their findings, which
are explained in chapter two, I will control the analysis for the following
variables:

30
Outsourcing
According to previous academic findings (Calantone and Stanko, 2007;
Belderbos, Carree and Lokshin, 2004; Görg, Hanley and Strobl, 2008;
Laursen and Salter, 2006) which document existing relationship between
firm`s profitability and the outsourcing, I measure the outsourcing of the R&D
phase as a binary independent variable denotes as “1” if the company engages
in R&D outsourcing and “0” if it doesn`t engage (Ohnemus, 2007, p.9).The
independent dummy variable for outsourcing is denoted as OUTSOURCE.
Firm` s Size
Number of previous academic findings have elaborated the connection
between firm size and profitability (Nunes and Serrasqueiro, 2014;
Majumdar, 1997; Samuels and Smyth, 1968; Goddard, Mcmillan and Wilson,
2006; Lee, 2009).In order to control for the effect of firm`s size, I use the
following equation:
SIZE i,t=log Sales i,t (Nunes, Serrasqueiro, 2014, p.53)
Firm`s Age
As an existing connection between profitability and firm`s age is previously
elaborated, (Loderer and Waechli, 2009; Majumdar 1997), I control for the
effect of firm`s age using the following formula:
AGE i,t= log of number of years of firm`s existence (Nunes, Serrasqueiro,
2014, p.53);
Firm`s liquidity
In order to control for the effect of firm`s liquidity, previously found in the
academic research (Baños-Caballero, García-Teruel and Martínez-Solano,
2012; Lazaridis and Tryfonidis, 2006; Deloof 2003), I use the following
formula:

31
LIQ i,t = Total Current Assets i,t / Total Current Liabilities i,t
(Nunes, Serrasqueiro, 2014, p.53);
Long Term Debt
For controlling the effect of long term debt on firm`s profitability, previously
elaborated in academic literature (Murphy, 1968; Fama and French, 1998;
Abor, 2005), I use the following formula as a proxy:
LLEV i,t=Long-term debt i,t / Total Assets i,t (Nunes, Serrasqueiro, 2014,
p.53).
Country of origin
Due to the fact that the sample of data included in this research derives from
different countries and because the previous academic findings elaborate for
a possible relationship between country of origin and firm`s financial
performance (Serrano, Mar Molinero and Gallizo Larraz, 2005; Makino, Isobe
and Chan 2004), I control for the firm`s country of origin using independent
categorical dummy variable (Makino, Isobe and Chan 2004) for five countries
included in the research (France, Germany, Sweden, Switzerland and UK),
each categorical variable representing each respective country.
Number of studies also argue that the internationalization has an impact on
firm`s financial performance performance (Lu, Beamish and Paul 2006),
however due to the fact that the size of the firm is correlated with firm`s export
and internationalization especially in the high technology sector (Giovannetti,
Ricchiuti and Velucchi, 2011), I exclude this variable because it might correlate
with firm`s size.
3.3 Model Description
This research is build relying on the model of Nunes and Serrasqueiro (2014).
Based on the selected academic findings presented in literature review
section, the study of Nunes at el., (2014) is among the few targeting the
impact of R&D on firm`s profitability in a knowledge intensive industry, and

32
the only one presented in the literature review in this reasearch that
specifically targets the European knowledge intensive sector, in this
particular case, the Portuguese knowledge intensive industry. The
relationship between firm`s profitability and R&D expenses is examined
using multiple linear regression. The general terms of the model of multiple
linear regression can be presented as follows:
The general terms the theoretical model of multiple linear regression can be
described as follows:
(Wooldridge, 2014, p.71);
where,
-𝛽0 is the intercept (Wooldridge, 2014, p.71);
- 𝛽 1 is the coefficient associated with 𝑥1 (Wooldridge, 2014, p.71);
- 𝛽 2 is the coefficient associated with 𝑥2 (Wooldridge, p.71);
- 𝛽 3 is the coefficient associated with 𝑥3 (Wooldridge, p.71);
- 𝛽 k is the coefficient associated with 𝑥k (Wooldridge, p.71);
- u is associated with error term (Wooldridge, p.71).
According to Wooldridge (2014, pp.71-72), the ordinary least square (OLS)
equation of the multiple linear regression model can be summarized as
follows:
where
(Wooldridge, 2014, pp.71-72).

33
Using the variables previously stated, the multiple regression model
transforms into the following equation:
𝑷𝑹𝑶𝑭 𝜾, 𝒕 = 𝛃𝟎 𝑹&𝑫 𝑬𝑿𝑷 𝟎 𝑶𝑼𝑻𝑺𝑶𝑼𝑹𝑪𝑬 𝛃𝟏 𝑺𝑰𝒁𝑬𝜾, 𝝉 𝛃𝟐 𝑨𝑮𝑬, 𝛃𝟑 𝑳𝑰𝑸,
𝛃𝟒 𝑳𝑳𝑬𝑽, 𝟏𝑪𝑶𝑼𝑵𝑻𝑹𝒀
where,
PROF i,t= ratio between EBIT i,t and firm`s Total Assets i,t;
R&D EXP i,t= ratio between R&D expenses i,t and firm`s Total Assets i,t;
OUTSOURCE= coded as “1” if the firm engages in outsourcing of R&D and “0”
if it doesn`t outsource R&D;
SIZE i,t=logarithm of sales i,t;
AGE i,t= log of number of years of firm`s existence;
LIQ i,t = ratio between Total Current Assets i,t and Total Current Liabilities
i,t;
LLEV i,t=ration between Long-term debt i,t and Total Assets i,t;
COUNTRY= coded as “1” if country is France, if other country “0”;
coded as “1” if country is Germany, if other country “0”;
coded as “1” if country is Sweden, if other country “0”;
coded as “1” if country is Switzerland, if other country “0”;
coded as “1” if country is UK, if other country “0”;
The multiple linear regression is conducted using IBM SPSS statistics
software. The results of the regression as well as the process are described in
the next chapter. Th regression analysis is conducted for period of year 2006-
2015, as Orbis (Bureau van Dijk) database contains information starting from

34
year 2006 onwards and the last financial data available as of April 2016 are
from year 2015.
3.4 Sample selection
For using sample selection I use the criteria from NACE Rev.2, under which
a firm can be reported to be in the industrial sector of biotechnology.
According to NACE Rev.2, the criteria is corresponding to code 7211
(Research and experimental development on biotechnology). Regarding
the geographical scope of the research, this research will be conducted
using financial data from biotech companies from five selected countries in
Continental Europe including the UK. I select the countries to be included,
based on their size of product development pipelines, relying on a report by
Ernst and Young (Beyond Borders. Biotechnology Industry Report, 2013
p.77) ranked in descending number as follows:
1. United Kingdom
2. Switzerland
3. Germany
4. France
5. Sweden
The data set will contain companies with both active and passive status
from year 2006 onwards. The preliminary review of search based on this
criteria provided by Orbis contains a sample of 8299 companies. The final
sample used in the regression analysis decreases to 30 companies, due to
the fact that many companies have not enclosed the financial data
necessary required for this regression analysis. Each sample is observed for
a period of year 2006-2015, resulting in total number of 300 preliminary
observations. This number is in Table 4, I present a list of the preliminary
number of companies used listed by country. As can be seen in Table 4, the
final sample of companies is dominated by UK, followed by Sweden.

35
Table 4
Table 4. List of number of companies in the biotech industry under
predetermined variables1.
3.5 Data presentation
After the data collection process from Orbis (Bureau Van Dijk), I further
structure them using Excel, to derive the required final figures and ratios
presented in Part 3.2.3. The final number of observations is further reduced
to 176 observations due to lots of cases of missing value.The data in the Excel
sheet are provided for each consecutive year. The data are further winsorised
in order to remove the effect of any possible outliers, removing 1% of the
highest and lowest values and replacing them with the value of 277th and 4th
observation respectively. After plugging in the data in IBM SPSS software I
assign the PROFi,t, variable a role of Target and all the other variables a role
of input. Further, I recode the categorical dummy variables as
FranceDummy, GermanyDummy, SwedenDummy, SwitzerlandDummy
and UKDummy. The final data set does not provide information for the
variables OUTSOURCING, as data for this variable were not available on the
Orbis (Bureau Van Dijk) data platform. The missing values are excluded
listwise, further reducing the number of final observations to 176. This
results in complete exclusion of the data for the company from Switzerland
as all observations had a missing value. Finally, as UK has the highest
number of observations in this sample, it is considered to be a reference
1 Data obtained using Segmentation Analysis in Orbis (Bureau Van Dijk)
Country Number of firms
France 4
Germany 2
Sweden 11
Switzerland 1
UK 12
Total number 30

36
country (Field, 2013, p.420). Hence, the results of all dummy variables are a
comparison in relation to UK dummy variable.
4. Data analysis
This section provides information obtained from the data analysis in IBM
SPSS. First, I present the descriptive statistics, followed by interpretation of
the results obtained from the regression analysis along with interpretation of
the assumptions. Second I describe the main limitations of this research and
finally I provide a discussion of the results and recommendation.
4.1 Descriptive statistics
Table 5 below, provides general information for the data analyzed in this
research. According to Table 5, the final number of observation is 176 for all
the variables as I use listwise deletion, meaning that if one or more data is
missing the observation is excluded from further analysis (Field, 2013, p.187)
As Table 5 presents, the variable LIQi,t, has the highest mean value and
highest standard deviation of all other variables. The final number of
observations N is equal to 176 for all variables as the missing values are
excluded using listwise deletion.
Table 5
Table 5. Descriptive statistics

37
4.2 Assumptions of multiple linear regression
This section represents the main assumptions of a linear regression analysis
and the violations of the regression model. (Wooldridge, 2014, p.157).
4.2.1 Assumption of linearity
The Matrix Scatterplot presented in Figure B.1 (Appendix B), shows a weak
positive and non-linear relationship between the dependent variable PROFi,t
and the independent variable RDEXPi,t. For all the other variables, their
relationship with PROFi,t is relatively linear. The relationship is positive for
all the variables except for AGEi,t and LLEVi,t. As a summary of the above
said, the model breaches the assumption of linearity for one variable.
4.2.2 Assumption of Multicollinearity
The Pearson Correlation test shows that there is no substantial correlation
between the independent variables i.e. there are no correlations larger than
0.9, meaning that the assumption of not having multicollinearity among the
independent variables is fulfilled. Further, all of the VIF values of the
independent variables are below 10 with a tolerance level above 0.2 for all the
independent variables. Hence, I state that there is no need for concern of
multicollinearity. The figures are presented in Table B.1
4.2.3 Assumption of independence of errors
The Model Summary presented in Table B.2 (Appendix B), shows a Durbin-
Watson value of 2.191, which falls in the boundaries between one and three,
meaning that there is an independence of errors, hence the assumption of
independence of errors is being met (Field, 2013, p.337)
4.2.4 Assumption of Homoscedasticity and linearity of
errors
The Scatterplot presented in Figure B.2 (Appendix B), presents a graphical
overview of the standardized residuals against standardized predicted values
as a measure for heteroscedasticity. According to the Scatterplot, the data
funnel out which is a sign of heteroscedasticity, showing an increasing
variance across the residuals (Field, 2013, p.193). Hence, the model breaches

38
the assumption of homoscedasticity and could be an indication of possible
systematic relationship between the errors in the results (Field, 2013, p.192).
4.2.5 Assumption of normally distributed errors
The histogram presented in Figure B.3 (Appendix B), shows a normal
distribution of residuals, with a slight level of leptokurtosis. Further, the line
in the P-P Plot, presented in Figure B.4 (Appendix B), indicates slight
deviation from the diagonal line. However, I discard the possibility of violation
of the assumption of normality, relying on the Central Limit Theorem and
hence I consider the residuals to be normally distributed.
4.2.6 Unusual cases
The scatterplot of residuals presented in Figure B.2 provides evidence for
certain outliers. However, because the Cook`s distance presented in Table B.3
equals .177 and is below the upper limit of one, there is no need to remove the
existing outliers since none of them influences the model (Field, 2013, p.348).
4.3 Analysis of results
Table 6
Table 6.Model Summary
The Model Summary presented in Table 6, provides the following
information:
R 2 =.471, adj. R2=.446, F=18.590, p=.000. Based on Table 6, 47.1% of the
variability in PROFi,t, is explained by the independent variables in the model
(Field, 2013, p.336). Consequently, this can be interpreted that the model is a
moderate predictor of the variability in the dependent variable. The adjusted
R-square of .446, shows that if the model was derived from a population

39
instead of a sample it would account for approximately 2.5 % less variation in
the outcome (Field, 2013, p.336).
Based on the information provided in Table 7 ANOVA, the model is a
significant fit of the data overall (Field, 2013, p.338). According to Table 7, the
model predicted PROFi,t, F (8,167) =18.590, p = 0.000.
Table 7
Table 7. ANOVA
Table 8
B Beta t Sig. (Constant) -.587 -6.995 .000 RDEXP i,t .115 .067 1.124 .263 SIZE i,t .140 .644 9.677 .000 AGE i,t -.098 -.148 -2.500 .013 LIQ i,t .004 .063 1.031 .304 LLEV i,t -.425 -.256 -4.361 .000 FranceDummy -.056 -.069 -1.087 .279 GermanyDummy .170 .187 3.050 .003 SwedenDummy .098 .143 2.203 .029
Table 8. Regression Results
Following the results in Table 8 above, the regression equation for the model
is the following:

40
PROFi,t=-0.587 + (0.115 RDEXPi,t) + (0.140SIZEi,t) + (- 0.098 AGEi,t)+
(0.04 LIQi,t) + (-0.425 LLEVi,t) + (- 0.56 FranceDummy) + (0.170
GermanyDummy) + (.143 SwedenDummy).
The significance of the t-statistics shows that the independent variables
SIZEi,t and LLEVi,t (p=.000) are statistically significant. The same applies for
GermanyDummy variable, also found to be statistically significant (p=.003).
The variables AGEi,t (p=.013) and LIQi,t ( p=.304) are found to be statistically
insignificant. The country dummy variables FranceDummy (p=.279) and
SwedenDummy (p=.029) also show to be non-significant predictors
according to the t-statistic. Finally, the variable RDEXPi,t is found to have a
positive association with firm`s profitability (B=0.115). However, this
association is statistically non-significant (p=.263). This means that there is
not enough evidence that R&D EXPi,t, have a positive effect on PROFi,t. Based
on these results, I fail to reject the null hypothesis in this research. Even
though in the original model I have included the variable SwitzerlandDummy,
it is excluded from the results due to the fact that I use listwise deletion for
handling the missing values in the data, and all companies in the sample
originating from Switzerland had one or more missing values. Reviewing the
other controlling variables I can state the following:
SIZEi,t, has a positive and significant effect on firm`s profitability,
meaning that larger companies tend to have higher profitability. The
effect of this variable on firm`s profitability is statistically significant.
This findings go in line with the the findings of Nunes and Serrasqueiro
(2014) and Majumdar (1997) and oppose the findings of Samuel and
Smyth (1968).
AGEi,t, has small negative effect on firm`s profitability, meaning that
older companies, have lower level of profitability. The effect however,
is statistically not significant. This means that there is not enough
evidence that AGEi,t, has negative effect on firm`s profitability. The
findings of a negative relationship go in line with the findings of
Majumdar (1997) and Loderer and Waechli (2009) and oppose the
findings of Nunes and Serrasqueiro (2014);

41
LIQi,t, has positive effect on firm`s profitability, meaning that firms
with higher level of liquidity are able to exercise higher level of profit.
The effect of these variable is statistically not significant. This means
that there is not enough evidence that LIQi,t, has positive effect on
firm`s profitability. The findings of a positive relationship go in line
with the findings of Nunes and Serrasqueiro (2014), Deloof (2003) and
Lazaridis and Tryfonidis (2006);
LLEVi,t, has a negative effect on firm`s profitability, which could be
interpreted as companies that have a higher level of long-term
leverage, exhibit lower level of profitability. The effect of this variable
on firm`s profitability is statistically significant. This results opposes
the findings of Nunes and Serrasqueiro (2014) and Fama and French
(1998) and oppose the findings Murphy (1968);
The country dummy variable France, shows a small negative effect on
firm`s profitability, meaning that biotech companies from France
might have a smaller level of profitability in comparison to the UK, as
the UK is considered to be the reference dummy variable. The effect of
this variable is statistically not significant;
The country dummy variable for Germany shows a small positive effect
on firm`s profitability, meaning that biotech companies located in
Germany might exercise a higher level of profitability in comparison to
the UK. The effect of this variable on firm`s profitability is statistically
significant.
The country dummy variable for Sweden, shows a very small positive
effect on firm`s profitability, meaning that biotech companies located
Sweden might show a higher level of profitability in comparison to the
UK. However, the effect of this variable on firm`s profitability is
statistically not significant.

42
4.4 Limitations
The results of this research should be interpreted taken into consideration
certain limitations.
First, the NACE Rev.2 industry classification takes into account only
companies whose main activity is in the field of biotech. This means that many
big companies that have primary field reported in another industry such as
pharma research, energy production etc., but also engage in R&D in the field
of biotech are excluded from the study, which could lead to possible bias;
Second, even though as presented in Section 3, outsourcing might have an
impact on firm`s profitability, this information for the respective companies
were not publicly available on the Orbis (Bureau Van Dijk) database, in the
period of conduction of this research;
Third, there are many cases of missing values for some variables, especially
for the R&D expenses. Due to the fact that I use listwise deletion i.e, I exclude
the observation which has a missing value, the final set of observation is
limited to 176 companies, nearly 40% less than the original number of
observations.
Fourth, some variables of the model have breached the assumption of
linearity, which could mean that linear regression is not the most appropriate
way to analyze the relationship between the respective variables, and engaging
in non-linear regression or another type of statistical analysis, might provide
more accurate results;
Fifth, the time horizon of this study evaluates data for a period of 10 years and
might not be appropriate due to the fact that an average cycle of fully
completed R&D process in the biotech industry takes over 12 years (Keegan,
p.41).
Seventh, as reported in previous academic findings, there are many other
factors that might also have an impact on firm`s profitability, but are not
included in this research among which are: innovators position, market
awareness, niche operations, internationalization (Qian and Li, 2003), market
orientation (Appiah-adu and Ranchold, 1998), firm`s growth, opportunity
cost of capital, shareholders commitment level (Pattitoni, Petracci and Spisni,
2015), financial risk (Golec and Vernon, 2007), firm`s market share, gearing

43
ratio (Goddard, Tavakoli and Wilson, 2005), union density, import
penetration, industry concentration, real wage inflation (McDonald, 1999)
and organizational factors (Hansen and Wernerfelt, 1989). These factors
might also have an impact on profitability, and hence, their exclusion might
limit the relevance of the model.
4.5 Discussion and recommendations
Based on the results of this research, R&D expenses have a positive but not
significant effect on firm`s profitability. This results concludes that there is
not enough evidence to accept the positive impact of R&D expenses on firm`s
profitability. These results mostly correlate with the findings of Del Monte and
Papagni (2002), as the authors find the relationship between R&D and firm`s
profit also to be not significant. Further, the results oppose the rest of the
academic findings presented in the literature review section who find direct
positive or negative association between the two variables. Taken into
consideration the results of my research, the answer to the research question
is as follows: “Higher level of R&D investment does not provide a statistically
significant relationship with the higher level of profitability”.
According to Table 6, the model modestly predicted the dependent variable
PROF i,t, meaning that a large part of the variation in the model remains
unexplained. This can be a hint for future research where including additional
variables could better predict the dependent variable.
Further, as stated by Morbey and Reitner (1990, p.14), the relationship
between R&D and firm´s profitability can be established, provided that the
productivity in the company is on a high level, meaning that R&D can
influence firm`s profitability under certain conditions. This can be another
potential source for future research, where productivity can be incorporated
in the model. Various authors argue that R&D expenses are not always good
proxy form firm`s innovation activities as a number of companies who engage
in significant improvements of their products but are unable to engage in
high-risk R&D projects, and hence are excluded from the sample (Cozza et al.,
2012, p.1968). As a recommendation for future research, this could mean that
R&D can be measured using two or more proxies or stating the R&D variable

44
as a dummy variable, whether the firm invests in R&D or not. This could also
imply using different technique for data collection such as survey etc., or a
combination of qualitative and quantitative analysis.
As stated by Coad and Rao (2008, p.642), the OLS estimates do not tell the
whole story, meaning that a more dynamic estimator could better predict the
relationship between R&D and firm`s profitability. Further according to
Nunes and Serrasqueiro (2014, p.52), using dynamic estimators over OLS
regressions can have multiple advantages for better effectivenes and control
of the model.
Further, according to Del Monte and Papagni (2003, p.1011) using a lagged
R&D variable is a better way of association with the proxies for firms
performance and sales growth in the particular case, as the relationship with
current year R&D and firm performance is difficult to be justified. In addition
according to Yang, Chiao and Kuo (2010, p.105), the lagged time suggests that
R&D expenses first accrue to a firm and their contribution to performance will
gradually be seen in future. Hence, I recommend using lagged variable for
R&D expenses as a better proxy, for future research.

45
5. Conclusion
The purpose of this research is to provide an evidence of the impact of R&D
expenses on firm`s profitability in the European biotech industry. In this
respect the aim of this study is to contribute to the existing debate about the
connection between R&D expenses and firm`s profitability. I hypothesize that
R&D expenses have positive impact on firm`s profitability, based on the
majority of previous academic findings. In order to investigate the
relationship, I use multiple linear regression to measure the impact of R&D
expenses on firm`s profitability, at the same time controlling for outsourcing,
firm`s size, age, liquidity, long-term leverage and country of origin. The final
dataset of companies included in this research is 30, with total number of 176
final observations. The timeframe of data analysed is from year 2006 till year
2015.
The results of this research show that there is not enough evidence that R&D
expenses contribute to higher level of profitability. This finding is contrary
previously stated findings in a number of studies. This conclusion should be
taken into consideration having in mind the limitations of the study. In order
to better explain the relationship between the R&D and firms profitability,
future studies should incorporate both qualitative and quantitative techniques
and a use of dynamic estimators, as well as additional measures for R&D in
companies.

46
6. References
Abor, Joshua (2005): The effect of capital structure on profitability. An empirical
analysis of listed firms in Ghana. In The Journal of Risk Finance 6 (5), pp. 438–445.
DOI: 10.1108/15265940510633505.
Alexander, D., Britton, A., Jorissen, A. (2007). International financial reporting and
analysis. London: Thomson Learning.
Antonelli, Cristiano (1998): Localized technological change, new information
technology and the knowledge-based economy. The European evidence. In Journal of
Evolutionary Economics 8 (2), pp. 177–198. DOI: 10.1007/s001910050061.
Appiah-adu, K., Ranchhod, A. (1998). Market orientation and performance in the
biotechnology industry. An exploratory empirical analysis. In Technology Analysis
& Strategic Management 10 (2), pp. 197–210. DOI: 10.1080/09537329808524311.
Ballester, Marta; Garcia-Ayuso, Manuel; Livnat, Joshua (2003): The economic value
of the R&D intangible asset. In European Accounting Review 12 (4), pp. 605–633.
DOI: 10.1080/09638180310001628437.
Baños-Caballero, Sonia; García-Teruel, Pedro J.; Martínez-Solano, Pedro (2012):
How does working capital management affect the profitability of Spanish SMEs? In
Small Bus Econ 39 (2), pp. 517–529. DOI: 10.1007/s11187-011-9317-8.
Belderbos, R., Carree, M., Lokshin, B., (2004): Cooperative R&D and firm
performance. In Research Policy 33 (10), pp. 1477-1492.
DOI:10.1016/j.respol.2004.07.003.
Branch, Ben (1974): Research and Development Activity and Profitability. A
Distributed Lag Analysis. In J POLIT ECON 82 (5), p. 999. DOI: 10.1086/260252.
Burrone, E. (2006). Patents at the Core: the Biotech Business.
Retrieved 15 April 2016, from
http://www.wipo.int/sme/en/documents/patents_biotech_fulltext.html
Calantone, R., J., Stanko, M., A., (2007): Drivers of Outsourced Innovation. An
Exploratory Study. In J Product Innovation Man 24 (3), pp. 230–241. DOI:
10.1111/j.1540-5885.2007.00247.x.
Cheng, J., Lee, M. (2015). Samsung’s Bet on Biotechnology Is Test for Heir
Apparent. The Wall Street Journal. Retrieved May 1, 2016, from
http://www.wsj.com/articles/samsungs-bet-on-biotechnology-is-test-for-heir-
apparent-1450386875
Chiou, J. Lee, Y. (2011). Efficiency and Profitability on Biotech-Industry in Small
Economy. International Journal of Business and Commerce, 1(2), pp. 1-24. Retrieved
October 15, 2015, from http://www.ijbcnet.com/1-2/IJBC-11-1201.pdf

47
Clark, D.P., Pazdernik, N. J.(2016): Biotechnology. Second edition. London: Elsevier
Inc.
Coad, A., Rao, R. (2008). Innovation and firm growth in high-tech sectors: A quantile
regression approach. Research Policy, 37(4), 633-648.
Retrieved October 15, 2015, from
http://www.sciencedirect.com/science/article/pii/S0048733308000152
Cozza, C., Malerba, F., Mancusi, M. L., Perani, G., & Vezzulli, A. (2012). Innovation,
profitability and growth in medium and high-tech manufacturing industries: Evidence
from Italy. Applied Economics, 44(15), 1963-1976.
DOI:10.1080/00036846.2011.556594
Crow, D., Bullock, N. (2016). First IPOs of 2016 build confidence in biotech. The
Financial Times. Retrieved May 1, 2016, from
http://www.ft.com/cms/s/0/470568de-ca97-11e5-be0b-
b7ece4e953a0.html#axzz4A3oWQhpw
Damodaran A., (2016). Historical Growth Rates by Sector.
Retrieved April 19, 2016 from
http://pages.stern.nyu.edu/~adamodar/New_Home_Page/datafile/histgr.html
Datamonitor. (2011).Biotechnology: Global Industry Guide.
Retrieved May 2, 2016 from http://www.pharmavision.co.uk/uploads/rp_97.pdf
Del Monte, Alfredo; Papagni, Erasmo (2003): R&D and the growth of firms.
Empirical analysis of a panel of Italian firms. In Research Policy 32 (6), pp. 1003–
1014. DOI: 10.1016/S0048-7333(02)00107-5.
Deloof, Marc (2003): Does Working Capital Management Affect Profitability of
Belgian Firms? In J Bus Fin & Acc 30 (3-4), pp. 573–588. DOI: 10.1111/1468-
5957.00008.
Ernst & Young (2011). Beyond borders. Global biotechnology report 2011. EYGM
Limited. Retrieved October 19, 2015, from:
http://www.biotechmd.org/wp-
content/uploads/2012/06/Beyond_borders_global_biotechnology_report_2011.pd
Ernst & Young (2012). Beyond borders. Global biotechnology report 2012. EYGM
Limited. Retrieved October 19, 2015, from:
http://www.ub.unibas.ch/digi/a125/sachdok/2012/BAU_1_6031975.pdf
Ernst & Young (2013). Beyond borders. Biotechnology Industry Report 2013. EYGM
Limited. Retrieved October 19, 2015, from:
http://www.ey.com/Publication/vwLUAssets/Beyond_borders/$FILE/Beyond_borde
rs.pdf

48
Ernst & Young. (2013). US GAAP versus IFRS. Ernst & Young LLP. Retrieved 17
May 2016, from
http://www.ey.com/Publication/vwLUAssets/EY-US-GAAP-vs-IFRS-the-basics-
2013/$FILE/EY-US-GAAP-vs-IFRS-the-basics-2013.pdf
Ernst & Young (2014). Beyond borders. Biotechnology Industry Report 2014. EYGM
Limited. Retrieved October 19, 2015, from:
http://www.ey.com/Publication/vwLUAssets/EY-beyond-borders-unlocking-
value/$FILE/EY-beyond-borders-unlocking-value.pdf
Ernst & Young (2015). Beyond borders. Biotechnology Industry Report 2015. EYGM
Limited. Retrieved October 19, 2015, from:
http://www.ey.com/Publication/vwLUAssets/EY-beyond-borders-2015/$FILE/EY-
beyond-borders-2015.pdf
Ernst and Young, EuropaBio (2014) Biotechnology in Europe. The tax, finance and
regulatory framework and global policy comparison. EYGM Limited. Retrieved
November 15, 2015, from http://www.ey.com/Publication/vwLUAssets/EY-
biotechnology-in-europe-cover/$FILE/EY-biotechnology-in-europe.pdf
European Commission, Joint Research Center. (2014). The 2014 EU Industrial R&D
Investment Scoreboard. Seville: Hernández H., Tübke A., Hervás F., Vezzani A.,
Dosso M., Amoroso S., Grassano N.
Retrieved April 15, 2016, from http://iri.jrc.ec.europa.eu/scoreboard14.html
European Commission. Ec.europa.eu. (n.d). Biotechnology. Retrieved 30 May 2016,
from http://ec.europa.eu/growth/sectors/biotechnology/index_en.htm
Fama, Eugene F.; French, Kenneth R. (1998): Taxes, Financing Decisions, and Firm
Value. In J Finance 53 (3), pp. 819–843. DOI: 10.1111/0022-1082.00036.
OECD (2002). Frascati Manual 2002. The Measurement of Scientific and
Technological Activities. Paris: OECD Publications. DOI:10.1787/9789264199040-
en
Field, A. (2013). Discovering Statistics using IBM SPSS Statistics. 4th rev. London:
Sage.
Financial Accounting Standards Board (1974). Statement of Financial Accounting
Standards No. 2. Accounting for Research and Development Costs. Connecticut:
Financial Accounting Standards Board.
Retrieved May 1, 2016 from
http://www.fasb.org/resources/ccurl/286/565/fas2.pdf
Financial Reporting Council (1989). Statement of standard accounting practice No.
13. Accounting for research and development. London: Financial Reporting Council.

49
Retrieved May 1, 2016 from http://frc.org.uk/Our-Work/Publications/ASB/SSAP-13-
Accounting-for-research-and-development-File.pdf
García‐Teruel, P. J., & Martínez‐Solano, P. (2007). Effects of working capital
management on SME profitability. In Int J of Managerial Finance International
Journal of Managerial Finance, 3(2), 164-177. DOI:10.1108/17439130710738718
Geroski, Paul; Machin, Steve; van Reenen, John (1993): The Profitability of
Innovating Firms. In The RAND Journal of Economics 24 (2), p. 198. DOI:
10.2307/2555757.
Giovannetti, Giorgia; Ricchiuti, Giorgio; Velucchi, Margherita (2011): Size,
innovation and internationalization. A survival analysis of Italian firms. In Applied
Economics 43 (12), pp. 1511–1520. DOI: 10.1080/00036840802600566.
Goddard, J.,Tavakoli, M., Wilson, J.O. S., (2005): Determinants of profitability in
European manufacturing and services. Evidence from a dynamic panel model. In
Applied Financial Economics 15 (18), pp. 1269–1282.
DOI: 10.1080/09603100500387139.
Goddard, J., Mcmillan, D., & Wilson, J. O. (2006). Do firm sizes and profit rates
converge? Evidence on Gibrat's Law and the persistence of profits in the long run. In
Applied Economics, 38(3), 267-278. DOI:10.1080/00036840500367955
Görg, H., Hanley, A., Strobl, E., (2008): Productivity effects of international
outsourcing. Evidence from plant-level data. In Canadian Journal of
Economics/Revue canadienne d'économique 41 (2), pp. 670–688. DOI:
10.1111/j.1540-5982.2008.00481.x.
Grabowski, Henry; Vernon, John; DiMasi, Joseph A. (2002): Returns on Research
and Development for 1990s New Drug Introductions. In PharmacoEconomics 20
(Supplement 3), pp. 11–29. DOI: 10.2165/00019053-200220003-00002.
Grant, C. (2015). Biotech Is Down, But It’s Too Early to Say It’s Out. The Wall Street
Journal. Retrieved from http://www.wsj.com/articles/biotech-is-down-but-its-too-
early-to-say-its-out-1452279214
Grinyer, Peter H.; McKiernan, Peter (1991): The Determinants of Corporate
Profitability in the UK Electrical Engineering Industry. In British Journal of
Management 2 (1), pp. 17–32. DOI: 10.1111/j.1467-8551.1991.tb00012.x.
Hall, Linda A.; Bagchi-Sen, Sharmistha (2002): A study of R&D, innovation, and
business performance in the Canadian biotechnology industry. In Technovation 22
(4), pp. 231–244. DOI: 10.1016/S0166-4972(01)00016-5.
Hansen, G.S., Wernerfelt, B. (1989). Determinants of firm performance. The relative
importance of economic and organizational factors. In Strat. Mgmt. J. 10 (5), pp. 399–
411. DOI: 10.1002/smj.4250100502.

50
Hine, D., Kapeleris J. Entrepreneurship in Biotechnology, an International
Perspective. Glos: Edward Elgar Publishing Limited.
International Accounting Standards Board. International financial reporting standards
as issued at 1 January 2009. (2009). London, UK: International Accounting Standards
Board.
Jefferson, Gary H.; Huamao, Bai; Xiaojing, Guan; Xiaoyun, Yu (2006): R&D
Performance in Chinese industry. Economics of Innovation and New Technology 15
(4-5), pp. 345–366. Retreived October 15, 2015, from
http://eml.berkeley.edu//~bhhall/EINT/Jeffersonetal.pdf
Juan García‐Teruel, Pedro; Martínez‐Solano, Pedro (2007): Effects of working capital
management on SME profitability. In Int J of Managerial Finance 3 (2), pp. 164–177.
DOI: 10.1108/17439130710738718.
European Commission, Enterprise and Industry DG (2007). Competitiveness of the
European biotechnology industry. Jonsson, T. Retrieved May 2, 2016 from
http://ec.europa.eu/DocsRoom/documents/1700/attachments/1/translations/en/renditi
ons/pdf.
Keegan, K. D. (2008). Biotechnology valuation: An introductory guide. Chichester,
England: John Wiley & Sons.
Laursen, K., Salter, A., (2006): Open for innovation. The role of openness in
explaining innovation performance among U.K. manufacturing firms. In Strat. Mgmt.
J. 27 (2), pp. 131–150. DOI: 10.1002/smj.507.
Lazaridis, I., & Tryfonidis, D. (2006). Relationship between working capital
management and profitability of listed companies in the Athens stock exchange.
Journal of financial management and analysis, 19(1). Retrieved October 19, 2015,
from http://papers.ssrn.com/sol3/papers.cfm?abstract_id=931591
Lee, Jim (2009): Does Size Matter in Firm Performance? Evidence from US Public
Firms. In International Journal of the Economics of Business 16 (2), pp. 189–203.
DOI: 10.1080/13571510902917400.
Loderer, C., Waelchli, U. (2009). Firm age and performance. University of Bern,
Working Paper. Retreived October 15, 2015, from
http://www.bi.edu/InstitutterFiles/Finans/Firm_age_performance.pdf
Lu, Jane W.; Beamish, Paul W. (2006): SME internationalization and performance.
Growth vs. profitability. In J Int Entrepr 4 (1), pp. 27–48. DOI: 10.1007/s10843-006-
8000-7.
Majumdar, S.K. (1997) "The impact of size and age on firm-level performance: some
evidence from India. In Review of industrial organization 12.2 (1997): 231-241. DOI:
10.1023/A:1007766324749.
Makino, S., Isobe, T., Chan, C.M.(2004): Does country matter? In Strat. Mgmt. J. 25
(10), pp. 1027–1043. DOI: 10.1002/smj.412.

51
Mank, Del A.; Nystrom, Halvard E. (2001): Decreasing Returns to Shareholders From
R&D Spending in the Computer Industry. In Engineering Management Journal 13 (3),
pp. 3–8. DOI: 10.1080/10429247.2001.11415120.
McDonald, J.T (1999). The Determinants of Firm Profitability in Australian
Manufacturing. In Economic Record 75 (2), pp. 115–126. DOI: 10.1111/j.1475-
4932.1999.tb02440.x.
Morbey, G. K., & Reithner, R. M. (1990). How R&D Affects Sales Growth,
Productivity And Profitability. Research Technology Management, 33(3), 11-14.
DOI:10.1080/08956308.1990.11670656
Murphy, Joseph E. (1968): Effects of Leverage on Profitability, Growth and Market
Valuation of Common Stock. In Financial Analysts Journal 24 (4), pp. 121–123. DOI:
10.2469/faj.v24.n4.121.
Nassar, Islam A.; Almsafir, Mahmoud Khalid; Al-Mahrouq, Maher H. (2014): The
Validity of Gibrat's Law in Developed and Developing Countries (2008–2013).
Comparison based Assessment. In Procedia - Social and Behavioral Sciences 129, pp.
266–273. DOI: 10.1016/j.sbspro.2014.03.676.
National Bureau of Economic Research (2007). Financial Risk in the Biotechnology
Industry (NBER Working Paper No. 13604). Cambridge: Golec J.H.,Vernon J.A.
Nunes, P.M., Serrasqueiro, Z.(2014): Profitability determinants of Portuguese
knowledge-intensive business services. Empirical evidence using panel data models.
In Applied Economics Letters 22 (1), pp. 51–56. DOI:
10.1080/13504851.2014.925041.
OECD. (2005). A Framework for Biotechnology Statistics. OECD.
Retrieved March 1, 2016 from https://www.oecd.org/sti/sci-tech/34935605.pdf
OECD. (2009). OECD Biotechnology Statistics 2009. Van Beuzekom B., Arundel A.
Retrieved February 20, 2016 from http://www.oecd.org/sti/sci-tech/42833898.pdf
OECD. (2015). Key Biotechnology Indicators. Retrieved March 15, 2016 from
http://www.oecd.org/sti/inno/keybiotechnologyindicators.htm
Ohnemus, J. (2007): Does IT Outsourcing Increase Firm Success? An Empirical
Assessment Using Firm-level Data, ZEW Discussion Paper No. 07-087. Mannheim
Retrieved May 1, 2016 from
http://icc.oxfordjournals.org/content/early/2012/09/09/icc.dts032.short
Pattitoni, P., Petracci, B., & Spisni, M. (2014). Determinants of profitability in the
EU-15 area. Applied Financial Economics, 24(11), 763-775.
http://dx.doi.org/10.1080/09603107.2014.904488

52
Peong Kwee (2014): Profitability and Firm Size–Growth Relationship in Construction
Companies in Malaysia From 2003 to 2010. In Rev. Pac. Basin Finan. Mark. Pol. 17
(03), p. 1450014. DOI: 10.1142/S0219091514500143.
Pisoni, A., Onetti, A., Fratocchi, L., & Talaia, M. (2010). Managing R&D Activities
in the Italian Biotech Industry: A Comparison of Investments from MNCs and
Domestic Firms. IUP Journal of Knowledge Management, 8(3), 39-59.
Retrieved November 20, 2015, from:
http://web.a.ebscohost.com/ehost/pdfviewer/pdfviewer?sid=7089fde0-88d4-4204-
86a7-dbcbb8ce5a7e%40sessionmgr4002&vid=167&hid=4207
Porter, M. E., & Stern, S. (2001). National innovative capacity. The global
competitiveness report, 2002, 102-118. Retrieved November 20, 2015, from:
http://www.hbs.edu/faculty/Publication%20Files/Innov_9211_610334c1-4b37-
497d-a51a-ce18bbcfd435.pdf
PricewaterhouseCoopers. (2010).Biotech reinvented. Where do you go from here?
Retrieved April 19, 2016 from
http://www.forschungsnetzwerk.at/downloadpub/pwc_Studie_Biotech_reinvented.p
df
PwC (2013). Global Innovation Survey, Executive Summary. PwC. Retrieved May 3,
2016, from
http://www.pwc.com/gx/en/innovationsurvey/files/gis_execsummary.pdf
Qian, G.,Li, L. (2003). Profitability of small- and medium-sized enterprises in high-
tech industries. The case of the biotechnology industry. In Strat. Mgmt. J. 24 (9), pp.
881–887. DOI: 10.1002/smj.344.
Samuels, J. M.; Smyth, D. J. (1968): Profits, Variability of Profits and Firm Size. In
Economica 35 (138), p. 127. DOI: 10.2307/2552126.
Saunders,M., Lewis, P., Thornhill, A., (2012): Research methods for business
students. 6th ed. Harlow, England, New York: Pearson.
Serrano Cinca, C.; Mar Molinero, C.; Gallizo Larraz, J. L. (2005): Country and size
effects in financial ratios. A European perspective. In Global Finance Journal 16 (1),
pp. 26–47. DOI: 10.1016/j.gfj.2005.05.003.
Shelton, R., & Percival, D. (2013). Global Innovation Survey. PwC. Retreived
October 15, 2015, from
http://www.pwc.com/gx/en/innovationsurvey/files/innovation_full_report.pdf
Shimasaki, C. (2010). The Biotech Industry is Finally Profitable! So What Does That
Mean?.Biosource Consulting.
Retrieved 1 May 2016, from http://biosourceconsulting.com/the-biotech-industry-is-
finally-profitable/
53
Shubber, K. (2015, July 16). Explainer: The Biotech raging bull. The Financial Times.
Retreived November 28, 2015, from
http://www.ft.com/intl/cms/s/2/13c65f72-2ba6-11e5-8613-
e7aedbb7bdb7.html?siteedition=intl#axzz3ve0PA9dT
Stefanec, N.P. (2011): The impact of firm strategies on stock market value in the
biotechnology industry. In Applied Financial Economics 21 (5), pp. 343–352. DOI:
10.1080/09603107.2010.530214.
Fever rising. (2014, February 15). The Economist. Retrieved April 1, 2016 from
http://www.economist.com/news/business/21596557-there-are-reasons-hope- latest-
biotech-boom-will-not-be-followed-another
Tsai, W., & Erickson, S. (2006). Early-stage biotech companies: Strategies for
survival and growth. Biotechnology Healthcare, 49–53. Retrieved May 1, 2016 from
http://www.ncbi.nlm.nih.gov/pmc/articles/PMC3571061/
Vaishampayan, S. (2015). The Market’s Latest Comeback Story: Biotech Stocks. The
Wall Street Journal. Retrieved 1 May 2016, from http://www.wsj.com/articles/the-
markets-latest-comeback-story-biotech-stocks-1451433425
Wooldridge, J. (2014). Introductory Econometrics: a Modern Approach. Nashville:
South-Western College Publishing.
Yang, Kuo-Pin; Chiao, Yu-Ching; Kuo, Chih-Chung (2010): The Relationship
Between R&D Investment and Firm Profitability Under a Three-Stage Sigmoid Curve
Model. Evidence From an Emerging Economy. In IEEE Trans. Eng. Manage. 57 (1),
pp. 103–117. DOI: 10.1109/TEM.2009.2023452.
Zachariadis M., (2003).R&D, innovation, and technological progress: a test of the
Schumpeterian framework without scale effect. Canadian J Econ 36(3), 566-586
Retrieved April 2, 2016 from
http://www.bus.lsu.edu/economics/papers/pap02_18.pdf
Zueckerman, G. (2015, March 25). Biotech’s Rally Fuels Bubble Fears. The Wall
Street Journal.
Retrieved November 28, 2015, from http://www.wsj.com/articles/biotechs-rally-
fuels-bubble-fears-1427237279

54
7. Appendices
Appendix A: Data selection using Orbis (Bureau Van Dijk)
Step result Search result
1. 164,859,805 164,859,805
2. 31,423,127 22,778,660
3. 337,480 8,229
4. 14,522,062 1,543
5. 19,405,008 1,539
6. 403,332 147
7. 13,099,742 49
8. 520,126 32
9. 453,818 32
10. 14,177,647 30
TOTAL 30
Total Current Liabilities: All companies with a known value,
2015, 2014, 2013, 2012, 2011, 2010, 2009, 2008, 2007,
2006, for at least one of the selected periods, exclusion of
companies with no recent financial data and Public
authorities/States/Governments
Long term debt: All companies with a known value, 2015,
2014, 2013, 2012, 2011, 2010, 2009, 2008, 2007, 2006, for
at least one of the selected periods, exclusion of companies
with no recent financial data and Public
authorities/States/Governments
Boolean search : 1 And 2 And 3 And 4 And 5 And 6 And 7 And 8 And 9 And 10
Fiscal year end:31/03
Current search settings:
- priority given to the most recent accounts available
- exclusion of companies with no recent financial data and Public authorities/States/Governments
NACE Rev. 2 (All codes): 7211 - Research and
experimental development on biotechnology
Operating P/L [=EBIT]: All companies with a known value,
2015, 2014, 2013, 2012, 2011, 2010, 2009, 2008, 2007,
2006, for at least one of the selected periods, exclusion of
companies with no recent financial data and Public
authorities/States/Governments
Total assets: All companies with a known value, 2015,
2014, 2013, 2012, 2011, 2010, 2009, 2008, 2007, 2006, for
at least one of the selected periods, exclusion of companies
with no recent financial data and Public
authorities/States/Governments
Research&Development expenses: All companies with a
known value, 2015, 2014, 2013, 2012, 2011, 2010, 2009,
2008, 2007, 2006, for at least one of the selected periods,
exclusion of companies with no recent financial data and
Public authorities/States/Governments
Sales: All companies with a known value, 2015, 2014, 2013,
2012, 2011, 2010, 2009, 2008, 2007, 2006, for at least one
of the selected periods, exclusion of companies with no
recent financial data and Public
authorities/States/Governments
Total Current Assets: All companies with a known value,
2015, 2014, 2013, 2012, 2011, 2010, 2009, 2008, 2007,
2006, for at least one of the selected periods, exclusion of
companies with no recent financial data and Public
authorities/States/Governments
HSLU-1
Export date 1/4/2016
All active companies and companies with unknown situation
World region/Country/Region in country: France,
Germany, Sweden, Switzerland, United Kingdom
Product name Orbis
Update number 146
Software version 129.00
Data update 01/04/2016 (n° 14609)
Username

55
Appendix B
Figure B.1: Matrix Scatterplot

56
Figure B.2: Scatterplot of residuals
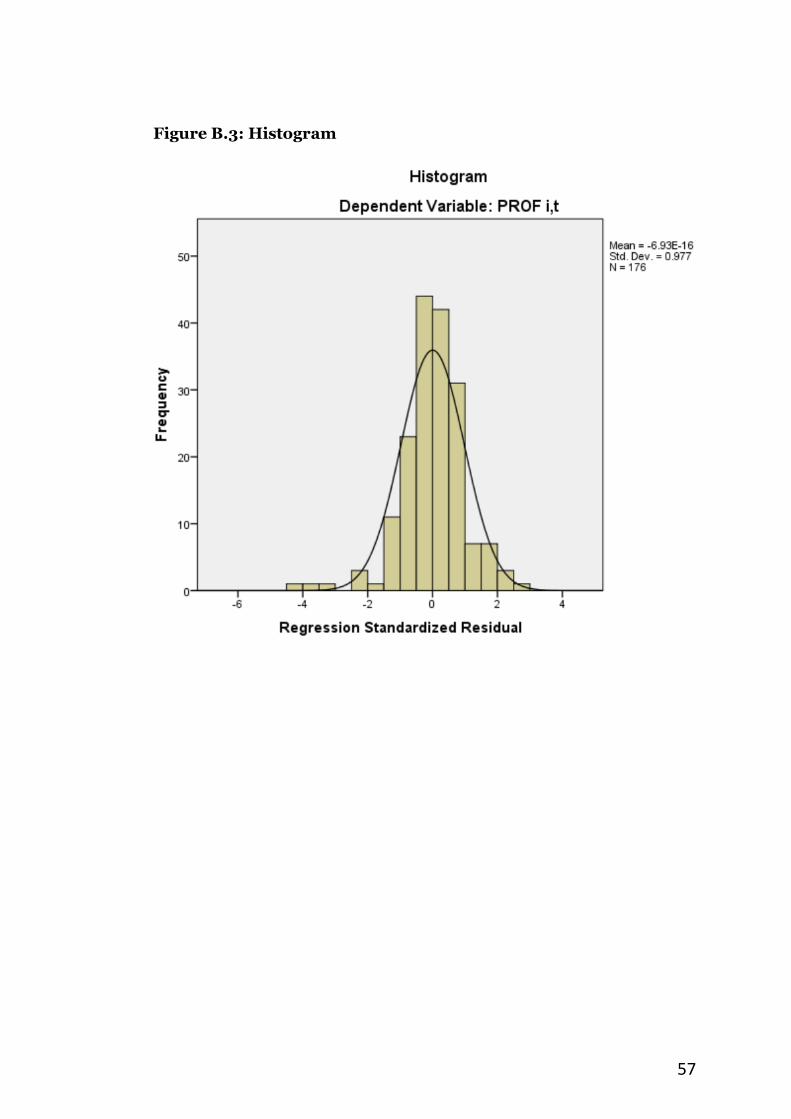
57
Figure B.3: Histogram

58
Figure B.4: P-P plot of regression standardized residual

59
Table B.1: Correlations
Table B.2: Model Summary
Table B.3. Residuals Statistics

60
Table B.4: ANOVA
Table B.5: Coefficients

61
Appendix C: Declaration of Sole Authorship
I, Marija Nikolikj, hereby certify that the attached work, Factors that impact
firm`s profitability: Evidence from European Biotech, is wholly and
completely my own and that I have indicated all the sources (printed,
electronic, personal, etc.) that I have consulted. Any sections quoted from
these sources are clearly indicated in quotation marks or are otherwise so
declared. I further attest that I have included acknowledgement of the names
of any person consulted in the course of preparing this assignment.
Signed:
Date: June 3rd, 2016