Embed Size (px)
Citation preview
Kinepolis GroupResults
Analyst Meeting
August 23, 2018
YTD H1 2018

Business review
CEO, Mr. Eddy Duquenne
YTD H1 2018
EXECUTIVE SUMMARY
3
Integration of Landmark Cinemas Canada on track
Solid contribution of Landmark to overall Group results
Further implementation of Group strategy and in particular premiumisation leads to further increase in sales and EBITDA per visitor
Weaker in visitor numbers in most European countries due to ongoing warm weather, the World Cup and a less successful film offering in Q2
4
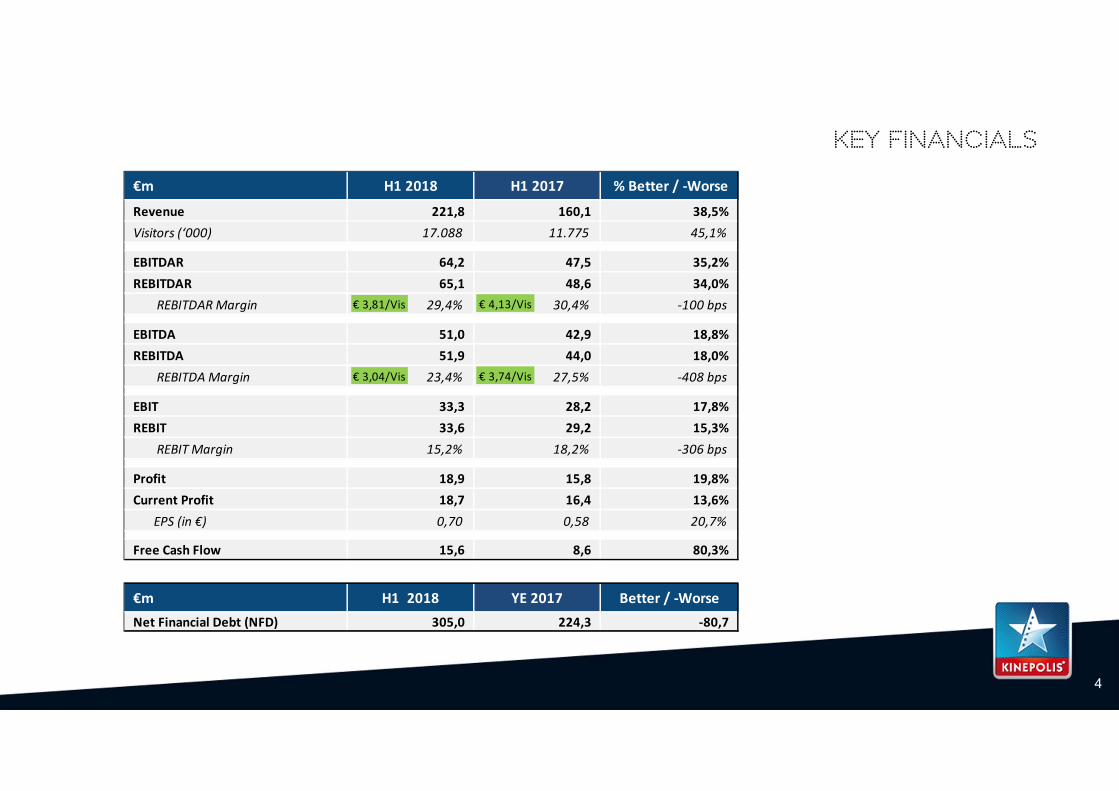
KEY FINANCIALS
€m H1 2018 H1 2017 % Better / ‐Worse
Revenue 221,8 160,1 38,5%Visitors (‘000) 17.088 11.775 45,1%
EBITDAR 64,2 47,5 35,2%REBITDAR 65,1 48,6 34,0% REBITDAR Margin 29,4% 30,4% ‐100 bps
EBITDA 51,0 42,9 18,8%REBITDA 51,9 44,0 18,0% REBITDA Margin 23,4% 27,5% ‐408 bps
EBIT 33,3 28,2 17,8%REBIT 33,6 29,2 15,3% REBIT Margin 15,2% 18,2% ‐306 bps
Profit 18,9 15,8 19,8%Current Profit 18,7 16,4 13,6% EPS (in €) 0,70 0,58 20,7%
Free Cash Flow 15,6 8,6 80,3%
€m H1 2018 YE 2017 Better / ‐WorseNet Financial Debt (NFD) 305,0 224,3 ‐80,7
€ 3,04/Vis € 3,74/Vis
€ 3,81/Vis € 4,13/Vis
5
strategy
H1 2018 results reflect Strategic Pillars set out in 2008
Best Marketer
Best Cinema Operator
Best Real Estate Manager
Strong focus on experience‐driven product innovation and premiumisation
Executive focus H2 2018
Further development and implementation of strategic pillars
Integration of Landmark Cinemas Canada
New expansion
Further investment in human capital
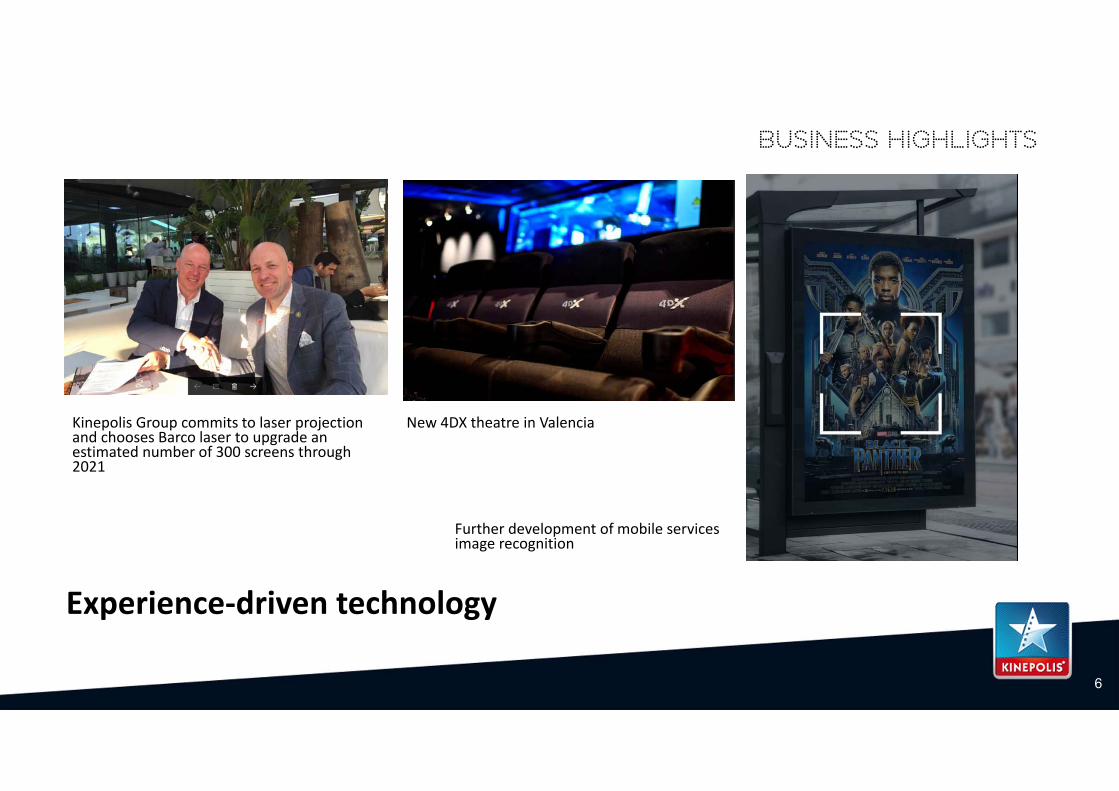
Kinepolis Group commits to laser projection and chooses Barco laser to upgrade an estimated number of 300 screens through 2021
BUSINESS HIGHLIGHTS
New 4DX theatre in Valencia
Further development of mobile services image recognition
Experience‐driven technology
6

BUSINESS HIGHLIGHTS
30.000 ladies attended LATM Fifty shades Freed (BE)
Experience‐driven marketing
Escape rooms in Leuven and Granada
Jurassic World PR stunts Silent screening
7

BUSINESS HIGHLIGHTS
Content diversification
Programmation of first Nollywood & Chinese films
Concerts: Nick Cave (One More Time), etc
8
On 26 April 2018 the Belgian Competition Authority confirms the previous relaxation of the behavioral conditions, which means that the opening of new cinema complexes in Belgium is no longer subject to prior approval of the Competition Authority, but this will enter into force as of 26 April 2020 (appeal pending).
Share buyback program, launched on 15 January 2018, has ended on 12 June 2018. Kinepolis Group has bought back 360.000 shares for a total amount of € 20.302.894. The total number of own shares amounts to 492.346.
9
Major events
Further steps in expansion strategy January 2018: acquisition of NH Bioscopen, the Netherlands
January 2018: acquisition of Metz Palace, France (under renovation)
January 2018: acquisition of ‘Magic Lantern Theatres’ Brighton Marketplace Cinema in Saskatoon, Canada
(under construction) and announcement of new project in CF Market Mall in Calgary, Canada
February 2018: opening St. Albert in Alberta, Canada
June 2018: opening Brighton Marketplace in East Saskatoon, Canada
June 2018: opening ‘s Hertogenbosch, the Netherlands
10
Major events
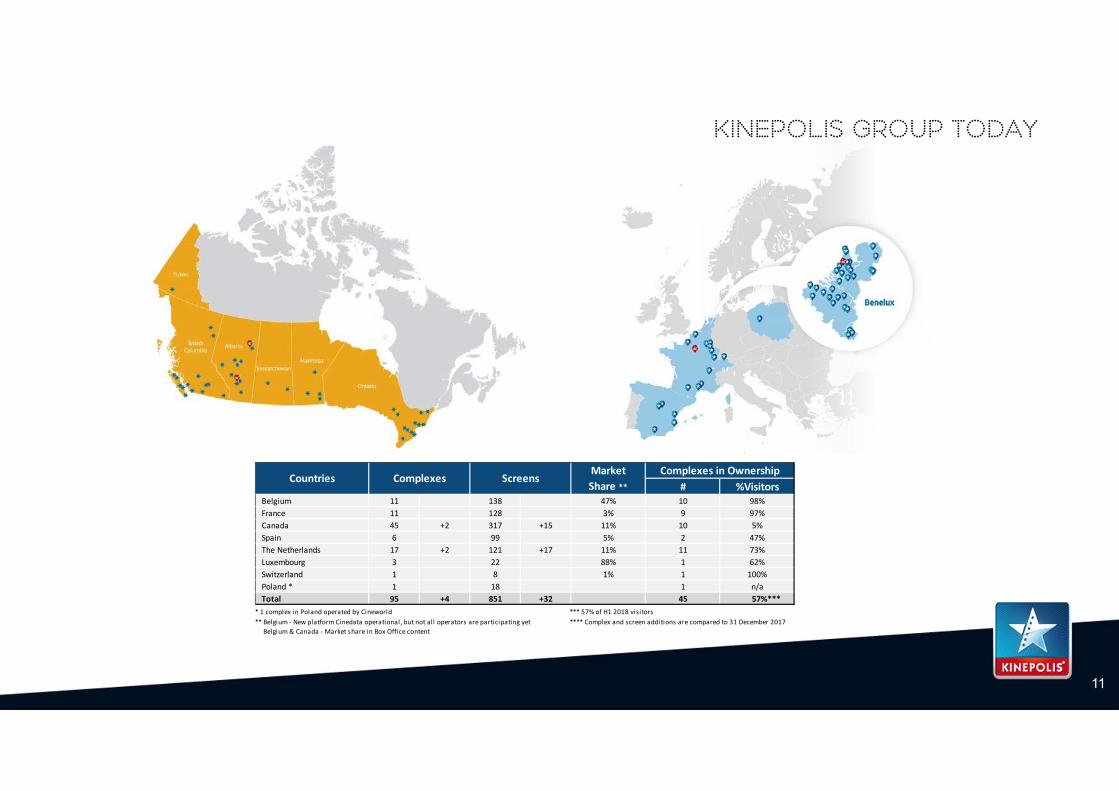
* 1 complex in Poland operated by Cineworld *** 57% of H1 2018 visitors**** Complex and screen additions are compared to 31 December 2017** Belgium ‐ New platform Cinedata operational, but not all operators are participating yet
Belgium & Canada ‐ Market share in Box Office content
113
11
kinepolis group today
# %VisitorsBelgium 11 138 47% 10 98%France 11 128 3% 9 97%Canada 45 +2 317 +15 11% 10 5%Spain 6 99 5% 2 47%The Netherlands 17 +2 121 +17 11% 11 73%Luxembourg 3 22 88% 1 62%Switzerland 1 8 1% 1 100%Poland * 1 18 1 n/aTotal 95 +4 851 +32 45 57%***
CountriesComplexes in Ownership
Complexes ScreensMarket Share **
12
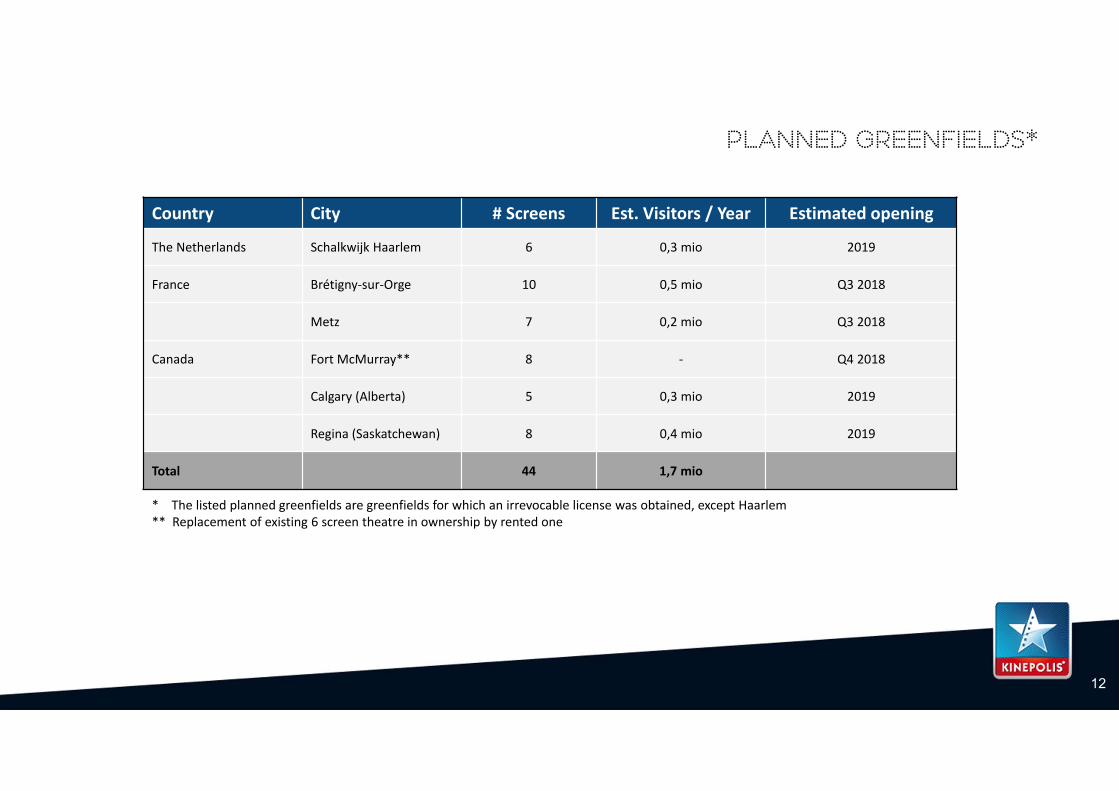
planned greenfields*
* The listed planned greenfields are greenfields for which an irrevocable license was obtained, except Haarlem** Replacement of existing 6 screen theatre in ownership by rented one
Country City # Screens Est. Visitors / Year Estimated opening
The Netherlands Schalkwijk Haarlem 6 0,3 mio 2019
France Brétigny‐sur‐Orge 10 0,5 mio Q3 2018
Metz 7 0,2 mio Q3 2018
Canada Fort McMurray** 8 ‐ Q4 2018
Calgary (Alberta) 5 0,3 mio 2019
Regina (Saskatchewan) 8 0,4 mio 2019
Total 44 1,7 mio
13
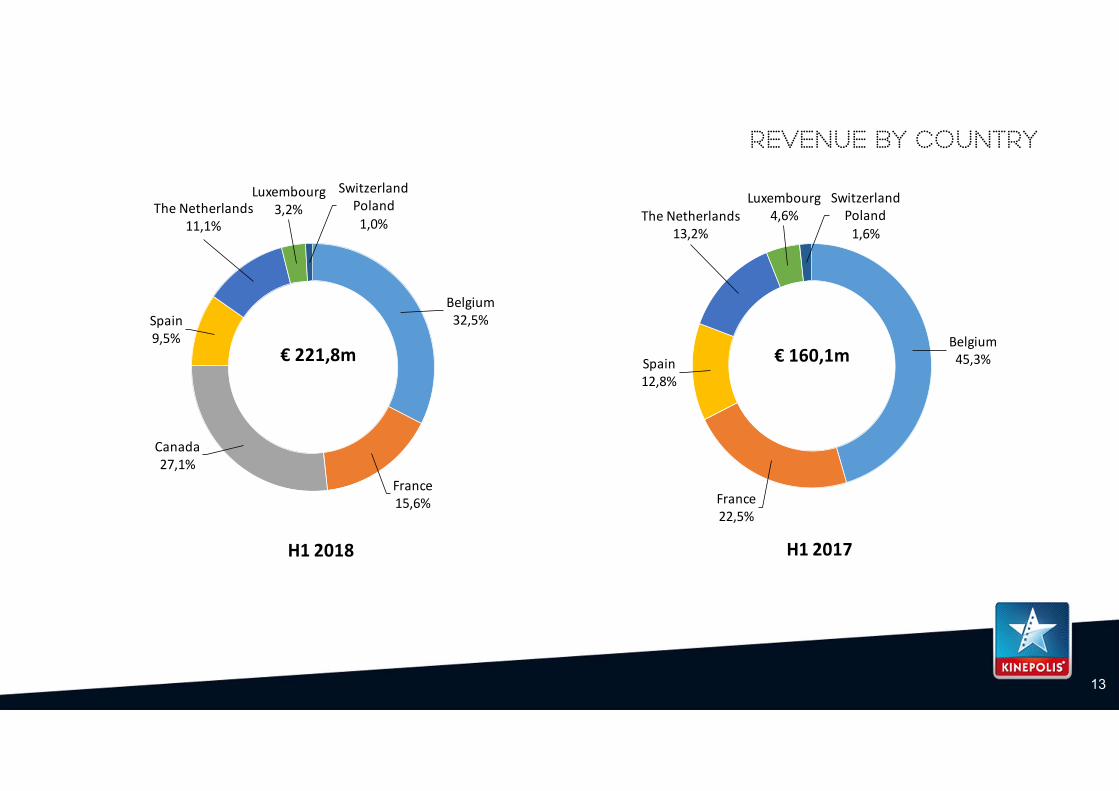
revenue by country
€ 221,8m
Belgium32,5%
France15,6%
Canada27,1%
Spain9,5%
The Netherlands11,1%
Luxembourg3,2%
SwitzerlandPoland1,0%
H1 2018
€ 160,1mBelgium45,3%
France22,5%
Spain12,8%
The Netherlands13,2%
Luxembourg4,6%
SwitzerlandPoland1,6%
H1 2017
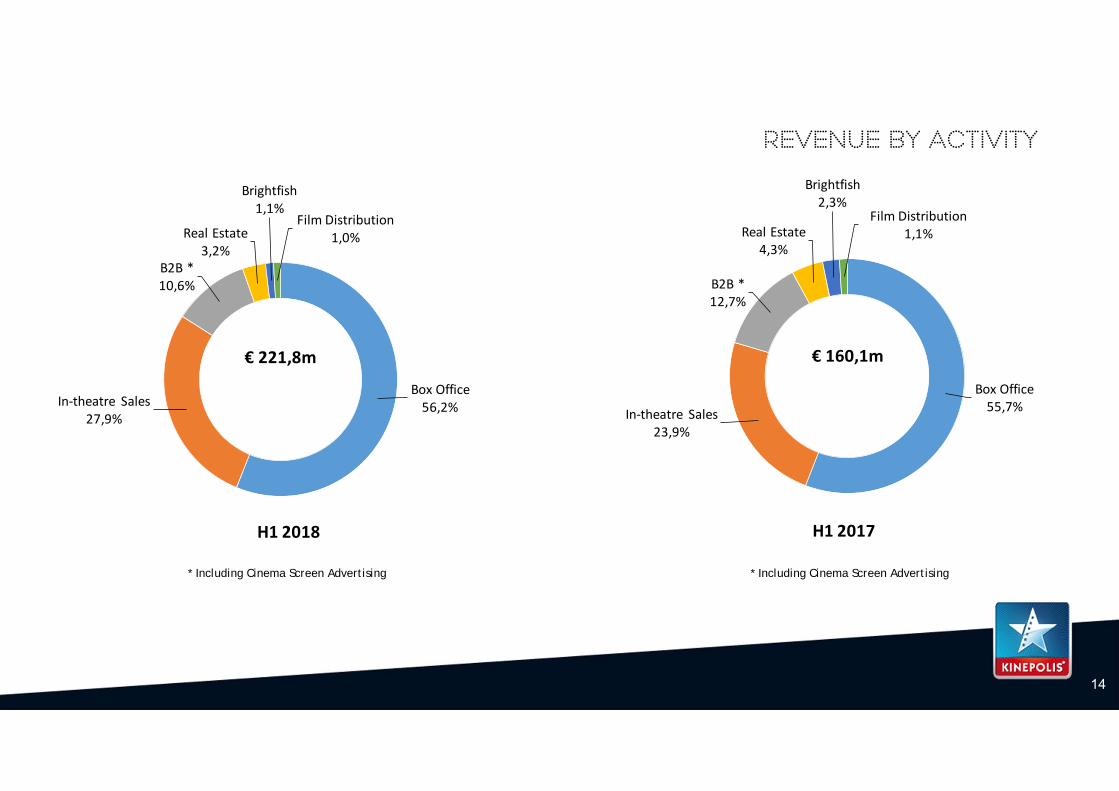
€ 221,8m
Box Office56,2%In‐theatre Sales
27,9%
B2B *10,6%
Real Estate3,2%
Brightfish1,1%
Film Distribution1,0%
H1 2018
€ 160,1m
Box Office55,7%In‐theatre Sales
23,9%
B2B *12,7%
Real Estate4,3%
Brightfish2,3%
Film Distribution1,1%
H1 2017
14
revenue by activity
* Including Cinema Screen Advertising* Including Cinema Screen Advertising
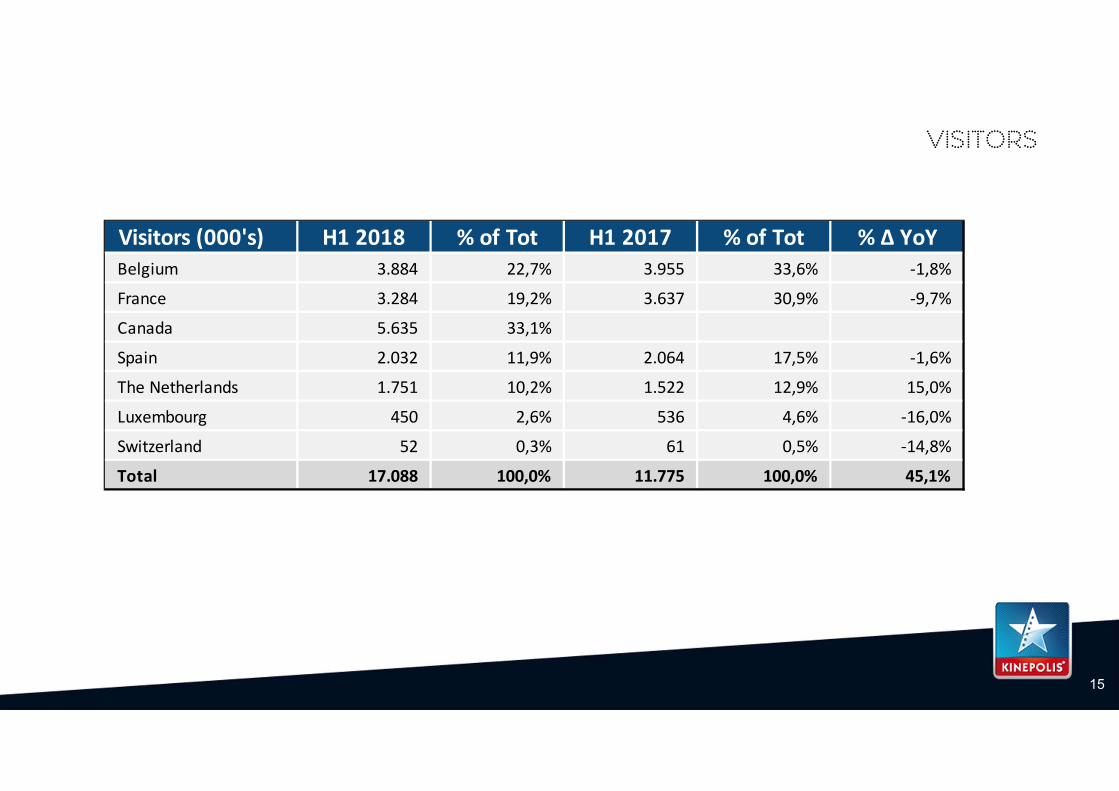
visitors
15
Visitors (000's) H1 2018 % of Tot H1 2017 % of Tot % ∆ YoYBelgium 3.884 22,7% 3.955 33,6% ‐1,8%
France 3.284 19,2% 3.637 30,9% ‐9,7%
Canada 5.635 33,1% 0 0,0% 0,0%
Spain 2.032 11,9% 2.064 17,5% ‐1,6%
The Netherlands 1.751 10,2% 1.522 12,9% 15,0%
Luxembourg 450 2,6% 536 4,6% ‐16,0%
Switzerland 52 0,3% 61 0,5% ‐14,8%
Total 17.088 100,0% 11.775 100,0% 45,1%
movies
16
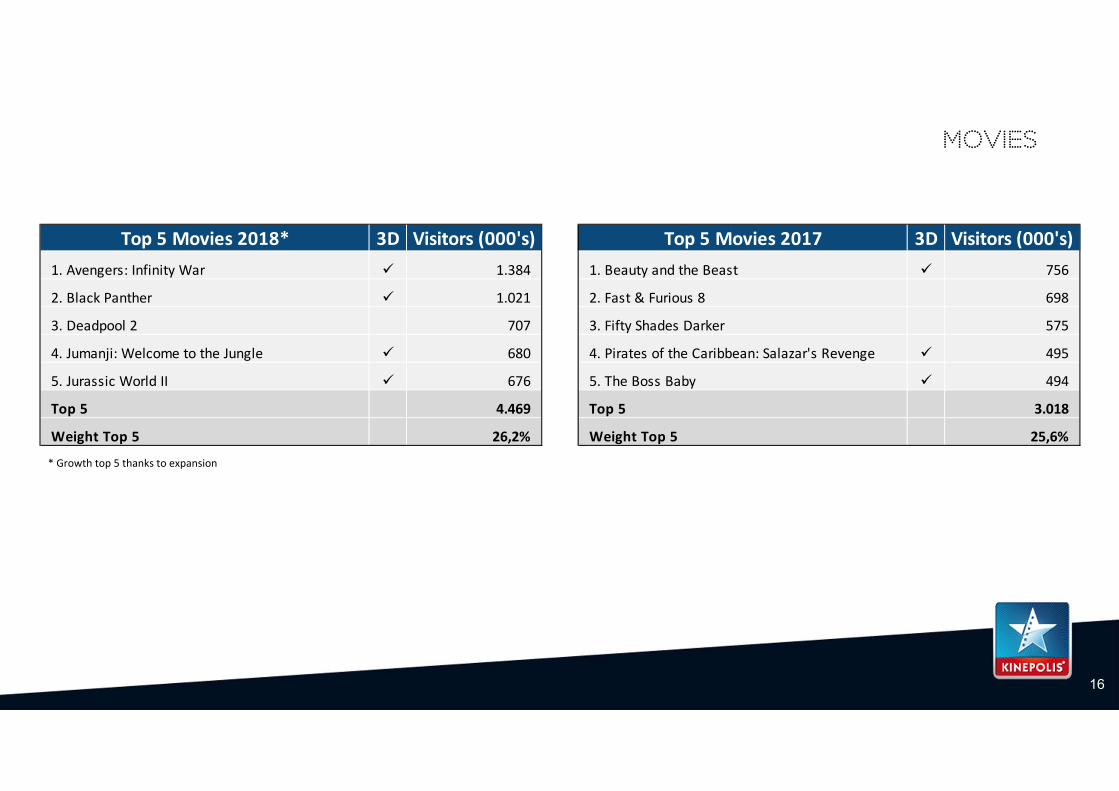
Top 5 Movies 2018* 3D Visitors (000's) Top 5 Movies 2017 3D Visitors (000's)1. Avengers: Infinity War 1.384 1. Beauty and the Beast 756
2. Black Panther 1.021 2. Fast & Furious 8 698
3. Deadpool 2 707 3. Fifty Shades Darker 575
4. Jumanji: Welcome to the Jungle 680 4. Pirates of the Caribbean: Salazar's Revenge 495
5. Jurassic World II 676 5. The Boss Baby 494
Top 5 4.469 Top 5 3.018
Weight Top 5 26,2% Weight Top 5 25,6%
* Growth top 5 thanks to expansion
17
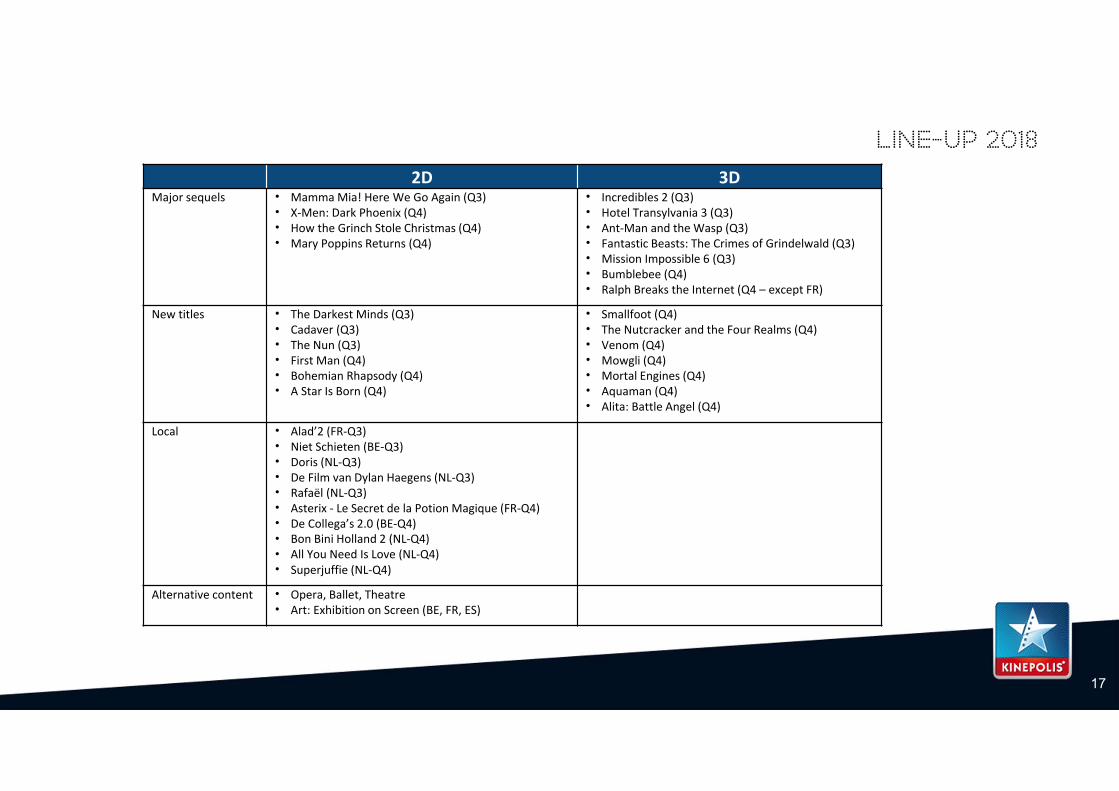
Line-up 20182D 3D
Major sequels • Mamma Mia! Here We Go Again (Q3)• X‐Men: Dark Phoenix (Q4)• How the Grinch Stole Christmas (Q4)• Mary Poppins Returns (Q4)
• Incredibles 2 (Q3)• Hotel Transylvania 3 (Q3)• Ant‐Man and the Wasp (Q3)• Fantastic Beasts: The Crimes of Grindelwald (Q3)• Mission Impossible 6 (Q3)• Bumblebee (Q4)• Ralph Breaks the Internet (Q4 – except FR)
New titles • The Darkest Minds (Q3)• Cadaver (Q3)• The Nun (Q3)• First Man (Q4)• Bohemian Rhapsody (Q4)• A Star Is Born (Q4)
• Smallfoot (Q4)• The Nutcracker and the Four Realms (Q4)• Venom (Q4)• Mowgli (Q4)• Mortal Engines (Q4)• Aquaman (Q4)• Alita: Battle Angel (Q4)
Local • Alad’2 (FR‐Q3)• Niet Schieten (BE‐Q3)• Doris (NL‐Q3)• De Film van Dylan Haegens (NL‐Q3)• Rafaël (NL‐Q3)• Asterix ‐ Le Secret de la Potion Magique (FR‐Q4)• De Collega’s 2.0 (BE‐Q4)• Bon Bini Holland 2 (NL‐Q4)• All You Need Is Love (NL‐Q4)• Superjuffie (NL‐Q4)
Alternative content • Opera, Ballet, Theatre• Art: Exhibition on Screen (BE, FR, ES)
Financial Review
CFO, Mr. Nicolas De Clercq
YTD H1 2018
19
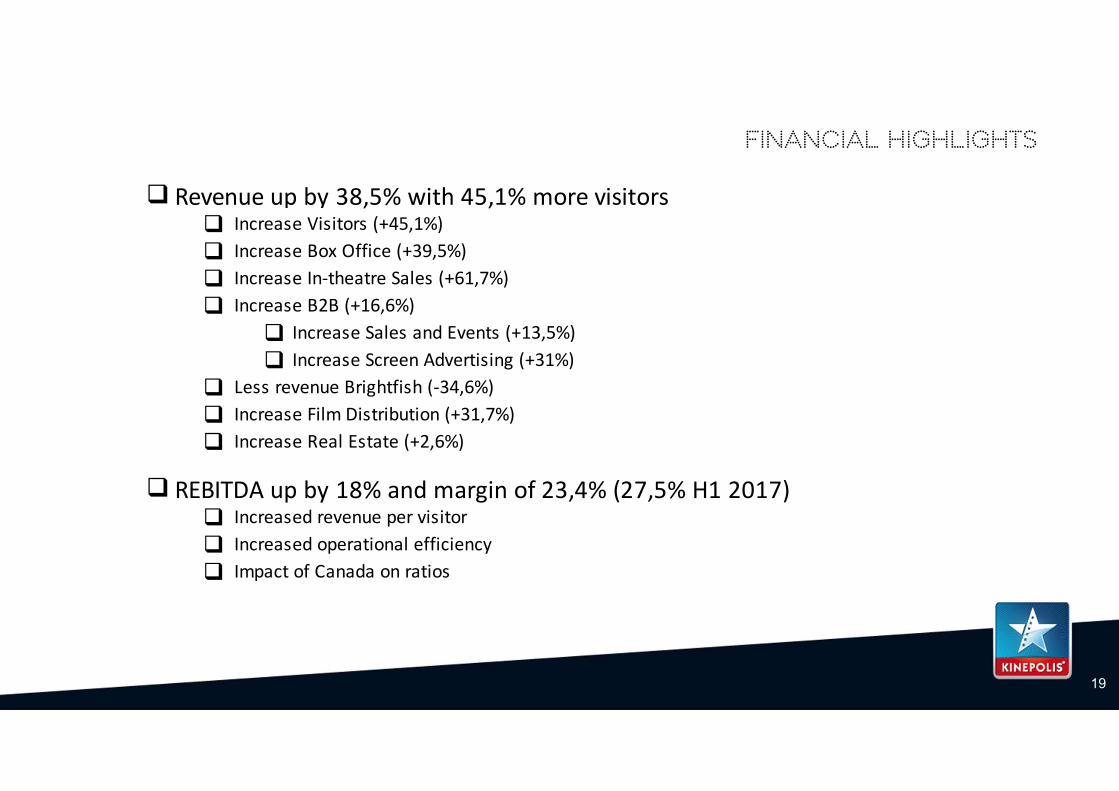
financial highlights
Revenue up by 38,5% with 45,1% more visitors Increase Visitors (+45,1%) Increase Box Office (+39,5%) Increase In‐theatre Sales (+61,7%) Increase B2B (+16,6%)
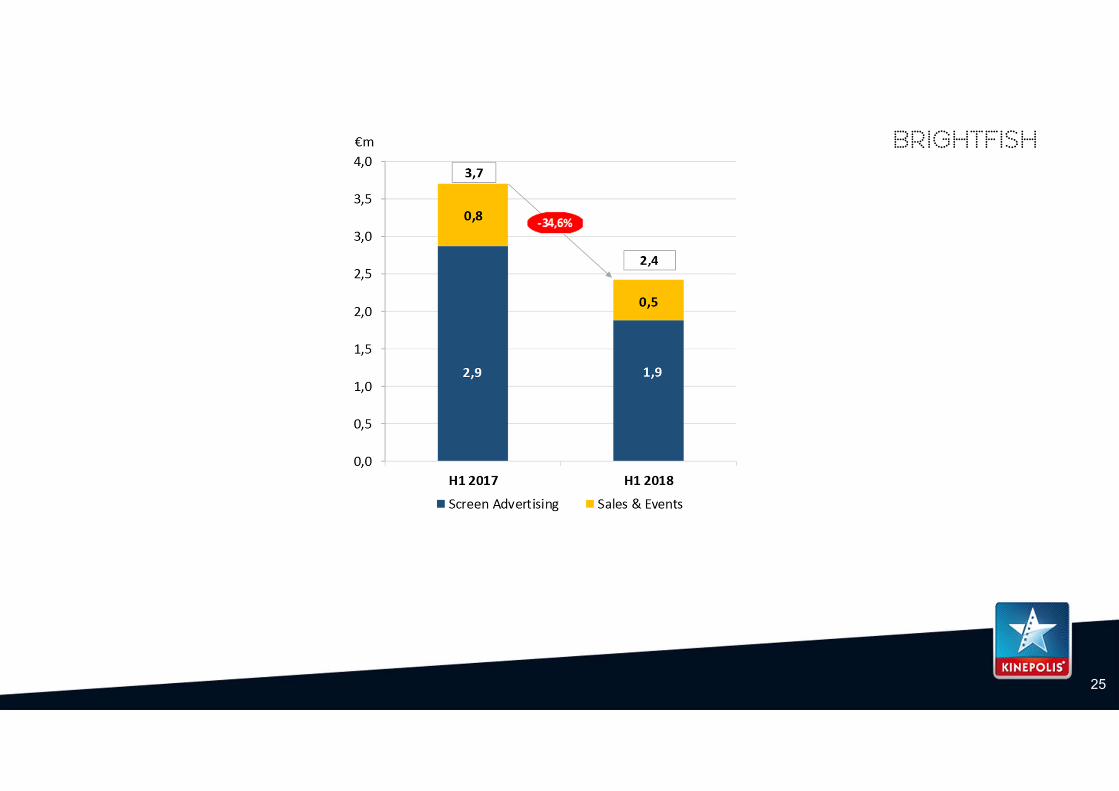
Increase Sales and Events (+13,5%) Increase Screen Advertising (+31%)
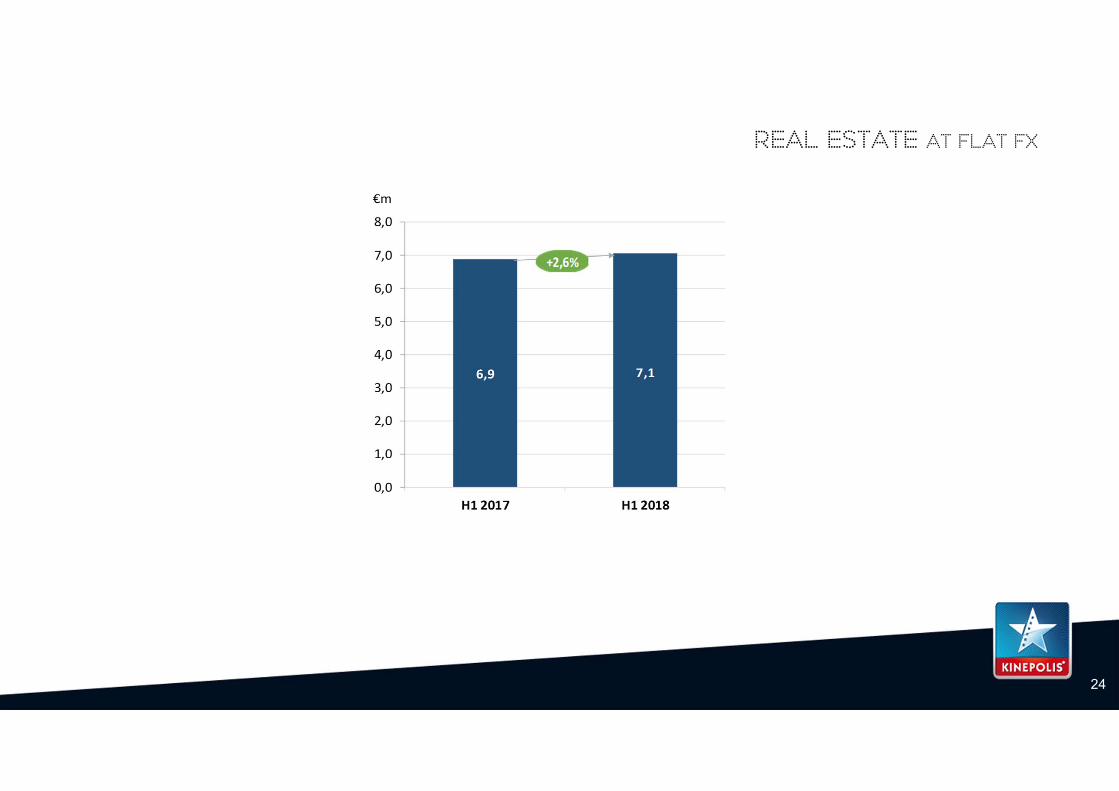
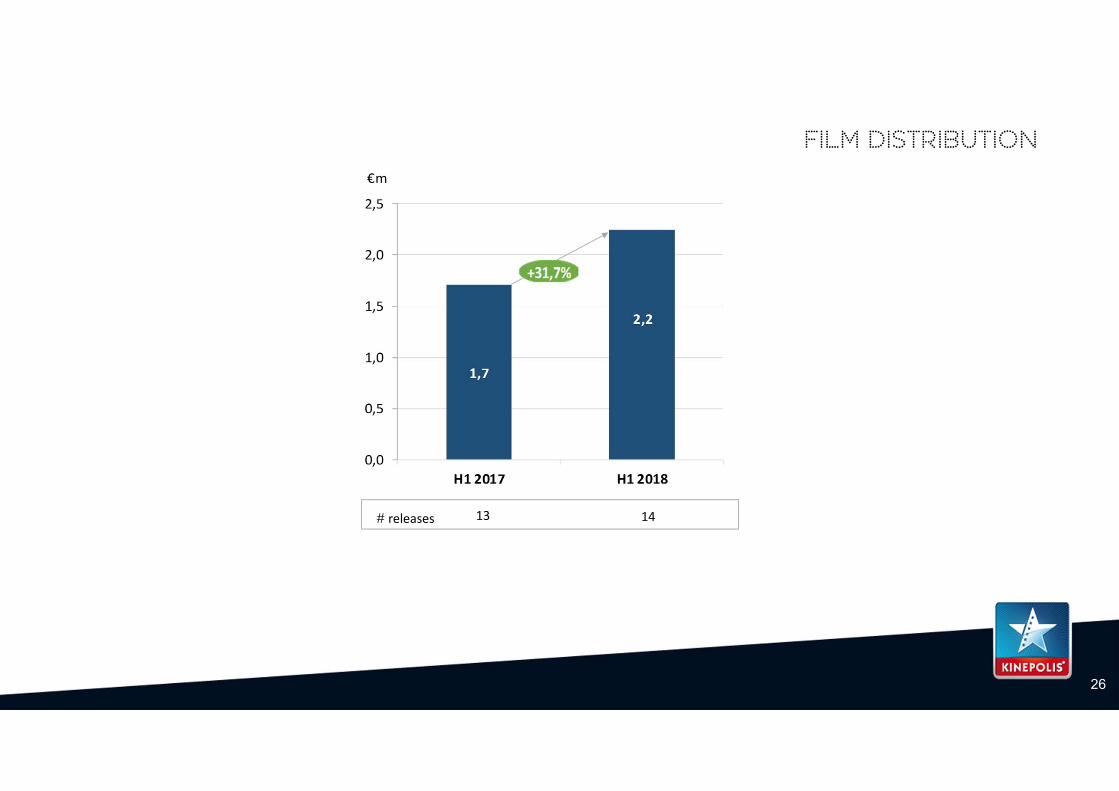
Less revenue Brightfish (‐34,6%) Increase Film Distribution (+31,7%) Increase Real Estate (+2,6%)
REBITDA up by 18% and margin of 23,4% (27,5% H1 2017) Increased revenue per visitor Increased operational efficiency Impact of Canada on ratios
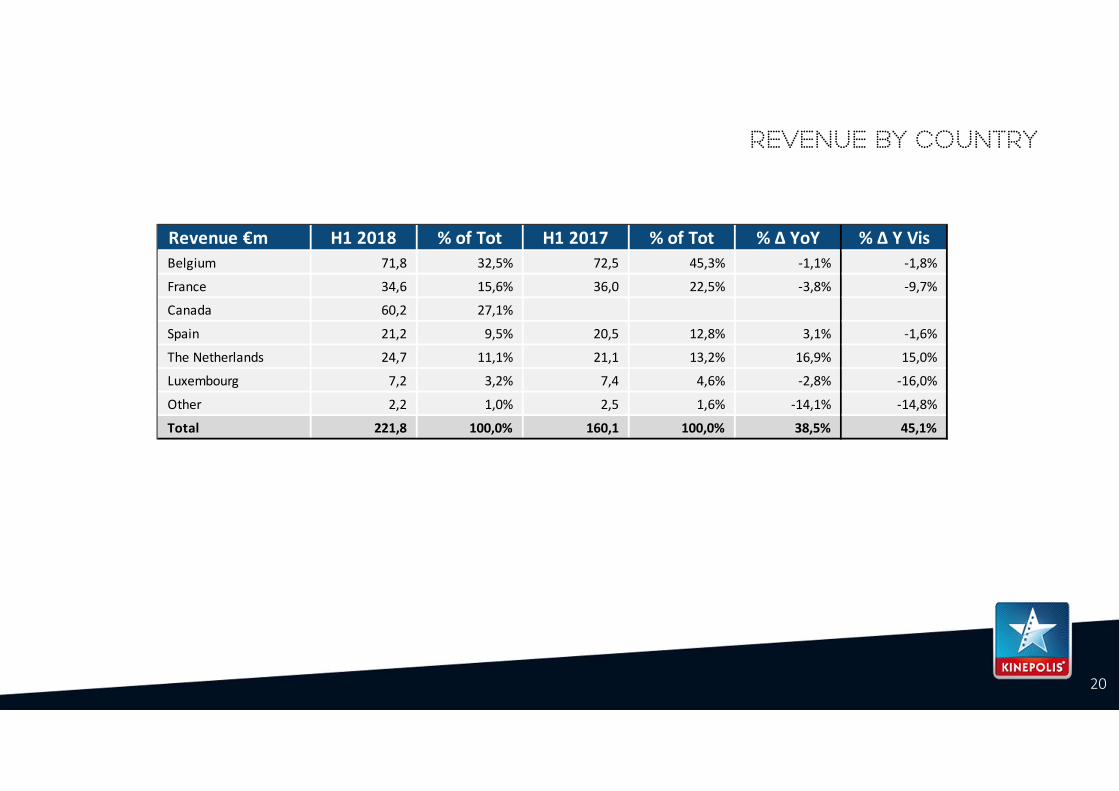
Revenue by country
20
Revenue €m H1 2018 % of Tot H1 2017 % of Tot % ∆ YoY % ∆ Y VisBelgium 71,8 32,5% 72,5 45,3% ‐1,1% ‐1,8%
France 34,6 15,6% 36,0 22,5% ‐3,8% ‐9,7%
Canada 60,2 27,1% 0,0 0,0% 0,0% 0,0%
Spain 21,2 9,5% 20,5 12,8% 3,1% ‐1,6%
The Netherlands 24,7 11,1% 21,1 13,2% 16,9% 15,0%
Luxembourg 7,2 3,2% 7,4 4,6% ‐2,8% ‐16,0%
Other 2,2 1,0% 2,5 1,6% ‐14,1% ‐14,8%
Total 221,8 100,0% 160,1 100,0% 38,5% 45,1%
21
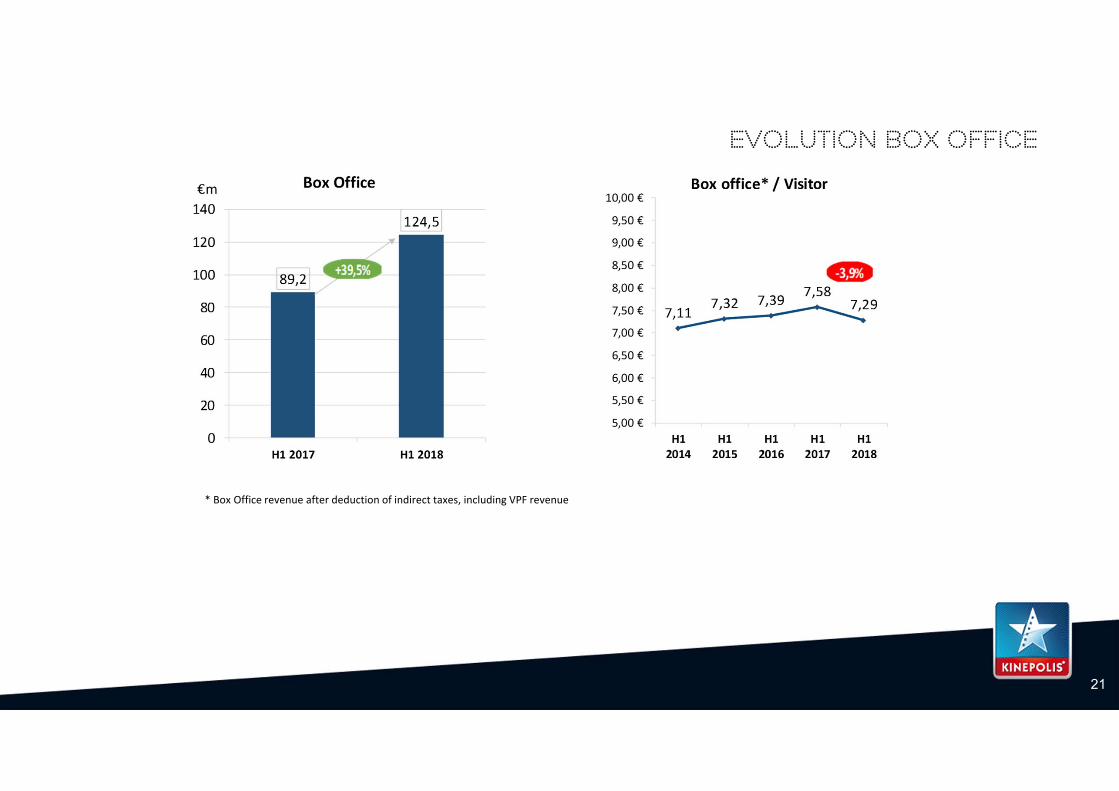
Evolution Box OFFICE
* Box Office revenue after deduction of indirect taxes, including VPF revenue
22
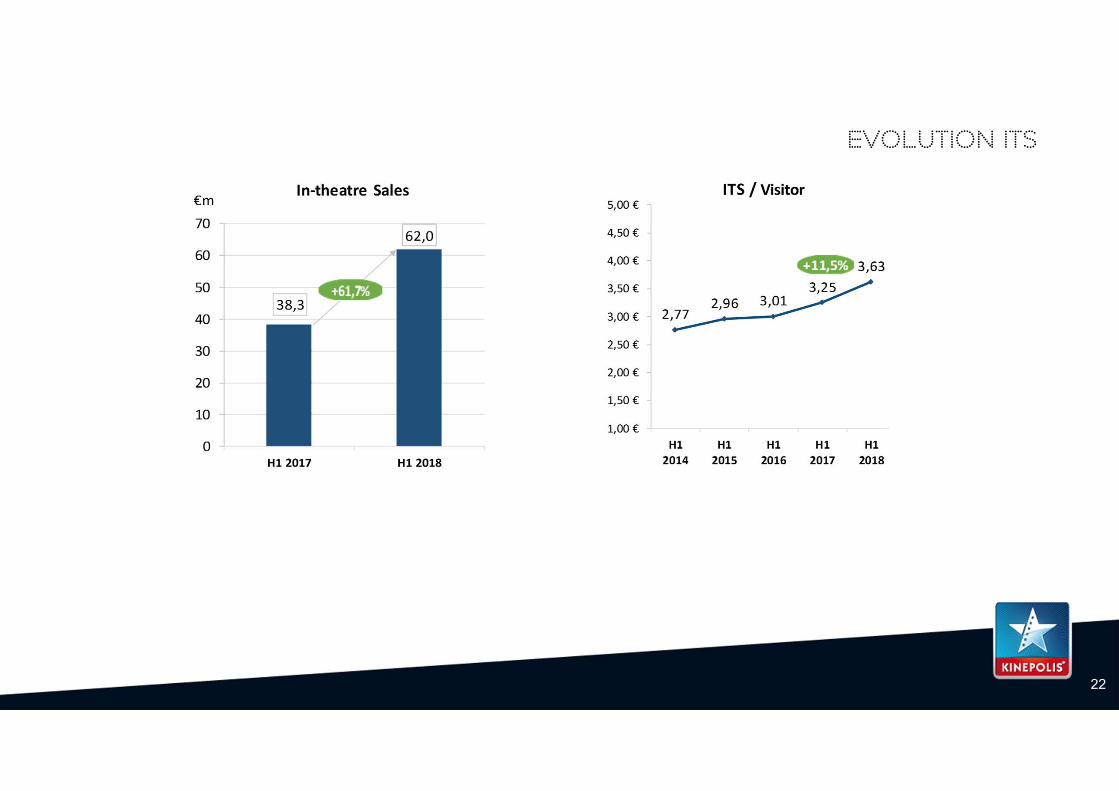
EVOLUTION ITS
23
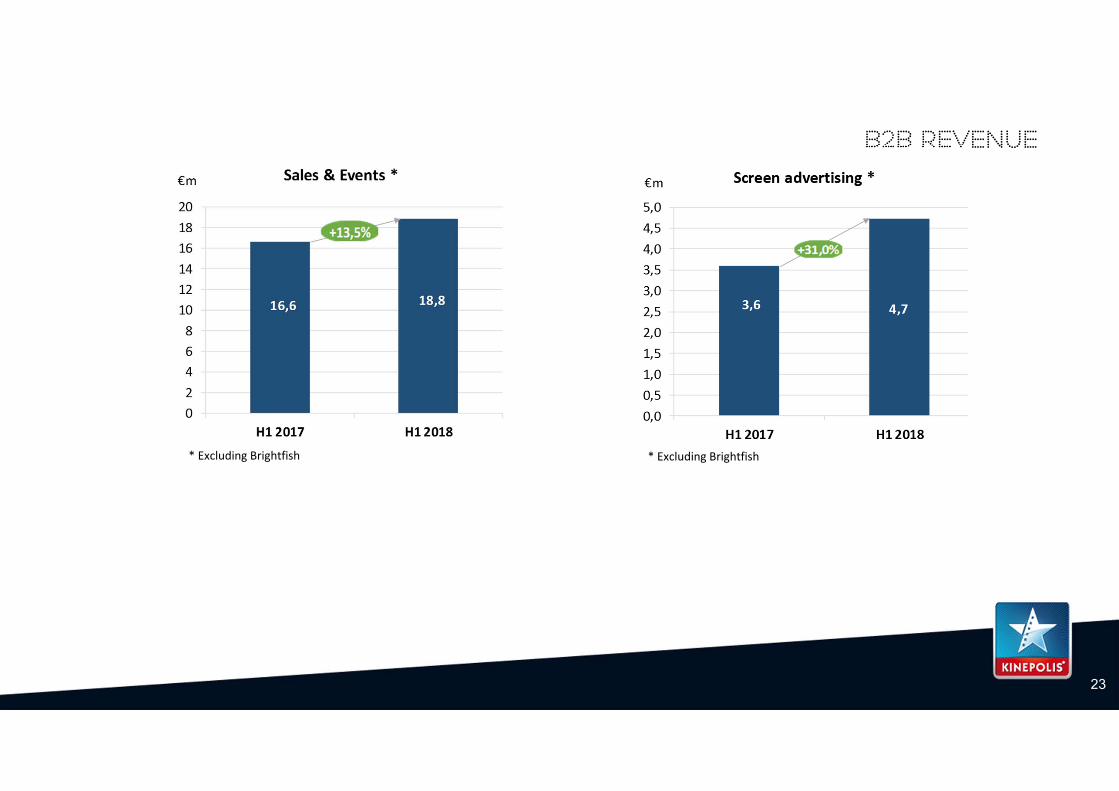
B2B revenue
* Excluding Brightfish * Excluding Brightfish
24
Real estate at flat fx
25
Brightfish
26
Film distribution
# releases 13 14
27
+9,5% +9,2%
-0,3%
+11,3%-12,8%+38,0%+7,3
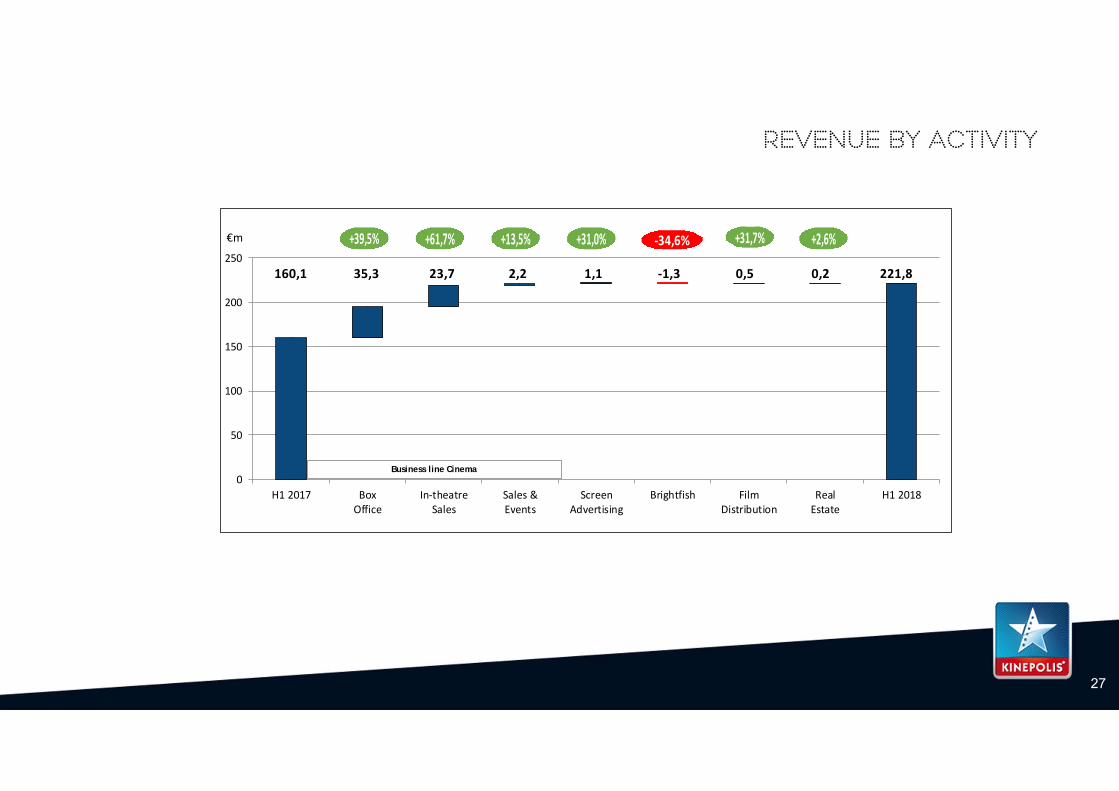
Revenue by activity
160,1 35,3 23,7 2,2 1,1 ‐1,3 0,5 0,2 221,8
0
50
100
150
200
250
H1 2017 BoxOffice
In‐theatreSales
Sales &Events
ScreenAdvertising
Brightfish FilmDistribution
RealEstate
H1 2018
Business line Cinema
+39,5% +61,7% +13,5% +31,0% ‐34,6% +31,7% +2,6%€m
28
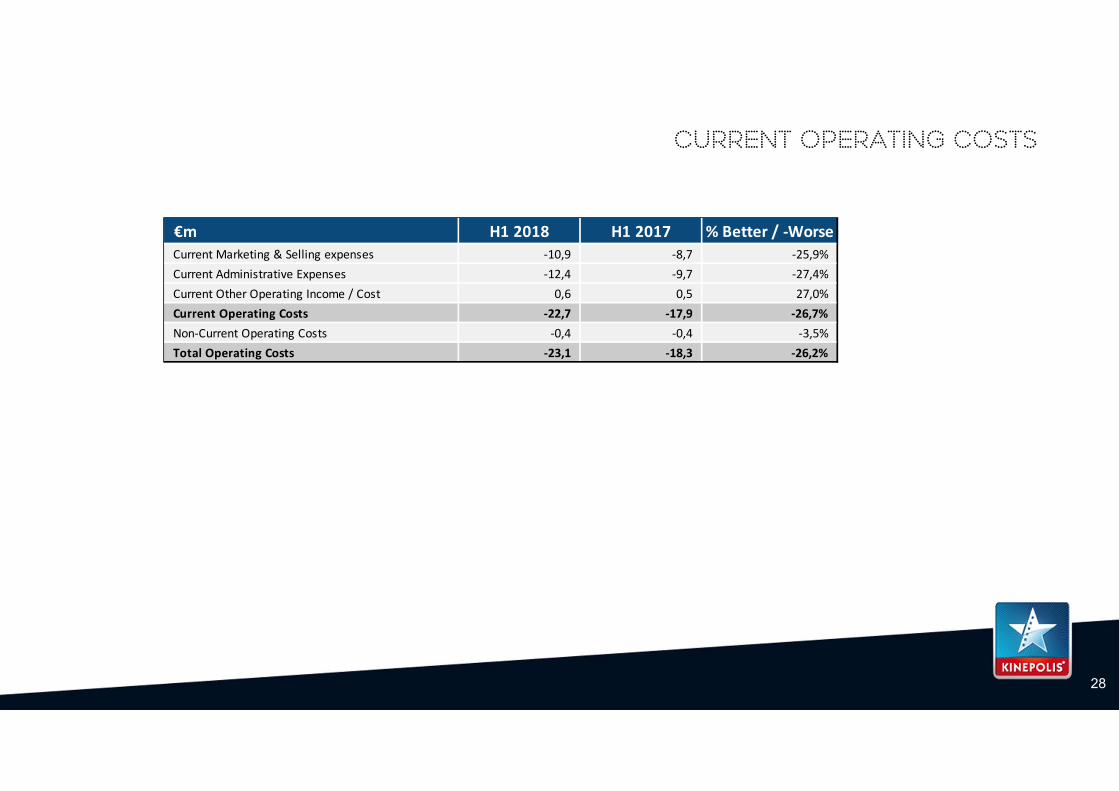
Current operating costs
€m H1 2018 H1 2017 % Better / ‐WorseCurrent Marketing & Selling expenses ‐10,9 ‐8,7 ‐25,9%Current Administrative Expenses ‐12,4 ‐9,7 ‐27,4%Current Other Operating Income / Cost 0,6 0,5 27,0%Current Operating Costs ‐22,7 ‐17,9 ‐26,7%Non‐Current Operating Costs ‐0,4 ‐0,4 ‐3,5%Total Operating Costs ‐23,1 ‐18,3 ‐26,2%
29
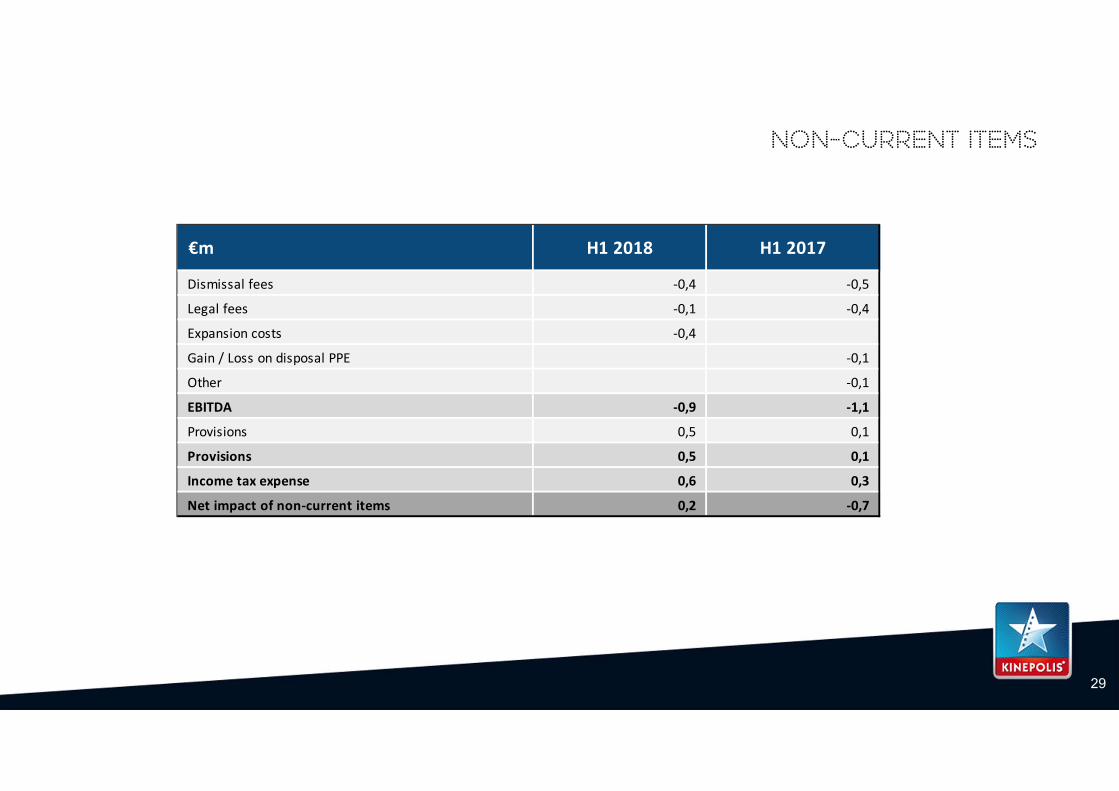
Non-Current items
€m H1 2018 H1 2017
Dismissal fees ‐0,4 ‐0,5
Legal fees ‐0,1 ‐0,4
Expansion costs ‐0,4 0,0
Gain / Loss on disposal PPE 0,0 ‐0,1
Other 0,0 ‐0,1
EBITDA ‐0,9 ‐1,1
Provisions 0,5 0,1
Provisions 0,5 0,1
Income tax expense 0,6 0,3
Net impact of non‐current items 0,2 ‐0,7
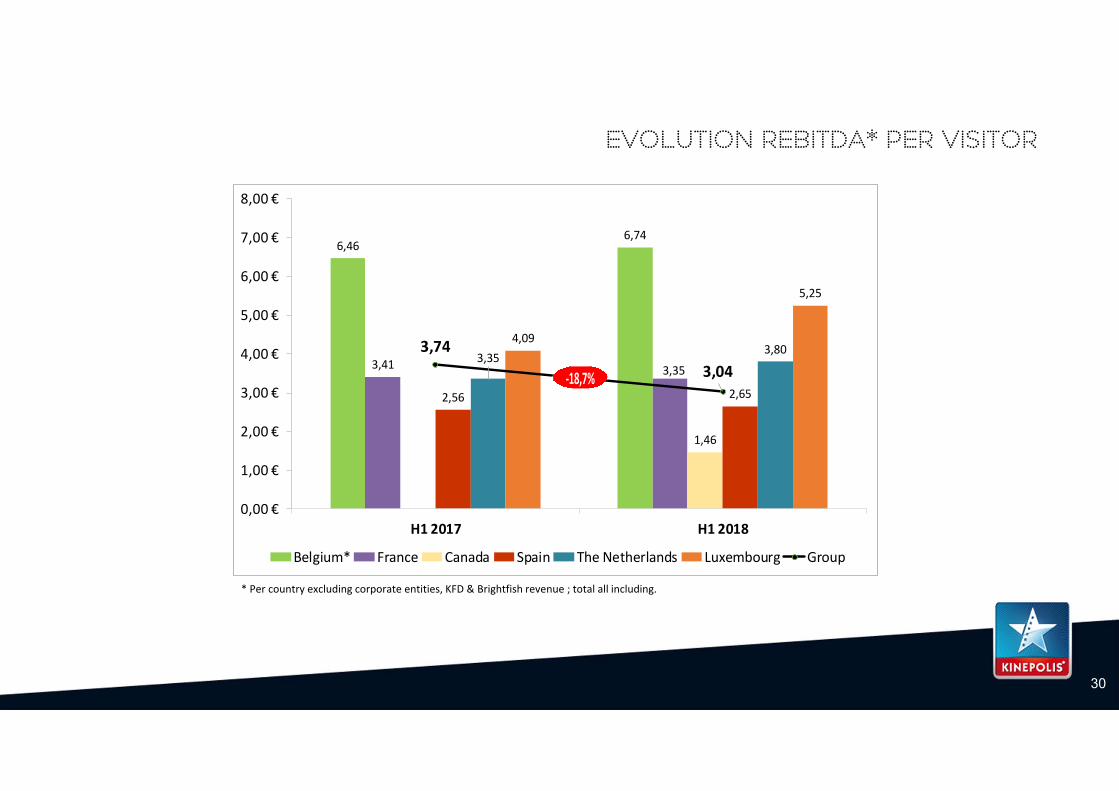
6,466,74
3,41 3,35
0,00
1,46
2,56 2,65
3,353,80
4,09
5,25
3,743,04
0,00 €
1,00 €
2,00 €
3,00 €
4,00 €
5,00 €
6,00 €
7,00 €
8,00 €
H1 2017 H1 2018
Belgium* France Canada Spain The Netherlands Luxembourg Group
‐18,7%
30
Evolution Rebitda* per visitor
* Per country excluding corporate entities, KFD & Brightfish revenue ; total all including.
31
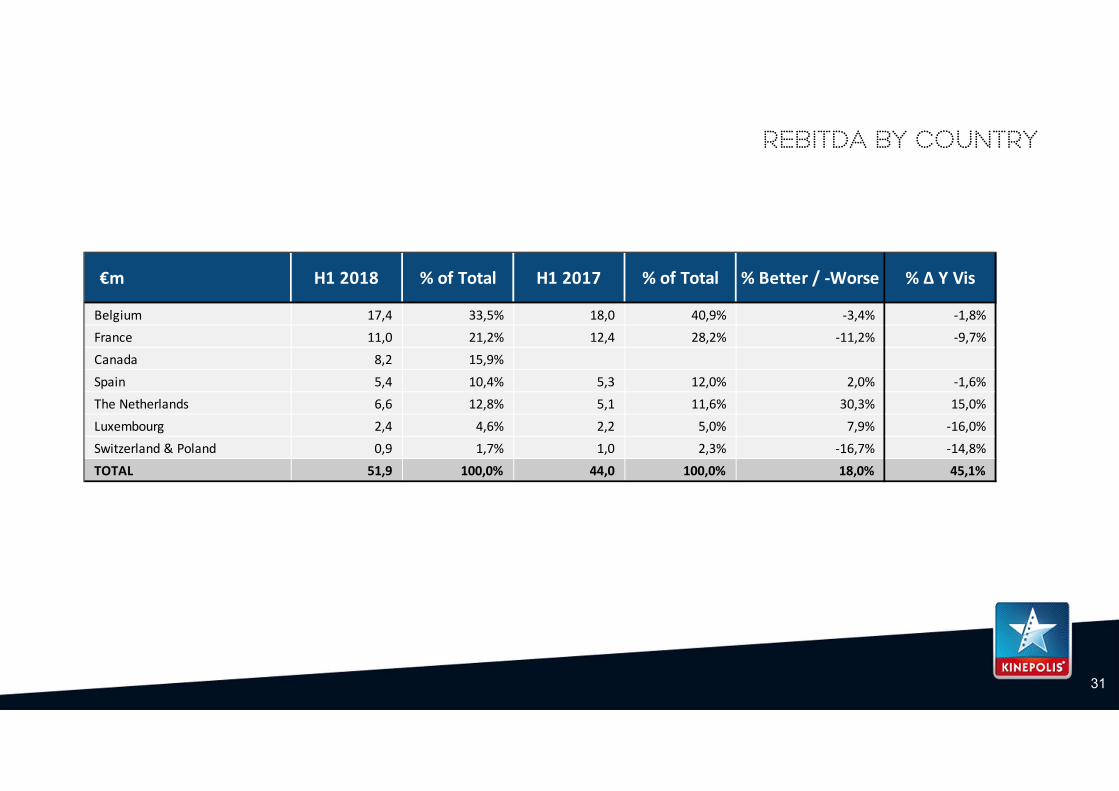
Rebitda by country
€m H1 2018 % of Total H1 2017 % of Total % Better / ‐Worse % ∆ Y Vis
Belgium 17,4 33,5% 18,0 40,9% ‐3,4% ‐1,8%France 11,0 21,2% 12,4 28,2% ‐11,2% ‐9,7%
Canada 8,2 15,9% 0,0 0,0% 0,0% 0,0%
Spain 5,4 10,4% 5,3 12,0% 2,0% ‐1,6%The Netherlands 6,6 12,8% 5,1 11,6% 30,3% 15,0%
Luxembourg 2,4 4,6% 2,2 5,0% 7,9% ‐16,0%Switzerland & Poland 0,9 1,7% 1,0 2,3% ‐16,7% ‐14,8%
TOTAL 51,9 100,0% 44,0 100,0% 18,0% 45,1%
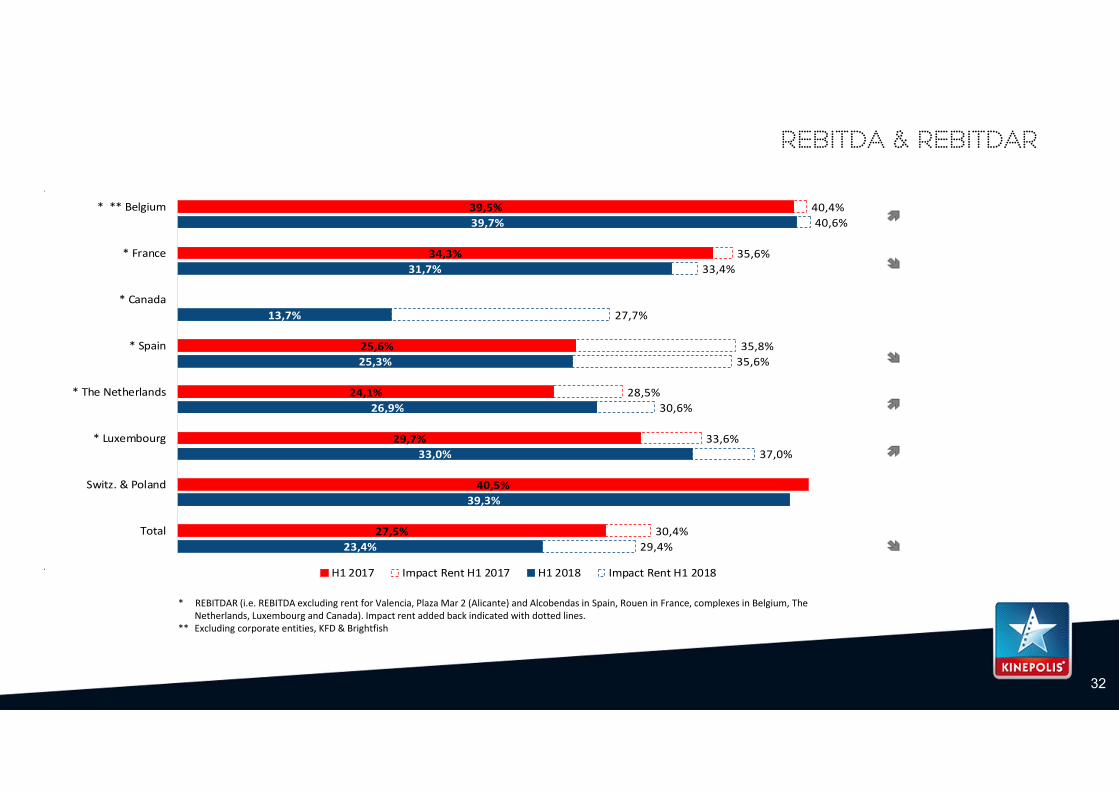
* REBITDAR (i.e. REBITDA excluding rent for Valencia, Plaza Mar 2 (Alicante) and Alcobendas in Spain, Rouen in France, complexes in Belgium, The Netherlands, Luxembourg and Canada). Impact rent added back indicated with dotted lines.
** Excluding corporate entities, KFD & Brightfish
32
Rebitda & REBITDAR
#DIV/0!
39,5%
34,3%
25,6%
24,1%
29,7%
40,5%
27,5%
39,7%
31,7%
13,7%
25,3%
26,9%
33,0%
39,3%
23,4%
40,6%
33,4%
27,7%
35,6%
30,6%
37,0%
29,4%
40,4%
35,6%
35,8%
28,5%
33,6%
30,4%
* ** Belgium
* France
* Canada
* Spain
* The Netherlands
* Luxembourg
Switz. & Poland
Total
H1 2017 Impact Rent H1 2017 H1 2018 Impact Rent H1 2018
IFRS 16
• The new standard (IFRS 16 ‐ Leases) becomes effective as from the 1st of January 2019.
• This standard has a major impact on the accounting treatment of leases:• The balance sheet will grow due to the fact that all material leases will be booked on the asset and
liability side of the Balance Sheet. • For the Income statement, only the service component of a lease will stay above EBITDA and the
other components will be reported under the EBITDA, respectively under the lines depreciations and interest expenses.
• All this will influence many financial ratios, but no impact on financial covenants.
• Kinepolis has performed an analysis on all its contracts for Europe and Canada. This analysis represents 306 contracts with a total impact of 26,4 MEUR on EBITDA, mainly real estate related. If chosen for the Cumulative catch‐up approach (Option 2B) assets and liabilities will increase with around 271 MEUR.
33

34
Depreciation, amortization, provisions
‐20‐18‐16‐14‐12‐10‐8‐6‐4‐20
H1 2017 Non‐current H12017
Current H1 2017 Normaldiff's*
Current H1 2018 Non‐current H12018
H1 2018
‐14,7 0,1 ‐14,8
‐3,5 ‐18,3 0,5 ‐17,8
€m
* € ‐3,5 M of which € ‐3,1 M is related to Canada.
35
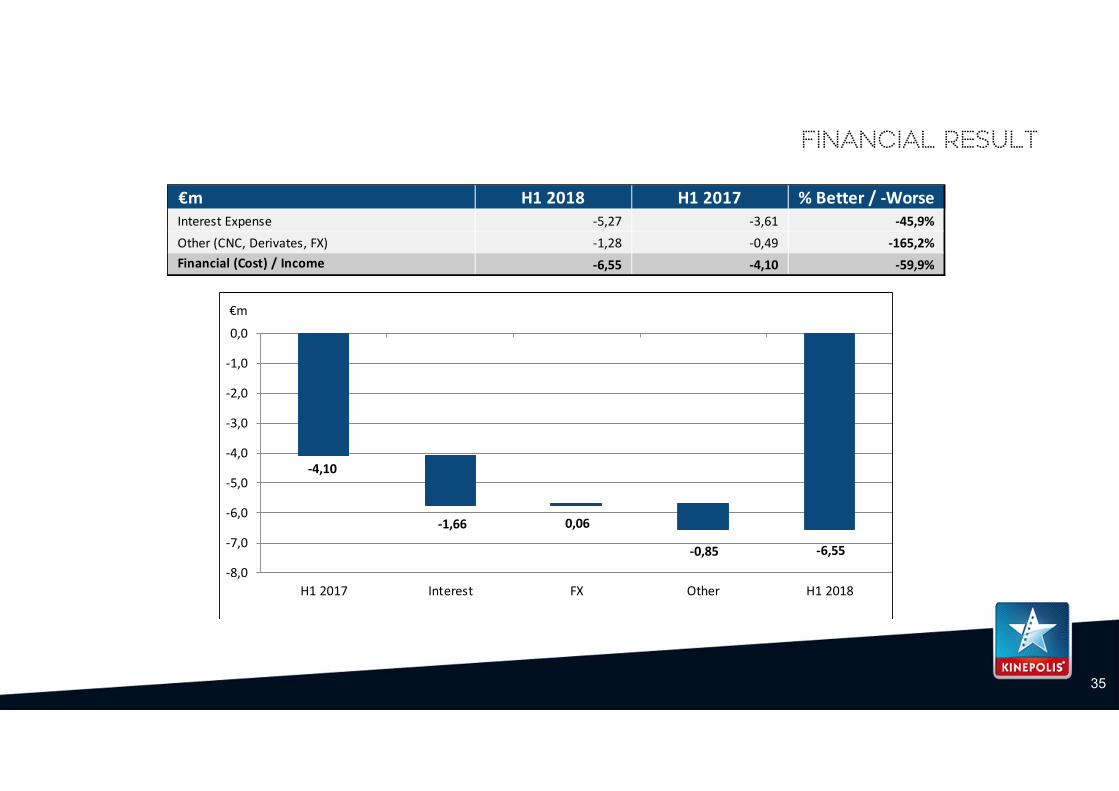
Financial result
€m H1 2018 H1 2017 % Better / ‐WorseInterest Expense ‐5,27 ‐3,61 ‐45,9%Other (CNC, Derivates, FX) ‐1,28 ‐0,49 ‐165,2%Financial (Cost) / Income ‐6,55 ‐4,10 ‐59,9%
‐4,10
‐1,66 0,06
‐0,85 ‐6,55
‐8,0
‐7,0
‐6,0
‐5,0
‐4,0
‐3,0
‐2,0
‐1,0
0,0
H1 2017 Interest FX Other H1 2018
€m

36
taxes
€m H1 2018 H1 2017 % Better / ‐WorseProfit before taxes 26,7 24,1 10,7%
Taxes ‐7,8 ‐8,4 6,6%Profit 18,9 15,8 19,8%Effective Tax Rate ('ETR') 29,2% 34,6% ‐540 bps
Tax effect on non‐current items ‐0,6 ‐0,3 113,7%Current Effective Tax Rate ('CETR') 31,0% 34,4% ‐339 bps
‐8,4 ‐0,3 ‐8,6 ‐0,6‐0,1 ‐0,3 0,9
0,3‐8,4 0,6
‐7,8
‐12
‐10
‐8
‐6
‐4
‐2
0
H1 2017 Non‐currentH1 2017
Current H12017
Higher pre‐taxresult
NID No DTA on BF& KFD
Tax rate BE Tax rate othercountries
Current H12018
Non‐currentH1 2018
H1 2018
€m
ETR34,6%
CETR34,4%
CETR31%
ETR29,2%
37
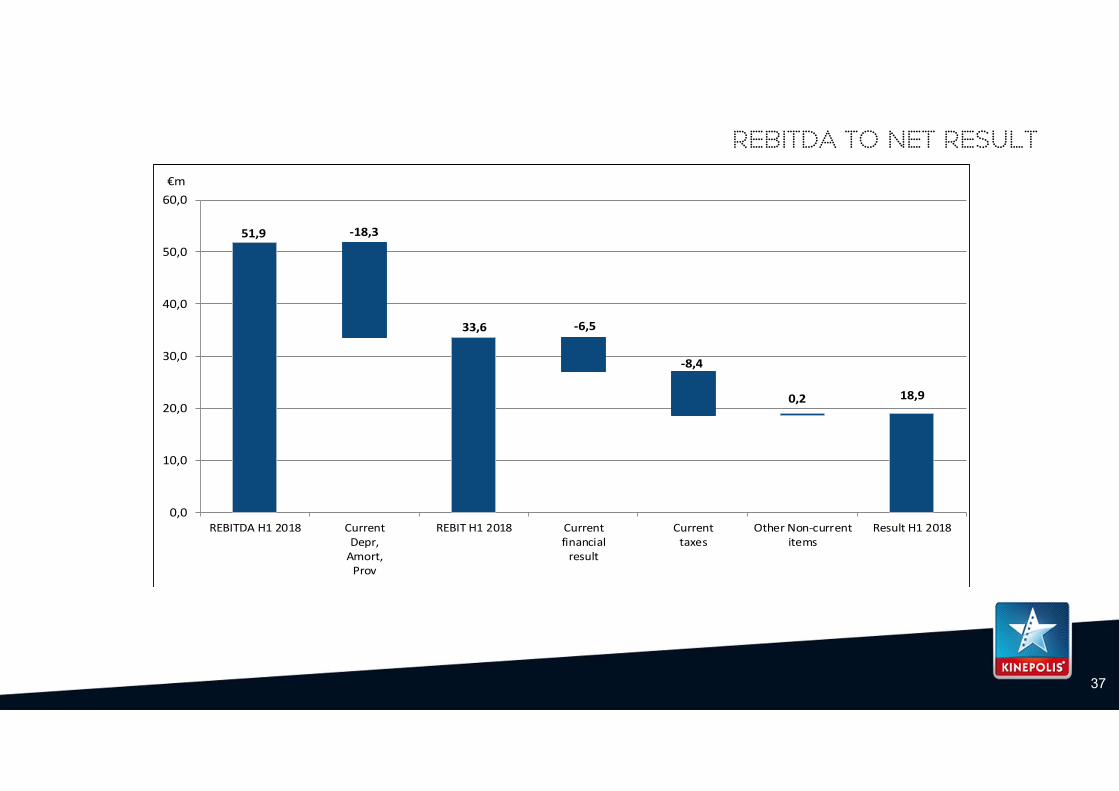
Rebitda to net result
0,0
10,0
20,0
30,0
40,0
50,0
60,0
REBITDA H1 2018 CurrentDepr,Amort,Prov
REBIT H1 2018 Currentfinancialresult
Currenttaxes
Other Non‐currentitems
Result H1 2018
51,9 ‐18,3
33,6 ‐6,5
‐8,4
0,2 18,9
€m
38
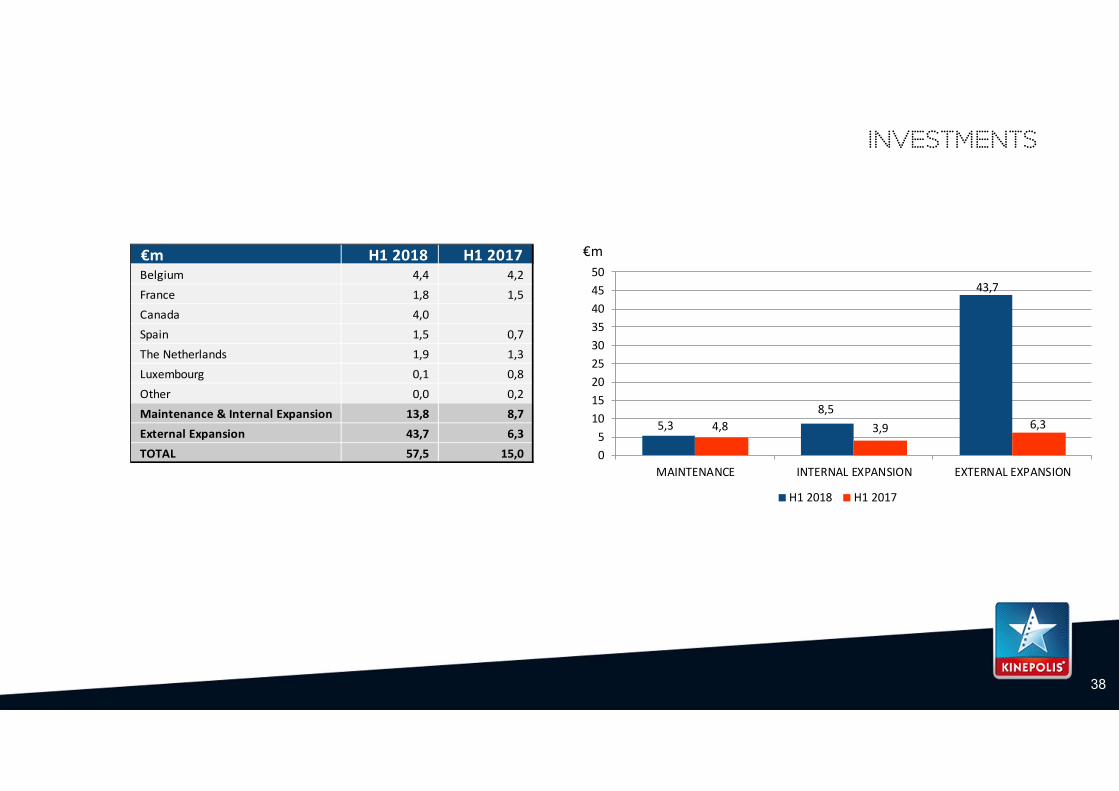
investments
€m H1 2018 H1 2017Belgium 4,4 4,2
France 1,8 1,5
Canada 4,0 0,0Spain 1,5 0,7
The Netherlands 1,9 1,3
Luxembourg 0,1 0,8
Other 0,0 0,2
Maintenance & Internal Expansion 13,8 8,7
External Expansion 43,7 6,3
TOTAL 57,5 15,0
5,38,5
43,7
4,8 3,9 6,3
05
101520253035404550
MAINTENANCE INTERNAL EXPANSION EXTERNAL EXPANSION
H1 2018 H1 2017
€m
39
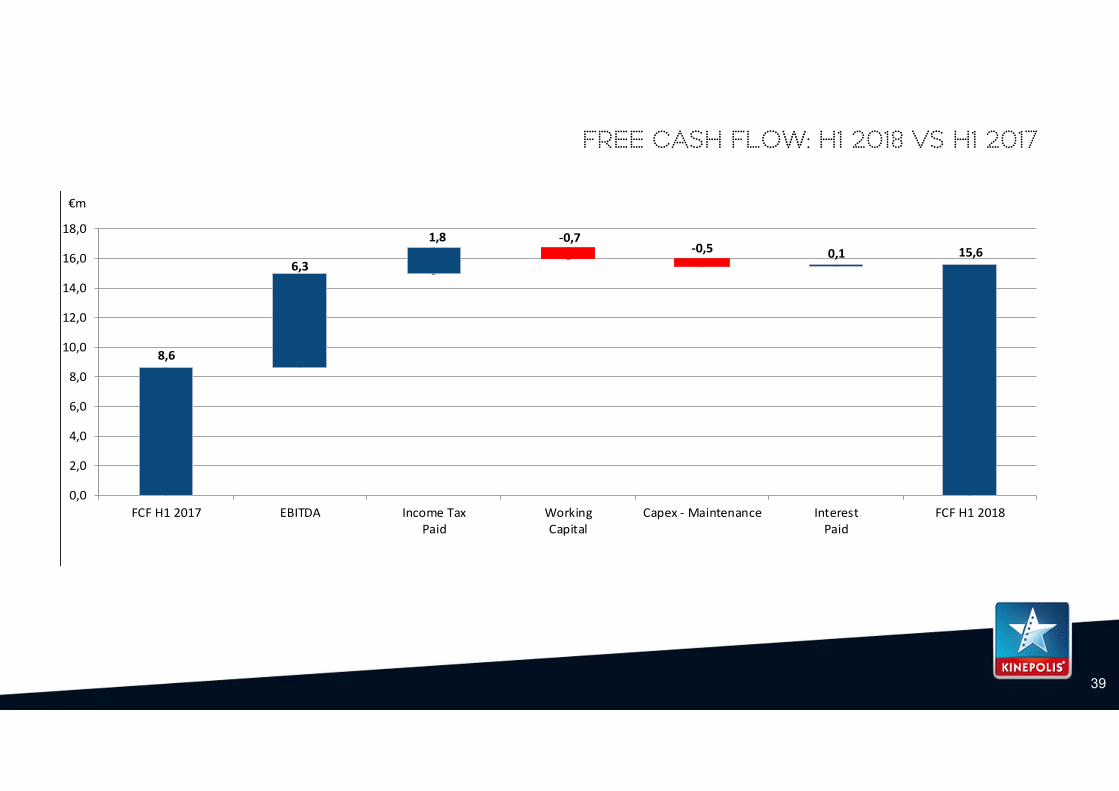
Free cash flow: H1 2018 vs H1 2017
8,6
6,3
1,8 ‐0,7‐0,5 0,1 15,6
0,0
2,0
4,0
6,0
8,0
10,0
12,0
14,0
16,0
18,0
FCF H1 2017 EBITDA Income TaxPaid
WorkingCapital
Capex ‐ Maintenance InterestPaid
FCF H1 2018
€m
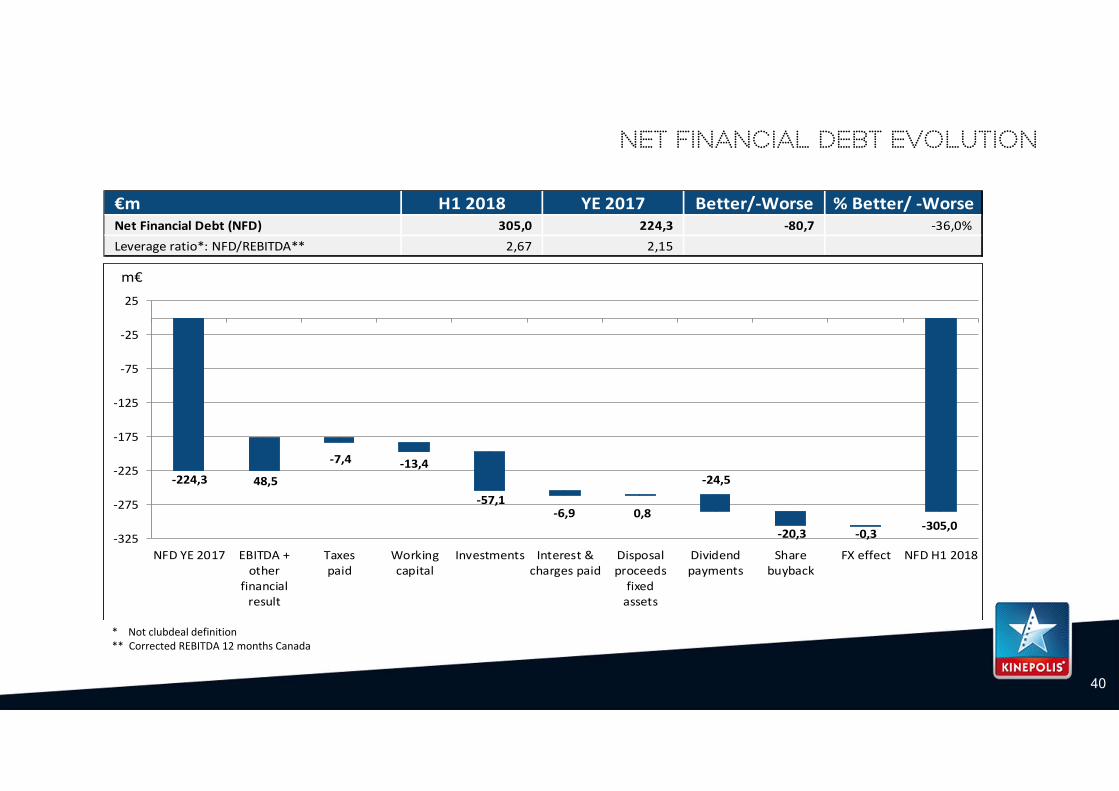
‐224,3 48,5
‐7,4 ‐13,4
‐57,1‐6,9 0,8
‐24,5
‐20,3 ‐0,3‐305,0
‐325
‐275
‐225
‐175
‐125
‐75
‐25
25
NFD YE 2017 EBITDA +other
financialresult
Taxespaid
Workingcapital
Investments Interest &charges paid
Disposalproceedsfixedassets
Dividendpayments
Sharebuyback
FX effect NFD H1 2018
m€
40
* Not clubdeal definition** Corrected REBITDA 12 months Canada
Net financial debt evolution
€m H1 2018 YE 2017 Better/‐Worse % Better/ ‐WorseNet Financial Debt (NFD) 305,0 224,3 ‐80,7 ‐36,0%Leverage ratio*: NFD/REBITDA** 2,67 2,15
0,0
0,5
1,0
1,5
2,0
2,5
3,0
3,5
€ 0
€ 50
€ 100
€ 150
€ 200
€ 250
€ 300
€ 350
H1 2018YE 2017YE 2016YE 2015YE 2014
€m
REBITDA Net Financial Debt (NFD) NFD/REBITDA
41
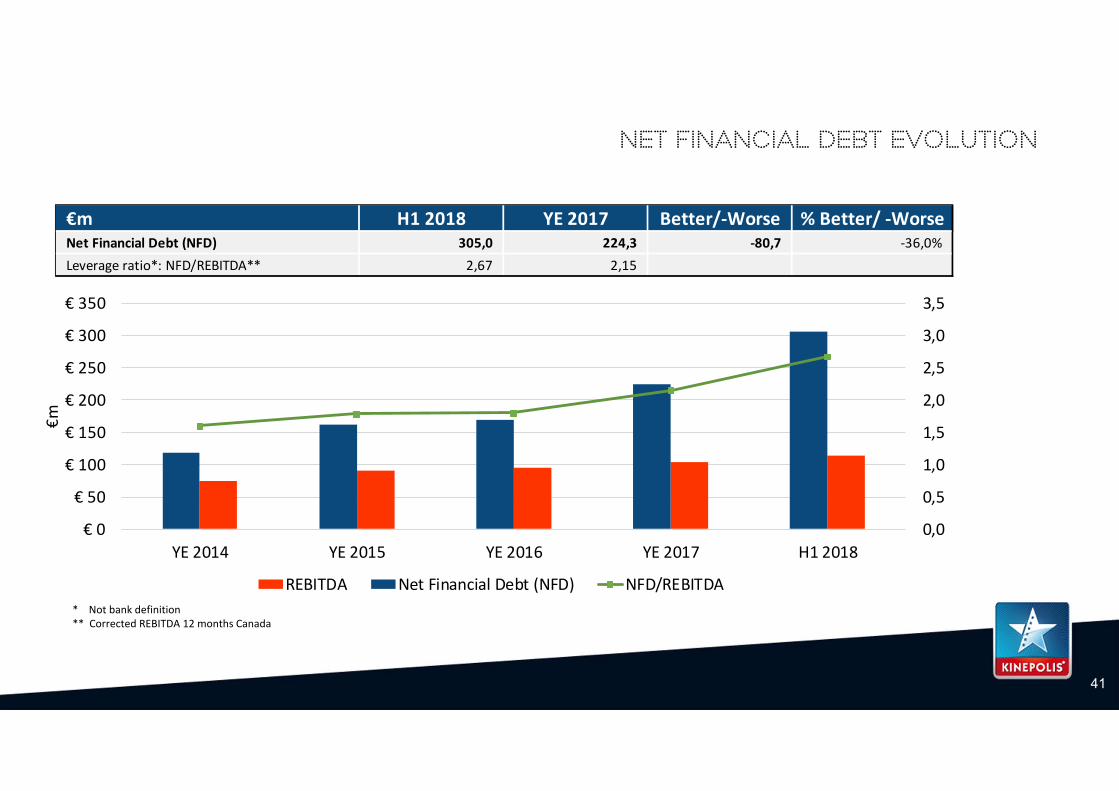
net financial debt evolution
* Not bank definition** Corrected REBITDA 12 months Canada
€m H1 2018 YE 2017 Better/‐Worse % Better/ ‐WorseNet Financial Debt (NFD) 305,0 224,3 ‐80,7 ‐36,0%Leverage ratio*: NFD/REBITDA** 2,67 2,15
42
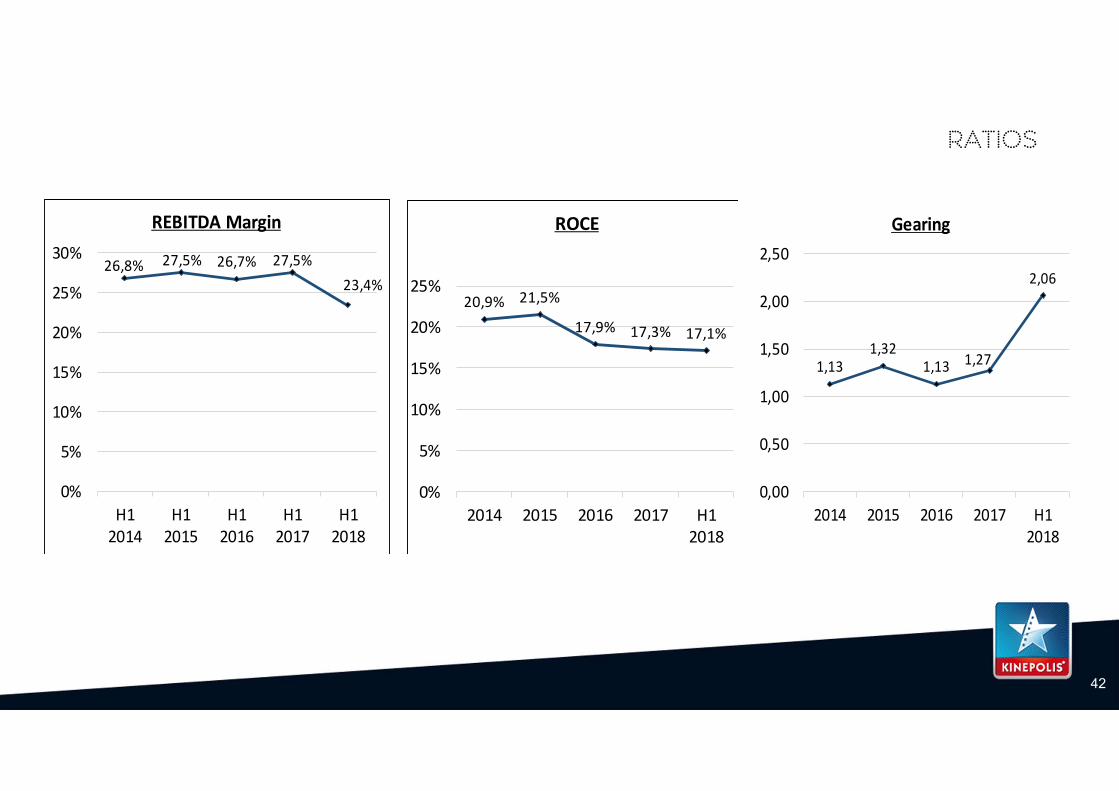
ratios
2,06
1,271,131,32
1,13
0,00
0,50
1,00
1,50
2,00
2,50
H12018
2017201620152014
Gearing
17,1%17,3%17,9%
21,5%20,9%
0%
5%
10%
15%
20%
25%
H12018
2017201620152014
ROCE
23,4%27,5%26,7%27,5%26,8%
0%
5%
10%
15%
20%
25%
30%
H12018
H12017
H12016
H12015
H12014
REBITDA Margin
43
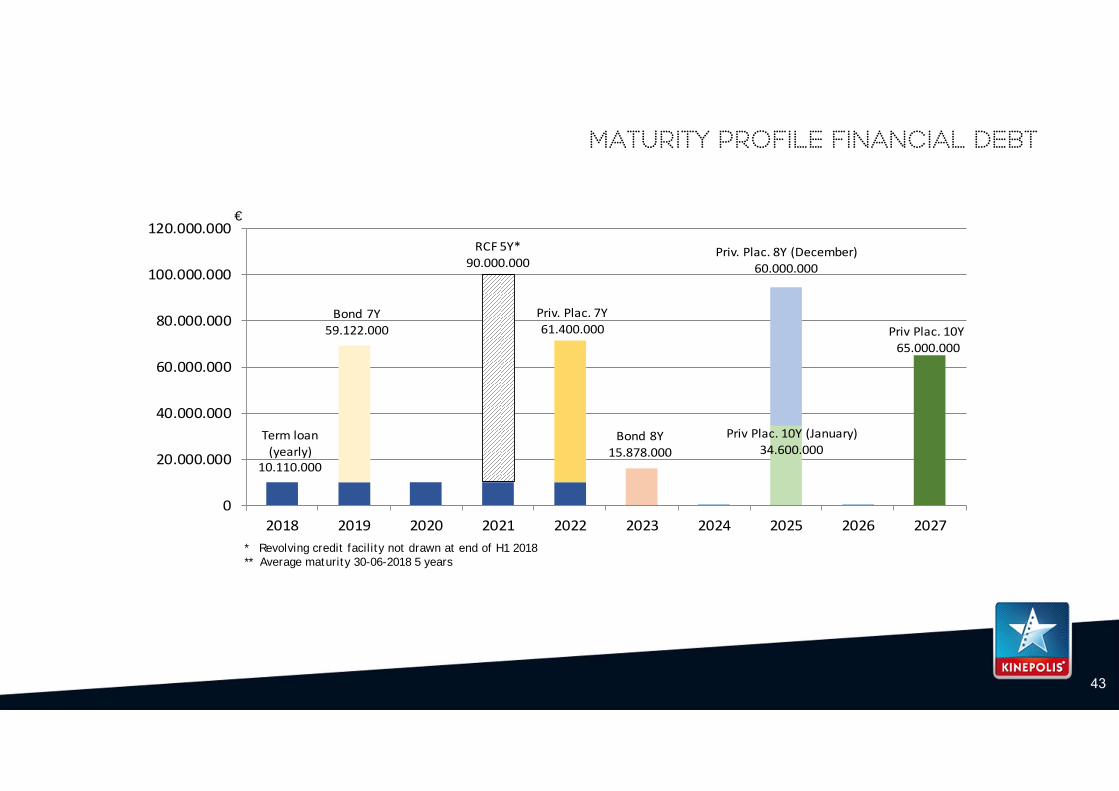
Maturity profile financial debt
Term loan(yearly)
10.110.000
Bond 7Y59.122.000
RCF 5Y*90.000.000
Priv. Plac. 7Y61.400.000
Bond 8Y15.878.000
Priv Plac. 10Y (January)34.600.000
Priv. Plac. 8Y (December)60.000.000
Priv Plac. 10Y65.000.000
0
20.000.000
40.000.000
60.000.000
80.000.000
100.000.000
120.000.000
2018 2019 2020 2021 2022 2023 2024 2025 2026 2027
€
* Revolving credit facility not drawn at end of H1 2018** Average maturity 30-06-2018 5 years
44
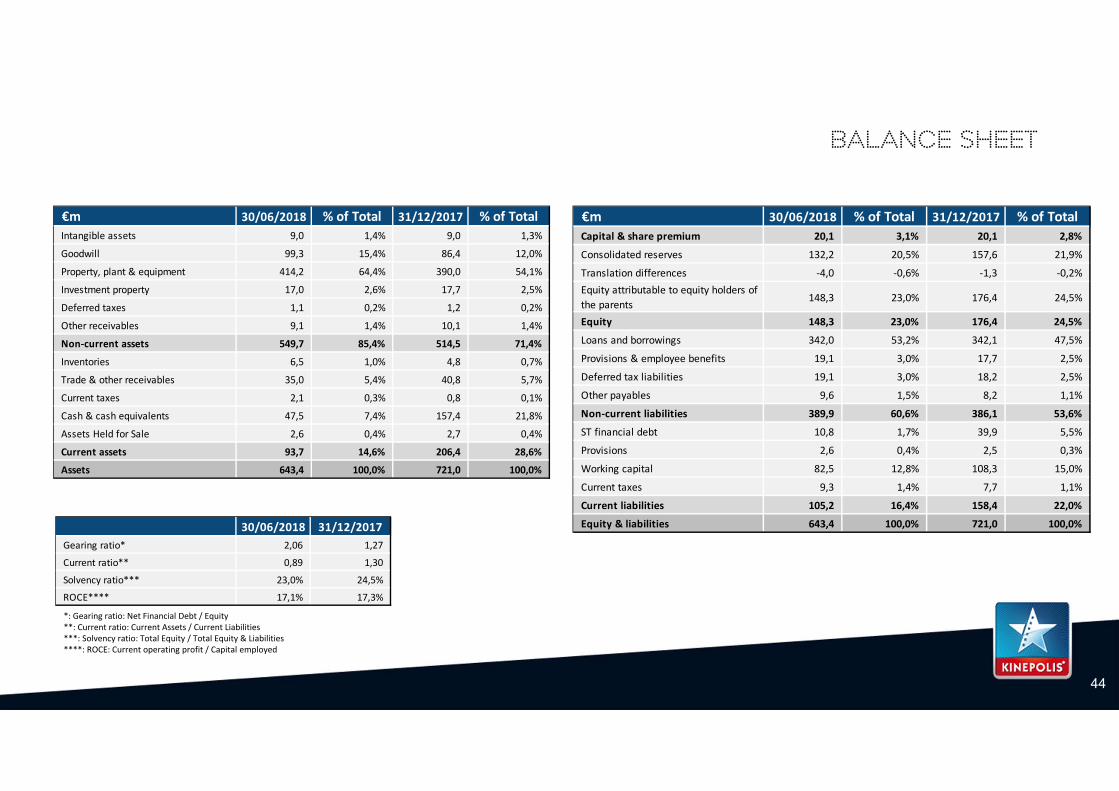
*: Gearing ratio: Net Financial Debt / Equity**: Current ratio: Current Assets / Current Liabilities***: Solvency ratio: Total Equity / Total Equity & Liabilities****: ROCE: Current operating profit / Capital employed
Balance sheet
30/06/2018 31/12/2017Gearing ratio* 2,06 1,27
Current ratio** 0,89 1,30
Solvency ratio*** 23,0% 24,5%
ROCE**** 17,1% 17,3%
€m 30/06/2018 % of Total 31/12/2017 % of TotalCapital & share premium 20,1 3,1% 20,1 2,8%
Consolidated reserves 132,2 20,5% 157,6 21,9%
Translation differences ‐4,0 ‐0,6% ‐1,3 ‐0,2%Equity attributable to equity holders of the parents 148,3 23,0% 176,4 24,5%
Equity 148,3 23,0% 176,4 24,5%
Loans and borrowings 342,0 53,2% 342,1 47,5%
Provisions & employee benefits 19,1 3,0% 17,7 2,5%
Deferred tax liabilities 19,1 3,0% 18,2 2,5%
Other payables 9,6 1,5% 8,2 1,1%
Non‐current liabilities 389,9 60,6% 386,1 53,6%
ST financial debt 10,8 1,7% 39,9 5,5%
Provisions 2,6 0,4% 2,5 0,3%
Working capital 82,5 12,8% 108,3 15,0%
Current taxes 9,3 1,4% 7,7 1,1%
Current liabilities 105,2 16,4% 158,4 22,0%
Equity & liabilities 643,4 100,0% 721,0 100,0%
€m 30/06/2018 % of Total 31/12/2017 % of TotalIntangible assets 9,0 1,4% 9,0 1,3%
Goodwill 99,3 15,4% 86,4 12,0%
Property, plant & equipment 414,2 64,4% 390,0 54,1%
Investment property 17,0 2,6% 17,7 2,5%
Deferred taxes 1,1 0,2% 1,2 0,2%
Other receivables 9,1 1,4% 10,1 1,4%
Non‐current assets 549,7 85,4% 514,5 71,4%
Inventories 6,5 1,0% 4,8 0,7%
Trade & other receivables 35,0 5,4% 40,8 5,7%
Current taxes 2,1 0,3% 0,8 0,1%
Cash & cash equivalents 47,5 7,4% 157,4 21,8%
Assets Held for Sale 2,6 0,4% 2,7 0,4%
Current assets 93,7 14,6% 206,4 28,6%
Assets 643,4 100,0% 721,0 100,0%
shareholders
45
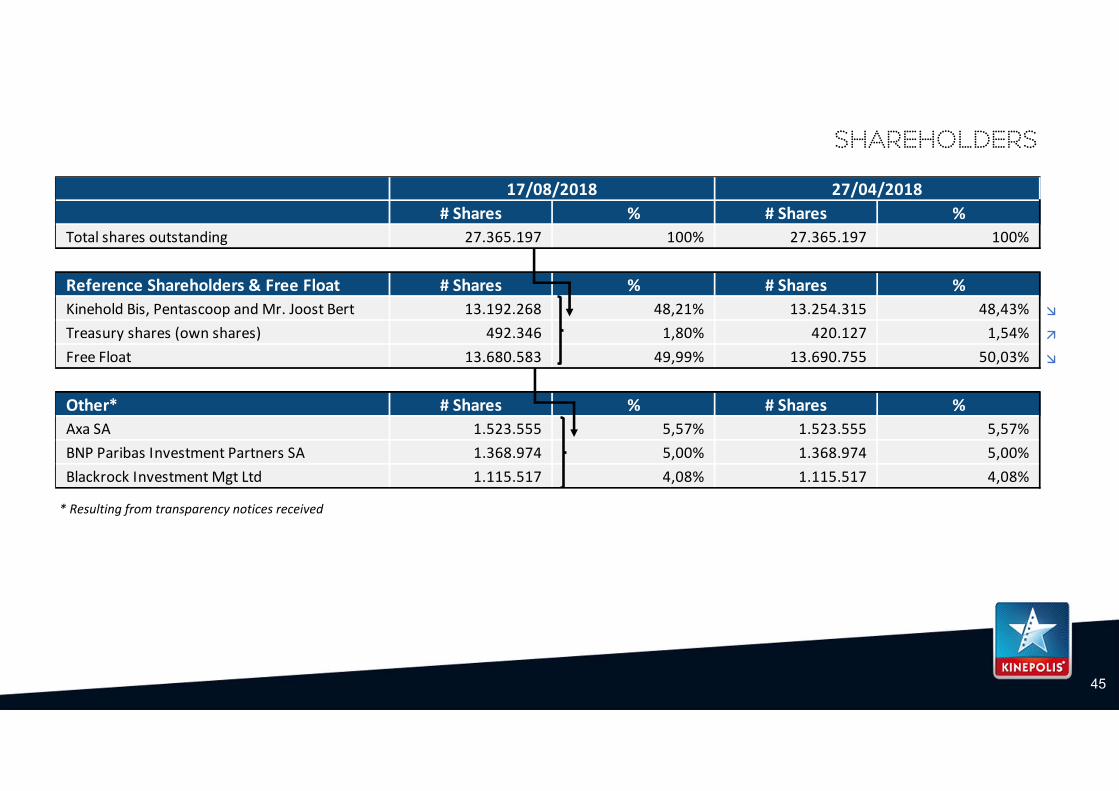
* Resulting from transparency notices received
# Shares % # Shares % Total shares outstanding 27.365.197 100% 27.365.197 100%
Reference Shareholders & Free Float # Shares % # Shares % Kinehold Bis, Pentascoop and Mr. Joost Bert 13.192.268 48,21% 13.254.315 48,43%
Treasury shares (own shares) 492.346 1,80% 420.127 1,54%
Free Float 13.680.583 49,99% 13.690.755 50,03%
Other* # Shares % # Shares % Axa SA 1.523.555 5,57% 1.523.555 5,57%BNP Paribas Investment Partners SA 1.368.974 5,00% 1.368.974 5,00%Blackrock Investment Mgt Ltd 1.115.517 4,08% 1.115.517 4,08%
27/04/201817/08/2018
46
Financial calendar
Thursday 15/11/2018 Business update Q3 2018
Thursday 21/02/2019 Annual results 2018Press & analyst meeting
Wednesday 08/05/2019 General Meeting Kinepolis Group
Q & A
Thank you
AnnexesResults YTD H1 2018
49
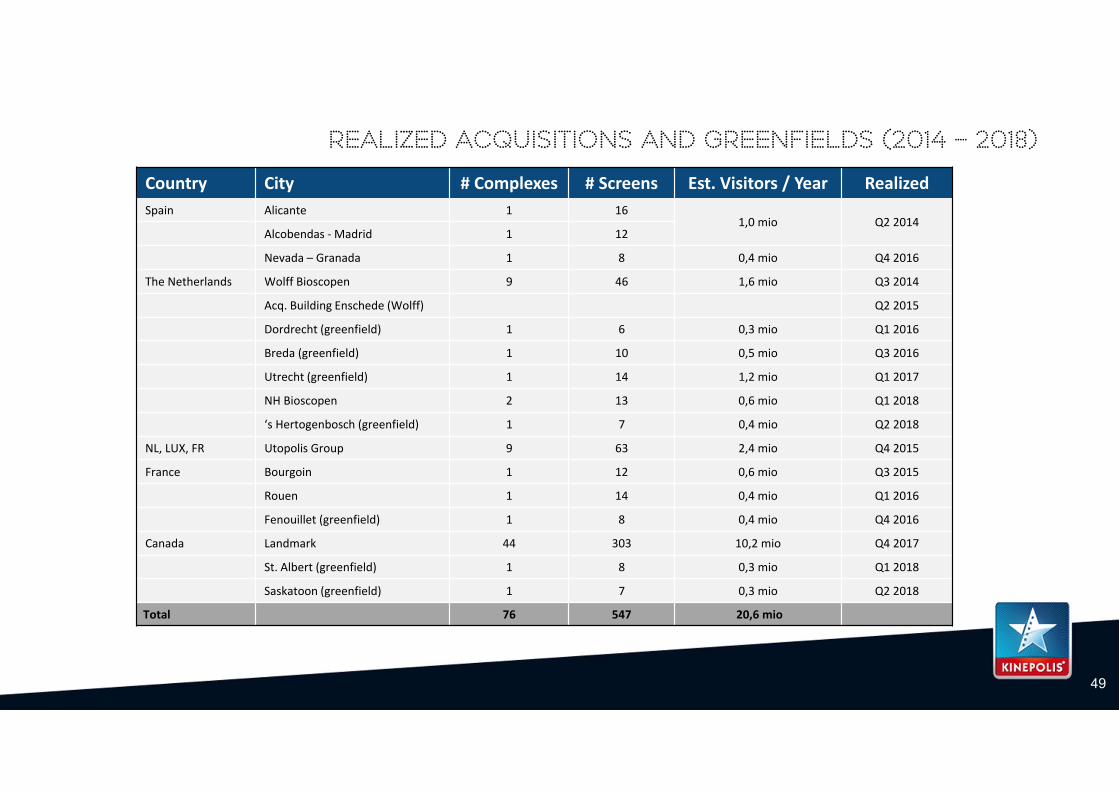
REALIZED ACQUISITIONS AND greenfields (2014 – 2018)
Country City # Complexes # Screens Est. Visitors / Year RealizedSpain Alicante 1 16
1,0 mio Q2 2014Alcobendas ‐ Madrid 1 12
Nevada – Granada 1 8 0,4 mio Q4 2016
The Netherlands Wolff Bioscopen 9 46 1,6 mio Q3 2014
Acq. Building Enschede (Wolff) Q2 2015
Dordrecht (greenfield) 1 6 0,3 mio Q1 2016
Breda (greenfield) 1 10 0,5 mio Q3 2016
Utrecht (greenfield) 1 14 1,2 mio Q1 2017
NH Bioscopen 2 13 0,6 mio Q1 2018
‘s Hertogenbosch (greenfield) 1 7 0,4 mio Q2 2018
NL, LUX, FR Utopolis Group 9 63 2,4 mio Q4 2015
France Bourgoin 1 12 0,6 mio Q3 2015
Rouen 1 14 0,4 mio Q1 2016
Fenouillet (greenfield) 1 8 0,4 mio Q4 2016
Canada Landmark 44 303 10,2 mio Q4 2017
St. Albert (greenfield) 1 8 0,3 mio Q1 2018
Saskatoon (greenfield) 1 7 0,3 mio Q2 2018
Total 76 547 20,6 mio
50
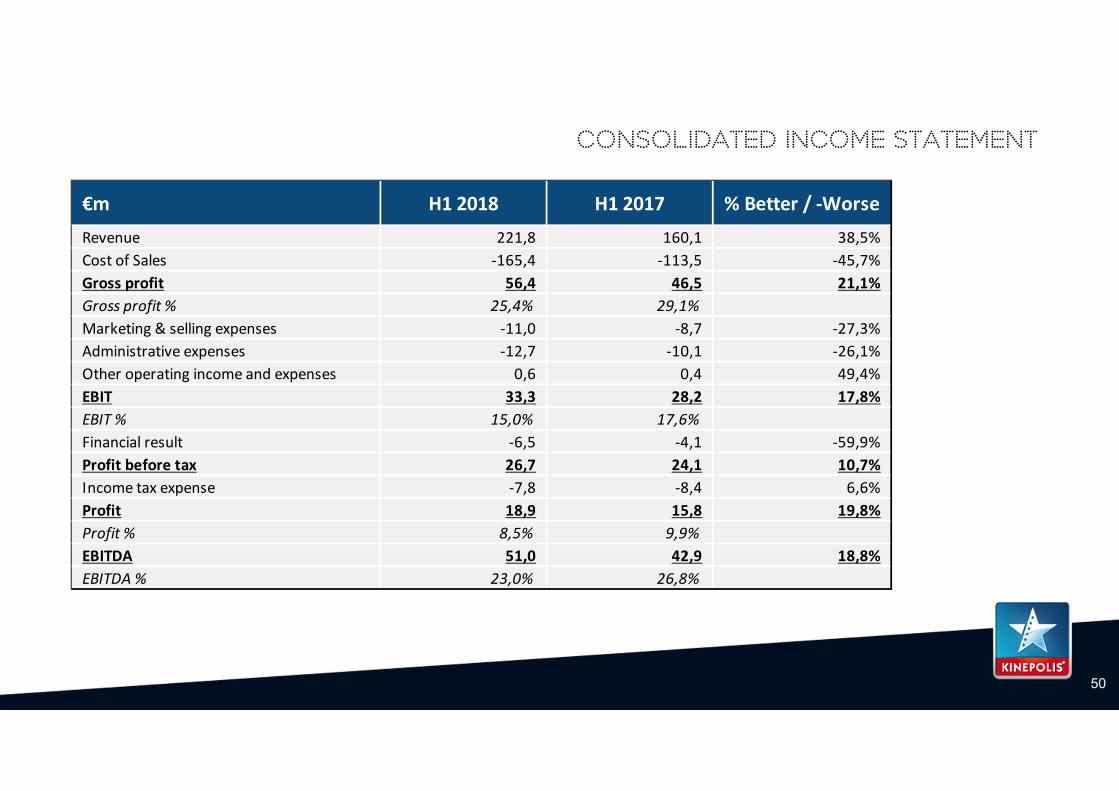
Consolidated income statement
€m H1 2018 H1 2017 % Better / ‐WorseRevenue 221,8 160,1 38,5%Cost of Sales ‐165,4 ‐113,5 ‐45,7%Gross profit 56,4 46,5 21,1%Gross profit % 25,4% 29,1%Marketing & selling expenses ‐11,0 ‐8,7 ‐27,3%Administrative expenses ‐12,7 ‐10,1 ‐26,1%Other operating income and expenses 0,6 0,4 49,4%EBIT 33,3 28,2 17,8%EBIT % 15,0% 17,6%Financial result ‐6,5 ‐4,1 ‐59,9%Profit before tax 26,7 24,1 10,7%Income tax expense ‐7,8 ‐8,4 6,6%Profit 18,9 15,8 19,8%Profit % 8,5% 9,9%EBITDA 51,0 42,9 18,8%EBITDA % 23,0% 26,8%
51
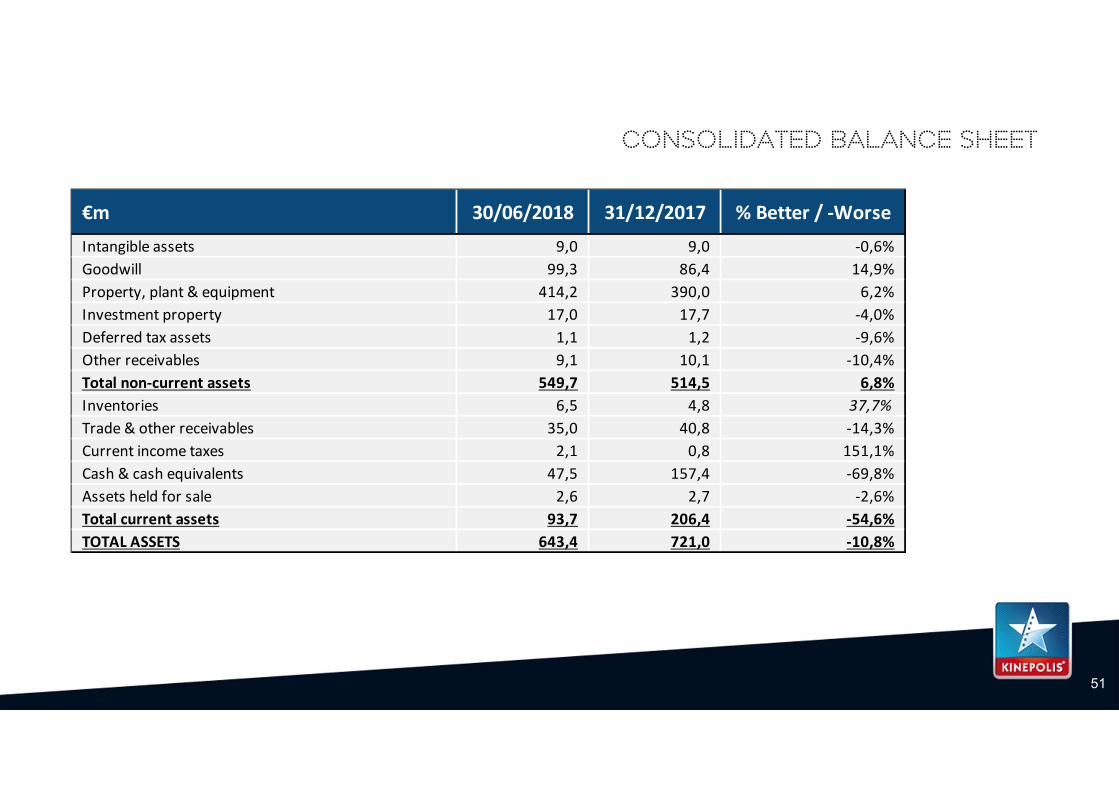
Consolidated balance sheet
€m 30/06/2018 31/12/2017 % Better / ‐WorseIntangible assets 9,0 9,0 ‐0,6%Goodwill 99,3 86,4 14,9%Property, plant & equipment 414,2 390,0 6,2%Investment property 17,0 17,7 ‐4,0%Deferred tax assets 1,1 1,2 ‐9,6%Other receivables 9,1 10,1 ‐10,4%Total non‐current assets 549,7 514,5 6,8%Inventories 6,5 4,8 37,7%Trade & other receivables 35,0 40,8 ‐14,3%Current income taxes 2,1 0,8 151,1%Cash & cash equivalents 47,5 157,4 ‐69,8%Assets held for sale 2,6 2,7 ‐2,6%Total current assets 93,7 206,4 ‐54,6%TOTAL ASSETS 643,4 721,0 ‐10,8%
52
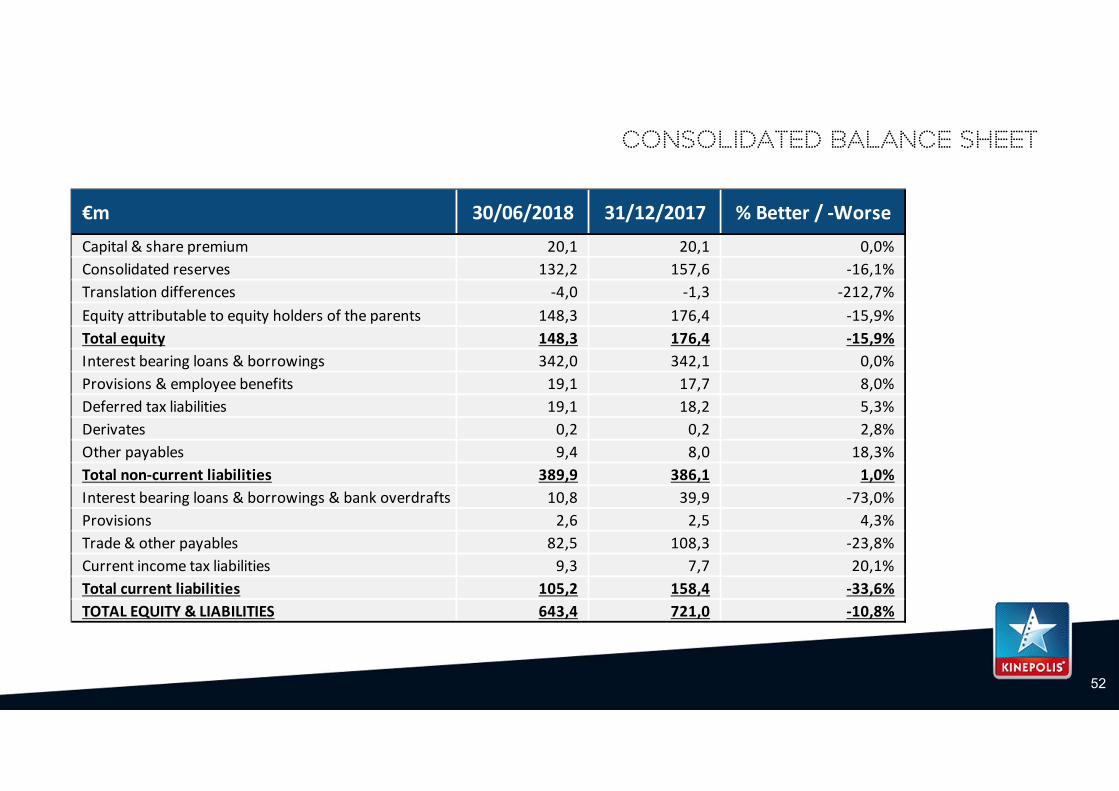
Consolidated balance sheet
€m 30/06/2018 31/12/2017 % Better / ‐WorseCapital & share premium 20,1 20,1 0,0%Consolidated reserves 132,2 157,6 ‐16,1%Translation differences ‐4,0 ‐1,3 ‐212,7%Equity attributable to equity holders of the parents 148,3 176,4 ‐15,9%Total equity 148,3 176,4 ‐15,9%Interest bearing loans & borrowings 342,0 342,1 0,0%Provisions & employee benefits 19,1 17,7 8,0%Deferred tax liabilities 19,1 18,2 5,3%Derivates 0,2 0,2 2,8%Other payables 9,4 8,0 18,3%Total non‐current liabilities 389,9 386,1 1,0%Interest bearing loans & borrowings & bank overdrafts 10,8 39,9 ‐73,0%Provisions 2,6 2,5 4,3%Trade & other payables 82,5 108,3 ‐23,8%Current income tax liabilities 9,3 7,7 20,1%Total current liabilities 105,2 158,4 ‐33,6%TOTAL EQUITY & LIABILITIES 643,4 721,0 ‐10,8%
53
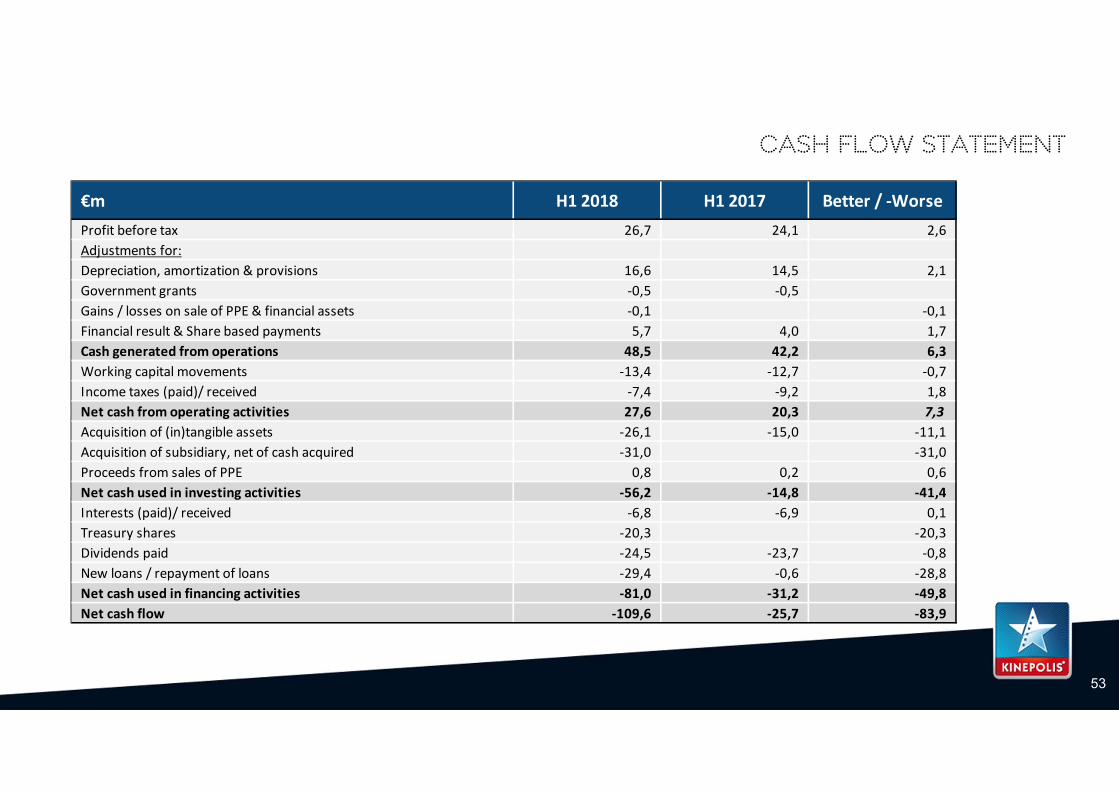
Cash flow statement
€m H1 2018 H1 2017 Better / ‐WorseProfit before tax 26,7 24,1 2,6Adjustments for:Depreciation, amortization & provisions 16,6 14,5 2,1Government grants ‐0,5 ‐0,5 0,0Gains / losses on sale of PPE & financial assets ‐0,1 0,0 ‐0,1Financial result & Share based payments 5,7 4,0 1,7Cash generated from operations 48,5 42,2 6,3Working capital movements ‐13,4 ‐12,7 ‐0,7Income taxes (paid)/ received ‐7,4 ‐9,2 1,8Net cash from operating activities 27,6 20,3 7,3Acquisition of (in)tangible assets ‐26,1 ‐15,0 ‐11,1Acquisition of subsidiary, net of cash acquired ‐31,0 0,0 ‐31,0Proceeds from sales of PPE 0,8 0,2 0,6Net cash used in investing activities ‐56,2 ‐14,8 ‐41,4Interests (paid)/ received ‐6,8 ‐6,9 0,1Treasury shares ‐20,3 0,0 ‐20,3Dividends paid ‐24,5 ‐23,7 ‐0,8New loans / repayment of loans ‐29,4 ‐0,6 ‐28,8Net cash used in financing activities ‐81,0 ‐31,2 ‐49,8Net cash flow ‐109,6 ‐25,7 ‐83,9
54
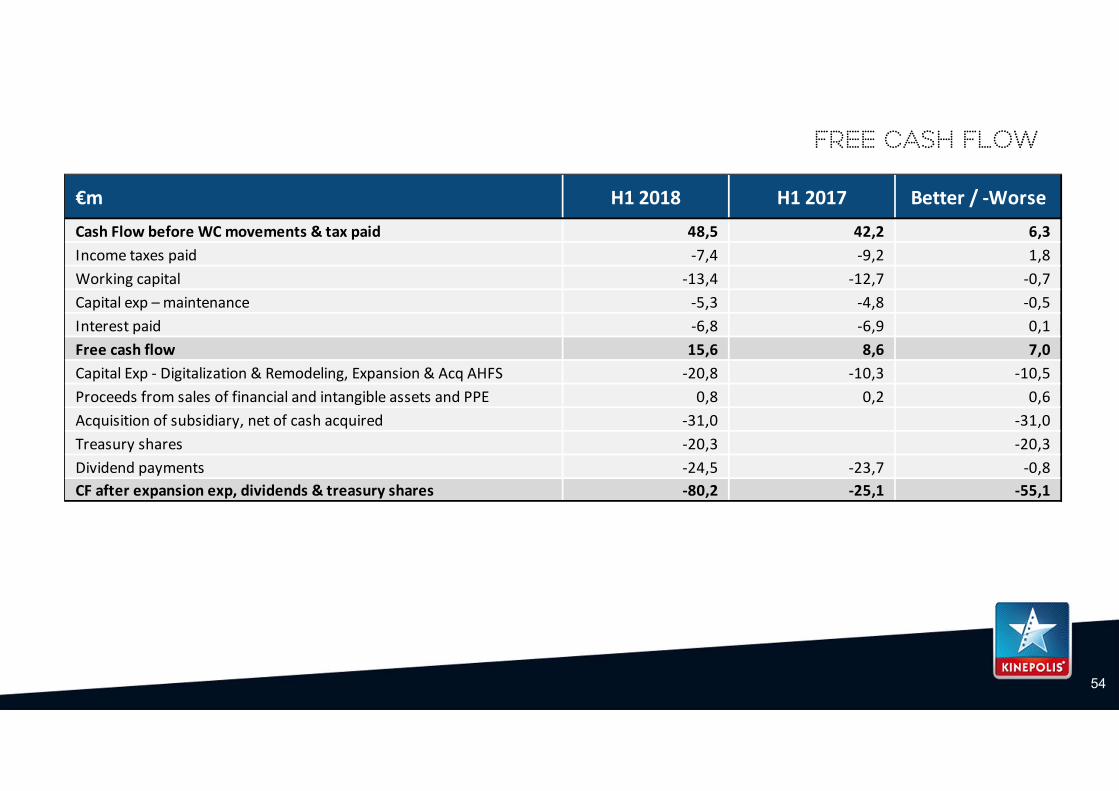
Free cash flow
€m H1 2018 H1 2017 Better / ‐WorseCash Flow before WC movements & tax paid 48,5 42,2 6,3Income taxes paid ‐7,4 ‐9,2 1,8Working capital ‐13,4 ‐12,7 ‐0,7Capital exp – maintenance ‐5,3 ‐4,8 ‐0,5Interest paid ‐6,8 ‐6,9 0,1Free cash flow 15,6 8,6 7,0Capital Exp ‐ Digitalization & Remodeling, Expansion & Acq AHFS ‐20,8 ‐10,3 ‐10,5Proceeds from sales of financial and intangible assets and PPE 0,8 0,2 0,6Acquisition of subsidiary, net of cash acquired ‐31,0 0,0 ‐31,0Treasury shares ‐20,3 0,0 ‐20,3Dividend payments ‐24,5 ‐23,7 ‐0,8CF after expansion exp, dividends & treasury shares ‐80,2 ‐25,1 ‐55,1


![83 - TreatyBody Internet - Hometbinternet.ohchr.org/Treaties/CERD/Shared Documents/M… · Web viewWord count : 18,2. 65) [June. 2017] ... review legal aid fees to attorneys and](https://img.pdfslide.us/doc/110x75/5a71a8117f8b9a9d538d1001/83-treatybody-internet-hometbinternetohchrorgtreatiescerdshared-documentsmdoc.jpg)