Embed Size (px)
Citation preview


GENERAL MITCHELL INTERNATIONAL AIRPORT PB AMERICAS, INC. MASTER PLAN UPDATE PAGE 2-1
2.0 INVENTORY OF EXISTING CONDITIONS
General Mitchell International Airport (GMIA) is the primary air carrier airport for
Milwaukee and Southeast Wisconsin. With 15 passenger airlines, the 440th Airlift Wing of
the US Air Force Reserves, the 128th Wing of the Wisconsin Air National Guard, and general
aviation, the Airport serves many facets of the region’s air transportation demand. In 2001,
the Airport handled approximately 2.8 million enplaned passengers, 102 million pounds of
air cargo, and 211,000 aircraft operations.
In order to establish a baseline for the Master Plan Update Study, an inventory was
conducted through a review of Airport records, field interviews, telephone discussions, and
an analysis of existing reports and studies. This information will be used throughout the
Master Plan Update Study as the need for future aviation facilities is determined and
alternative facility locations are examined. The inventory is presented in the following
sections:
Airport History
Airport Activity
Airport Facilities
Airport Environs
Socioeconomic Setting
Due to the dynamic nature of the Airport, a “snapshot” of the facilities as they existed
in January, 2002, is used. Facilities that were under construction at that time are identified as
well.
2.1 Airport History
GMIA is named in honor of General William “Billy” Mitchell, a military aviation
pioneer and Milwaukee native. In 1941, Milwaukee officially changed the name of the

GENERAL MITCHELL INTERNATIONAL AIRPORT PB AMERICAS, INC. MASTER PLAN UPDATE PAGE 2-2
Airport from Milwaukee County Airport to General Mitchell Field. This name was revised
to General Mitchell International Airport in 1986.
Although aviation had made its debut in Milwaukee several years earlier, the Airport
was established at its current site in 1926 when Milwaukee County purchased a small airport
from Thomas Hamilton for $150,000. A year later, in 1927, Northwest Airlines began
passenger air service to Chicago and Minneapolis from the new airport site.
The Works Progress Administration (WPA) constructed a new terminal building on
Layton Avenue that opened in 1941. Rapid growth in aviation made this terminal obsolete
by the early 1950s. In 1955, a new terminal was constructed on Howell Avenue in the area
that today’s terminal occupies. This three-concourse terminal included 23 gates and second
level aircraft loading.
The ticketing and baggage claim areas of the terminal were expanded between 1983
and 1985. At that time, the terminal configuration was redesigned to incorporate separate
curbfronts for arrivals and departures, as well as the second level concession mall. In 1990,
Concourse D was expanded by adding 16 gates across the end of the existing concourse. In
2002, the County expanded the Airport’s parking garage to provide approximately 3,000
additional public parking spaces as well as a lobby area for rental car counters. An eight-gate
addition to Concourse C is currently being designed.
Milwaukee County has continued to own and operate GMIA since 1926. Today, the
Aiport is governed by the County Executive and a Board of Supervisors consisting of 25
elected members. Organizationally, the Airport is a Division within the County’s
Department of Public Works. The Airport Director supervises the staff of approximately 175
employees who implement the County’s policies and conduct the day-to-day operations and
maintenance of both General Mitchell International and Timmerman Field.

GENERAL MITCHELL INTERNATIONAL AIRPORT PB AMERICAS, INC. MASTER PLAN UPDATE PAGE 2-3
2.2 Airport Activity
GMIA serves the primary commercial air transportation requirements of Milwaukee,
southeast Wisconsin, and portions of Northern Illinois. As shown on Exhibit 2.2-1 the
Airport is located entirely within Milwaukee County. It is approximately five miles south of
downtown Milwaukee.
GMIA averages 230 scheduled passenger departures per day and is served by 15
major/national and regional/commuter airlines: Air Canada, AirTran, Air Wisconsin (United
Express), American Eagle, America West, ATA Connection, COMAIR (Delta Connection),
Continental Express, Delta, Northwest, Midwest Express, Skyway (Midwest Express), US
Airways, and US Airways Express.
A summary of key airport activity indicators is provided in Table 2.2-1. Between
1990 and 2000, passenger enplanements increased from approximately 2.2 million to 3.0
million, representing an average annual growth rate of 3.2 percent. Passenger activity
declined in 2001 due mostly from the impact of September 11, to 2.8 million passenger
enplanements. Air cargo tonnage increased during this time period, from approximately 89.4
million pounds in 1990 to 126 million pounds in 2000.

GENERAL MITCHELL INTERNATIONAL AIRPORT PB AMERICAS, INC. MASTER PLAN UPDATE PAGE 2-4
TABLE 2.2-1
General Mitchell International Airport
HISTORICAL AIRPORT ACTIVITY
Year Passenger Enplanements Enplaned Cargo (pounds)1 Aircraft Operations 1990 2,213,672 - 89,471,401 - 206,669 - 1991 2,027,689 -8.4% 105,124,545 17.5% 203,242 -1.7% 1992 2,189,052 8.0% 99,074,331 -5.8% 203,030 -0.1% 1993 2,264,402 3.4% 103,579,577 4.5% 201,288 -0.9% 1994 2,563,293 13.2% 120,579,888 16.4% 215,889 7.3% 1995 2,593,359 1.2% 124,165,303 3.0% 204,781 -5.1% 1996 2,732,965 5.4% 129,385,158 4.2% 200,963 -1.9% 1997 2,804,596 2.6% 131,197,846 1.4% 212,609 5.8% 1998 2,790,837 -0.5% 142,476,818 8.6% 219,087 3.0% 1999 2,906,189 4.1% 139,022,866 -2.4% 221,866 1.3% 2000 3,039,962 4.6% 126,095,651 -9.3% 221,855 0.0% 2001 2,811,954 -7.5% 107,097,313 -15.1% 211,512 -4.7%
Source: Airport activity records Note: 1 Enplaned cargo=Air Freight+Air Mail


GENERAL MITCHELL INTERNATIONAL AIRPORT PB AMERICAS, INC. MASTER PLAN UPDATE PAGE 2-6
2.3 Airport Facilities
The Airport’s existing facilities were identified and documented in the inventory in
order to form a database for the airfield, terminal, air cargo, airport support, general aviation
and military components of the Master Plan Update Study. Due to the size and complexity
of the Airport’s facilities, the inventory effort distinguishes between airside facilities (i.e.
those facilities directly related to the landing and takeoff of aircraft) and landside facilities,
which are classified by their function (i.e. passenger terminal, air cargo, and support).
The Airport encompasses approximately 2,386 acres of relatively flat land within a
built-up urban environment. The official elevation of the Airport, based on the highest
runway elevation point, is 723 feet above mean sea level (MSL).
The Airport boundaries consist of: to the north, the Airport has a boundary along
Layton Avenue; to the east, the Airport is bounded by the Canadian Pacific railroad lines; to
the south, the Airport is bounded by College Avenue with Airport owned property lying
further south to Rawson Avenue; and to the west, the Airport is bounded by Howell Avenue
and the CP railroad line. Primary access to the Airport is via State Trunk Highway (STH)
119, the Airport Spur.
The Airport’s facilities, including any planned structures that were under engineering
design as of January, 2002, are shown on Exhibit 2.3-1. The major airport structures that are
located on Airport property are labeled on Exhibit 2.3-1.
Significant ground leases of Airport property are also shown in Exhibit 2.3-2.
Exhibit 2.3-3 lists the lessee, lease type (use), commencement and termination dates, and
other pertinent remarks for each of the land leases depicted in Exhibit 2.3-2. The numerous
FAA NAVAID leases, other minor ground leases, and ground access easements are not
depicted in Exhibit 2.3-2.


GENERAL MITCHELL INTERNATIONAL AIRPORT PB AMERICAS, INC. MASTER PLAN UPDATE PAGE 2-10
2.3.1 Airfield The Airport’s airside facilities are those dedicated to the movement of aircraft and
include runways, taxiways, and aprons. The following sections describe the various elements
of the airfield and specifics regarding size and location.
2.3.1.1 Runways
Table 2.3-1 summarizes key data regarding GMIA’s runway system. The Airport
currently has five runways. There are two sets of parallel runways: runways 7L/25R and
7R/25L which have a separation of 3,680 feet and runways 1L/19R and 1R/19L which have a
separation of 1000 feet. Runway 13/31, a crosswind runway makes up the remainder of the
runway system. Runway 1L/19R is 9,690 feet long, runway 1R/19L is 4,183 feet, runway
7L/25R is 4,800 feet, runway 7R/25L is 8,012 feet and runway 13/31 has a length of 5,868
feet. Runway 1L/19R has a runway width of 200 feet while runway 7L/25R has a runway
width of 100 feet. All other runways have a runway width of 150 feet.
Runway 7L/25R is restricted to non-jet aircraft and to aircraft with wingspans less
than 79 feet (FAA Airplane Design Group II). Runway 13/31 is closed to turbojet aircraft
operations, although there are exceptions to this restriction when approved by the Airport.
Additionally, turbojet departures from runway 1R are prohibited.
Exhibit 2.3-4 depicts the most recent 10-year annual wind summary for the Airport.
The Airport’s existing runway configuration provides 99.99 percent coverage in all weather
conditions. In Instrument Meteorological Conditions (IMC), the existing runway system
provides 100.0 percent coverage. This wind information provides a basis for analyzing
future runway orientations in conjunction with future runway utilizations and airfield system
development needs.

GENERAL MITCHELL INTERNATIONAL AIRPORT PB AMERICAS, INC. MASTER PLAN UPDATE PAGE 2-11
2.3.1.2 Taxiways
There are approximately 41,000 linear feet of existing taxiways. Runways 7R/25L
and 1L/19R have parallel taxiways while the other runways are linked by connector
taxiways. An apron edge taxilane is designated around the terminal area. Additionally,
several taxiway restrictions are in place that limit aircraft use by weight.
The Airport has an approved Surface Movement Guidance and Control System
(SMGCS) Plan in place that outlines procedures for aircraft and vehicular operations during
low visibility conditions. The SMGCS Plan prescribes airfield lighting and marking
requirements and taxi routes for low visibility operations. As operational needs and
technologies evolve, the SMGCS Plan is updated and resubmitted to the FAA for approval.

TABLE 2.3-1
General Mitchell International Airport
EXISTING RUNWAY DATA
Item 19R 01R 19L 25R 07R 25L 31Runway LengthRunway WidthObstruction Clearance Slope
50:1 20:1 20:1 20:1 20:1 50:1 34:1 20:1 20:1
Effective Gradient (%)
703.6 677.3 673.9 671.9 723.1 670.4 671.3True Bearing N 7° 00’ 00” N 187° 00’ 00” N 7° 00’ 00” N 187° 00’ 00” N 72° 00’ 00” N 252° 00’ 00” N 72° 00’ 00” N 252° 00’ 00” N132° 00’ 00” N 312° 00’ 00”
N 42° 55’ 52.73” N 42° 56’ 21.75” N 42° 57’ 02.73” N 42° 57’ 09.86” N 42° 56’ 22.34” N 42° 56’ 47.25” N 42° 57’ 29.28”W 87° 53’ 51.02” W 87° 53’ 32.50” W 87° 53’ 25.47” W 87° 54’ 19.15” W 87° 54’ 57.03” W 87° 53’ 14.81” W 87° 54’ 12.29”
Runway Lighting HIRL, CL, TDZ MIRL MIRL MIRL HIRL HIRL MIRLRunway MarkingApproach Category (FAR Part 77)
PIR C C A(V) PIR C B(V)
Runway SurfacePavementStrength (lbs.)
SingleDualDual Tandem
NAVAIDS GS/IM/LOC/LOM/MM/ALS/PAPI
VASI DME/GS/LOC/LOM/MM/ALS/ PAPI
LOC/PAPI VASI
Approach Lighting ALSF2 SSALR
VASI
HIRL, CLNon-Precision Instrument Non-Precision InstrumentBasic (BSC) Precision InstrumentPrecision Instrument
170,000
80,000
669
110,000
MIRL
B(V)
Concrete
0.06%
100,00035,000 185,000
MIRL
N 42° 56’ 50.31”W 87° 53’ 13.89”
Asphalt-Concrete (grooved)
Runway13
5,868ft. 150 ft.
55,000 350,000PAPI
0.67%
674.4
N 42° 57’ 24.74”
150 ft.
Runway07L
4,800 ft. 8,012 ft.
185,000
Runway
100 ft.
0.03%
W 87° 53’ 17.59”
A(V)
Asphalt
30,000115,000
PIR
LOC/GS/LOM/MM/ALS/PAPI
MALSR
350,000 180,000
Asphalt-Concrete (grooved) Concrete
100,000 85,000
GMIA Records
Runway Runway01L
9,690 ft. 4,183 ft. 200 ft. 150 ft.
Sources: FAA 5010 Forms
0.19%
34:1
0.35%
Runway End Coordinates
N 42° 57’ 27.69”W 87° 53’ 34.77”
Runway End Elevation (MSL) 672.7


GENERAL MITCHELL INTERNATIONAL AIRPORT PB AMERICAS, INC. MASTER PLAN UPDATE PAGE 2-14
2.3.1.3 Aprons
The Airport’s passenger terminal apron area consists of approximately 65 acres of
concrete. Other apron areas include the seven-acre FBO apron, the 16-acre Wisconsin ANG
apron, 38-acre Air Force Reserve apron, and the 22-acre apron serving the Midwest Express
maintenance center and the air cargo complex.
2.3.1.4 Lighting and NAVAIDs Lighting and NAVAIDs for each of the five runway ends are also listed on Table 2.3-
1. Runways 1L/19R and 7R/25L have high intensity runway lighting (HIRL), while runways
1R/19L, 7L/25R and 13/31 carry medium intensity runway lightings (MIRL). Runway
1L/19R is equipped with center line lighting (CL) but only runway 1L has touch down zone
lighting (TDZ).
Instrument Landing Systems (ILS) are in place for runways 1L, 19R, and 7R. The
ILS equipment consists of glide slope transmitters (GS), distance measuring equipment
(DME) (on 7R/25L only), localizers (LOC), precision approach path indicators (PAPI),
approach lighting systems (ALS), location outer marker (LOM), inner markers (IM) and
middle markers (MM). Runways 1L and 7R have published NDB/GPS approaches in
addition to the ILS. Runway 25L has a nonprecision localizer approach.
2.3.2 Airspace
There are three major components of the airspace system which encompasses the
Airport: enroute, terminal, and local airport control. Each component has a specific function
and is supported in its role by a network of air traffic control facilities and NAVAIDs.
2.3.2.1 Enroute Control
Air traffic control for aircraft enroute to the Milwaukee area is the responsibility of
the Chicago Air Route Traffic Control Center (ARTCC). Aircraft flying through the region

GENERAL MITCHELL INTERNATIONAL AIRPORT PB AMERICAS, INC. MASTER PLAN UPDATE PAGE 2-15
or to an airport in the area typically follow designated routes known as victor airways, or jet
routes. These airways are delineated on the ground by a system of radio equipment called
VORs (VHF Omni-Directional Range equipment).
2.3.2.2 Terminal Approach Control Facility
The FAA Milwaukee Approach Control Facility is responsible for the control of
arrivals, departures, and overflights operating 13,000 feet and below and within a 40-mile
radius of GMIA. Located at the Airport, this approach facility is also responsible for
providing guidance to aircraft overflying the area.
2.3.2.3 Air Traffic Control Tower
The FAA Milwaukee air traffic control tower (ATCT) directs all traffic at the Airport
and in the immediate airspace, up to approximately five miles from the tower. The tower is
responsible for issuing clearances to aircraft landing or departing the Airport. Timmerman
Field also has an ATCT. The tower at Timmerman operates between 0700 and 2100 local
time.
2.3.2.4 Class C Airspace
As shown on Exhibit 2.3-5, Class C airspace for GMIA includes the airspace from
the surface to 4,700 feet above the Airport’s elevation. The airspace consists of a vertical
cylindrical surface area with a five nautical miles radius, and an outer area with a ten nautical
mile radius that extends from 1,900 feet to 4,700 feet above the Airport’s elevation on the
east and from 2,200 feet to 4,700 feet on the west. Two-way radio communication must be
established with the Milwaukee ATCT prior to entry and thereafter maintained while in Class
C airspace. Unless otherwise authorized or required by ATCT, no person may operate an
aircraft at or below 4,700 feet above the Airport’s elevation within four nautical miles of a
Class C surface area, or at an airspeed of more that 200 knots.


GENERAL MITCHELL INTERNATIONAL AIRPORT PB AMERICAS, INC. MASTER PLAN UPDATE PAGE 2-17
2.3.3 Passenger Terminal Facilities
The passenger terminal consists of ground level ticketing and baggage claim
buildings served by separate curbfronts and a second level concession mall that connects to
three concourses (C, D, and E). The terminal and concourses consist of approximately
777,000 square feet (sf) and support 42 aircraft gates. The International Arrivals Terminal,
which is in the terminal area, but separate from the main terminal building, includes one gate
and contains approximately 5,000 sf. The passenger terminal area is depicted in Exhibit 2.3-
6. The list of airlines and the gate assignments are shown on Table 2.3-2.
TABLE 2.3-2
General Mitchell International Airport
AIRLINE GATE ASSIGNMENTS
Signatory Airline Gate(s) Non-Signatory
Sublease
Air Canada D33
AirTran E60
America West C24, C26
American Eagle C20, C21, C22, C23
Continental Express E62, E63
Delta/Comair C25, C27
Funjet Vacations E61
Midwest Express D30,D34, D36-49
Northwest Airlines E64-69
Skyway D52 ATA Connection
United Express D31, D33, D35
US Airways/
US Airways Express
D51, D53
Source: Compiled by PB Aviation, Inc

GENERAL MITCHELL INTERNATIONAL AIRPORT PB AMERICAS, INC. MASTER PLAN UPDATE PAGE 2-19
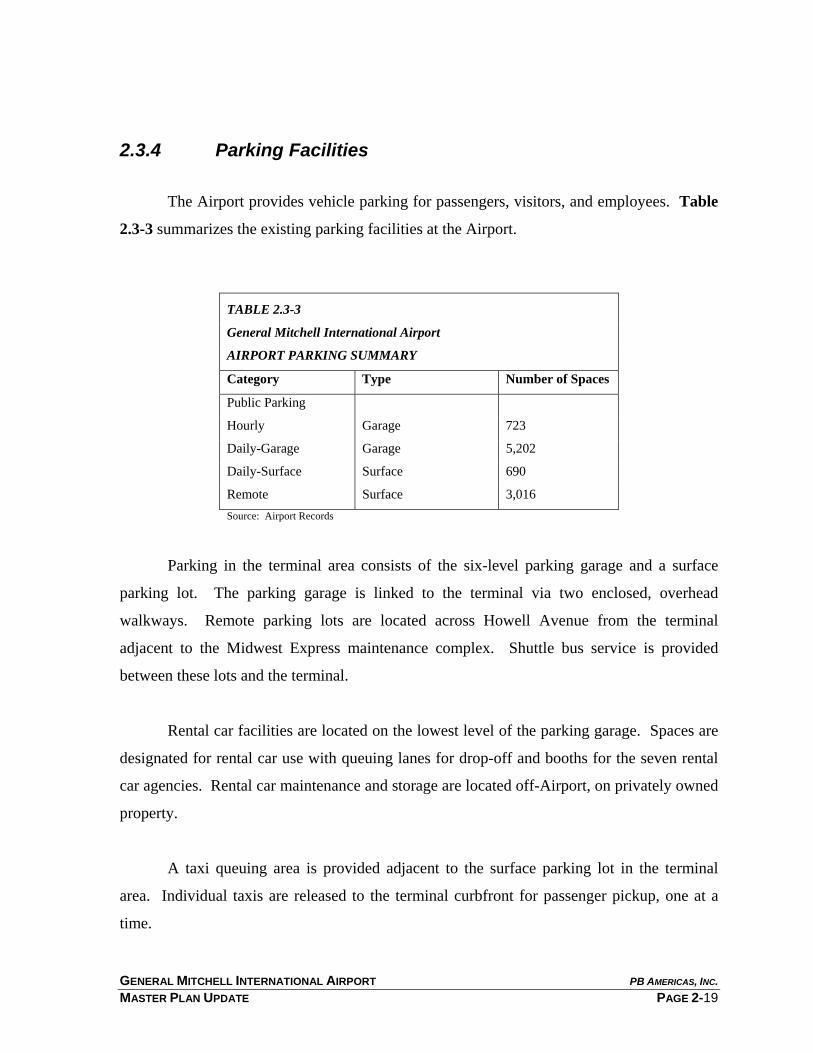
2.3.4 Parking Facilities
The Airport provides vehicle parking for passengers, visitors, and employees. Table
2.3-3 summarizes the existing parking facilities at the Airport.
TABLE 2.3-3
General Mitchell International Airport
AIRPORT PARKING SUMMARY
Category Type Number of Spaces
Public Parking
Hourly Garage 723
Daily-Garage Garage 5,202
Daily-Surface Surface 690
Remote Surface 3,016 Source: Airport Records
Parking in the terminal area consists of the six-level parking garage and a surface
parking lot. The parking garage is linked to the terminal via two enclosed, overhead
walkways. Remote parking lots are located across Howell Avenue from the terminal
adjacent to the Midwest Express maintenance complex. Shuttle bus service is provided
between these lots and the terminal.
Rental car facilities are located on the lowest level of the parking garage. Spaces are
designated for rental car use with queuing lanes for drop-off and booths for the seven rental
car agencies. Rental car maintenance and storage are located off-Airport, on privately owned
property.
A taxi queuing area is provided adjacent to the surface parking lot in the terminal
area. Individual taxis are released to the terminal curbfront for passenger pickup, one at a
time.

GENERAL MITCHELL INTERNATIONAL AIRPORT PB AMERICAS, INC. MASTER PLAN UPDATE PAGE 2-20
2.3.5 Air Cargo Facilitates
Major air cargo facilities at the Airport are concentrated in the area adjacent to
runway 7R/25L between Howell Avenue and 6th Street. The two multi-tenant air cargo
buildings are 38,000 sf and 126,000 sf. In addition to integrated cargo carriers, such as
FedEx and UPS, several passenger airlines and freight forwarders lease space in the cargo
buildings. Adjacent to the cargo buildings are approximately 63,300 square yards of aircraft
parking apron.
The United States Postal Service (USPS) operates a 24-hour airport facility next to
the corporate hangars along Howell Avenue. This location provides public access from
Howell Avenue as well as secure tug access to both the air cargo complex and the terminal.
Additionally, a small air cargo operator occupies two hangars along Howell Avenue north of
runway 7L/25R.
2.3.6 Airport Access
Ground access to the Airport is provided by a combination of interstate highway and
surface roads. The Airport Spur (STH 119) connects I-94 and the Airport terminal road
system. The only exit along the Airport Spur Freeway is to Howell Avenue (STH 38).
Howell Avenue is a six-lane artery that runs north/south through the Airport separating the
terminal and most airfield facilities from the cargo and aircraft maintenance complex. A
tunnel is in place for Howell Avenue to pass under runway 7R/25L.
2.3.7 General Aviation
Exhibit 2.3-1 depicts the General Aviation (GA) facilities that are located in several
areas around the Airport. The Fixed Base Operator, Signature Flight Support, has operations
concentrated north of the airfield, with public access from Layton Avenue. This area

GENERAL MITCHELL INTERNATIONAL AIRPORT PB AMERICAS, INC. MASTER PLAN UPDATE PAGE 2-21
includes a GA terminal, itinerant ramp, and aircraft maintenance and storage hangars. A GA
hangar complex is located in the northeast quadrant of the Airport. This area includes 40
leased private hangars and T-hangars.
Corporate hangars are located adjacent to the terminal complex along Howell
Avenue, south of runway 7R/25L near the ARFF station, and south of the Air Force
Reserves on College Avenue.
2.3.8 Military Facilities
Two military units are located at General Mitchell International: the 128th Air
Refueling Wing of the Wisconsin Air National Guard (ANG) and the 440th Airlift Wing of
the Air Force Reserves. The ANG occupies approximately 58 acres on the east side of the
airfield and operates KC-135 aircraft. The 440th Airlift Wing operates C-130 Hercules
aircraft. It should be noted that the 102-acre Air Force Reserve base, located in the
southwest quadrant of the airfield, is owned by the Department of Defense.
2.4 Airport Environs
Existing land uses, zoning, and the relationship of the Airport with the surrounding
communities define the environs in which the Airport is located. Planned land uses are also
considered for compatibility with future Airport development, where appropriate. Exhibit
2.4-1 depicts the land uses surrounding the Airport. This information was provided by the
Southeast Wisconsin Regional Planning Commission (SEWRPC).
Existing land uses surrounding the Milwaukee General Mitchell International Airport
is indicated as follows:
Single family residential – includes all types of detached residential units
Multi family residential – includes all types of attached residential units such as
duplexes, townhouses, and apartments

GENERAL MITCHELL INTERNATIONAL AIRPORT PB AMERICAS, INC. MASTER PLAN UPDATE PAGE 2-22
Commercial – includes retail, business and office uses
Mixed Use – includes combinations of residential and commercial uses
Industrial – includes manufacturing and warehousing
Transportation – includes the Airport, road right-of-way, and railroads
Public – includes public institutions, and city or county owned properties used for
governmental purposes
Recreational – includes publicly and privately owned properties used for parks, golf courses, and conservation areas
Agriculture – land used for raising crops and/or livestock
Surface water – lakes and ponds


GENERAL MITCHELL INTERNATIONAL AIRPORT PB AMERICAS, INC. MASTER PLAN UPDATE PAGE 2-24
Residential uses (both single and multi family) are the predominant land uses north of
the Airport. The residential land use pattern forms a dense urban fabric which encompasses
the southern portion of the City of Milwaukee and the cities of St. Francis, Cudahy and South
Milwaukee.
Commercial uses are located along the heavily utilized transportation networks of the
region, with some clustering in dense residential districts. Examples of this pattern are
evident in the neighborhoods of South Milwaukee and Cudahy.
The mixed use category is used sparingly in SEWRPC’s mapping of land uses and is
considered a mixed residential-commercial use.
Industrial uses are primarily located in close proximately to the major interstates and
primary access roads. Prominent industrial areas near the Airport include ACE Industrial
Park and Mitchell International Business Park in Cudahy.
Public land uses, which includes government owned properties used for government
and public activities are spread throughout the region. Large areas of public use are located
both north and south of the Airport and include the two military installations at the Airport as
well as the Milwaukee Area Technical College campus southwest of the Airport.
Recreational uses are distributed throughout the neighborhoods surrounding the
Airport. Regional recreational facilities extend along the Lakefront portions of St. Francis,
Cudahy and south Milwaukee. South of the Airport is the Michael F. Cudahy Nature
Preserve, a 42-acre park with nature and hiking trails.
With the exception of Lake Michigan, other bodies of surface water around the
Airport area are relatively small. There are a few lakes dotted in and around the cities and
agricultural spaces.

GENERAL MITCHELL INTERNATIONAL AIRPORT PB AMERICAS, INC. MASTER PLAN UPDATE PAGE 2-25
2.5 Socioeconomic Setting
Socioeconomic data relevant to the Airport were collected for the Master Plan
Update. The data present three Metropolitan Statistical Areas (MSAs) defined by the Office
of Management and Budget that together comprise the Greater Milwaukee area. The Greater
Milwaukee Area includes the metropolitan statistical areas of Milwaukee-Waukesha,
Kenosha and Racine. Particular emphasis was placed on population, employment, income,
and housing. These factors indicate a solid economic base for continued air transportation
demand.
2.5.1 Population
Historical trends and forecasts for population of Greater Milwaukee Area are
represented in Table 2.5-1. The decade between 1980 and 1990 showed 0.2 percent
population growth for the entire region. From 1990 to 2000, population grew at a
compounded growth rate of 0.6 percent. Compounded annual growth rates from 1990 to
2000 were 0.5 percent, 1.2 percent and 0.8 percent for the Milwaukee-Waukesha, Kenosha
and Racine MSAs, respectively. This compares to growth rates of 0.9 percent and 1.2
percent for the state of Wisconsin and the nation, respectively.
The population for the entire area is expected to grow at an annual compounded
growth rate of 0.4 percent from 1999 to 2005 and 0.4 percent from 2005 to 2010. As shown
in the table, these growth rates hold steady through 2010 while the growth rate for the State
of Wisconsin decreases by 2010.

GENERAL MITCHELL INTERNATIONAL AIRPORT PB AVIATION, INC. MAY 27, 2009 MASTER PLAN UPDATE PAGE 2-26
TABLE 2.5-1 General Mitchell International Airport HISTORICAL AND PROJECTED POPULATION
Historical Projected Projected 1 Area 1980 1990 1999 2000 2005 2010 1980-
1990 1990-2000
1999-2005
1999-2010
Milwaukee County 964,988 959,275 1,006,867 940,164 1,030,851 1,055,561 -0.1% -0.2% 0.4% 0.4% Ozaukee County 66,981 72,831 88,331 82,317 85,988 87,214 0.8% 1.2% -0.4% -0.1% Washington County 84,848 95,328 117,712 117,493 122,957 126,455 1.2% 2.1% 0.7% 0.7% Waukesha County 280,326 304,715 354,295 360,767 364,584 370,678 0.8% 1.7% 0.5% 0.4% Milwaukee-Waukesha
MSA 1,397,143 1,432,149 1,567,205 1,500,741 1,604,380 1,639,908 0.2% 0.5% 0.4% 0.4% Kenosha MSA 123,137 128,181 144,834 144,834 149,247 152,807 0.4% 1.2% 0.5% 0.5% Racine MSA 173,132 175,034 185,000 188,831 188,004 190,901 0.1% 0.8% 0.3% 0.3% GREATER MILWAUKEE 1,693,412 1,735,364 1,897,039 1,834,406 1,941,631 1,983,616 0.2% 0.6% 0.4% 0.4% State of Wisconsin 4,705,767 4,891,769 5,287,825 5,363,675 5,479,000 5,512,313 0.4% 0.9% 0.6% 0.4% United States 227,224,681 249,464,396 281,421,906 281,421,906 285,981,000 297,716,000 0.9% 1.2% 0.3% 0.5%
1 Population projections for 2005 and 2010 were based on 1999 population data. As a result, comparisons could not be made between 2000 and 2010. Sources: U.S. Bureau of Census (United States). Compiled by PB Aviation, Inc.

MASTER PLAN UPDATE STUDY PB AMERICAS, INC. GENERAL MITCHELL INTERNATIONAL AIRPORT 2-27
2.5.2 Employment
The historical and projected civilian labor force for the region is represented in Table
2.5-2. As shown, employment grew at an annual compounded growth rate of 1.0 percent for
the Milwaukee-Waukesha MSA, 0.2 percent for Racine, 2.1 percent for Kenosha, and 1.0
percent for the region from 1990 through 2000. These growth rates compare to 1.4 percent
and 1.3 percent for the state of Wisconsin and the nation, respectively.

MASTER PLAN UPDATE STUDY PB AMERICAS, INC. GENERAL MITCHELL INTERNATIONAL AIRPORT 2-28
Milwaukee-Waukesha Racine Kenosha Greater State of US
Year MSA MSA MSA Milwaukee Wisconsin (000s)
1991 734,000 89,200 67,900 891,100 2,595,300 126,3521992 754,300 91,000 70,800 916,100 2,675,300 128,0991993 761,600 90,800 71,500 923,900 2,727,500 129,1851994 776,300 91,800 74,000 942,100 2,798,600 131,0471995 783,900 92,300 75,900 952,100 2,843,900 132,3151996 805,500 93,900 77,200 976,600 2,927,300 133,9451997 810,500 93,800 79,000 983,300 2,948,700 136,2901998 832,800 90,900 84,100 1,007,800 2,952,000 137,6651999 832,800 90,900 84,100 1,007,800 2,889,800 139,3692000 802,600 90,900 81,700 975,200 2,934,900 141,500
AnnualCompounded
Growth1990 - 2000 1.0% 0.2% 2.1% 1.0% 1.4% 1.3%1995 - 2000 -0.1% -0.6% 1.1% 0.0% 0.1% 1.1%
Milwaukee-Waukesha Racine Kenosha Greater State of US
Year MSA MSA MSA Milwaukee Wisconsin (000s)
1990 5.0% 6.7% 6.1% 5.3% 5.5% 5.6%1991 4.8% 7.1% 6.1% 5.1% 5.2% 6.9%1992 4.4% 6.1% 5.1% 4.6% 4.7% 7.5%1993 4.6% 5.8% 5.1% 4.8% 4.7% 6.9%1994 3.5% 4.4% 3.8% 3.6% 3.7% 6.1%1995 3.4% 4.2% 3.5% 3.5% 3.5% 5.6%1996 3.6% 4.4% 3.6% 3.7% 3.7% 5.4%1997 2.8% 4.1% 3.6% 3.0% 3.4% 4.9%1998 2.8% 4.1% 3.6% 3.0% 3.0% 4.5%1999 3.8% 4.7% 3.8% 3.9% 3.5% 4.2%
Sources: California Employment Development Department U.S. Department of Labor, Bureau of Labor Statistics Compiled by PB Aviation, Inc.
Unemployment Rates
TABLE 2.5-2
AND UNEMPLOYMENT RATESCIVILIAN LABOR FORCE
General Mitchell International Airport
Civilian Labor Force

MASTER PLAN UPDATE STUDY PB AMERICAS, INC. GENERAL MITCHELL INTERNATIONAL AIRPORT 2-29
2.5.3 Unemployment
The unemployment rates for the region display a general annual reduction since 1990.
The Greater Milwaukee region has a history of lower unemployment rates (except for 1993
and 1999) when compared to the State of Wisconsin and the nation. Within the MSAs, the
Milwaukee-Waukesha MSA maintained the lowest unemployment rates through out the
1990s.
The Greater Milwaukee area has a diverse business base. Table 2.5-3 indicates
nonagricultural employment trends for the area and the nation for 1991 and 2001. The
majority of people work in the Services sector followed by Trade, Manufacturing,
Government, Financial/Insurance/Real Estate and Construction.
The Services and Trade sectors, having a compounded annual growth rate of 3.3
percent and 0.6 percent respectively, employ approximately 33 percent and 21 percent of the
labor force, thereby being the two largest sectors in the region. These two sectors are
followed by the Manufacturing sector, Government, Finance/Insurance/Real Estate,
Transportation/Utilities and Construction.
Comparing the Greater Milwaukee Nonagricultural Employment with that of the
nation identifies those sectors whose percent of employment is greater. These industries are
considered the primary producing sectors in the region.
The major employers for the Milwaukee area are listed in Table 2.5-4. The table lists
all of the companies with 1,000 employees or more. The list of employers establishes the
dominance of the Service sector in the region. Noted are major employers such as Wal-Mart,
U.S. Bank, Daimler Chrysler Corp., United Parcel Service, Midwest Express Airlines and
several hospitals.

MASTER PLAN UPDATE STUDY PB AMERICAS, INC. GENERAL MITCHELL INTERNATIONAL AIRPORT 2-30
Greater Milwaukee United StatesNonagricultural Employment Nonagricultural Employment (000)
Annual AnnualCompounded Compounded
Industry 1991 2001 Growth 1991 2001 Growth
Construction ¹ 63,400 40,000 -4.5% 5,834 6,872 1.7%Manufacturing 202,100 202,100 0.0% 19,075 17,755 -0.7%Transportation/Utilities 40,600 43,300 0.6% 5,776 7,079 2.1%Trade 199,900 212,800 0.6% 25,774 30,457 1.7%Fin/Ins/Real Estate 55,100 62,800 1.3% 6,709 7,624 1.3%Services 237,900 330,000 3.3% 27,930 41,044 3.9%Government 101,700 114,600 1.2% 18,306 20,825 1.3%________ ________ ________ ________ ________ ________Total 900,700 1,005,600 1.1% 109,404 131,656 1.9%
1 Includes mining employment. Sources: U.S. Department of Labor, Bureau of Labor Statistics Compiled by PB Aviation, Inc.
NONAGRICULTURAL EMPLOYMENT TRENDS BY MAJOR INDUSTRY DIVISIONS
TABLE 2.5-3
General Mitchell International Airport
Percent of 2001 Total Employment by Industry Division
4.0%
20.1%
4.3%
21.2%
6.2%
32.8%
11.4%
5.2%
13.5%
5.4%
23.1%
5.8%
31.2%
15.8%
0.0% 5.0% 10.0% 15.0% 20.0% 25.0% 30.0% 35.0% 40.0%
Construction
Manufacturing
Transportation/Utilities
Trade
Fin/Ins/Real Estate
Services
Government
Greater Milwaukee Area United States

MASTER PLAN UPDATE STUDY PB AMERICAS, INC. GENERAL MITCHELL INTERNATIONAL AIRPORT 2-31
TABLE 2.5-4 General Mitchell International Airport
MAJOR EMPLOYERS
Employer Product/Service Allen-Bradley Co. LLC Relay and Industrial Controls Aurora Health Care Metro, Inc. General Medical and Surgical Hospitals Briggs and Stratton Corp. Internal Combustion Engines Case Corporation Farm and Construction Equipment Cooper Power Systems Switchgears and Transformers Daimler Chrysler Corp. Automotive Manufacturer Emerson Electric Co. Household Appliances U.S. Bank National Commercial Bank Fleming Companies Grocery Stores G.E. Medical Systems X-Ray & Irradiation Equipment Marks Five Corps Help Supply Services Marshall & Ilsley Corp. Bank Holding Companies Medical College of Wisconsin Inc. Health Care/Education Northwestern Mutual Life Life Insurance Parisian Inc. Department Stores Quad/Graphics Commercial Printing S.C. Johnson and Son Inc. Chemical and Allied Products-Consumer St. Joseph's Hospital General Medical and Surgical Hospitals The Gap Inc. Family Clothing Store Tower Automotive Products Co. Inc. Motor Vehicle Parts and Accessories United Parcel Service Air Courier Service Walmart Associates Department Stores Waukesha Memorial Hospital Inc. General Medical and Surgical Hospitals Midwest Express Airlines Air Transportation Source: Wisconsin Department of Workforce Development Compiled by PB Aviation, Inc.
2.5.4 Income The Greater Milwaukee area has an average cost of living as compared to other
metropolitan areas in the state of Wisconsin and the United States. A survey of cost of living
conducted by Dowden & Co., a respected research and recruiting firm, is presented in Table
2.5-5. As noted in the table, the Milwaukee area has a cost of living of 104.5, compared to
the national average of 100 for areas with a population greater than 2 million.

MASTER PLAN UPDATE STUDY PB AMERICAS, INC. GENERAL MITCHELL INTERNATIONAL AIRPORT 2-32
TABLE 2.5-5
General Mitchell International Airport
SURVEY OF COST OF LIVING
Area State Cost of Living
Boston MA 127.4 Chicago IL 113.9 Detroit MI 112.7 Seattle WA 112.6 Lansing MI 104.9 Madison WI 104.7 Milwaukee WI 104.5 Wausau WI 103.8 Green Bay WI 99.9 Champaign/Urbana IL 98.3
Source: Dowden & Co.
2.5.5 Per Capita Effective Buying Income
The effective buying income is the total income a household receives minus personal
and real estate taxes. The Per Capita Effective Buying Income is the estimated average
amount of personal disposable income per person received during a calendar year for all
persons residing in a political jurisdiction. Table 2.5-6 shows a yearly comparison of
effective buying income per capita for the Greater Milwaukee area, the state of Wisconsin
and the nation. Evident is a higher disposable income for the Greater Milwaukee area
compared to the state and the nation. Further, when detailed into income categories, the air
trade area has a higher percentage of disposable income.
* * * * * * * *
The information presented in this chapter serves as a baseline for the projection of
aviation activity and the determination of facility requirements presented in the following
two chapters. As stated earlier, the inventory is a snapshot as the Airport is continually
undertaking improvements.

MASTER PLAN UPDATE STUDY PB AMERICAS, INC. GENERAL MITCHELL INTERNATIONAL AIRPORT 2-33
Year Air Trade Area State of Wisconsin United States
Historical¹ 1992 $16,062 $14,690 $15,2551993 $17,109 $15,645 $16,0641994 $18,114 $16,532 $16,9181995 $15,627 $14,435 $14,9651996 $16,299 $15,058 $15,5551997 $16,965 $15,708 $16,2811998 $17,435 $16,189 $16,8951999 $18,227 $16,848 $17,6912000 $18,913 $17,490 $18,426
Projected
2005 $22,514 $20,894 $21,977
1990 - 1994 -0.7% -0.4% -0.5%1995 - 1998 3.7% 3.6% 4.2%1998 - 2003 3.5% 3.6% 3.6%
Income Category Air Trade Area State of Wisconsin United States
Less than $20,000 0.0% 0.0% 24.4%$20,000 - $34,999 26.1% 28.4% 20.7%$35,000 - $49,999 23.2% 24.2% 16.8%$50,000 or more 50.7% 47.4% 38.2%_______ _______ _______
Total 100.0% 100.0% 100.0%
¹ Data beginning in 1995 are not directly comparable to data in previousyears due to a change in certain components used in the calculations.
Sources: Sales & Marketing Management, Survey of Buying Power Compiled by PB Aviation, Inc.
Annual Compounded Growth
Percentage of Households (2000 EBI)
PER CAPITA EFFECTIVE BUYING INCOME
TABLE 2.5-6
General Mitchell International Airport