Embed Size (px)
Citation preview
EARTHQUAKE RESISTANT DESIGN OF LOW-RISE OPEN GROUND STOREY FRAMED BUILDING
A thesis
Submitted by
SNEHASH PATEL
(210CE2276)
In partial fulfillment of the requirements for
the award of the degree
of
MASTER OF TECHNOLOGY
DEPARTMENT OF CIVIL ENGINEERING NATIONAL INSTITUTE OF TECHNOLOGY, ROURKELA 769008
May 2012
EARTHQUAKE RESISTANT DESIGN OF LOW-RISE OPEN GROUND STOREY FRAMED BUILDING
A thesis Submitted by
SNEHASH PATEL
(210CE2276)
In partial fulfillment of the requirements for the award of the degree
of
MASTER OF TECHNOLOGY
In
STRUCTURAL ENGINEERING
Under the Guidance of
Dr. PRADIP SARKAR
DEPARTMENT OF CIVIL ENGINEERING NATIONAL INSTITUTE OF TECHNOLOGY, ROURKELA 769008
May 2012

This is to certify that the thesis entitled “EARTHQUAKE RESISTANT
DESIGN OF LOW-RISE OPEN GROUND STOREY FRAMED BUILDING”
submitted by Snehash Patel in partial fulfillment of the requirement for the award of
Master of Technology degree in Civil Engineering with specialization in Structural
Engineering to the National Institute of Technology, Rourkela is an authentic record of
research work carried out by her under my supervision. The contents of this thesis, in full
or in parts, have not been submitted to any other Institute or University for the award of
any degree or diploma.
Project Guide
Rourkela-769 008 Dr. Pradip Sarkar Date: Associate Professor Department of Civil Engineering

i
ACKNOWLEDGEMENTS
First and foremost, praise and thanks goes to my God for the blessing that has bestowed
upon me in all my endeavors.
I am deeply indebted to Dr. Pradip Sarkar, Associate Professor, my advisor and guide,
for the motivation, guidance, tutelage and patience throughout the research work. I
appreciate his broad range of expertise and attention to detail, as well as the constant
encouragement he has given me over the years. There is no need to mention that a big
part of this thesis is the result of joint work with him, without which the completion of
the work would have been impossible.
I extend my sincere thanks to the Head of the Civil Engg Department Prof. N. Roy, for
his advice and unyielding support over the year.
I am also grateful to Dr. Robin Davis P, for his valuable suggestions and timely co-
operation during the project work.
I would like to take this opportunity to thank my Parents and my sisters for their
unconditional love, moral support, and encouragement for the timely completion of this
project.
I am grateful for friendly atmosphere of the Structural Engineering Division and all kind
and helpful professors that I have met during my course.

ii
I express my most sincere admiration to my friends, (in no particular order) Bijily B.,
Snigdha, Chhabi, Kirti, Avadhoot and to all my classmates for their cheering up ability
which made this project work smoothly.
So many people have contributed to my thesis, my education, and it is with great pleasure
to take the opportunity to thank them. I apologize, if I have forgotten anyone.
Snehash Patel
Roll No: 210ce2276
M.Tech (Structures)
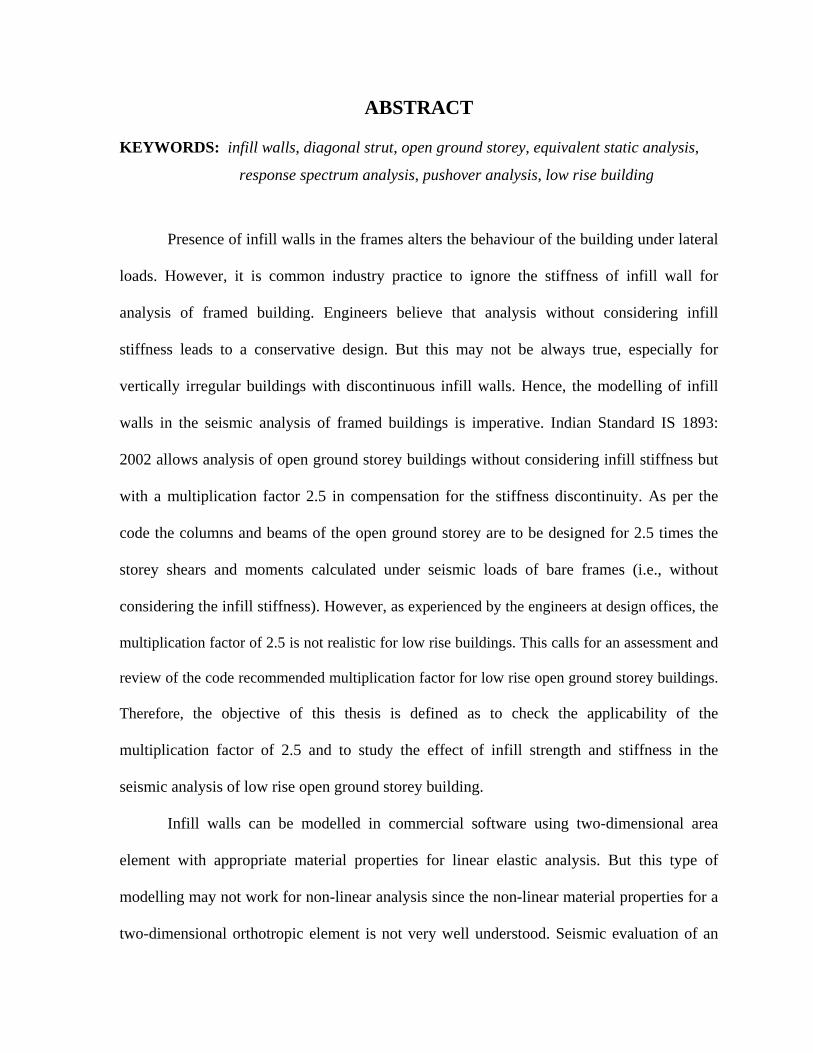
ABSTRACT
KEYWORDS: infill walls, diagonal strut, open ground storey, equivalent static analysis,
response spectrum analysis, pushover analysis, low rise building
Presence of infill walls in the frames alters the behaviour of the building under lateral
loads. However, it is common industry practice to ignore the stiffness of infill wall for
analysis of framed building. Engineers believe that analysis without considering infill
stiffness leads to a conservative design. But this may not be always true, especially for
vertically irregular buildings with discontinuous infill walls. Hence, the modelling of infill
walls in the seismic analysis of framed buildings is imperative. Indian Standard IS 1893:
2002 allows analysis of open ground storey buildings without considering infill stiffness but
with a multiplication factor 2.5 in compensation for the stiffness discontinuity. As per the
code the columns and beams of the open ground storey are to be designed for 2.5 times the
storey shears and moments calculated under seismic loads of bare frames (i.e., without
considering the infill stiffness). However, as experienced by the engineers at design offices, the
multiplication factor of 2.5 is not realistic for low rise buildings. This calls for an assessment and
review of the code recommended multiplication factor for low rise open ground storey buildings.
Therefore, the objective of this thesis is defined as to check the applicability of the
multiplication factor of 2.5 and to study the effect of infill strength and stiffness in the
seismic analysis of low rise open ground storey building.
Infill walls can be modelled in commercial software using two-dimensional area
element with appropriate material properties for linear elastic analysis. But this type of
modelling may not work for non-linear analysis since the non-linear material properties for a
two-dimensional orthotropic element is not very well understood. Seismic evaluation of an
iv
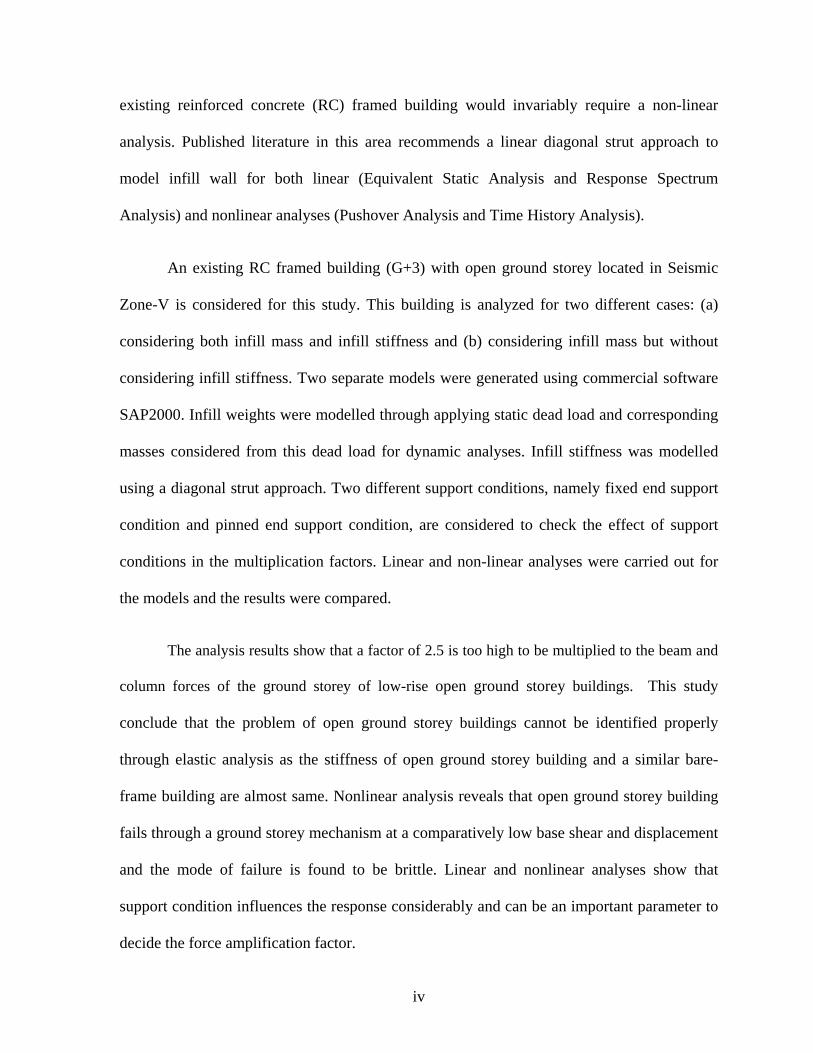
existing reinforced concrete (RC) framed building would invariably require a non-linear
analysis. Published literature in this area recommends a linear diagonal strut approach to
model infill wall for both linear (Equivalent Static Analysis and Response Spectrum
Analysis) and nonlinear analyses (Pushover Analysis and Time History Analysis).
An existing RC framed building (G+3) with open ground storey located in Seismic
Zone-V is considered for this study. This building is analyzed for two different cases: (a)
considering both infill mass and infill stiffness and (b) considering infill mass but without
considering infill stiffness. Two separate models were generated using commercial software
SAP2000. Infill weights were modelled through applying static dead load and corresponding
masses considered from this dead load for dynamic analyses. Infill stiffness was modelled
using a diagonal strut approach. Two different support conditions, namely fixed end support
condition and pinned end support condition, are considered to check the effect of support
conditions in the multiplication factors. Linear and non-linear analyses were carried out for
the models and the results were compared.
The analysis results show that a factor of 2.5 is too high to be multiplied to the beam and
column forces of the ground storey of low-rise open ground storey buildings. This study
conclude that the problem of open ground storey buildings cannot be identified properly
through elastic analysis as the stiffness of open ground storey building and a similar bare-
frame building are almost same. Nonlinear analysis reveals that open ground storey building
fails through a ground storey mechanism at a comparatively low base shear and displacement
and the mode of failure is found to be brittle. Linear and nonlinear analyses show that
support condition influences the response considerably and can be an important parameter to
decide the force amplification factor.
v
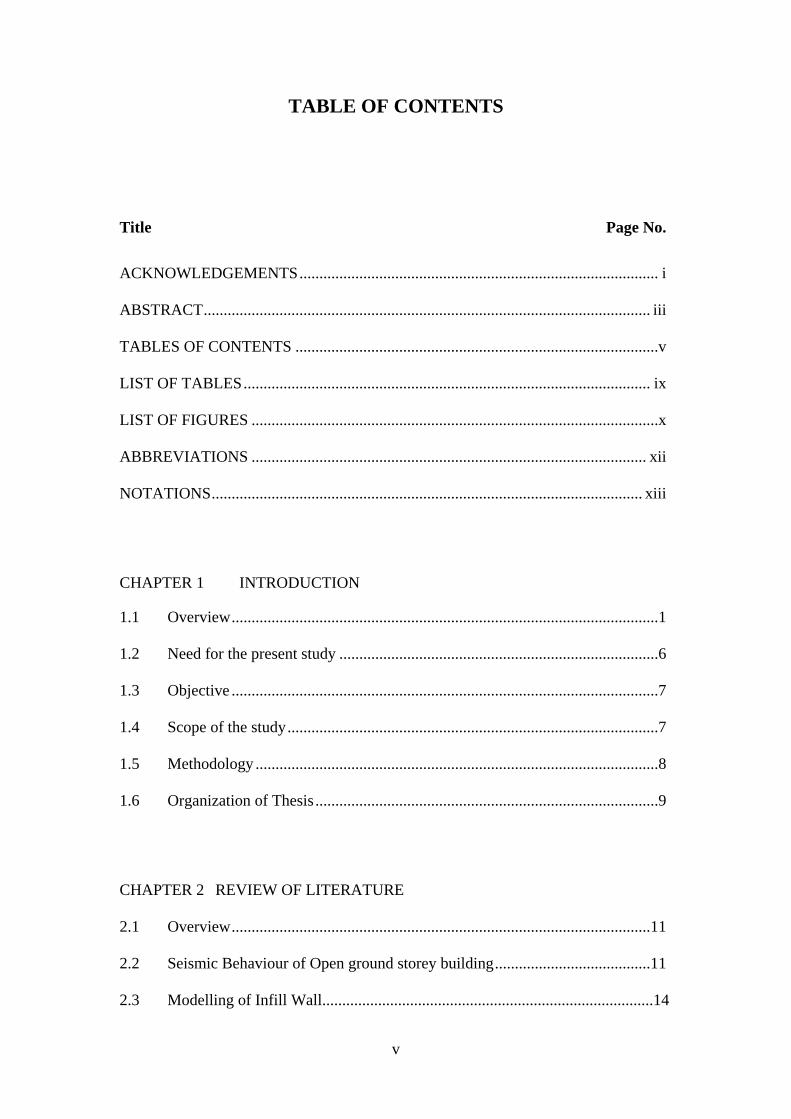
TABLE OF CONTENTS
Title Page No.
ACKNOWLEDGEMENTS .......................................................................................... i
ABSTRACT ................................................................................................................ iii
TABLES OF CONTENTS ...........................................................................................v
LIST OF TABLES ...................................................................................................... ix
LIST OF FIGURES ......................................................................................................x
ABBREVIATIONS ................................................................................................... xii
NOTATIONS ............................................................................................................ xiii
CHAPTER 1 INTRODUCTION
1.1 Overview ...........................................................................................................1
1.2 Need for the present study ................................................................................6
1.3 Objective ...........................................................................................................7
1.4 Scope of the study .............................................................................................7
1.5 Methodology .....................................................................................................8
1.6 Organization of Thesis ......................................................................................9
CHAPTER 2 REVIEW OF LITERATURE
2.1 Overview .........................................................................................................11
2.2 Seismic Behaviour of Open ground storey building .......................................11
2.3 Modelling of Infill Wall...................................................................................14
vi
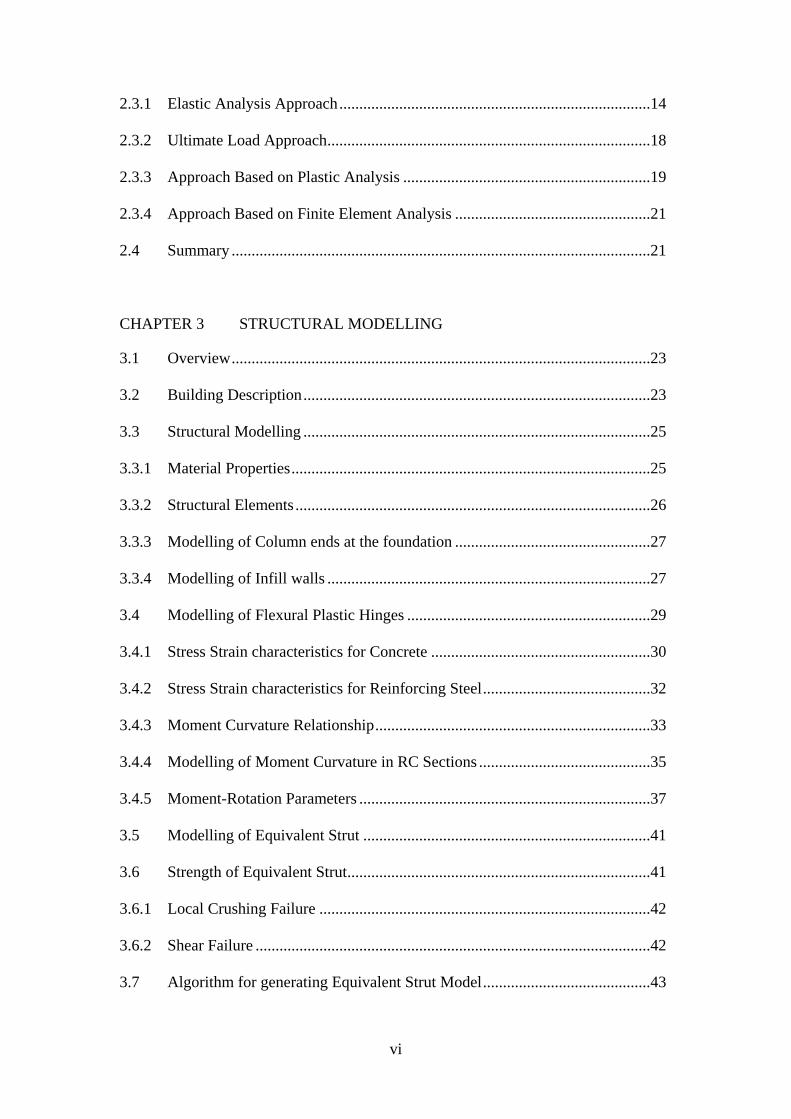
2.3.1 Elastic Analysis Approach ..............................................................................14
2.3.2 Ultimate Load Approach .................................................................................18
2.3.3 Approach Based on Plastic Analysis ..............................................................19
2.3.4 Approach Based on Finite Element Analysis .................................................21
2.4 Summary .........................................................................................................21
CHAPTER 3 STRUCTURAL MODELLING
3.1 Overview .........................................................................................................23
3.2 Building Description .......................................................................................23
3.3 Structural Modelling .......................................................................................25
3.3.1 Material Properties ..........................................................................................25
3.3.2 Structural Elements .........................................................................................26
3.3.3 Modelling of Column ends at the foundation .................................................27
3.3.4 Modelling of Infill walls .................................................................................27
3.4 Modelling of Flexural Plastic Hinges .............................................................29
3.4.1 Stress Strain characteristics for Concrete .......................................................30
3.4.2 Stress Strain characteristics for Reinforcing Steel ..........................................32
3.4.3 Moment Curvature Relationship .....................................................................33
3.4.4 Modelling of Moment Curvature in RC Sections ...........................................35
3.4.5 Moment-Rotation Parameters .........................................................................37
3.5 Modelling of Equivalent Strut ........................................................................41
3.6 Strength of Equivalent Strut ............................................................................41
3.6.1 Local Crushing Failure ...................................................................................42
3.6.2 Shear Failure ...................................................................................................42
3.7 Algorithm for generating Equivalent Strut Model ..........................................43
vii
3.8 Modelling of Axial Hinges for Equivalent Struts ...........................................44
3.8.1 Non-Linearity of Axial Hinge Property ..........................................................44
3.8.2 Elastic Analysis Approach ..............................................................................45
3.9 Summary .........................................................................................................47
CHAPTER 4 RESULTS FROM LINEAR ANALYSIS
4.1 Introduction .....................................................................................................48
4.1.1 Equivalent Static Analysis ..............................................................................49
4.1.2 Response Spectrum Analysis ..........................................................................51
4.2 Results of Linear Analysis and Discussions ...................................................54
4.2.1 Calculation of Time period and Base shear ....................................................54
4.2.2 Shift in Period .................................................................................................56
4.2.3 Column Interaction ratios ...............................................................................57
4.2.4 Beam demand to capacity ratio .......................................................................59
4.3 Summary .........................................................................................................62
CHAPTER 5 RESULTS FROM NON-LINEAR ANALYSIS
5.1 Introduction .....................................................................................................63
5.2 Pushover Analysis ...........................................................................................63
5.3 Pushover Analysis Procedure .........................................................................65
5.4 Performance Levels of Structures and Elements ............................................66
5.5 Results from Pushover Analysis .....................................................................67
5.6 Summary .........................................................................................................75

viii
CHAPTER 6 SUMMARY AND CONCLUSIONS
6.1 Summary .........................................................................................................77
6.2 Conclusions .....................................................................................................78
6.3 Scope for future work .....................................................................................79
REFERENCES ...........................................................................................................80
ix
LIST OF TABLES
Title Page No
Table 3.1 Longitudinal reinforcement details of frame sections ...........................25
Table 4.1 Comparison of fundamental time periods for with and without infill for pinned and fixed end support condition ...........................................55
Table 4.2(a) Shift in period for fixed end support condition ......................................56
Table 4.2(b) Shift in period for pinned end support condition ...................................57
Table 4.3(a) Comparison of Ground Storey Column Interaction Ratio for Pinned End Case ................................................................................................58
Table 4.3(b) Comparison of Ground Storey Column Interaction Ratio for Fixed End Case ................................................................................................58
Table 4.4(a) Comparison of Beam DCR (Pinned-End) ..............................................60
Table 4.4(b) Comparison of Beam DCR (Fixed-End) ................................................60
x
LIST OF FIGURES
Title Page No
Fig. 1.1 Typical example of OGS Building ..............................................................1
Fig. 1.2 Behaviour of OGS buildings like as inverted pendulum .............................2
Fig. 1.3 General mode of failure in OGS buildings ..................................................3
Fig. 1.4 Behaviour of Infilled Frames (ref. Asokan 2006) .......................................5
Fig. 2.1 A typical panel of the infilled frame ..........................................................15
Fig. 2.2 Behaviour of typical panel subjected to lateral load ..................................15
Fig. 2.3 Position of eccentric strut (Al-Chaar, 2002) ..............................................18
Fig. 3.1 Typical floor plan of the selected building ................................................24
Fig. 3.2 Use of end offsets at beam-column joint ...................................................27
Fig. 3.3 3D Computer model of building without and with considering infill
stiffness respectively ..................................................................................28
Fig. 3.4 The coordinate system used to define the flexural and shear hinges .........29
Fig. 3.5 Typical stress-strain curve for M-20 grade concrete .................................32
Fig. 3.6 Moment-Curvature Relationship ................................................................33
Fig. 3.7 Curvature in an initially straight beam section ..........................................34
Fig. 3.8 (a) cantilever beam, (b) Bending moment distribution, and (c) Curvature
distribution (Park and Paulay 1975) ...........................................................38
Fig. 3.9 Idealised moment-rotation curve of RC elements .....................................40
Fig. 3.10 Algorithm for the calculation of equivalent strut width as per Smith and
Carter (1969) ..............................................................................................43
Fig. 3.11 Axial load versus deformation curve for equivalent strut .........................45
Fig. 4.1 Response spectra for 5 percent damping (IS 1893: 2002) .........................50
xi
Fig. 4.2 Building model under seismic load ...........................................................51
Fig. 5.1 Schematic representation of pushover analysis procedure ........................64
Fig. 5.2 Performance Level of Pushover Analysis .................................................67
Fig. 5.3 Pushover curves for pinned-end building ................................................ 69
Fig. 5.4(a) Distribution of plastic hinges for WI building model ...............................70
Fig. 5.4(b) Distribution of plastic hinges for WOI building model ............................70
Fig. 5.3 Pushover curves for pinned-end building .................................................69
Fig. 5.5 Storey displacement at collapse for pinned end case (Push X) .................71
Fig. 5.6 Pushover curves for fixed-end building model ..........................................73
Fig. 5.7 Inter-storey drift at collapse as obtained from pushover analysis in X
direction ......................................................................................................74
Fig. 5.8 Hinge distribution at collapse for fixed-end building model (X-direction
push) ...........................................................................................................75

xii
ABBREVIATIONS
ABS maximum ABSolute response
CP Collapse Prevention
CQC Complete Quadratic Combination
DCR Demand to Capacity Ratio
ESA Equivalent Static Analysis
IO Immediate Occupancy
IR Interaction Ratio
IS Indian Standards
LS Life Safety
MDOF Multi Degree Of Freedom
MF Multiplication Factor
NDA Nonlinear Dynamic Analysis
OGS Open Ground Storey
PA Pushover Analysis
RC Reinforced Concrete
RSA Response Spectrum Analysis
SDOF Single Degree Of Freedom
SRSS Square Root of Sum of Squares
WI With Infill
WOI Without Infill
xiii
NOTATIONS
ENGLISH l length between centre lines of the column
l’ clear length of infill panel
le eccentricity of equivalent strut
Rc failure load of infilled frame corresponding to corner crushing
Rs failure load of infilled frame corresponding to shear crushing
Ri instantaneous axial load of equivalent diagonal strut
T fundamental time period of the building (in seconds)
VB design base shear
Sa/g average response acceleration coefficient for rock or soil sites based on
appropriate natural periods and damping of the structure
w width of equivalent strut
w’ width of equivalent strut considering infilled panel aspect ratio
Ah design horizontal seismic coefficient
W seismic weight of the building
Z zone factor
I importance factor
R response reduction factor
d base dimension of the building
fm’ compressive strength of masonry infills
fbs’ the bond shear strength between the masonry and mortar.
Es elastic modulus of the equivalent strut
xiv
Ec elastic modulus of the column in the bounding frame
Ic moment of inertia of the column
h' clear height of infill wall
h height of column between centrelines of beams
t thickness of infill wall
Mx moment about x axis
My moment about y axis
Mx,c maximum uniaxial bending moment capacity along x axis
My,c maximum uniaxial bending moment capacity along y axis
P axial load on the member
GREEK SYMBOLS
λh relative stiffness parameter for infilled frame
θ slope of the infill wall diagonal to the horizontal
α, β Dynamic amplification factor
γ Coefficient for accidental eccentricity
Equivalent damping ratio
Frequency
Circular frequency in ith and jth mode respectively
nth mode natural frequency
δmax Maximum displacement of a building floor
δavg Average displacements of two extreme points of a building floor
Modal damping ratio
Λ Plan aspect ratio of the building (= Lmax/Lmin)
xv
Response quantity in mode i and j respectively
Displacement ductility ratio
Cross-modal coefficient
Volumetric ratio of confining steel
Damping ratio
Steel strain at maximum tensile stress
Extreme fibre strains
Curvature
Mode shape coefficient at floor i in k mode
nth mode shape at roof level
Ultimate curvature
Yield curvature
Ultimate rotation
Yield rotation
CHAPTER 1
INTRODUCTION
1.1 OVERVIEW
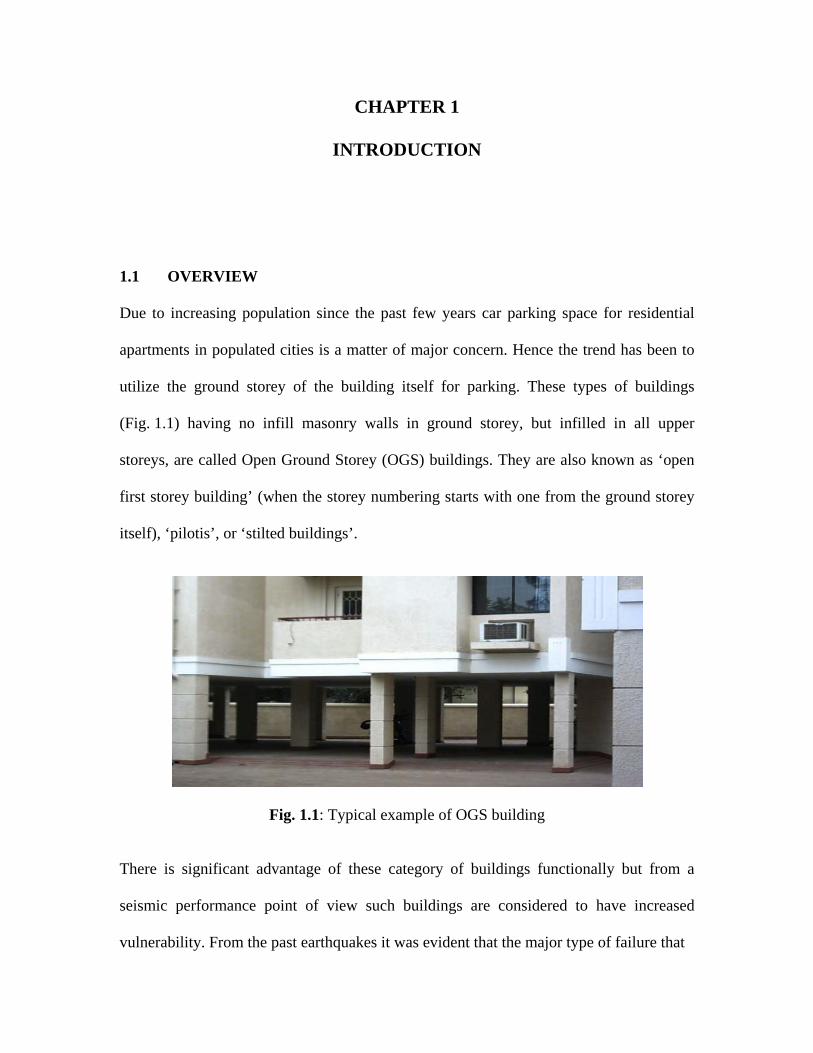
Due to increasing population since the past few years car parking space for residential
apartments in populated cities is a matter of major concern. Hence the trend has been to
utilize the ground storey of the building itself for parking. These types of buildings
(Fig. 1.1) having no infill masonry walls in ground storey, but infilled in all upper
storeys, are called Open Ground Storey (OGS) buildings. They are also known as ‘open
first storey building’ (when the storey numbering starts with one from the ground storey
itself), ‘pilotis’, or ‘stilted buildings’.
Fig. 1.1: Typical example of OGS building
There is significant advantage of these category of buildings functionally but from a
seismic performance point of view such buildings are considered to have increased
vulnerability. From the past earthquakes it was evident that the major type of failure that
2
occurred in OGS buildings included snapping of lateral ties, crushing of core concrete,
buckling of longitudinal reinforcement bars etc. Due to the presence of infill walls in the
entire upper storey except for the ground storey makes the upper storeys much stiffer than
the open ground storey. Thus, the upper storeys move almost together as a single block,
and most of the horizontal displacement of the building occurs in the soft ground storey
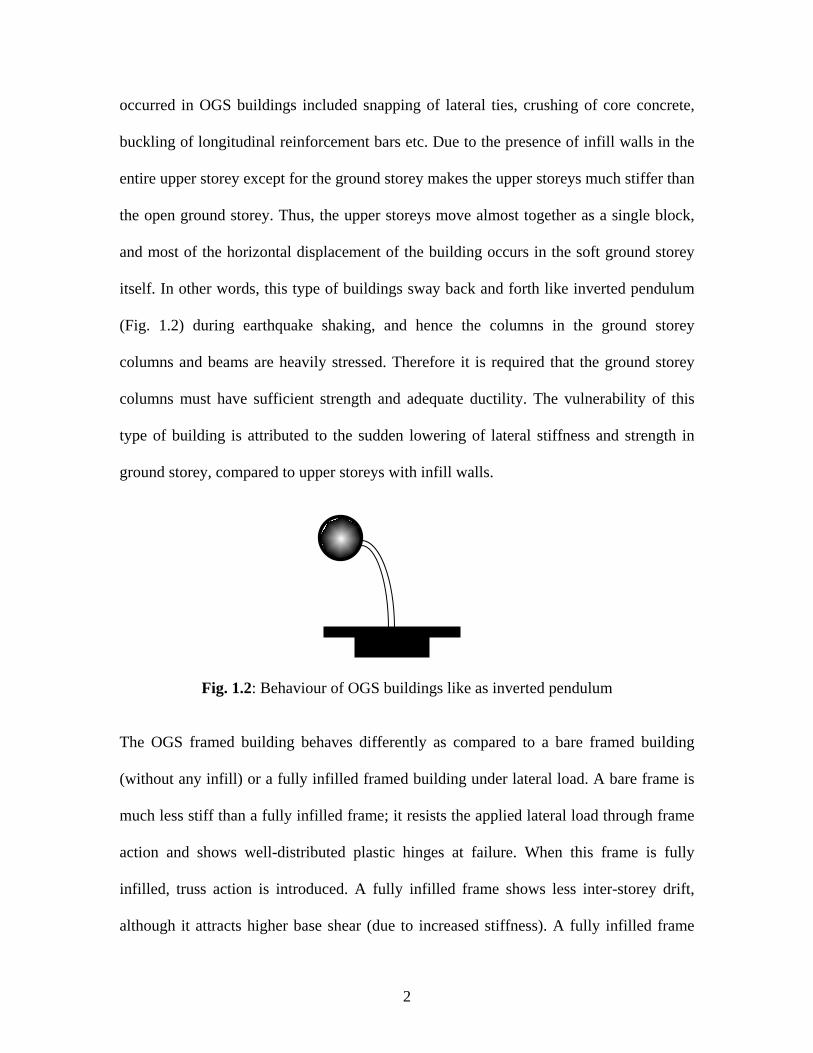
itself. In other words, this type of buildings sway back and forth like inverted pendulum
(Fig. 1.2) during earthquake shaking, and hence the columns in the ground storey
columns and beams are heavily stressed. Therefore it is required that the ground storey
columns must have sufficient strength and adequate ductility. The vulnerability of this
type of building is attributed to the sudden lowering of lateral stiffness and strength in
ground storey, compared to upper storeys with infill walls.
Fig. 1.2: Behaviour of OGS buildings like as inverted pendulum
The OGS framed building behaves differently as compared to a bare framed building
(without any infill) or a fully infilled framed building under lateral load. A bare frame is
much less stiff than a fully infilled frame; it resists the applied lateral load through frame
action and shows well-distributed plastic hinges at failure. When this frame is fully
infilled, truss action is introduced. A fully infilled frame shows less inter-storey drift,
although it attracts higher base shear (due to increased stiffness). A fully infilled frame
3
yields less force in the frame elements and dissipates greater energy through infill walls.
The strength and stiffness of infill walls in infilled frame buildings are ignored in the
structural modelling in conventional design practice. The design in such cases will
generally be conservative in the case of fully infilled framed building. But things will be
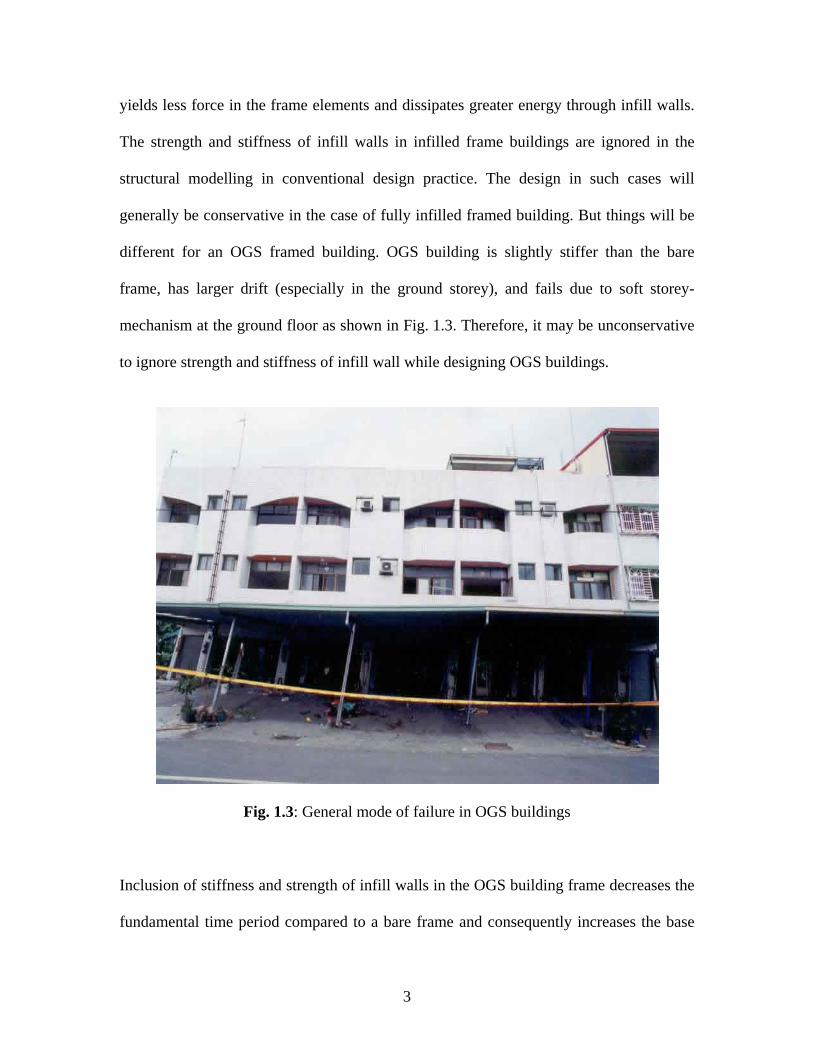
different for an OGS framed building. OGS building is slightly stiffer than the bare
frame, has larger drift (especially in the ground storey), and fails due to soft storey-
mechanism at the ground floor as shown in Fig. 1.3. Therefore, it may be unconservative
to ignore strength and stiffness of infill wall while designing OGS buildings.
Fig. 1.3: General mode of failure in OGS buildings
Inclusion of stiffness and strength of infill walls in the OGS building frame decreases the
fundamental time period compared to a bare frame and consequently increases the base
4
shear demand and the design forces in the ground storey beams and columns. This
increased design forces in the ground storey beams and columns of the OGS buildings are
not captured in the conventional bare frame analysis. An appropriate way to analyse the
OGS buildings is to model the strength and stiffness of infill walls. Unfortunately, no
guidelines are given in IS 1893: 2002 (Part-1) for modelling the infill walls. As an
alternative a bare frame analysis is generally used that ignores the strength and stiffness
of the infill walls.
The failure pattern observed in the buildings during the Jabalpur earthquake (1997)
showed the vulnerability of OGS buildings. Some reinforced concrete framed building
which collapsed partially, had open ground storey on one side for parking, and brick infill
walls on the other side. In the aftermath of the Bhuj earthquake, the IS 1893 code was
revised in 2002, incorporating new design recommendations to address OGS buildings.
Clause 7.10.3(a) states: “The columns and beams of the soft storey are to be designed for
2.5 times the storey shears and moments calculated under seismic loads of bare frames.”
The factor 2.5 can be told as a multiplication factor (MF). This multiplication factor (MF)
is supposed to be the compensation for the stiffness discontinuity. Other national codes
also recommend multiplication factors for this type of buildings. The conservative nature
of this empirical recommendation of IS code was first pointed out by Kanitkar and
Kanitkar (2001), Subramanian (2004) and Kaushik (2006). Hence the aim of this thesis is
to check the applicability of the multiplication factor of 2.5 in the ground storey beams
and column when the building is to be designed as open ground storey framed building
and to study the effect of infill strength and stiffness in the seismic analysis of low rise
open ground storey building.
5
Non-linear dynamic (NDA) analysis is considered to be the most accurate but at the same
time it is most rigorous among all methods. Hence for the present study Equivalent static
analysis (ESA), Response spectrum analysis (RSA) and Pushover analysis (PA) is
considered for the comparative study. To carry out these analyses a typical building
model with two different cases and support conditions are considered.
i) Considering infill strength and stiffness
ii) Without considering infill strength and stiffness
Support condition has a great influence in the global stiffness of the building. Therefore
building models were analysed in the present study for two commonly used support
conditions: (a) fixed and (b) pinned end support conditions. The hinged end support
conditions are considered in case of isolated footing. From literature it is obvious that a
hinge is to be provided at column end at the bottom of the foundation. However when it
is founded on hard rock, the column end may be modelled as fixed, with the level of
fixity at the top of the footing.
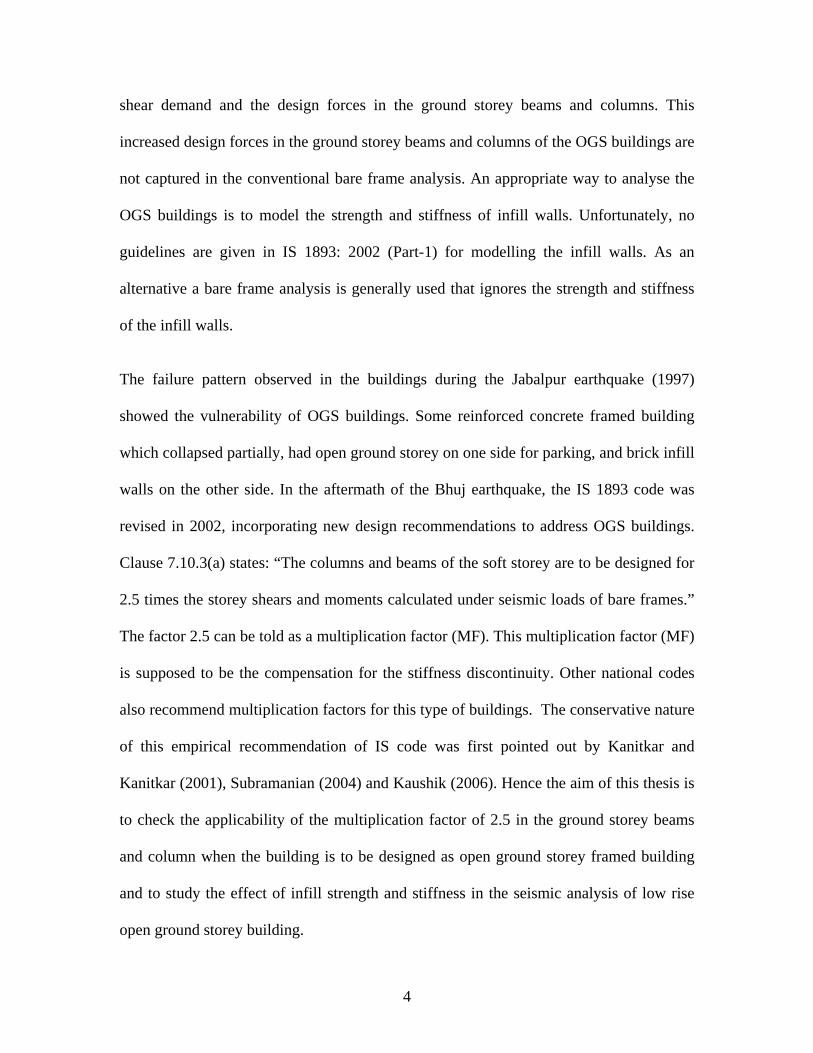
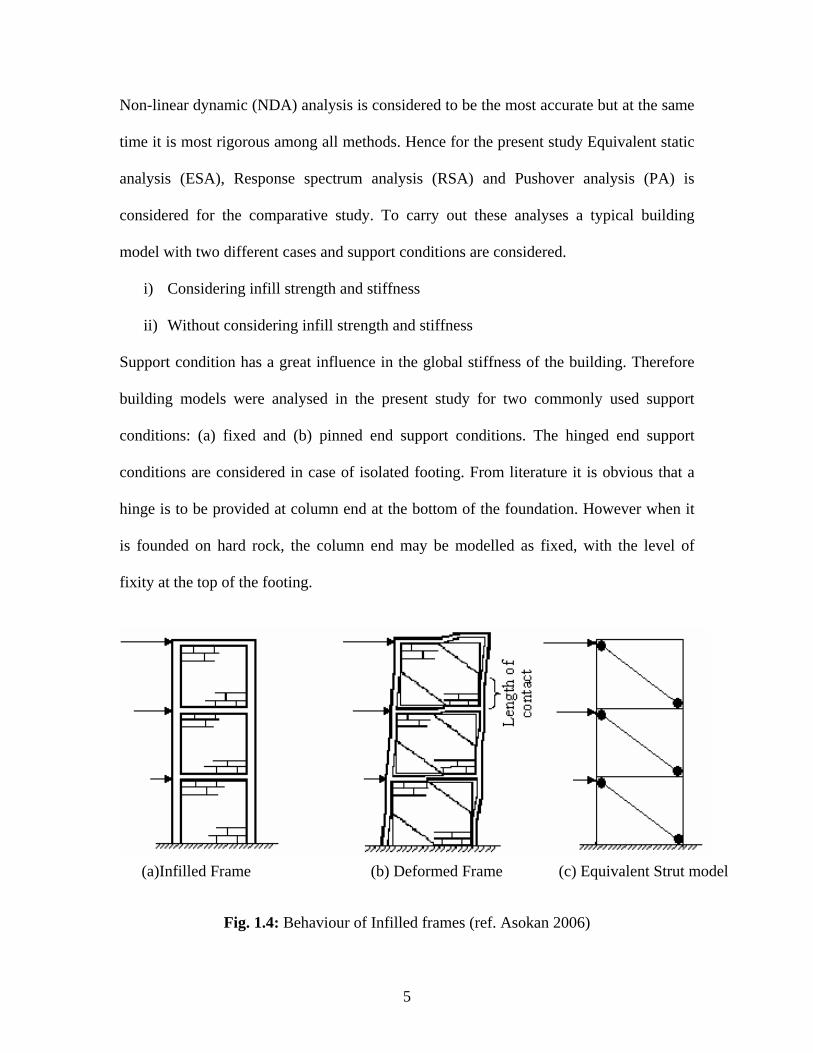
Fig. 1.4: Behaviour of Infilled frames (ref. Asokan 2006)
(a)Infilled Frame (b) Deformed Frame (c) Equivalent Strut model
6
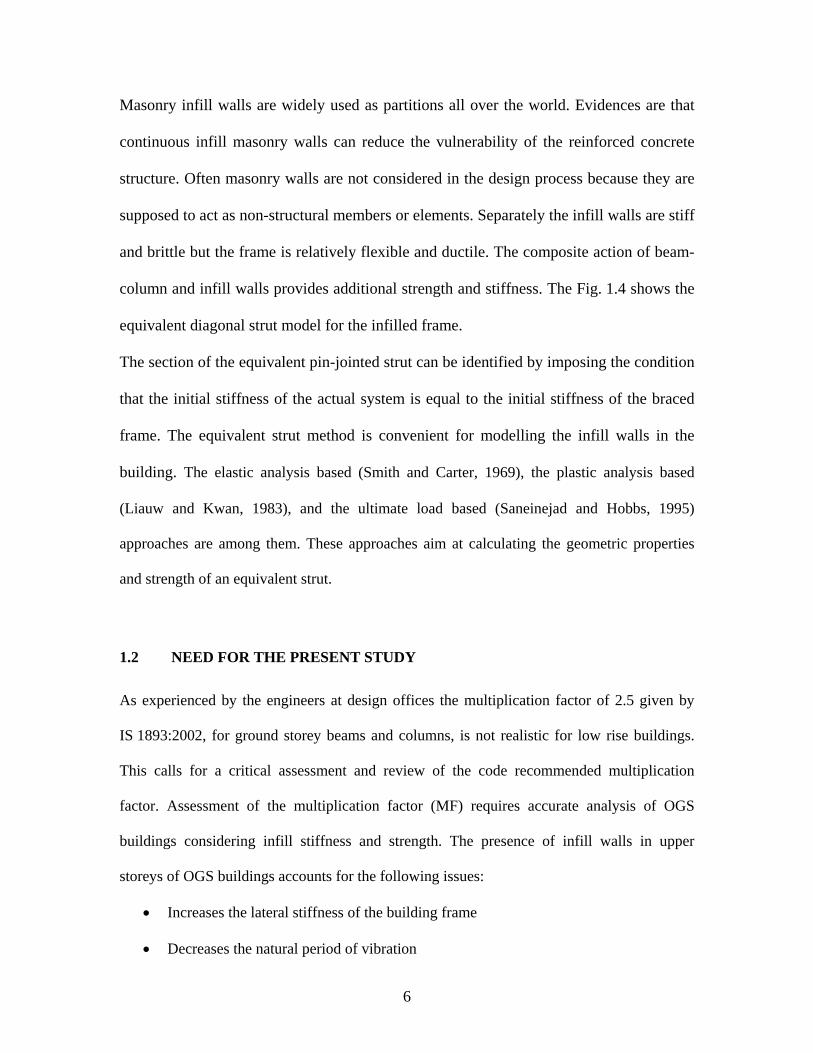
Masonry infill walls are widely used as partitions all over the world. Evidences are that
continuous infill masonry walls can reduce the vulnerability of the reinforced concrete
structure. Often masonry walls are not considered in the design process because they are
supposed to act as non-structural members or elements. Separately the infill walls are stiff
and brittle but the frame is relatively flexible and ductile. The composite action of beam-
column and infill walls provides additional strength and stiffness. The Fig. 1.4 shows the
equivalent diagonal strut model for the infilled frame.
The section of the equivalent pin-jointed strut can be identified by imposing the condition
that the initial stiffness of the actual system is equal to the initial stiffness of the braced
frame. The equivalent strut method is convenient for modelling the infill walls in the
building. The elastic analysis based (Smith and Carter, 1969), the plastic analysis based
(Liauw and Kwan, 1983), and the ultimate load based (Saneinejad and Hobbs, 1995)
approaches are among them. These approaches aim at calculating the geometric properties
and strength of an equivalent strut.
1.2 NEED FOR THE PRESENT STUDY
As experienced by the engineers at design offices the multiplication factor of 2.5 given by
IS 1893:2002, for ground storey beams and columns, is not realistic for low rise buildings.
This calls for a critical assessment and review of the code recommended multiplication
factor. Assessment of the multiplication factor (MF) requires accurate analysis of OGS
buildings considering infill stiffness and strength. The presence of infill walls in upper
storeys of OGS buildings accounts for the following issues:
• Increases the lateral stiffness of the building frame
• Decreases the natural period of vibration

7
• Increases the base shear
• Increases the shear forces and bending moments in the ground storey columns.
There is a clear need to assess the design guidelines recommended by the IS code 1893:2002
based on accurate analysis.
1.3 OBJECTIVE
Based on the literature review presented in Chapter 2, the salient objectives of the present
study have been identified as follows:
i) To study the effect of infill strength and stiffness in the seismic analysis of
OGS buildings.
ii) To check the applicability of the multiplication factor of 2.5 as given in the
Indian Standard IS 1893:2002 for design of low rise open ground storey
building.
iii) To assess the effect of support condition on the seismic behaviour of OGS
buildings.
1.4 SCOPE OF THE STUDY
Open ground storey (OGS) buildings are commonly constructed in populated countries
like India since they provide much needed parking space in an urban environment.
Failures observed in past earthquakes show that the collapse of such buildings is
predominantly due to the formation of soft-storey mechanism in the ground storey
columns.
8
• This study deals with two different types of support conditions commonly used in
analysis and design i.e., fixed and pinned end support condition. All other types of
support conditions are not considered in this project. Soil-structure interaction is
ignored for the present study.
• Number of storey and number of bays in two orthogonal horizontal directions may
have a great effect on the lateral load resisting behaviour of OGS buildings.
However, the conclusions drawn in the present study are based on a case study of
a low-rise building (4 storeys).
• It is assumed in the present study that infill panels are having no window and door
openings while modelling the infill walls.
• Point plastic flexural hinges only is considered for modelling the frame elements
as the building is designed as per current design codes of practices and it is
assumed no shear failure will precede the flexural failure.
• In the present study building models are analyzed only using linear static,
dynamic analysis and nonlinear static (pushover) analysis. Although nonlinear
dynamic analysis is superior to other analysis procedures, it is kept outside the
scope of the present study due to time limitation.
1.5 METHODOLOGY
The methodology worked out to achieve the above-mentioned objectives is as follows:
(i) Review the existing literature and Indian design code provision for designing
the OGS building
(ii) Select an existing building model for the case study.
9
(iii) Model the selected building with and without considering infill strength/
stiffness. Models need to consider two types of end support conditions as
mentioned above.
(iv) Linear analysis of the selected building model and a comparative study on the
results obtained from the analyses.
(v) Nonlinear analysis of the selected building model and a comparative study on
the results obtained from the analyses.
(vi) Observations of results and discussions
1.6 ORGANIZATION OF THESIS
This introductory chapter (Chapter 1) gives a brief introduction to the importance of the
seismic evaluation of OGS buildings and the reason why they are adopted by the
designers in spite of the fact that they are more vulnerable during earthquake. A literature
survey on behaviour of OGS buildings and infill walls during earthquake, have been
presented in this chapter. The need, objectives and scope of the proposed research work
are identified along with the methodology that is followed to carry out the work.
Chapter 2 presents the description of the selected building and the structural modelling
parameters and modelling of infill walls. This chapter also describes the procedures and
important parameters to model the nonlinear point plastic hinges.

10
Results obtained from linear analyses of the building model considering various cases are
presented in Chapter 3. This chapter critically evaluate the linear analysis results to
compare the building responses with and without considering infill strength/ stiffness
Nonlinear analysis is an important tool to correctly evaluate the seismic performance of a
building. Nonlinear static (pushover) analysis of the selected building model is carried
out as part of this project and the corresponding results are presented in Chapter 4.
Finally, in Chapter 5, the summary and conclusions are given. The scope for future work
is also discussed.
CHAPTER 2
REVIEW OF LITERATURE
2.1 OVERVIEW
A state of the art literature review is carried out as part of the present study. This chapter
presents a brief summary of the literature review. The literature review is divided into
two parts. The first part deals with the seismic behaviour of the open ground storey
buildings whereas the second part of this chapter discusses about the previous work
carried out on the linear and nonlinear modelling of infill walls.
2.2 SEISMIC BEHAVIOUR OF OPEN GROUND STOREY BUILDING
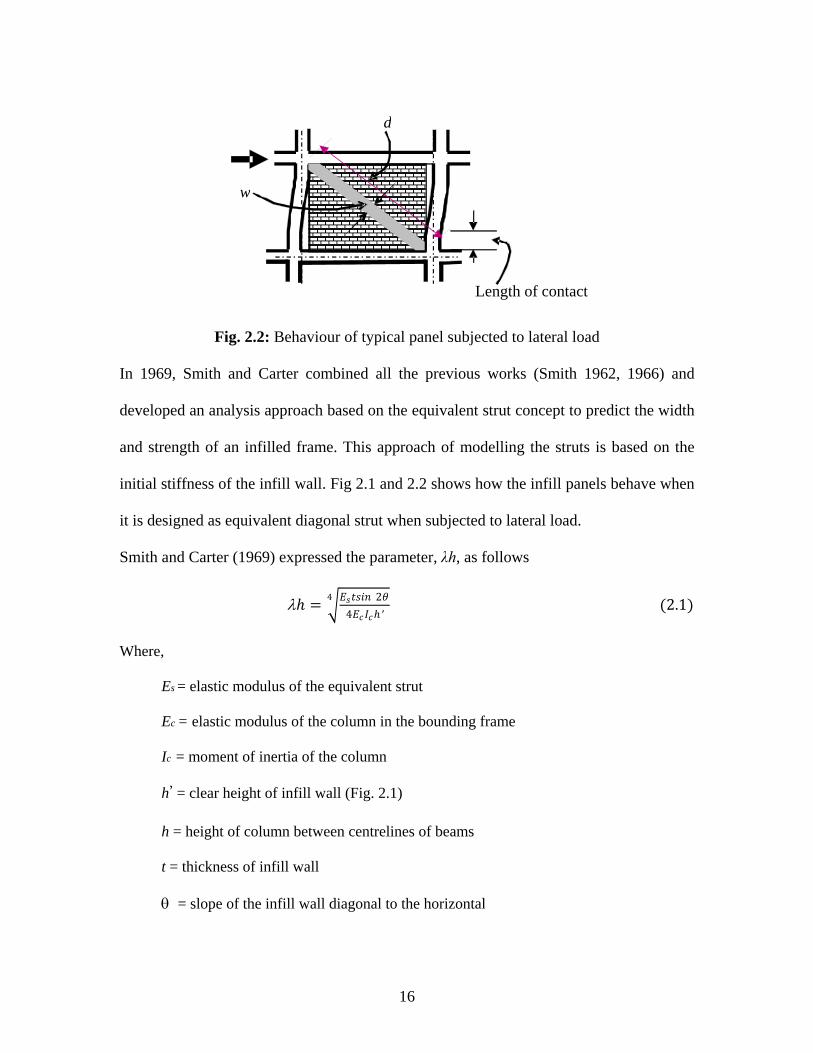
Under lateral loading the frame and the infill wall stay intact initially. As the lateral load
increases the infill wall get separated from the surrounding frame at the unloaded
(tension) corner, but at the compression corners the infill walls are still intact. The length
over which the infill wall and the frame are intact is called the length of contact. Load
transfer occurs through an imaginary diagonal which acts like a compression strut. Due to
this behaviour of infill wall, they can be modelled as an equivalent diagonal strut
connecting the two compressive corners diagonally. The stiffness property should be such
that the strut is active only when subjected to compression. Thus, under lateral loading
only one diagonal will be operational at a time. This concept was first put forward by
Holmes (1961).
12
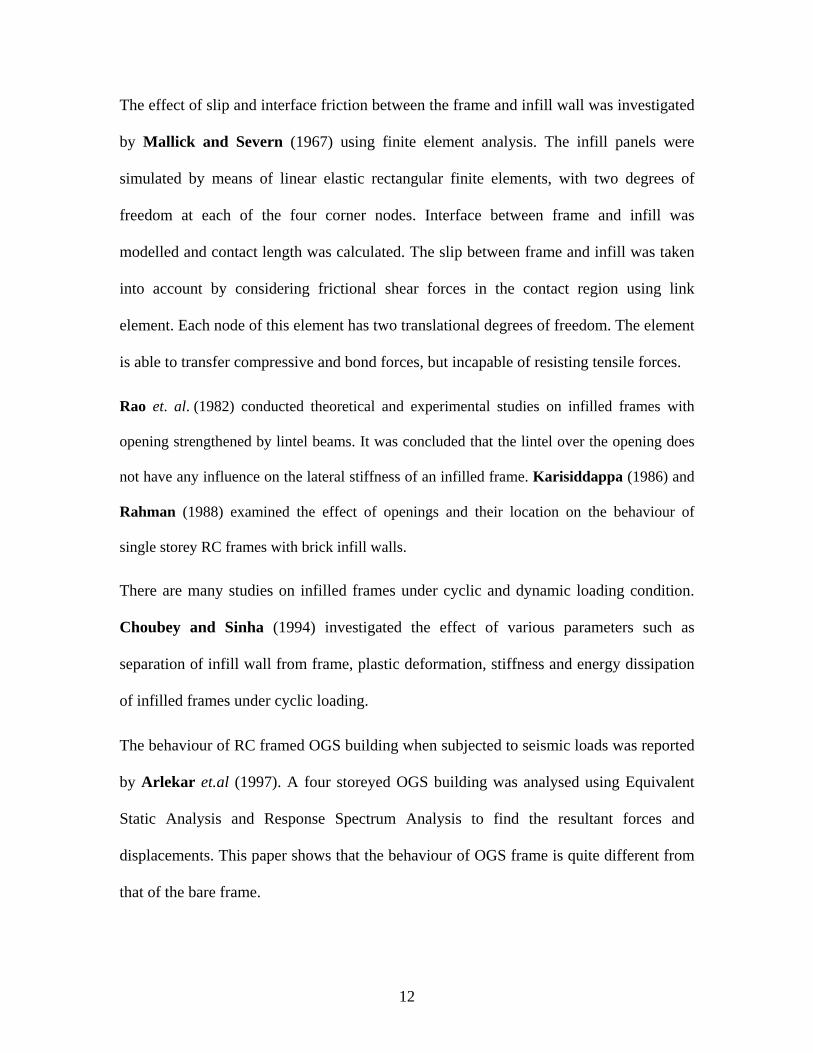
The effect of slip and interface friction between the frame and infill wall was investigated
by Mallick and Severn (1967) using finite element analysis. The infill panels were
simulated by means of linear elastic rectangular finite elements, with two degrees of
freedom at each of the four corner nodes. Interface between frame and infill was
modelled and contact length was calculated. The slip between frame and infill was taken
into account by considering frictional shear forces in the contact region using link
element. Each node of this element has two translational degrees of freedom. The element
is able to transfer compressive and bond forces, but incapable of resisting tensile forces.
Rao et. al. (1982) conducted theoretical and experimental studies on infilled frames with
opening strengthened by lintel beams. It was concluded that the lintel over the opening does
not have any influence on the lateral stiffness of an infilled frame. Karisiddappa (1986) and
Rahman (1988) examined the effect of openings and their location on the behaviour of
single storey RC frames with brick infill walls.
There are many studies on infilled frames under cyclic and dynamic loading condition.
Choubey and Sinha (1994) investigated the effect of various parameters such as
separation of infill wall from frame, plastic deformation, stiffness and energy dissipation
of infilled frames under cyclic loading.
The behaviour of RC framed OGS building when subjected to seismic loads was reported
by Arlekar et.al (1997). A four storeyed OGS building was analysed using Equivalent
Static Analysis and Response Spectrum Analysis to find the resultant forces and
displacements. This paper shows that the behaviour of OGS frame is quite different from
that of the bare frame.
13
The effect of different parameters such as plan aspect ratio, relative stiffness, and number
of bays on the behaviour of infilled frame was studied by Riddington and Smith (1997).
Scarlet (1997) studied the qualification of seismic forces in OGS buildings. A
multiplication factor for base shear for OGS building was proposed. This procedure
requires modelling the stiffness of the infill walls in the analysis. The study proposed a
multiplication factor ranging from 1.86 to 3.28 as the number of storey increases from six
to twenty.
Deodhar and Patel (1998) pointed out that even though the brick masonry in infilled
frame are intended to be non-structural, they can have considerable influence on the
lateral response of the building.
Davis and Menon (2004) concluded that the presence of masonry infill panels modifies
the structural force distribution significantly in an OGS building. The total storey shear
force increases as the stiffness of the building increases in the presence of masonry infill
at the upper floor of the building. Also, the bending moments in the ground floor columns
increase (more than two fold), and the mode of failure is by soft storey mechanism
(formation of hinges in ground floor columns).
Das and Murthy (2004) concluded that infill walls, when present in a structure,
generally bring down the damage suffered by the RC framed members of a fully infilled
frame during earthquake shaking. The columns, beams and infill walls of lower stories
are more vulnerable to damage than those in upper stories.
Asokan (2006) studied how the presence of masonry infill walls in the frames of a
building changes the lateral stiffness and strength of the structure. This research proposed a
14
plastic hinge model for infill wall to be used in nonlinear performance based analysis of a
building and concludes that the ultimate load (UL) approach along with the proposed
hinge property provides a better estimate of the inelastic drift of the building.
Hashmi and Madan (2008) conducted non-linear time history and pushover analysis of
OGS buildings. The study concludes that the MF prescribed by IS 1893(2002) for such
buildings is adequate for preventing collapse.
Sattar and Abbie (2010) in their study concluded that the pushover analysis showed an
increase in initial stiffness, strength, and energy dissipation of the infilled frame,
compared to the bare frame, despite the wall’s brittle failure modes. Likewise, dynamic
analysis results indicated that fully-infilled frame has the lowest collapse risk and the bare
frames were found to be the most vulnerable to earthquake-induced collapse. The better
collapse performance of fully-infilled frames was associated with the larger strength and
energy dissipation of the system, associated with the added walls.
There are numerous research efforts found on the seismic behaviour of OGS buildings
and on the modelling infill walls for linear and nonlinear analysis. However, no published
literature found on the design criterion given in IS 1893:2002 (Part-1) for OGS low rise
buildings. This is the primary motivation behind the present study.
2.3 MODELLING OF INFILL WALL
Most of the previous research model infill wall as an equivalent diagonal strut. This
section summarises different approaches to model infill was as equivalent struts.
Basically there are four approaches to model the equivalent strut found in literature.
These approaches are explained below:
15
2.3.1 Elastic Analysis Approach
The modelling of infill wall as an equivalent diagonal compression member was
introduced by Holmes (1961). The thickness of the equivalent diagonal strut was
recommended as the thickness of the infill wall itself, and the width recommended as
one-third of the diagonal length of infill panel.
The width of the strut using Airy’s stress function was found to vary from d/4 to d/11
depending on the panel proportions. Later, a number of tests conducted by Smith (1966)
proved that the equivalent strut width (w) is a function of relative stiffness (λh) of the
frame and infill wall, strength of equivalent corner crushing mode of failure (Rc) and
instantaneous diagonal compression in the infill wall (Ri).
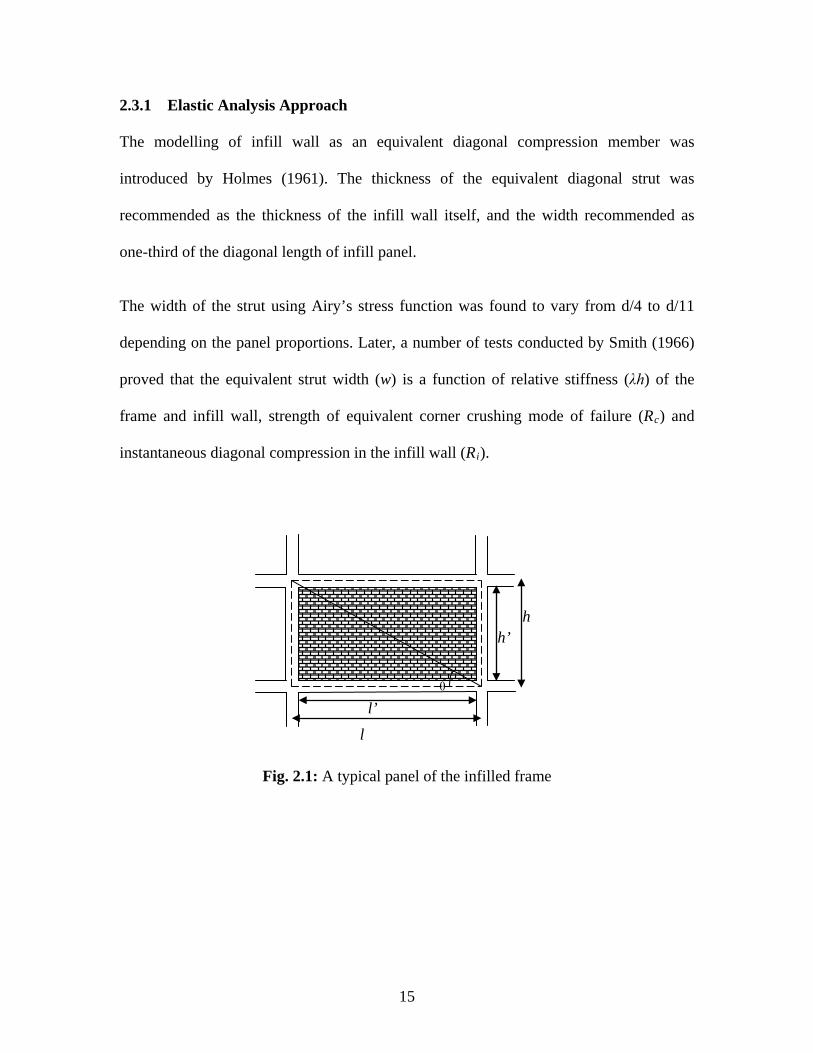
Fig. 2.1: A typical panel of the infilled frame
l l’
h h’
ᶿ
16
Fig. 2.2: Behaviour of typical panel subjected to lateral load
In 1969, Smith and Carter combined all the previous works (Smith 1962, 1966) and
developed an analysis approach based on the equivalent strut concept to predict the width
and strength of an infilled frame. This approach of modelling the struts is based on the
initial stiffness of the infill wall. Fig 2.1 and 2.2 shows how the infill panels behave when
it is designed as equivalent diagonal strut when subjected to lateral load.
Smith and Carter (1969) expressed the parameter, λh, as follows
λℎ = �𝐸𝐸𝑠𝑠𝑡𝑡𝑠𝑠𝑡𝑡𝑡𝑡 2𝜃𝜃4𝐸𝐸𝑐𝑐𝐼𝐼𝑐𝑐ℎ′
4 (2.1)
Where,
Es = elastic modulus of the equivalent strut
Ec = elastic modulus of the column in the bounding frame
Ic = moment of inertia of the column
h'= clear height of infill wall (Fig. 2.1)
h = height of column between centrelines of beams
t = thickness of infill wall
θ = slope of the infill wall diagonal to the horizontal
Length of contact
d
w
17
A relationship between the ratio of axial load in the equivalent strut (Ri) to the capacity of
the strut under corner crushing (Rc), and width (w) was derived by Ramesh (2003) from
the plot given by Smith and Carter (1969), as given by
𝑤𝑤𝑤𝑤 ′ = 1.477 + 0.0356ℎ − 0.912(𝑅𝑅𝑡𝑡 𝑅𝑅𝑐𝑐⁄ ) (2.2)
The parameter w’ accounts for the panel aspect ratio. An expression for w’/d is as given:
𝑤𝑤′
𝑑𝑑= 0.43𝑠𝑠𝑡𝑡𝑡𝑡2𝜃𝜃
√𝜆𝜆ℎ (2.3)
The strength of the equivalent strut is taken as the minimum of the two failure modes, i.e.
(i) Local crushing (Rc) of infills in the corners
(ii) Shear cracking (Rs) along the bed joint of the brickwork.
The failure load corresponding to corner crushing mode was expressed in terms of λh as:
𝑅𝑅𝑐𝑐
𝑓𝑓𝑚𝑚′ℎ𝑡𝑡=
𝜋𝜋2𝜆𝜆ℎ
𝑠𝑠𝑠𝑠𝑐𝑐𝜃𝜃 (2.4)
Where fm’ is the compressive strength of the masonry infill wall.
The following relationship was proposed for the diagonal load causing shear cracking
failure (Rs) by Govindan et. al. (1987), using the curves given by Smith and Carter, 1969
𝑅𝑅𝑠𝑠
𝑓𝑓𝑏𝑏𝑠𝑠 ′ℎ𝑡𝑡= 1.65(𝑙𝑙′ ℎ′)⁄ 0.6 (𝜆𝜆ℎ) − 0.05�𝑙𝑙′ ℎ′⁄ �0.5
(2.5)
Where fbs’ is the bond shear strength between the masonry and mortar
Another equation by Mainstone for the determination of equivalent strut width is
𝑤𝑤𝑑𝑑′
= 0.175(𝜆𝜆ℎ)−0.4 (2.6)
18
Where d’ = is the clear diagonal length of the infill walls. This expression yields a
constant strut width, independent of parameters such as axial load on the diagonal strut
and infill wall panel aspect ratio.
Paulay and Priestley (1992) suggested that the width of the strut can be taken as 1/4th of
the diagonal length of the infill panel.
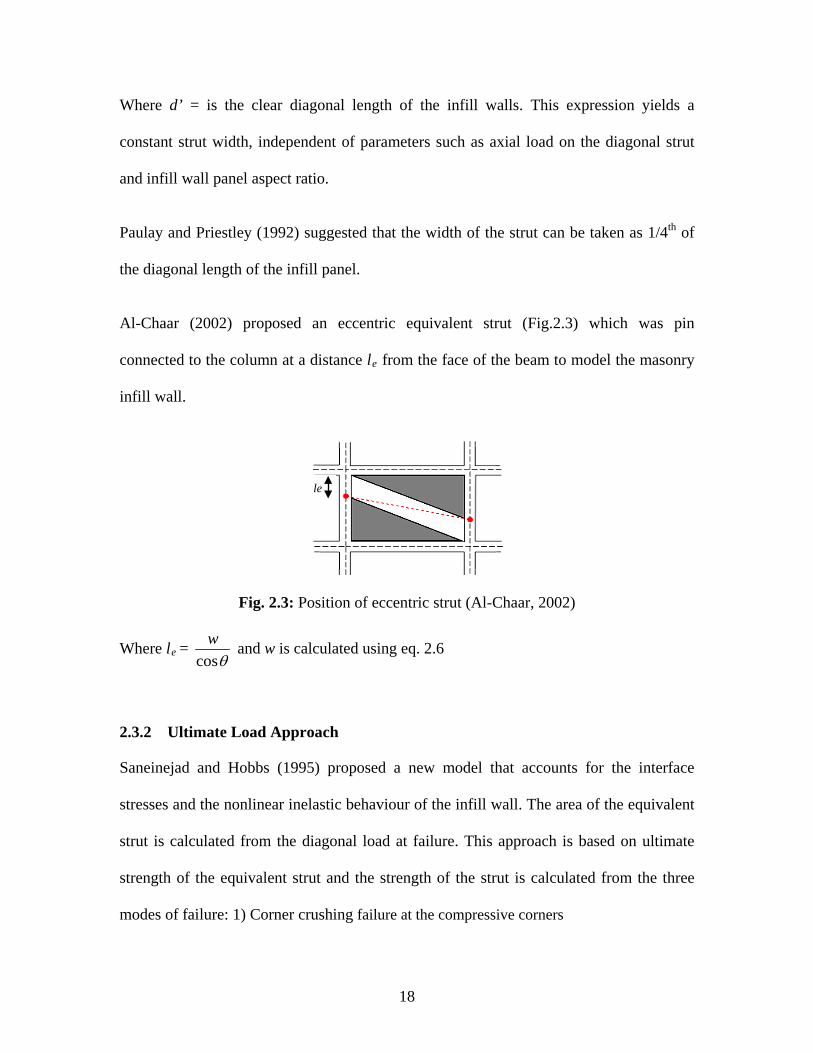
Al-Chaar (2002) proposed an eccentric equivalent strut (Fig.2.3) which was pin
connected to the column at a distance le from the face of the beam to model the masonry
infill wall.
Fig. 2.3: Position of eccentric strut (Al-Chaar, 2002)
Where le = θcos
w and w is calculated using eq. 2.6
2.3.2 Ultimate Load Approach
Saneinejad and Hobbs (1995) proposed a new model that accounts for the interface
stresses and the nonlinear inelastic behaviour of the infill wall. The area of the equivalent
strut is calculated from the diagonal load at failure. This approach is based on ultimate
strength of the equivalent strut and the strength of the strut is calculated from the three
modes of failure: 1) Corner crushing failure at the compressive corners
le
19
2) Shear cracking failure along the bedding joints of the brick work
3) Diagonal compression failure of the slender infill wall
The applicability of the two approaches stated above for different types of building analysis
was investigated. The calculation of the strut properties by both the approaches was presented
through a case study by Asokan (2006) and the justification of using either of the methods
was presented. He selected a two bay frame from an existing five storey building which was
infilled in the entire four storeys except for the ground floor. The beams and column frames
were of same size. The infill wall thickness was 120 mm and he from his study concluded
that the EA approach is simple in calculation. A higher strut width gives higher stiffness and
hence, higher base shear in a building. Since the EA approach gives higher strut width, it is
conservative in estimating the base shear. For estimating the lateral drift of a building, since
the UL approach gives lower stiffness of a strut, it is more conservative. To carry out a linear
analysis of building by the equivalent static method (static analysis) or the response spectrum
method (dynamic analysis), modelling of the infill walls by the simpler EA approach would
prove to be adequate. But in a pushover analysis (nonlinear static analysis) of a building, the
UL approach would be preferred.
2.3.3 Approach Based on Plastic Analysis
Experimental results (Smith 1962) show that there is a considerable nonlinearity in the
infilled frames before their collapse. The nonlinearity arises mainly from cracking and
crushing of the infill wall material, confinement of the infill walls in the frames, and
formation of plastic hinges in the frame members. In the elastic stage, stress
concentration occurs at all four corners. As cracks develop and propagate, the stresses at
the tensile corners are relieved while those near the compressive corners are significantly
20
increased. The frame moments increase significantly when the infill wall degrades
leading to the formation of plastic hinges and collapse of the structure.
A plastic theory was developed for integral and non-integral (without shear connectors)
infilled frames by Liauw and Kwan (1983). The stress redistribution in the frames
towards collapse was taken into account and the friction was neglected for strength
reserve for the non-integral infilled frames. The theory was based on the findings from
nonlinear finite element analysis and experimental investigation. The local crushing of
the infill wall corner is associated with a plastic hinge formation either in the beam or in
the column. The following modes of failure were identified.
• Corner crushing mode with failure in columns: This mode of failure is associated
with weak columns and strong infill wall. Failure occurs in the columns with
subsequent crushing of the infill wall at the compressive corners.
• Corner crushing mode with failure in beams: This mode of failure predominates when
beam is relatively weak and the infill wall is strong. Failure occurs in beam after the
failure of the infill wall at the compressive corners.
• Diagonal crushing mode: With relatively strong frame and weak infill wall, failure
occurs in the infill wall by crushing at the loaded corners with subsequent failure in
the joints of the frame.
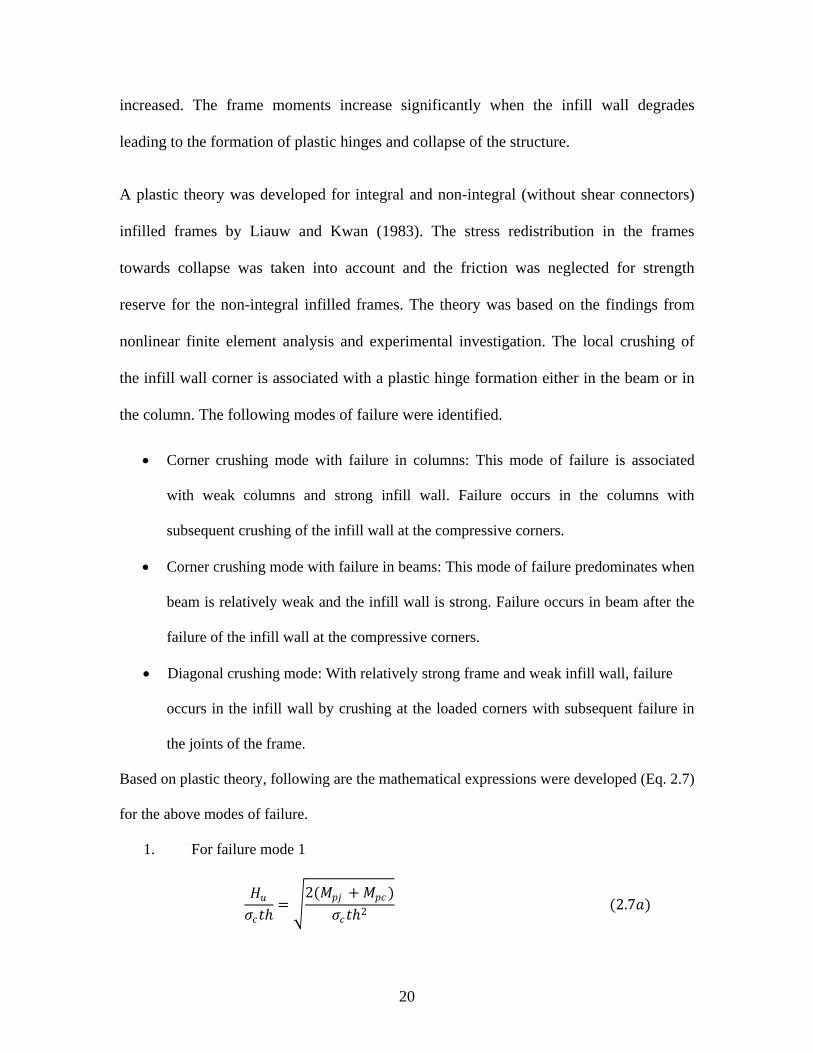
Based on plastic theory, following are the mathematical expressions were developed (Eq. 2.7)
for the above modes of failure.
1. For failure mode 1
𝐻𝐻𝑢𝑢𝜎𝜎𝑐𝑐𝑡𝑡ℎ
= �2(𝑀𝑀𝑝𝑝𝑝𝑝 + 𝑀𝑀𝑝𝑝𝑐𝑐 )
𝜎𝜎𝑐𝑐𝑡𝑡ℎ2 (2.7𝑎𝑎)
21
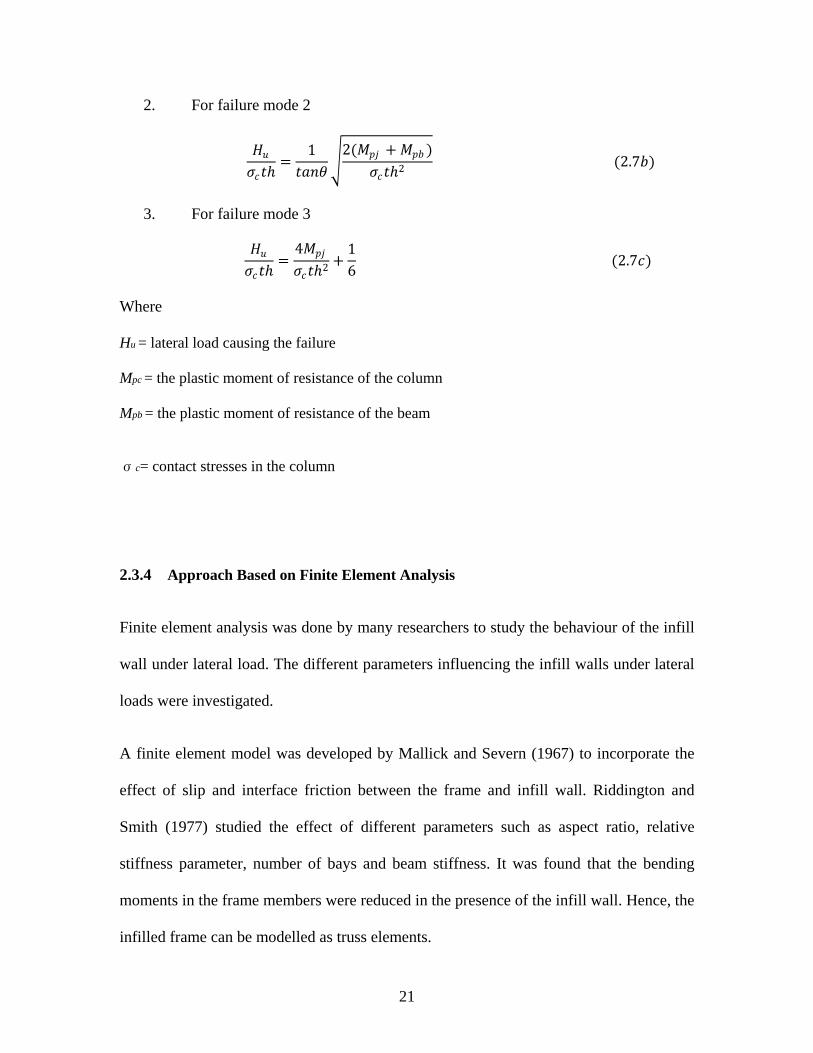
2. For failure mode 2
𝐻𝐻𝑢𝑢𝜎𝜎𝑐𝑐𝑡𝑡ℎ
=1
𝑡𝑡𝑎𝑎𝑡𝑡𝜃𝜃�
2(𝑀𝑀𝑝𝑝𝑝𝑝 + 𝑀𝑀𝑝𝑝𝑏𝑏 )𝜎𝜎𝑐𝑐𝑡𝑡ℎ2 (2.7𝑏𝑏)
3. For failure mode 3
𝐻𝐻𝑢𝑢𝜎𝜎𝑐𝑐𝑡𝑡ℎ
=4𝑀𝑀𝑝𝑝𝑝𝑝
𝜎𝜎𝑐𝑐𝑡𝑡ℎ2 +16
(2.7𝑐𝑐)
Where
Hu = lateral load causing the failure
Mpc = the plastic moment of resistance of the column
Mpb = the plastic moment of resistance of the beam
σc= contact stresses in the column
2.3.4 Approach Based on Finite Element Analysis
Finite element analysis was done by many researchers to study the behaviour of the infill
wall under lateral load. The different parameters influencing the infill walls under lateral
loads were investigated.
A finite element model was developed by Mallick and Severn (1967) to incorporate the
effect of slip and interface friction between the frame and infill wall. Riddington and
Smith (1977) studied the effect of different parameters such as aspect ratio, relative
stiffness parameter, number of bays and beam stiffness. It was found that the bending
moments in the frame members were reduced in the presence of the infill wall. Hence, the
infilled frame can be modelled as truss elements.
22
Dhanasekar and Page (1986) developed a finite element program and concluded that the
behaviour of a frame not only depends on the relative stiffness of frame and infill wall
but also on the properties of masonry, such as shear and tensile bond strengths.
2.4 SUMMARY
This Chapter discusses briefly the previous work done on the area of seismic behaviour
of open ground storey RC buildings and modelling of infill walls as equivalent diagonal
strut. From these published work it can be concluded that that even though the brick
masonry in infilled frame are intended to be non-structural, they can have considerable
influence on the lateral response of the building. Multiplication factor to increase the
design forces of ground storey columns and beams of OGS buildings is a function of
storey numbers. IS 1893:2002 (Part-1) proposal for multiplication factor of 2.5 may not
be appropriate for low rise building. The four different approaches namely (a) Elastic
analysis approach (b) Ultimate load approach (c) Plastic analysis approach and (d)
approach based on Finite element analysis, to model the infill walls is described in detail
in this chapter.
CHAPTER 3
STRUCTURAL MODELLING
3.1 OVERVIEW
It is very important to develop a computational model on which linear / non-linear, static/
dynamic analysis is performed. The first part of this chapter presents a summary of
various parameters defining the computational models, the basic assumptions and the
geometry of the selected building considered for this study.
Accurate modelling of the nonlinear properties of various structural elements is very
important in nonlinear analysis. In the present study, frame elements were modelled with
inelastic flexural hinges using point plastic model. A detailed description on the
nonlinear modelling of RC frames is presented in this chapter.
Infill walls are modelled as equivalent diagonal strut elements. The last part of the
chapter deals with the computational model of the equivalent strut including modelling
nonlinearity.
3.2 BUILDING DESCRIPTION
An existing OGS framed building located at Guwahati, India (Seismic Zone V) is
selected for the present study. The building is fairly symmetric in plan and in elevation.
This building is a G+3 storey building (12m high) and is made of Reinforced Concrete
(RC) Ordinary Moment Resisting Frames (OMRF). The concrete slab is 150mm thick at
each floor level. The brick wall thicknesses are 230 mm for external walls and 120 mm
24
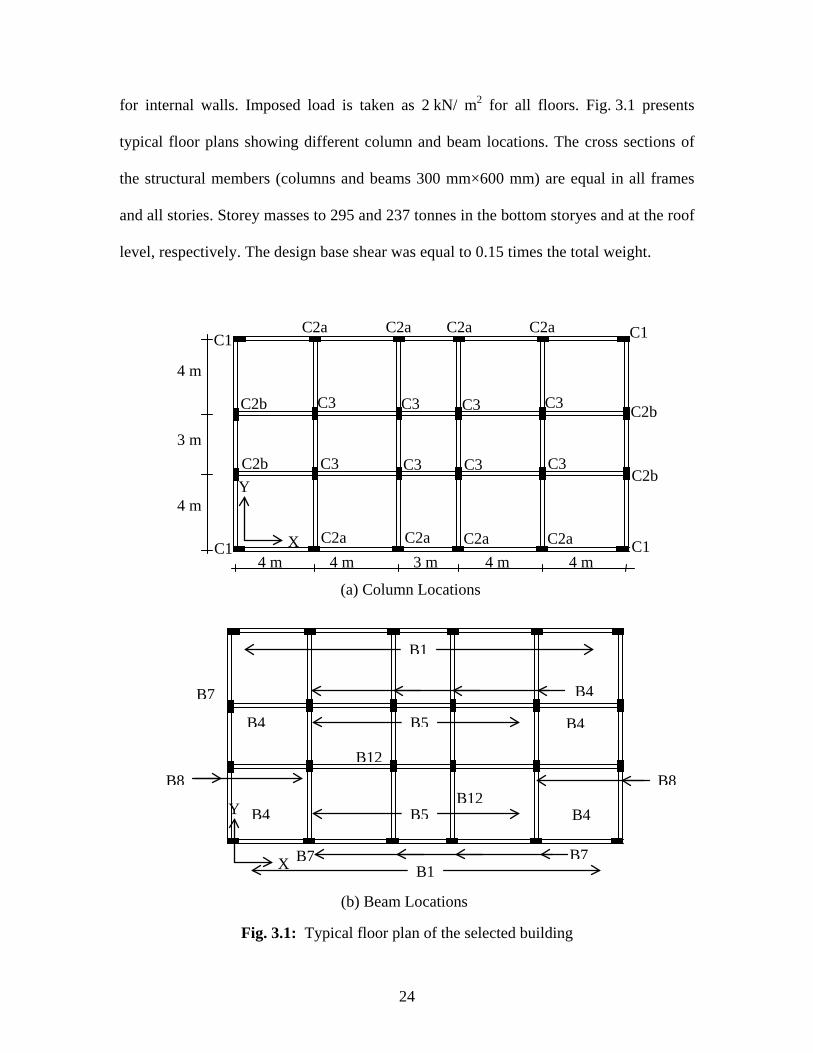
for internal walls. Imposed load is taken as 2 kN/ m2 for all floors. Fig. 3.1 presents
typical floor plans showing different column and beam locations. The cross sections of
the structural members (columns and beams 300 mm×600 mm) are equal in all frames
and all stories. Storey masses to 295 and 237 tonnes in the bottom storyes and at the roof
level, respectively. The design base shear was equal to 0.15 times the total weight.
Fig. 3.1: Typical floor plan of the selected building
4 m
4 m
3 m
B8 B8
B7
(a) Column Locations
B4
4 m 4 m 4 m 4 m 3 m
C1 C1
X
Y
C1 C1
C2b
C2b
C3
C3
C2a
C2a
C3
C3
C2a
C2a
C3
C3
C2a
C2a
C3
C3
C2a
C2a
C2b
C2b
X
Y
B1
B1
B5
B5
B4
B4
B4
B4
B12
B7
B7
B12
(b) Beam Locations
25
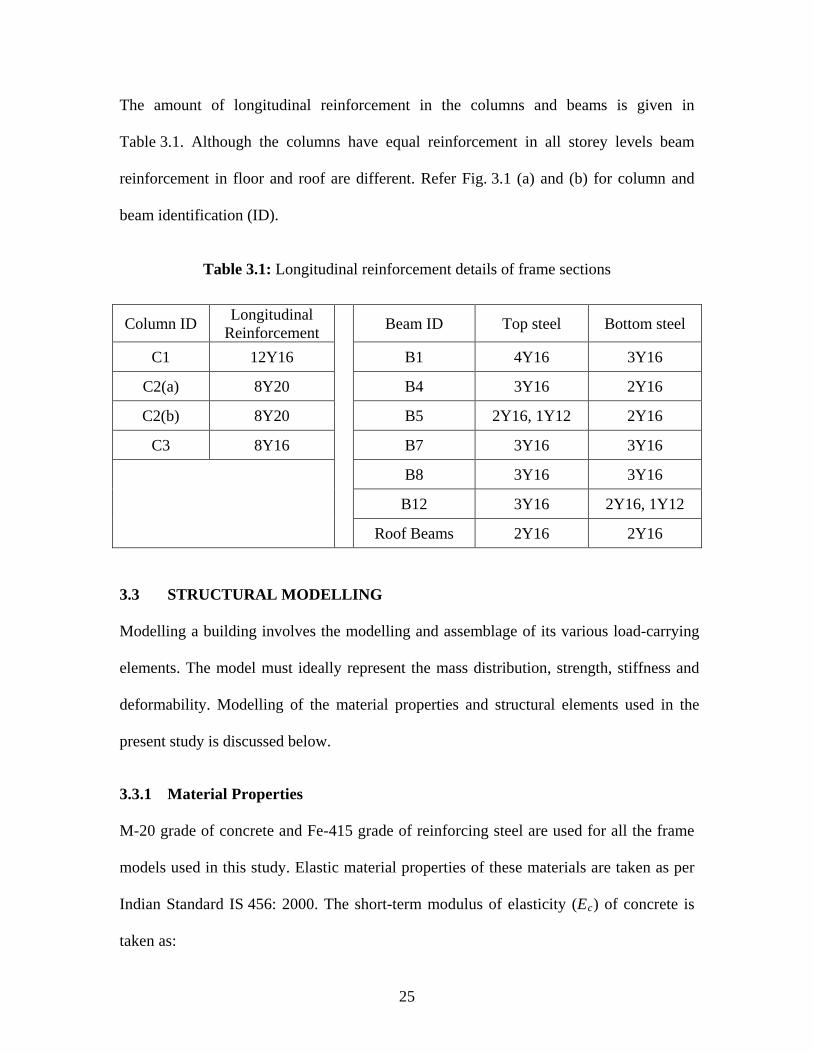
The amount of longitudinal reinforcement in the columns and beams is given in
Table 3.1. Although the columns have equal reinforcement in all storey levels beam
reinforcement in floor and roof are different. Refer Fig. 3.1 (a) and (b) for column and
beam identification (ID).
Table 3.1: Longitudinal reinforcement details of frame sections
Column ID Longitudinal Reinforcement
Beam ID Top steel Bottom steel
C1 12Y16 B1 4Y16 3Y16
C2(a) 8Y20 B4 3Y16 2Y16
C2(b) 8Y20 B5 2Y16, 1Y12 2Y16
C3 8Y16 B7 3Y16 3Y16
B8 3Y16 3Y16
B12 3Y16 2Y16, 1Y12
Roof Beams 2Y16 2Y16
3.3 STRUCTURAL MODELLING
Modelling a building involves the modelling and assemblage of its various load-carrying
elements. The model must ideally represent the mass distribution, strength, stiffness and
deformability. Modelling of the material properties and structural elements used in the
present study is discussed below.
3.3.1 Material Properties
M-20 grade of concrete and Fe-415 grade of reinforcing steel are used for all the frame
models used in this study. Elastic material properties of these materials are taken as per
Indian Standard IS 456: 2000. The short-term modulus of elasticity (Ec) of concrete is
taken as:
26
Ec = 5000�𝑓𝑓𝑐𝑐𝑐𝑐𝑀𝑀𝑀𝑀𝑀𝑀 (3.1)
fck is the characteristic compressive strength of concrete cube in MPa at 28-day (20 MPa
in this case). For the steel rebar, yield stress (fy) and modulus of elasticity (Es) is taken as
per IS 456:2000. The material chosen for the infill walls was masonry whose
compressive strength (fm’) from the literature was found out to be 1.5 MPa and the
modulus of elasticity was stated as:
Em = 350 to 800 MPa for table moulded brick
= 2500 to 5000 MPa for wire cut brick
According to FEMA 356:2000 elasticity of modulus of brick is taken as Em = 750 fm’.
For the present study the modulus of elasticity of the masonry is taken as given in
literature by Asokan (2006).
3.3.2 Structural Elements
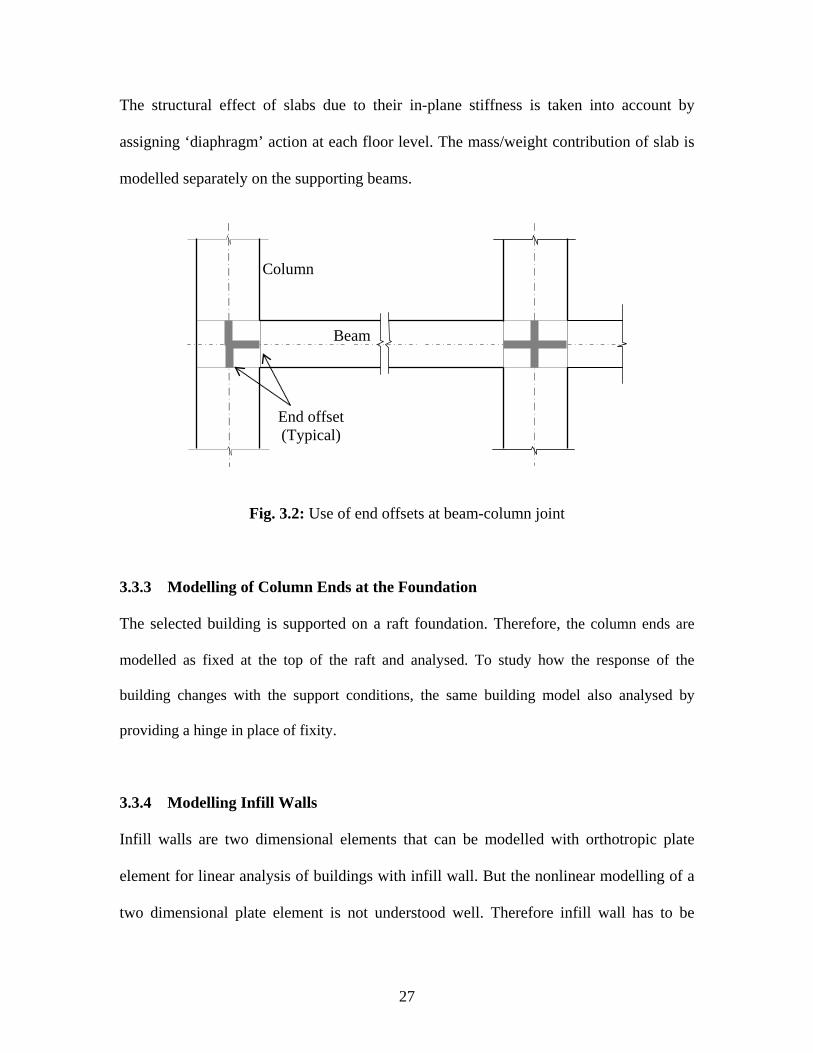
Beams and columns are modelled by 3D frame elements. The beam-column joints are
modelled by giving end-offsets to the frame elements, to obtain the bending moments and
forces at the beam and column faces. The beam-column joints are assumed to be rigid.
Beams and columns in the present study were modelled as frame elements with the
centrelines joined at nodes using commercial software SAP2000NL. The rigid beam-
column joints were modelled by using end offsets at the joints (Fig. 3.2). The floor slabs
were assumed to act as diaphragms, which ensure integral action of all the vertical lateral
load-resisting elements. The weight of the slab was distributed as triangular and
trapezoidal load to the surrounding beams.
27
The structural effect of slabs due to their in-plane stiffness is taken into account by
assigning ‘diaphragm’ action at each floor level. The mass/weight contribution of slab is
modelled separately on the supporting beams.
Fig. 3.2: Use of end offsets at beam-column joint
3.3.3 Modelling of Column Ends at the Foundation
The selected building is supported on a raft foundation. Therefore, the column ends are
modelled as fixed at the top of the raft and analysed. To study how the response of the
building changes with the support conditions, the same building model also analysed by
providing a hinge in place of fixity.
3.3.4 Modelling Infill Walls
Infill walls are two dimensional elements that can be modelled with orthotropic plate
element for linear analysis of buildings with infill wall. But the nonlinear modelling of a
two dimensional plate element is not understood well. Therefore infill wall has to be
Beam
Column
End offset (Typical)
28
modelled with a one-dimensional line element for nonlinear analysis of the buildings.
Same building model with infill walls modelled as one-dimensional line element is used
in the present study for both linear and nonlinear analyses. Infill walls are modelled here
as equivalent diagonal strut elements. Section 3.5 explains the modelling of infill was as
diagonal strut in detail.
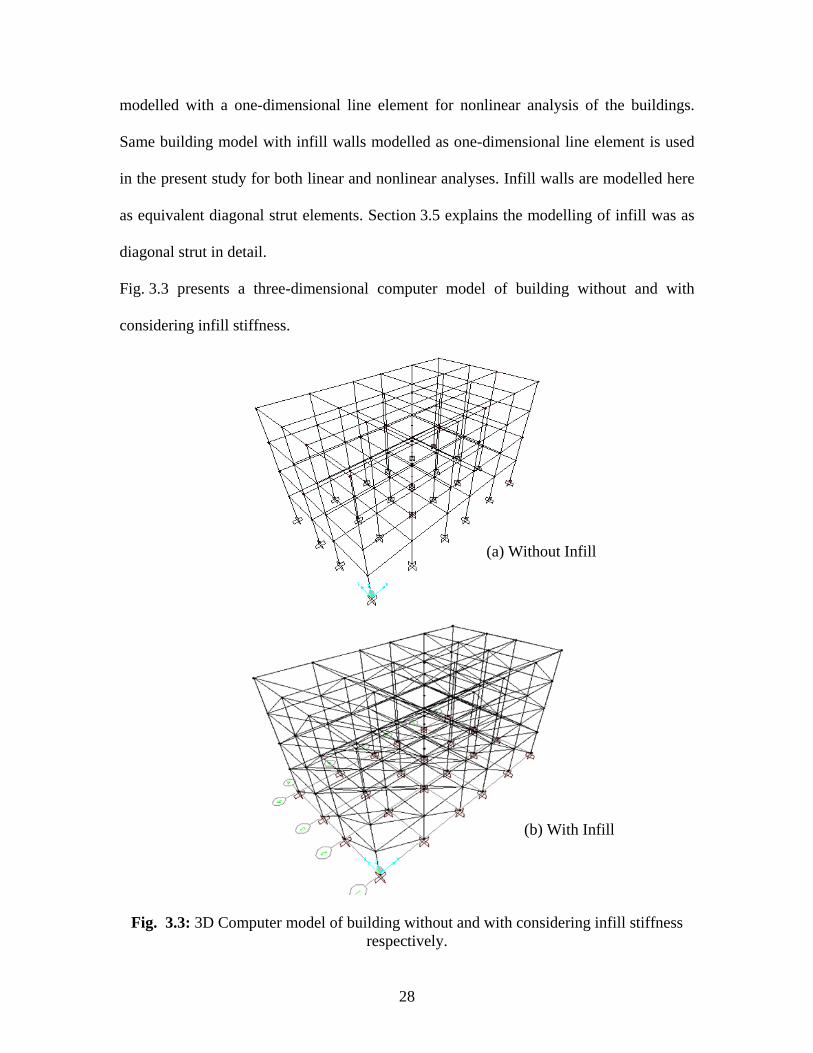
Fig. 3.3 presents a three-dimensional computer model of building without and with
considering infill stiffness.
Fig. 3.3: 3D Computer model of building without and with considering infill stiffness
respectively.
(b) With Infill
(a) Without Infill
29
3.4 MODELLING OF FLEXURAL PLASTIC HINGES
In the implementation of pushover analysis, the model must account for the nonlinear
behaviour of the structural elements. In the present study, a point-plasticity approach is
considered for modelling nonlinearity, wherein the plastic hinge is assumed to be
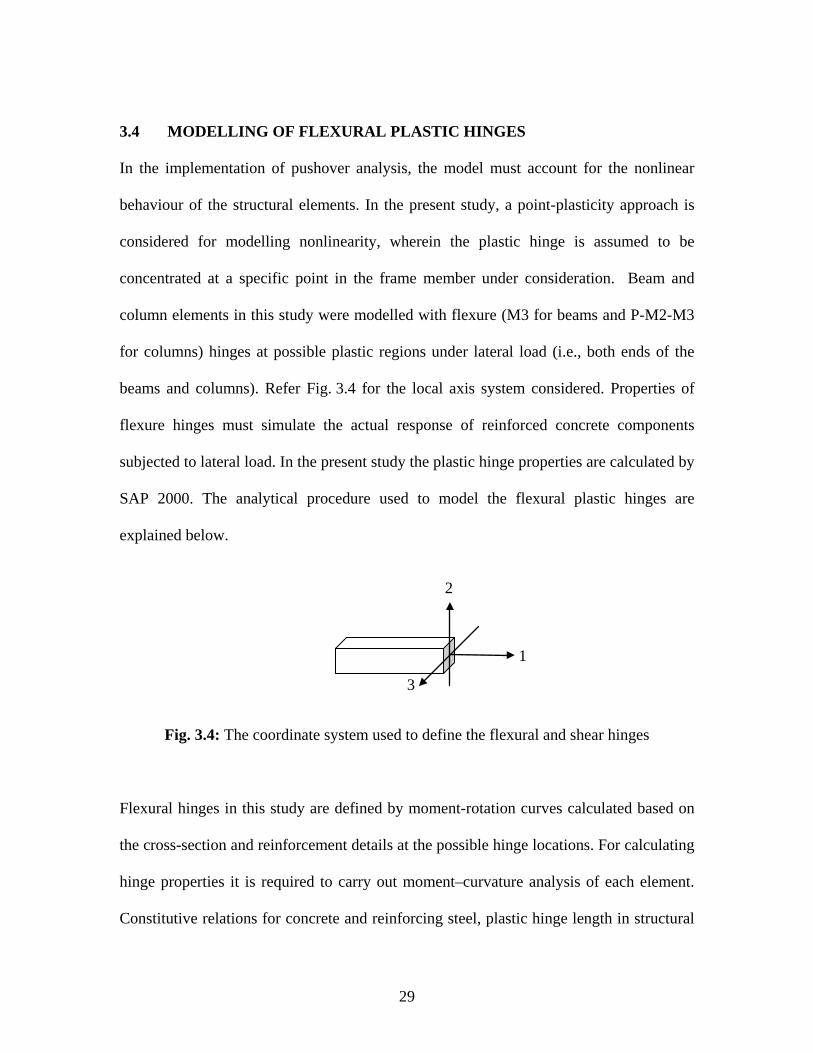
concentrated at a specific point in the frame member under consideration. Beam and
column elements in this study were modelled with flexure (M3 for beams and P-M2-M3
for columns) hinges at possible plastic regions under lateral load (i.e., both ends of the
beams and columns). Refer Fig. 3.4 for the local axis system considered. Properties of
flexure hinges must simulate the actual response of reinforced concrete components
subjected to lateral load. In the present study the plastic hinge properties are calculated by
SAP 2000. The analytical procedure used to model the flexural plastic hinges are
explained below.
Fig. 3.4: The coordinate system used to define the flexural and shear hinges
Flexural hinges in this study are defined by moment-rotation curves calculated based on
the cross-section and reinforcement details at the possible hinge locations. For calculating
hinge properties it is required to carry out moment–curvature analysis of each element.
Constitutive relations for concrete and reinforcing steel, plastic hinge length in structural
1
2
3
30
element are required for this purpose. The flexural hinges in beams are modelled with
uncoupled moment (M3) hinges whereas for column elements the flexural hinges are
modelled with coupled P-M2-M3 properties that include the interaction of axial force and
bi-axial bending moments at the hinge location. Although the axial force interaction is
considered for column flexural hinges the rotation values were considered only for axial
force associated with gravity load.
3.4.1 Stress-Strain Characteristics for Concrete
The stress-strain curve of concrete in compression forms the basis for analysis of any
reinforced concrete section. The characteristic and design stress-strain curves specified in
most of design codes (IS 456: 2000, BS 8110) do not truly reflect the actual stress-strain
behaviour in the post-peak region, as (for convenience in calculations) it assumes a
constant stress in this region (strains between 0.002 and 0.0035). In reality, as evidenced
by experimental testing, the post-peak behaviour is characterised by a descending branch,
which is attributed to ‘softening’ and micro-cracking in the concrete. Also, models as per
these codes do not account for strength enhancement and ductility due to confinement.
However, the stress-strain relation specified in ACI 318M-02 consider some of the
important features from actual behaviour. A previous study (Chugh, 2004) on stress-
strain relation of reinforced concrete section concludes that the model proposed by
Panagiotakos and Fardis (2001) represents the actual behaviour best for normal-strength
concrete. Accordingly, this model has been selected in the present study for calculating
the hinge properties. This model is a modified version of Mander’s model (Manderet. al.,
31
1988) where a single equation can generate the stress fc corresponding to any given
strainεc:
𝑓𝑓𝑐𝑐 =𝑓𝑓𝑐𝑐𝑐𝑐′ 𝑥𝑥𝑥𝑥
𝑥𝑥 − 1 + 𝑥𝑥𝑥𝑥 (3.2)
where,𝑥𝑥 = 𝜖𝜖𝑐𝑐𝜖𝜖𝑐𝑐𝑐𝑐
; 𝑥𝑥 = 𝐸𝐸𝑐𝑐𝐸𝐸𝑐𝑐−𝐸𝐸𝑠𝑠𝑠𝑠𝑐𝑐
;𝐸𝐸𝑐𝑐 = 5000�𝑓𝑓𝑐𝑐𝑐𝑐′ ;𝐸𝐸𝑠𝑠𝑠𝑠𝑐𝑐 = 𝑓𝑓𝑐𝑐𝑐𝑐′
𝜀𝜀𝑐𝑐𝑐𝑐 and '
ccf is the peak strength
expressed as follows:
𝑓𝑓𝑐𝑐𝑐𝑐′ = 𝑓𝑓𝑐𝑐𝑐𝑐′ �1 + 3.7�0.5𝑐𝑐𝑠𝑠𝜌𝜌𝑠𝑠𝑓𝑓𝑦𝑦ℎ
𝑓𝑓𝑐𝑐𝑐𝑐′�
0.85
� (3.3)
The expressions for critical compressive strains are expressed in this model as follows:
𝜀𝜀𝑐𝑐𝑐𝑐 = 0.004 +0.6𝜌𝜌𝑠𝑠𝑓𝑓𝑦𝑦ℎ𝜖𝜖𝑠𝑠𝑠𝑠
𝑓𝑓𝑐𝑐𝑐𝑐′ (3.4)
𝜀𝜀𝑐𝑐𝑐𝑐 = 𝜖𝜖𝑐𝑐𝑐𝑐 �1 + 5�𝑓𝑓𝑐𝑐𝑐𝑐′
𝑓𝑓𝑐𝑐𝑐𝑐′− 1�� (3.5)
The unconfined compressive strength ( 'cof ) is 0.75 fck, ek having a typical value of 0.95
for circular sections and 0.75 for rectangular sections.
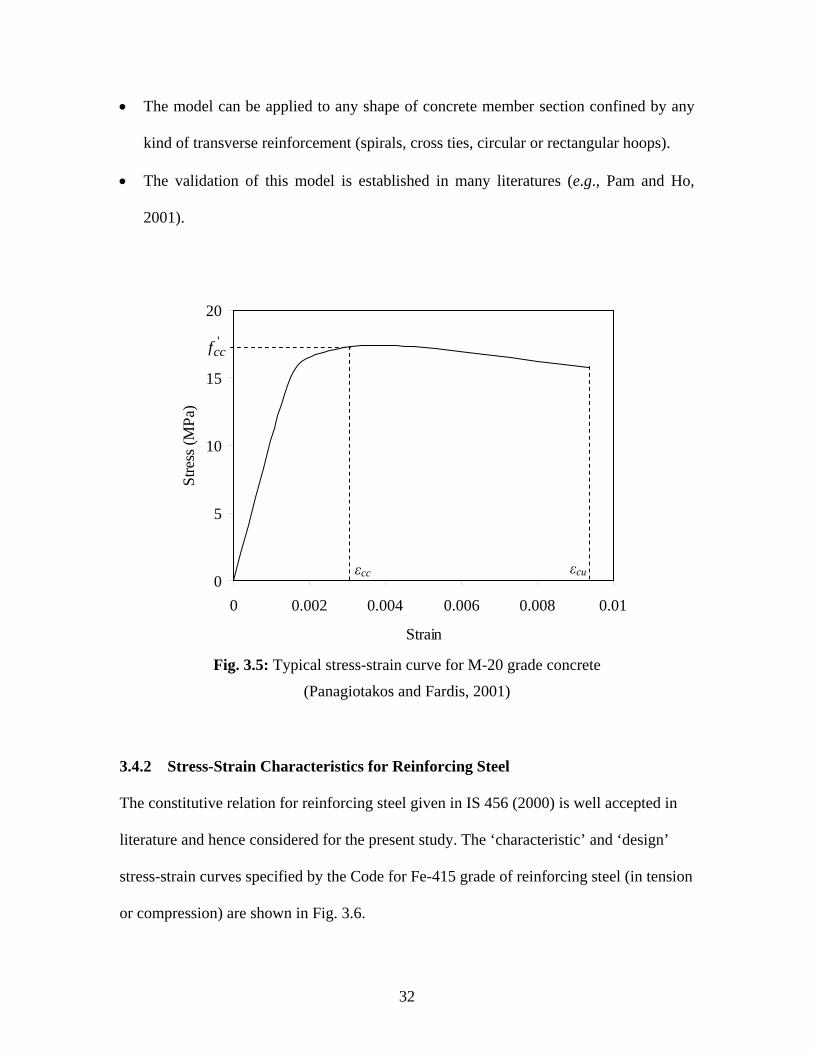
Fig. 3.5 shows a typical plot of stress-strain characteristics for M-20 grade of concrete as
per Modified Mander’s model (Panagiotakos and Fardis, 2001). The advantage of using
this model can be summarized as follows:
• A single equation defines the stress-strain curve (both the ascending and descending
branches) in this model.
• The same equation can be used for confined as well as unconfined concrete sections.
32
• The model can be applied to any shape of concrete member section confined by any
kind of transverse reinforcement (spirals, cross ties, circular or rectangular hoops).
• The validation of this model is established in many literatures (e.g., Pam and Ho,
2001).
Fig. 3.5: Typical stress-strain curve for M-20 grade concrete
(Panagiotakos and Fardis, 2001)
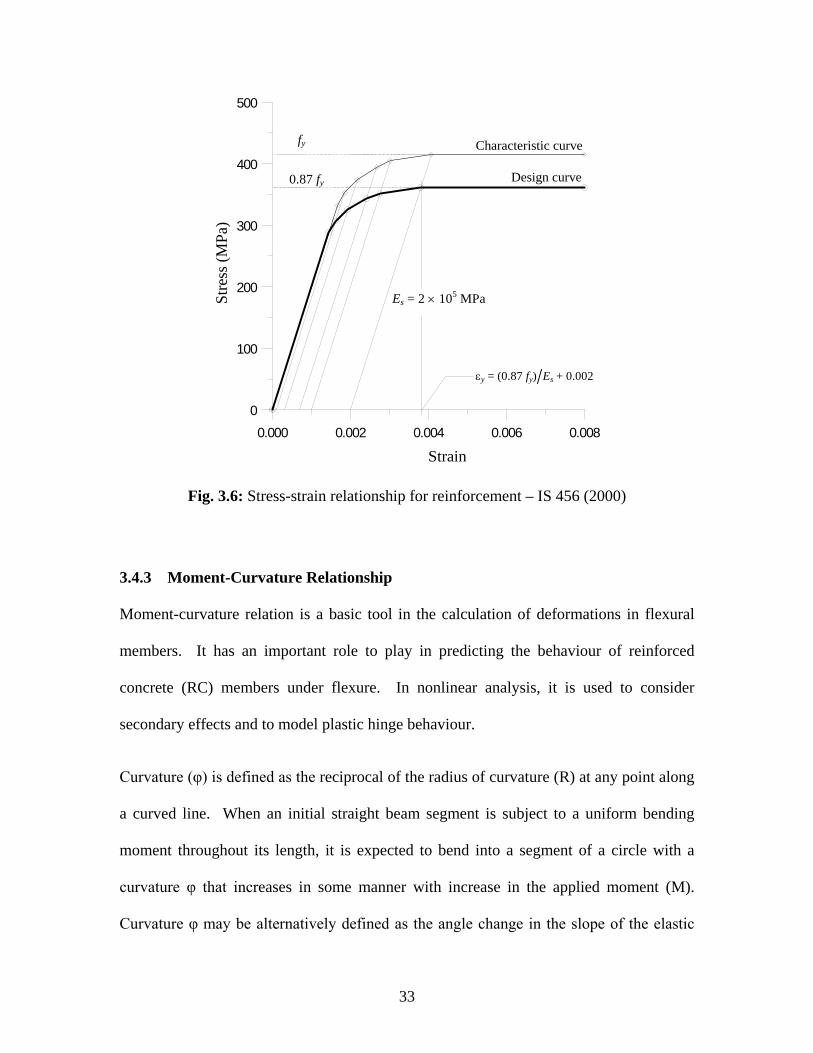
3.4.2 Stress-Strain Characteristics for Reinforcing Steel
The constitutive relation for reinforcing steel given in IS 456 (2000) is well accepted in
literature and hence considered for the present study. The ‘characteristic’ and ‘design’
stress-strain curves specified by the Code for Fe-415 grade of reinforcing steel (in tension
or compression) are shown in Fig. 3.6.
0
5
10
15
20
0 0.002 0.004 0.006 0.008 0.01
Strain
Stre
ss (M
Pa)
'ccf
εcu εcc
33
0.000 0.002 0.004 0.006 0.008
strain
0
100
200
300
400
500
stre
ss (M
Pa)
0.87 fy
fy Characteristic curve
Design curve
Es = 2 × 10⁵ MPa
εy = (0.87 fy) Es + 0.002
Strain
Stre
ss (M
Pa)
Fig. 3.6: Stress-strain relationship for reinforcement – IS 456 (2000)
3.4.3 Moment-Curvature Relationship
Moment-curvature relation is a basic tool in the calculation of deformations in flexural
members. It has an important role to play in predicting the behaviour of reinforced
concrete (RC) members under flexure. In nonlinear analysis, it is used to consider
secondary effects and to model plastic hinge behaviour.
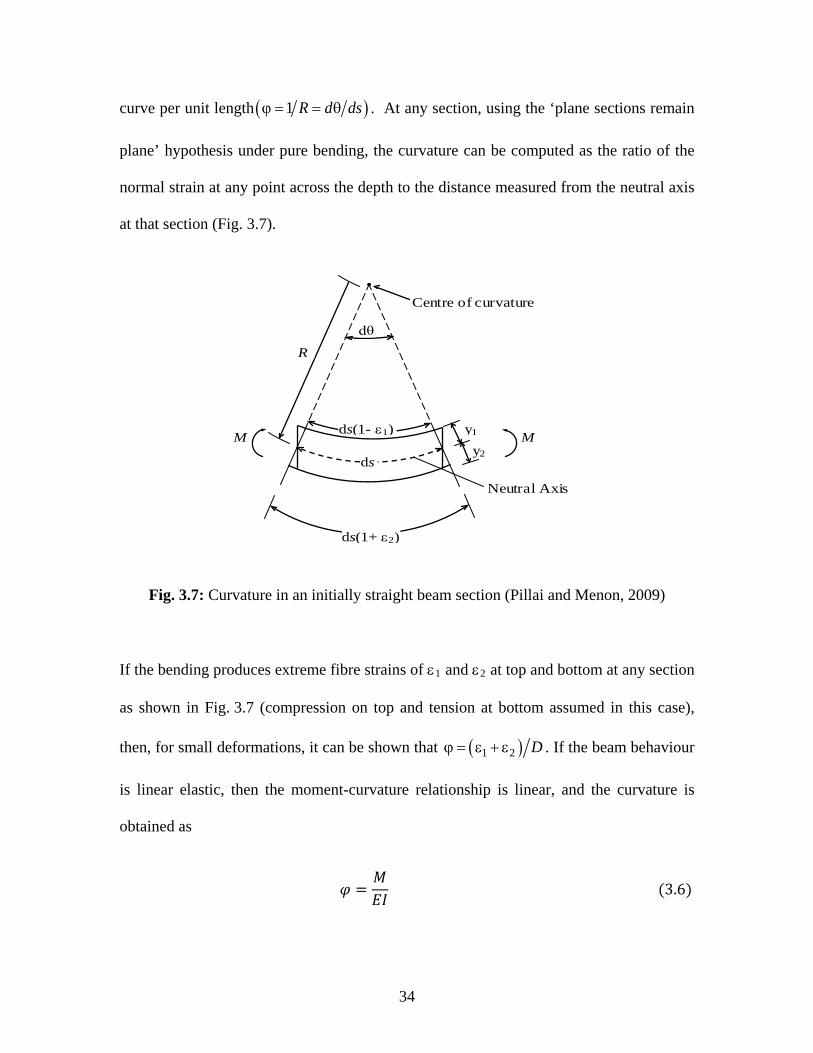
Curvature (φ) is defined as the reciprocal of the radius of curvature (R) at any point along
a curved line. When an initial straight beam segment is subject to a uniform bending
moment throughout its length, it is expected to bend into a segment of a circle with a
curvature φ that increases in some manner with increase in the applied moment (M).
Curvature φ may be alternatively defined as the angle change in the slope of the elastic
34
curve per unit length ( )1ϕ = = θR d ds . At any section, using the ‘plane sections remain
plane’ hypothesis under pure bending, the curvature can be computed as the ratio of the
normal strain at any point across the depth to the distance measured from the neutral axis
at that section (Fig. 3.7).
Centre of curvature
ds(1- ε1)
Neutral Axis
M
ds
M
ds(1+ ε2)
dθ
R
y1 y2
Fig. 3.7: Curvature in an initially straight beam section (Pillai and Menon, 2009)
If the bending produces extreme fibre strains of ε1 and ε2 at top and bottom at any section
as shown in Fig. 3.7 (compression on top and tension at bottom assumed in this case),
then, for small deformations, it can be shown that ( )1 2ϕ = ε + ε D . If the beam behaviour
is linear elastic, then the moment-curvature relationship is linear, and the curvature is
obtained as
𝜑𝜑 =𝑀𝑀𝐸𝐸𝐸𝐸
(3.6)
35
The flexural rigidity (EI) of the beam is obtained as a product of the modulus of elasticity
E and the second moment of area of the section I.
When a RC flexural member is subjected to a gradually increasing moment, it’s
behaviour transits through various stages, starting from the initial un-cracked state to the
ultimate limit state of collapse. The stresses in the tension steel and concrete go on
increasing as the moment increases. The behaviour at the ultimate limit state depends on
the percentage of steel provided, i.e., on whether the section is ‘under-reinforced’ or
‘over-reinforced’. In the case of under-reinforced sections, failure is triggered by
yielding of tension steel whereas in over-reinforced section the steel does not yield at the
limit state of failure. In both cases, the failure eventually occurs due to crushing of
concrete at the extreme compression fibre, when the ultimate strain in concrete reaches its
limit. Under-reinforced beams are characterised by ‘ductile’ failure, accompanied by
large deflections and significant flexural cracking. On the other hand, over-reinforced
beams have practically no ductility, and the failure occurs suddenly, without the warning
signs of wide cracking and large deflections.
In the case of a short column subject to uniaxial bending combined with axial
compression, it is assumed that Eq. 3.6 remains valid and that “plane sections before
bending remain plane”. However, the ultimate curvature (and hence, ductility) of the
section is reduced as the compression strain in the concrete contributes to resisting axial
compression in addition to flexural compression.
3.4.4 Modelling of Moment-Curvature in RC Sections
Using the Modified Mander model of stress-strain curves for concrete (Panagiotakos and

36
Fardis, 2001) and Indian Standard IS 456 (2000) stress-strain curve for reinforcing steel,
for a specific confining steel, moment curvature relations can be generated for beams and
columns (for different axial load levels). The assumptions and procedure used in
generating the moment-curvature curves are outlined below.
Assumptions
i. The strain is linear across the depth of the section (‘plane sections remain plane’).
ii. The tensile strength of the concrete is ignored.
iii. The concrete spalls off at a strain of 0.0035.
iv. The initial tangent modulus of the concrete, Ec is adopted from IS 456 (2000), as
5000 ckf .
v. In determining the location of the neutral axis, convergence is assumed to be
reached within an acceptable tolerance of 1%.
Algorithm for Generating Moment-Curvature Relation
i. Assign a value to the extreme concrete compressive fibre strain (normally starting
with a very small value).
ii. Assume a value of neutral axis depth measured from the extreme concrete
compressive fibre.
iii. Calculate the strain and the corresponding stress at the centroid of each
longitudinal reinforcement bar.
37
iv. Determine the stress distribution in the concrete compressive region based on the
Modified Mander stress-strain model for given volumetric ratio of confining steel.
The resultant concrete compressive force is then obtained by numerical
integration of the stress over the entire compressive region.
v. Calculate the axial force from the equilibrium and compare with the applied axial
load (for beam element both of these will be zero). If the difference lies within the
specified tolerance, the assumed neutral axis depth is adopted. The moment
capacity and the corresponding curvature of the section are then calculated.
Otherwise, a new neutral axis is determined from the iteration (using bisection
method) and steps (iii) to (v) are repeated until it converges.
vi. Assign the next value, which is larger than the previous one, to the extreme
concrete compressive strain and repeat steps (ii) to (v).
vii. Repeat the whole procedure until the complete moment-curvature is obtained.
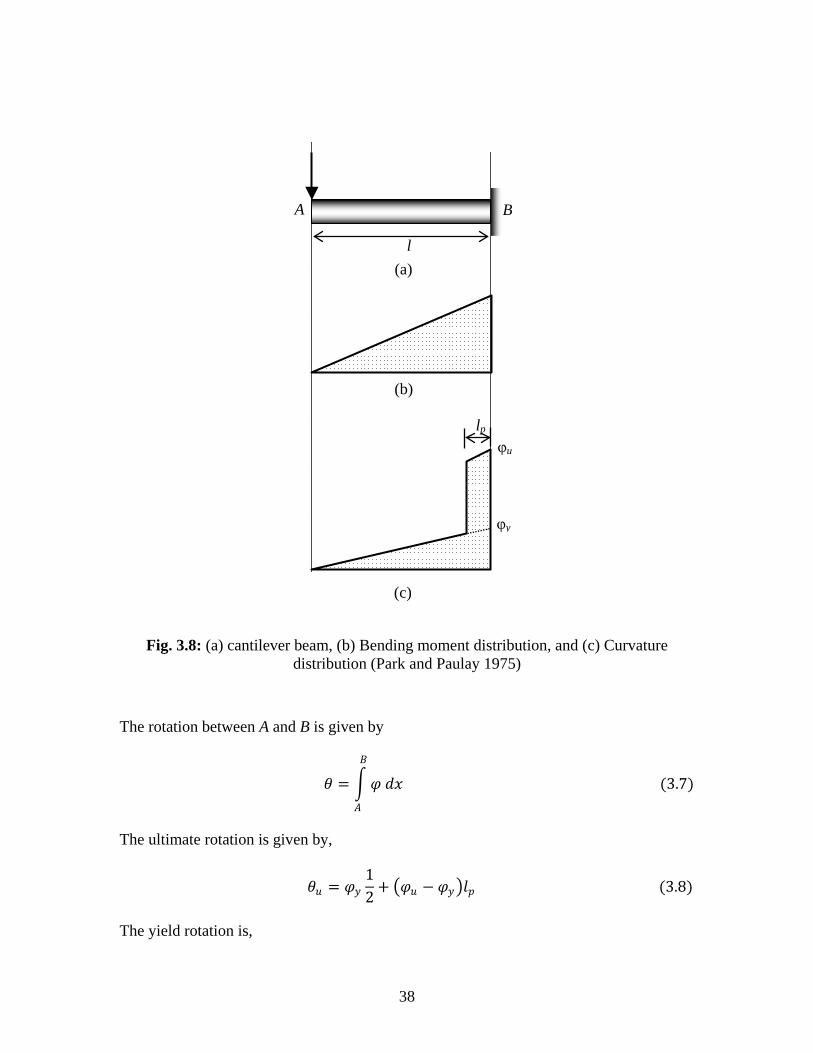
3.4.5 Moment-Rotation Parameters
Moment-rotation parameters are the actual input for modelling the hinge properties and
this can be calculated from the moment-curvature relation. This can be explained with a
simple cantilever beam AB shown in Fig. 3.8(a) with a concentrated load applied at the
free end B. To determine the rotation between the ends an idealized inelastic curvature
distribution and a fully cracked section in the elastic region may be assumed. Figs 3.8(b)
and 3.8(c) represent the bending moment diagram and probable distribution of curvature
at the ultimate moment.
38
Fig. 3.8: (a) cantilever beam, (b) Bending moment distribution, and (c) Curvature distribution (Park and Paulay 1975)
The rotation between A and B is given by
𝜃𝜃 = �𝜑𝜑 𝑑𝑑𝑥𝑥 (3.7)𝐵𝐵
𝐴𝐴
The ultimate rotation is given by,
𝜃𝜃𝑐𝑐 = 𝜑𝜑𝑦𝑦12
+ �𝜑𝜑𝑐𝑐 − 𝜑𝜑𝑦𝑦�𝑙𝑙𝑝𝑝 (3.8)
The yield rotation is,
A B
l (a)
(b)
(c)
lp
φu
φy
39
𝜃𝜃𝑦𝑦 = 𝜑𝜑𝑦𝑦12
(3.9)
And the plastic rotation is,
𝜃𝜃𝑝𝑝 = �𝜑𝜑𝑐𝑐 − 𝜑𝜑𝑦𝑦�𝑙𝑙𝑝𝑝 (3.10)
pl is equivalent length of plastic hinge over which plastic curvature is considered to be
constant. The physical definition of the plastic hinge length, considering the ultimate
flexural strength developing at the support, is the distance from the support over which
the applied moment exceeds the yield moment. A good estimate of the effective plastic
hinge length may be obtained from the following equation (Paulay and Priestley, 1992)
𝑙𝑙𝑝𝑝 = 0.08𝑙𝑙 + 0.15𝑑𝑑𝑏𝑏𝑓𝑓𝑦𝑦 (3.11)
The yield strength of the longitudinal reinforcement should be in ‘ksi’. For typical beam
and column proportions Eq. 2.11 results in following equation (FEMA-274; Paulay and
Priestley, 1992) where D is the overall depth of the section.
𝑙𝑙𝑝𝑝 = 0.5𝐷𝐷 (3.12)
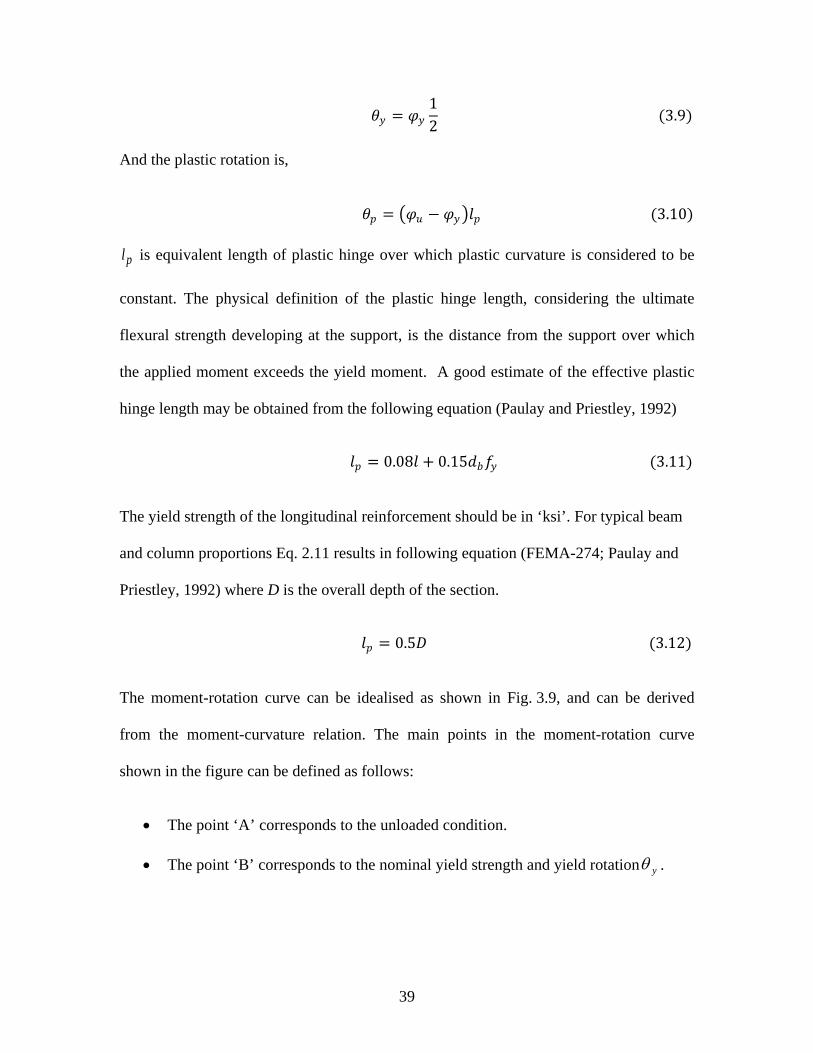
The moment-rotation curve can be idealised as shown in Fig. 3.9, and can be derived
from the moment-curvature relation. The main points in the moment-rotation curve
shown in the figure can be defined as follows:
• The point ‘A’ corresponds to the unloaded condition.
• The point ‘B’ corresponds to the nominal yield strength and yield rotationθ y .
40
• The point ‘C’ corresponds to the ultimate strength and ultimate rotationθ u ,
following which failure takes place.
• The point ‘D’ corresponds to the residual strength, if any, in the member. It is
usually limited to 20% of the yield strength, and ultimate rotation, θ u can be taken
with that.
• The point ‘E’ defines the maximum deformation capacity and is taken as 15θ y or
θ u , whichever is greater.
Fig. 3.9: Idealised moment-rotation curve of RC elements
While applying eqs. 3.9 and 3.10 to determine the ultimate and yield rotations, care must
be taken to adopt the correct value of the length l, applicable for cantilever action. In the
case of a frame member in a multi-storey frame subject to lateral loads, it may be
conveniently assumed that the points of contra flexure are located (approximately) at the
mid-points of the beams and columns. In such cases, an approximate value of l is given
by half the span of the member under consideration.
A
B C
D E
Rotation
Mom
ent
41
3.5 MODELLING OF EQUIVALENT STRUT
For an infill wall located in a lateral load-resisting frame, the stiffness and strength
contribution of the infill has to be considered. Non-integral infill walls subjected to lateral
load behave like diagonal struts. Thus an infill wall can be modelled as an equivalent
‘compression only’ strut in the building model. Rigid joints connect the beams and
columns, but pin joints connect the equivalent struts to the beam-to-column junctions.
This section explains the procedure based on Smith and Carter (1969) to calculate the
modelling parameters (effective width, elastic modulus and strength) of an equivalent
strut. This method is elaborated in Section 2.3.1 of chapter 2.
The length of the strut is given by the diagonal distance (d) of the panel and its thickness
is equal to the thickness of the infill wall. The elastic modulus of the strut is equated to
the elastic modulus of masonry (Em)
For the estimation of width (w) of the strut, a simple expression as given in Eq. 2.1 to
Eq. 2.3 (Chapter 2) is adopted.
3.6 STRENGTH OF EQUIVALENT STRUT
The strength of the equivalent strut is governed by the lowest of the failure loads
corresponding to the following failure modes.
a) Local crushing of the infill at one of the loaded corners.
b) Shear cracking along the bedding joints of the brickwork.
The diagonal tensile cracking need not be considered as a failure mode, as higher load
can be carried beyond tensile cracking.
42
3.6.1 Local Crushing Failure
The diagonal load causing local crushing (Rc) is given by the following equation (Smith
and Carter, 1969).
𝑅𝑅𝑐𝑐 = 𝛼𝛼𝑐𝑐𝑡𝑡𝑠𝑠𝑠𝑠𝑐𝑐𝜃𝜃𝑓𝑓𝑠𝑠 (3.13)
The length of contact at the column (αc) at the compression diagonal corner is calculated
using the following formula.
𝛼𝛼𝑐𝑐ℎ
= 𝜋𝜋2𝜆𝜆ℎ
(3.14)
Other variables are as defined earlier.
3.6.2 Shear Failure
Following relationship of Rs proposed by Govindan (1986) using the curves given by
Smith and Carter (1969) is chosen, as it is simple and non-dimensional.
0.6 0.05( '/ ')0.51.65( '/ ') ( )'
l hS
bs
R l h hf ht
λ −= (3.15)
Where, bsf ′ = The bond shear strength between the masonry and mortar. It is varies from
0.24 MPa for low strength mortar to 0.69 MPa for high strength mortar (Ramesh 2003).
Again to be in conservative side bsf ′ is taken as 0.24 in the calculation.
3.7 ALGORITHM FOR GENERATING THE EQUIVALENT STRUT MODEL
Asokan (2006) conducted a comprehensive study of various existing approaches for
equivalent diagonal strut modelling and developed a computer program based on the
study by Smith and Carter (1969). This program is used to calculate the parameters of
equivalent strut model in the present study.
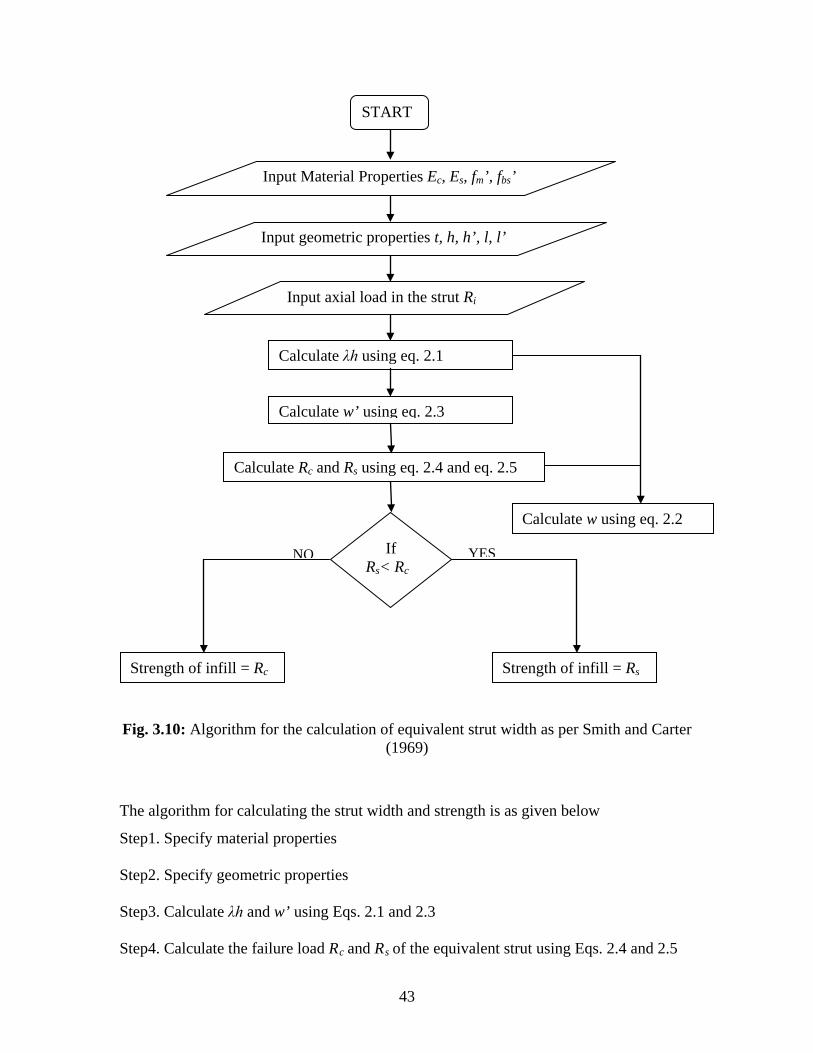
43
Fig. 3.10: Algorithm for the calculation of equivalent strut width as per Smith and Carter (1969)
The algorithm for calculating the strut width and strength is as given below
Step1. Specify material properties
Step2. Specify geometric properties
Step3. Calculate λh and w’ using Eqs. 2.1 and 2.3
Step4. Calculate the failure load Rc and Rs of the equivalent strut using Eqs. 2.4 and 2.5
NO YES
START
Input Material Properties Ec, Es, fm’, fbs’
Input geometric properties t, h, h’, l, l’
Input axial load in the strut Ri
Calculate λh using eq. 2.1
Calculate w’ using eq. 2.3
Calculate Rc and Rs using eq. 2.4 and eq. 2.5
If Rs< Rc
Strength of infill = Rc Strength of infill = Rs
Calculate w using eq. 2.2
44
Step5. Calculate initial width of the strut using Eq. 2.2 assuming the axial load in the strut
Ri = 0
Step6. Calculate strength of the equivalent strut = minimum of Rc and Rs
Computational model of the building can be analysed using the obtained values of w and
Em for the struts. Revised value of w corresponding to the axial force Ri is obtained using
Eq. 2.2. This procedure can be repeated to get a converged value of w. It is observed that
two iterations are sufficient to get the converged value of w, Asokan (2006). The above
steps in the form of the flow chart are as presented in Fig. 3.10.
3.8 MODELLING OF AXIAL HINGES FOR EQUIVALENT STRUTS
3.8.1 Nonlinearity of Axial Hinge Property
The nonlinearity in the infill wall is due to the formation and development of cracks
under lateral load. As soon as a diagonal crack develops within an infill wall (usually at
much lower load and deflection values than those at ultimate) the behaviour becomes
nonlinear. The wall stays confined within the surrounding frame and bears against it over
the contact lengths. The wall carries more loads until the existing crack continues to
widen and new cracks appear, leading eventually to ultimate failure due to corner
crushing or shear cracking. Even though the masonry and mortar are brittle in nature, the
behaviour of infill wall is nonlinear (Asokan 2006). However for convenience brittle load
deformation behaviour as per the elastic analysis approach is considered to model the
axial hinges in equivalent strut. The following procedure presented in Section 3.8.2 is
used to get the axial load versus deformation curve of equivalent strut.
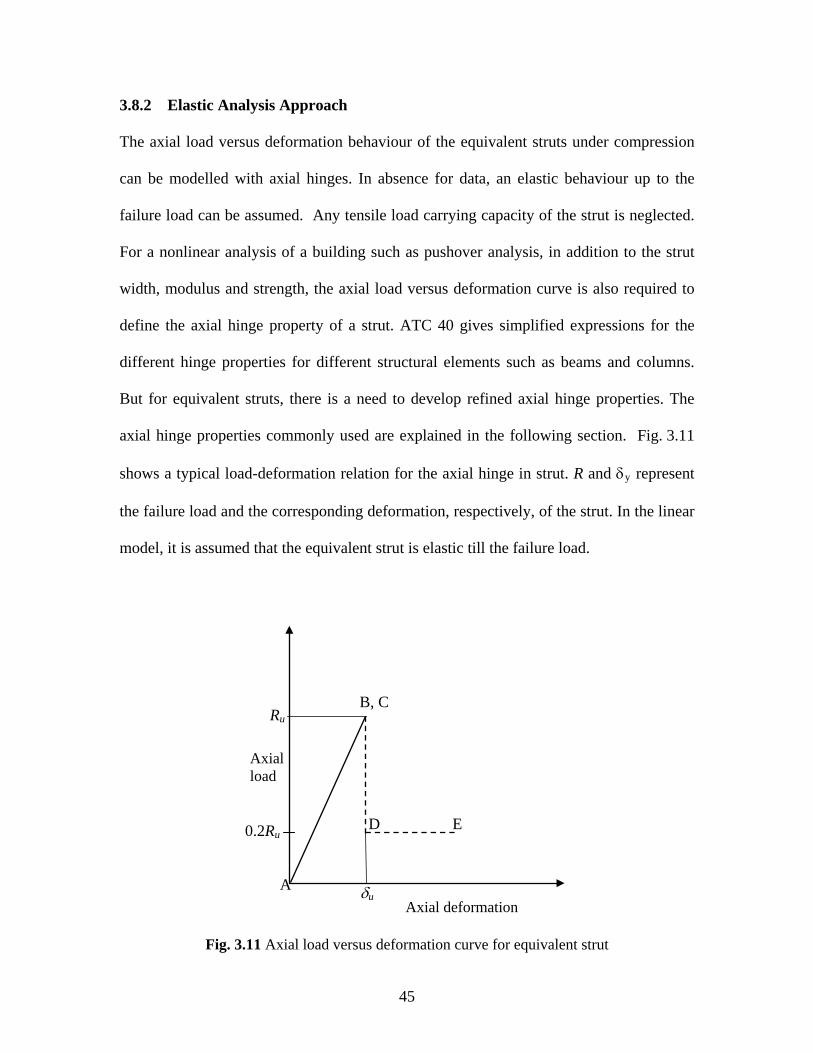
45
3.8.2 Elastic Analysis Approach
The axial load versus deformation behaviour of the equivalent struts under compression
can be modelled with axial hinges. In absence for data, an elastic behaviour up to the
failure load can be assumed. Any tensile load carrying capacity of the strut is neglected.
For a nonlinear analysis of a building such as pushover analysis, in addition to the strut
width, modulus and strength, the axial load versus deformation curve is also required to
define the axial hinge property of a strut. ATC 40 gives simplified expressions for the
different hinge properties for different structural elements such as beams and columns.
But for equivalent struts, there is a need to develop refined axial hinge properties. The
axial hinge properties commonly used are explained in the following section. Fig. 3.11
shows a typical load-deformation relation for the axial hinge in strut. R and δy represent
the failure load and the corresponding deformation, respectively, of the strut. In the linear
model, it is assumed that the equivalent strut is elastic till the failure load.
Fig. 3.11 Axial load versus deformation curve for equivalent strut
Axial load
Axial deformation δu A
Ru
0.2Ru
B, C
E D
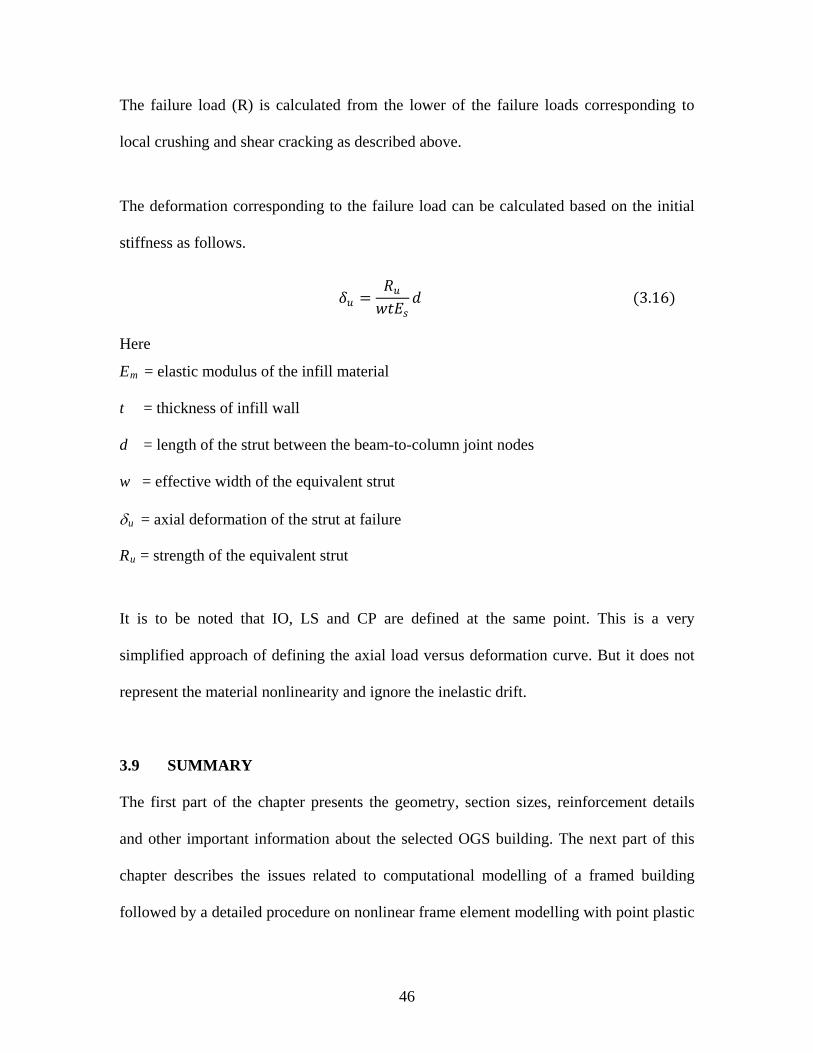
46
The failure load (R) is calculated from the lower of the failure loads corresponding to
local crushing and shear cracking as described above.
The deformation corresponding to the failure load can be calculated based on the initial
stiffness as follows.
𝛿𝛿𝑐𝑐 =𝑅𝑅𝑐𝑐𝑤𝑤𝑡𝑡𝐸𝐸𝑠𝑠
𝑑𝑑 (3.16)
Here
Em = elastic modulus of the infill material
t = thickness of infill wall
d = length of the strut between the beam-to-column joint nodes
w = effective width of the equivalent strut
δu = axial deformation of the strut at failure
Ru = strength of the equivalent strut
It is to be noted that IO, LS and CP are defined at the same point. This is a very
simplified approach of defining the axial load versus deformation curve. But it does not
represent the material nonlinearity and ignore the inelastic drift.
3.9 SUMMARY
The first part of the chapter presents the geometry, section sizes, reinforcement details
and other important information about the selected OGS building. The next part of this
chapter describes the issues related to computational modelling of a framed building
followed by a detailed procedure on nonlinear frame element modelling with point plastic

47
flexural hinges. This includes generating uncoupled moment-rotation parameters for
beams and coupled axial load-biaxial moment-rotation interaction parameters for
columns. The last part of the chapter discusses the modelling of infill wall as equivalent
diagonal strut element as per Smith and Carter (1969). Also, modelling of nonlinear axial
hinge properties for equivalent strut is explained here based on elastic analysis approach.
CHAPTER 4
RESULTS FROM LINEAR ANALYSIS
4.1 INTRODUCTION
Seismic analysis is a subset of structural analysis and is the calculation of the response of
the building structure to earthquake and is a relevant part of structural design where
earthquakes are prevalent. The seismic analysis of a structure involves evaluation of the
earthquake forces acting at various level of the structure during an earthquake and the
effect of such forces on the behaviour of the overall structure. The analysis may be static
or dynamic in approach as per the code provisions.
Thus broadly we can say that linear analysis of structures to compute the earthquake
forces is commonly based on one of the following three approaches.
1. An equivalent lateral procedure in which dynamic effects are approximated by
horizontal static forces applied to the structure. This method is quasi-dynamic in
nature and is termed as the Seismic Coefficient Method in the IS code.
2. The Response Spectrum Approach in which the effects on the structure are related
to the response of simple, single degree of freedom oscillators of varying natural
periods to earthquake shaking.
3. Response History Method or Time History Method in which direct input of the
time history of a designed earthquake into a mathematical model of the structure
using computer analyses.
49
Two of the above three methods of analysis, i.e. Seismic Coefficient Method and
Response Spectrum Method, are considered for the analysis of buildings studied here.
Details of these methods are described in the following section. The seismic method of
analysis based on Indian standard 1893:2002 (Part – 1) is described as follows:
4.1.1 Equivalent Static Analysis
This is a linear static analysis. This approach defines a way to represent the effect of
earthquake ground motion when series of forces are act on a building, through a seismic
design response spectrum. This method assumes that the building responds in its
fundamental mode. The applicability of this method is extended in many building codes by
applying factors to account for higher buildings with some higher modes, and for low
levels of twisting. To account for effects due to "yielding" of the structure, many codes
apply modification factors that reduce the design forces. In the equivalent static method,
the lateral force equivalent to the design basis earthquake is applied statically. The
equivalent lateral forces at each storey level are applied at the design ‘centre of mass’
locations. It is located at the design eccentricity from the calculated ‘centre of rigidity (or
stiffness)’.
The base dimension of the building at the plinth level along the direction of lateral forces
is represented as d (in meters) and height of the building from the support is represented as
h (in meters). The response spectra functions can be calculated as follows:
For Type I soil (rock or hard soil sites):
𝑆𝑆𝑎𝑎𝑔𝑔
= �
1 + 15𝑇𝑇 0.00 ≤ 𝑇𝑇 ≤ 0.102.5 0.10 ≤ 𝑇𝑇 ≤ 0.401𝑇𝑇
0.40 ≤ 𝑇𝑇 ≤ 4.00� (4.1𝑎𝑎)
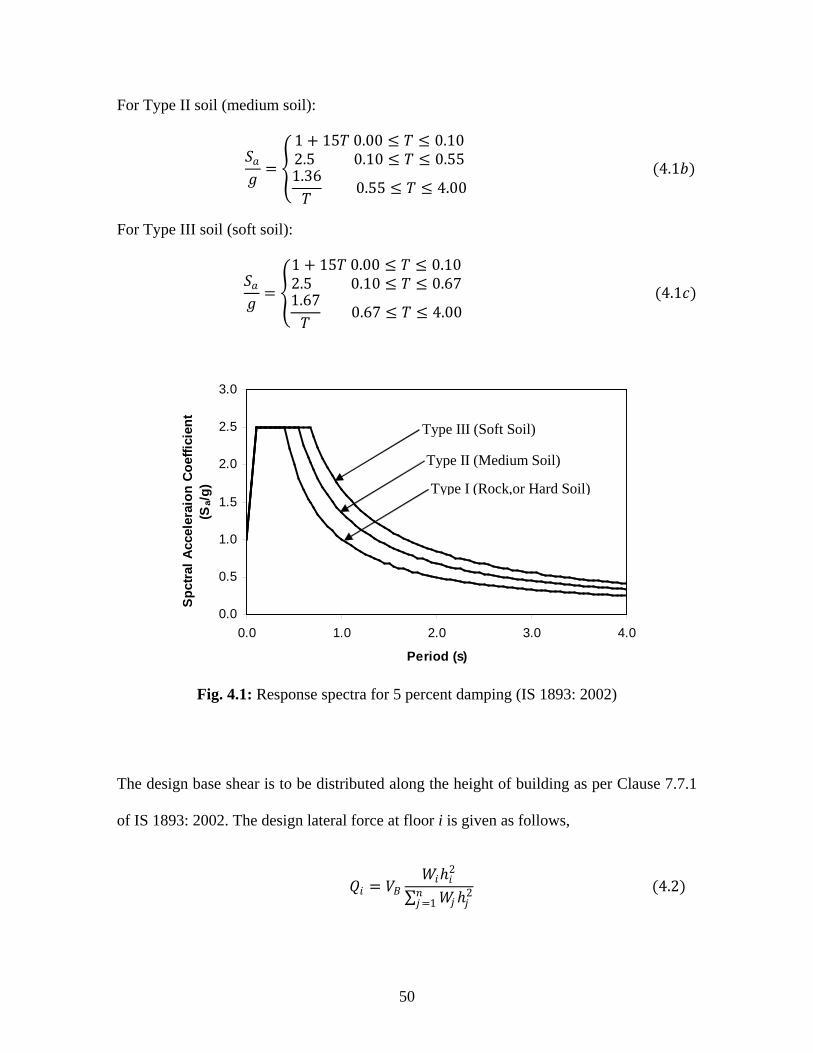
50
For Type II soil (medium soil):
𝑆𝑆𝑎𝑎𝑔𝑔
= �
1 + 15𝑇𝑇 0.00 ≤ 𝑇𝑇 ≤ 0.102.5 0.10 ≤ 𝑇𝑇 ≤ 0.551.36𝑇𝑇
0.55 ≤ 𝑇𝑇 ≤ 4.00� (4.1𝑏𝑏)
For Type III soil (soft soil):
𝑆𝑆𝑎𝑎𝑔𝑔
= �
1 + 15𝑇𝑇 0.00 ≤ 𝑇𝑇 ≤ 0.102.5 0.10 ≤ 𝑇𝑇 ≤ 0.671.67𝑇𝑇
0.67 ≤ 𝑇𝑇 ≤ 4.00� (4.1𝑐𝑐)
0.0
0.5
1.0
1.5
2.0
2.5
3.0
0.0 1.0 2.0 3.0 4.0
Period (s)
Spct
ral A
ccel
erai
on C
oeffi
cien
t (S
a/g) Type I (Rock,or Hard Soil)
Type II (Medium Soil)
Type III (Soft Soil)
Fig. 4.1: Response spectra for 5 percent damping (IS 1893: 2002)
The design base shear is to be distributed along the height of building as per Clause 7.7.1
of IS 1893: 2002. The design lateral force at floor i is given as follows,
𝑄𝑄𝑖𝑖 = 𝑉𝑉𝐵𝐵𝑊𝑊𝑖𝑖ℎ𝑖𝑖2
∑ 𝑊𝑊𝑗𝑗ℎ𝑗𝑗2𝑛𝑛𝑗𝑗=1
(4.2)
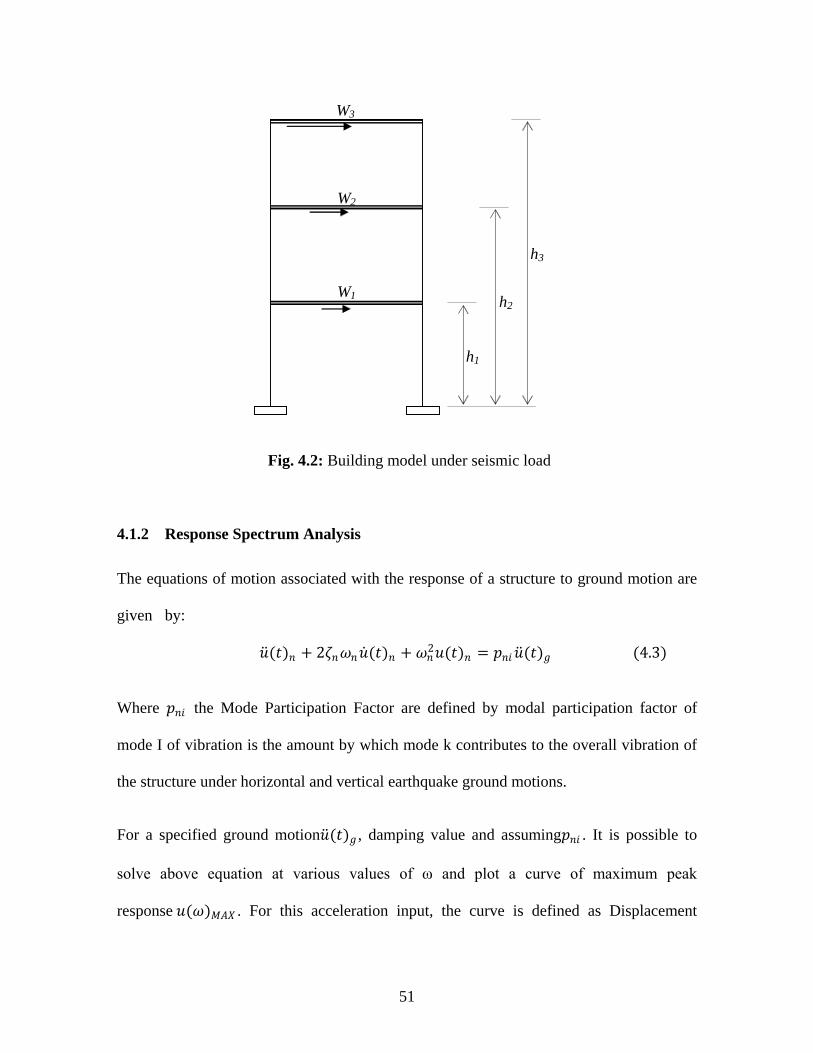
51
W1
W2
W3
h1
h2
h3
Fig. 4.2: Building model under seismic load
4.1.2 Response Spectrum Analysis
The equations of motion associated with the response of a structure to ground motion are
given by:
�̈�𝑢(𝑡𝑡)𝑛𝑛 + 2𝜁𝜁𝑛𝑛𝜔𝜔𝑛𝑛�̇�𝑢(𝑡𝑡)𝑛𝑛 + 𝜔𝜔𝑛𝑛2𝑢𝑢(𝑡𝑡)𝑛𝑛 = 𝑝𝑝𝑛𝑛𝑖𝑖 �̈�𝑢(𝑡𝑡)𝑔𝑔 (4.3)
Where 𝑝𝑝𝑛𝑛𝑖𝑖 the Mode Participation Factor are defined by modal participation factor of
mode I of vibration is the amount by which mode k contributes to the overall vibration of
the structure under horizontal and vertical earthquake ground motions.
For a specified ground motion�̈�𝑢(𝑡𝑡)𝑔𝑔 , damping value and assuming𝑝𝑝𝑛𝑛𝑖𝑖 . It is possible to
solve above equation at various values of ω and plot a curve of maximum peak
response 𝑢𝑢(𝜔𝜔)𝑀𝑀𝑀𝑀𝑀𝑀 . For this acceleration input, the curve is defined as Displacement
52
Response Spectrum for earthquake motion. A different curve will exist for each different
value of damping.
A plot of ω 𝑢𝑢(𝜔𝜔)𝑀𝑀𝑀𝑀𝑀𝑀 is defined as the pseudo-velocity spectrum and plot of ω2𝑢𝑢(𝜔𝜔)𝑀𝑀𝑀𝑀𝑀𝑀
is defined as the pseudo-acceleration spectrum. These pseudo values have minimum
significance and are not essentially a part of a response spectrum analysis. The true values
for maximum velocity and acceleration must be calculated from the solution of above
equation. There is a mathematical relationship, however, between the pseudo-acceleration
spectrum and the total acceleration spectrum. The total acceleration of the unit mass,
single degree-of-freedom system is given by,
�̈�𝑢(𝑡𝑡)𝑇𝑇 = �̈�𝑢(𝑡𝑡) + �̈�𝑢(𝑡𝑡)𝑔𝑔 (4.4)
�̈�𝑢(𝑡𝑡)from first equation is substituted in the above equation which yields,
�̈�𝑢(𝑡𝑡)𝑇𝑇 = −2𝜁𝜁𝑛𝑛𝜔𝜔�̇�𝑢(𝑡𝑡) − 𝜔𝜔2𝑢𝑢(𝑡𝑡) (4.5)
Therefore, for the special case of zero damping, the total acceleration of the system is
equal to 𝜔𝜔2𝑢𝑢(𝑡𝑡). For this reason, the displacement response spectrum curve is normally
not plotted as modal displacement ω vs 𝑢𝑢(𝜔𝜔)𝑀𝑀𝑀𝑀𝑀𝑀 . It is standard to present the curve in
terms of 𝑆𝑆(𝜔𝜔)𝑛𝑛 vs a period T in seconds.
Where,
𝑆𝑆(𝜔𝜔)𝑛𝑛 = �2𝜋𝜋𝑇𝑇�
2𝑢𝑢(𝜔𝜔)𝑀𝑀𝑀𝑀𝑀𝑀 (4.6)
The pseudo-acceleration spectrum, 𝑆𝑆(𝜔𝜔)𝑛𝑛 curve has units of acceleration vs period
which has some physical significance for zero damping only. It is apparent that all
53
response spectrum curves represent the properties of the earthquake at specific site and
are not a function of the properties of the structural system. After estimation is made of
linear viscous damping properties of the structure, a specific response spectrum curve is
selected.
It is the linear dynamic analysis. This approach permits the multiple modes of response
of a building to be taken into account (in the frequency domain) or where modes other
than the fundamental one significantly affect the response of the structure. In this
method the response of Multi-Degree of Freedom (MDOF) is expressed as the
superposition of each Single-Degree of Freedom (SDOF) system, which is then
combined to compute the total response. This is required in many building codes for all
except for very simple or very complex structures. Computer analysis can be used to
determine these modes for a structure. For each mode, a response is read from the
design spectrum, based on the modal frequency and the modal mass, and they are then
combined to provide an estimate of the total response of the structure. Combination
methods include the following:
• Maximum Absolute Response (ABS) - peak values are added together
• Square Root of Sum of Squares (SRSS) - method of combining modal maxima for
two-dimensional structural system.
• Complete Quadratic Combination (CQC) - a method that is an improvement on
SRSS for closely spaced modes
In cases where structures are either too irregular, too tall or of significance to a community
in disaster response, the response spectrum approach is no longer appropriate, and more
complex analysis is often required, such as non-linear static or dynamic analysis.
54
4.2 RESULTS OF LINEAR ANALYSIS AND DISCUSSIONS
As mentioned earlier the selected OGS building is analyzed for following two different
cases and two end support conditions (fixed and pinned end support)
(a) Considering infill strength and stiffness (with infill/infilled frame)
(b) Without considering infill strength and stiffness (without infill/bare frame).
Therefore there are a total of four building models: (a) building modelled without infill
and fixed end support, (b) building modelled with infill and fixed end support, (c) building
modelled without infill and pinned end support and (d) building modelled with infill and
pinned end support.
Equivalent static and response spectrum analyses of these four building models are carried
out to evaluate the effect of infill on the seismic behaviour of OGS building for two
different support conditions. Following sections presents the results obtained from these
analyses.
4.2.1 Calculation of Time Period and Base Shear
The design base shear (VB) was calculated as per IS 1893: 2002 corresponding to the
fundamental period for moment-resisting framed buildings with brick infill panels as
follows:
𝑉𝑉𝐵𝐵 = 𝑀𝑀ℎ𝑊𝑊 (4.7)
𝑀𝑀ℎ =𝑍𝑍2𝐼𝐼𝑅𝑅𝑆𝑆𝑎𝑎𝑔𝑔
(4.8)
where W ≡ seismic weight of the building, Z ≡ zone factor, I ≡ importance
factor, R ≡ response reduction factor, Sa /g ≡ spectral acceleration coefficient
corresponding to an approximate time period (Ta) which is given by:
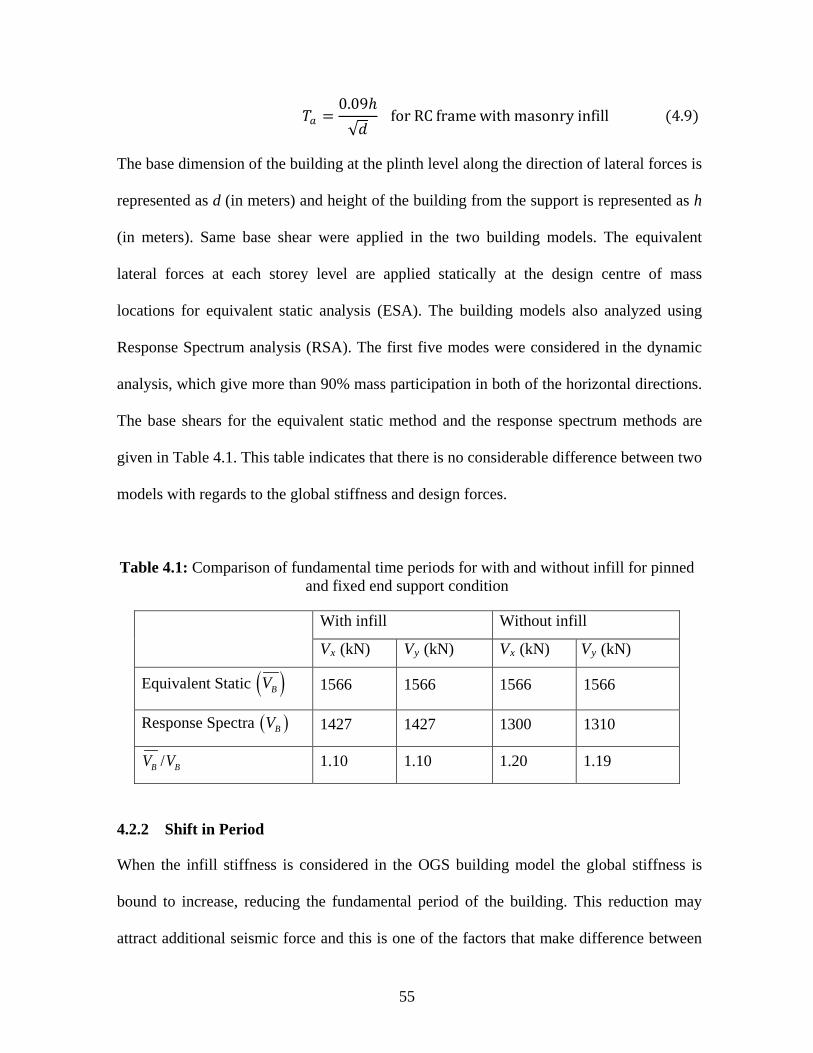
55
𝑇𝑇𝑎𝑎 =0.09ℎ√𝑑𝑑
for RC frame with masonry infill (4.9)
The base dimension of the building at the plinth level along the direction of lateral forces is
represented as d (in meters) and height of the building from the support is represented as h
(in meters). Same base shear were applied in the two building models. The equivalent
lateral forces at each storey level are applied statically at the design centre of mass
locations for equivalent static analysis (ESA). The building models also analyzed using
Response Spectrum analysis (RSA). The first five modes were considered in the dynamic
analysis, which give more than 90% mass participation in both of the horizontal directions.
The base shears for the equivalent static method and the response spectrum methods are
given in Table 4.1. This table indicates that there is no considerable difference between two
models with regards to the global stiffness and design forces.
Table 4.1: Comparison of fundamental time periods for with and without infill for pinned and fixed end support condition
With infill Without infill
Vx (kN) Vy (kN) Vx (kN) Vy (kN)
Equivalent Static ( )BV 1566 1566 1566 1566
Response Spectra ( )BV 1427 1427 1300 1310
/B BV V 1.10 1.10 1.20 1.19
4.2.2 Shift in Period
When the infill stiffness is considered in the OGS building model the global stiffness is
bound to increase, reducing the fundamental period of the building. This reduction may
attract additional seismic force and this is one of the factors that make difference between
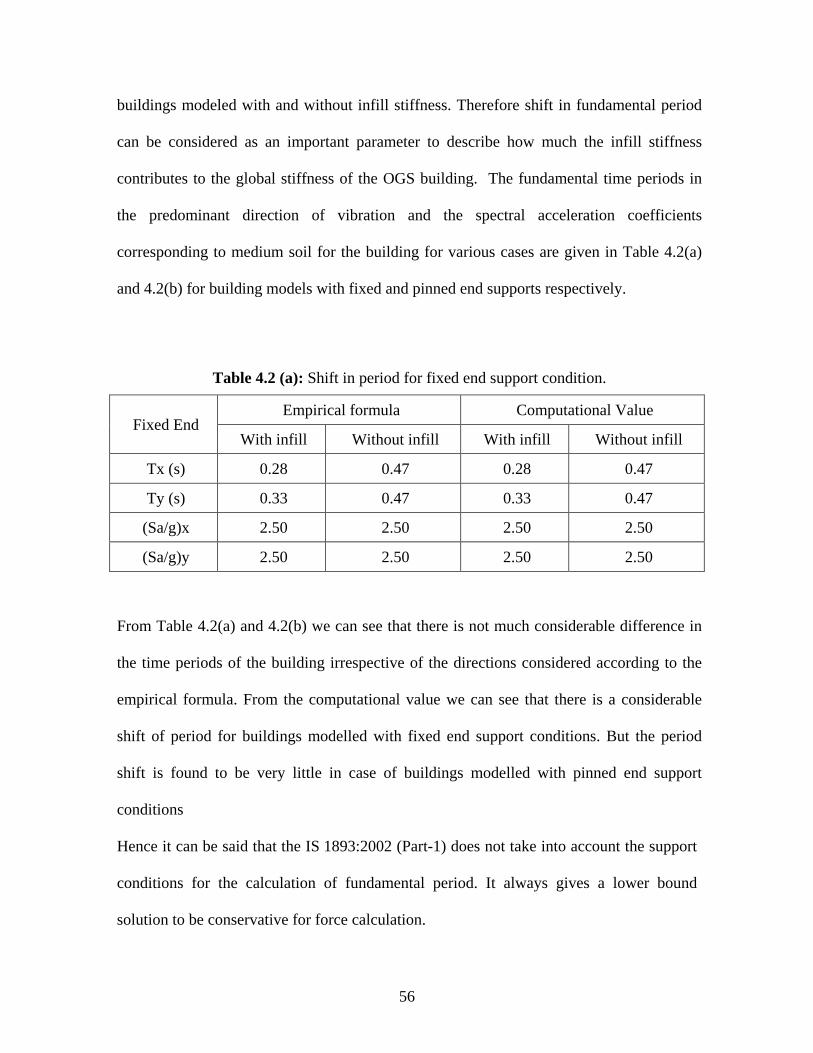
56
buildings modeled with and without infill stiffness. Therefore shift in fundamental period
can be considered as an important parameter to describe how much the infill stiffness
contributes to the global stiffness of the OGS building. The fundamental time periods in
the predominant direction of vibration and the spectral acceleration coefficients
corresponding to medium soil for the building for various cases are given in Table 4.2(a)
and 4.2(b) for building models with fixed and pinned end supports respectively.
Table 4.2 (a): Shift in period for fixed end support condition.
Fixed End Empirical formula Computational Value
With infill Without infill With infill Without infill
Tx (s) 0.28 0.47 0.28 0.47
Ty (s) 0.33 0.47 0.33 0.47
(Sa/g)x 2.50 2.50 2.50 2.50
(Sa/g)y 2.50 2.50 2.50 2.50
From Table 4.2(a) and 4.2(b) we can see that there is not much considerable difference in
the time periods of the building irrespective of the directions considered according to the
empirical formula. From the computational value we can see that there is a considerable
shift of period for buildings modelled with fixed end support conditions. But the period
shift is found to be very little in case of buildings modelled with pinned end support
conditions
Hence it can be said that the IS 1893:2002 (Part-1) does not take into account the support
conditions for the calculation of fundamental period. It always gives a lower bound
solution to be conservative for force calculation.
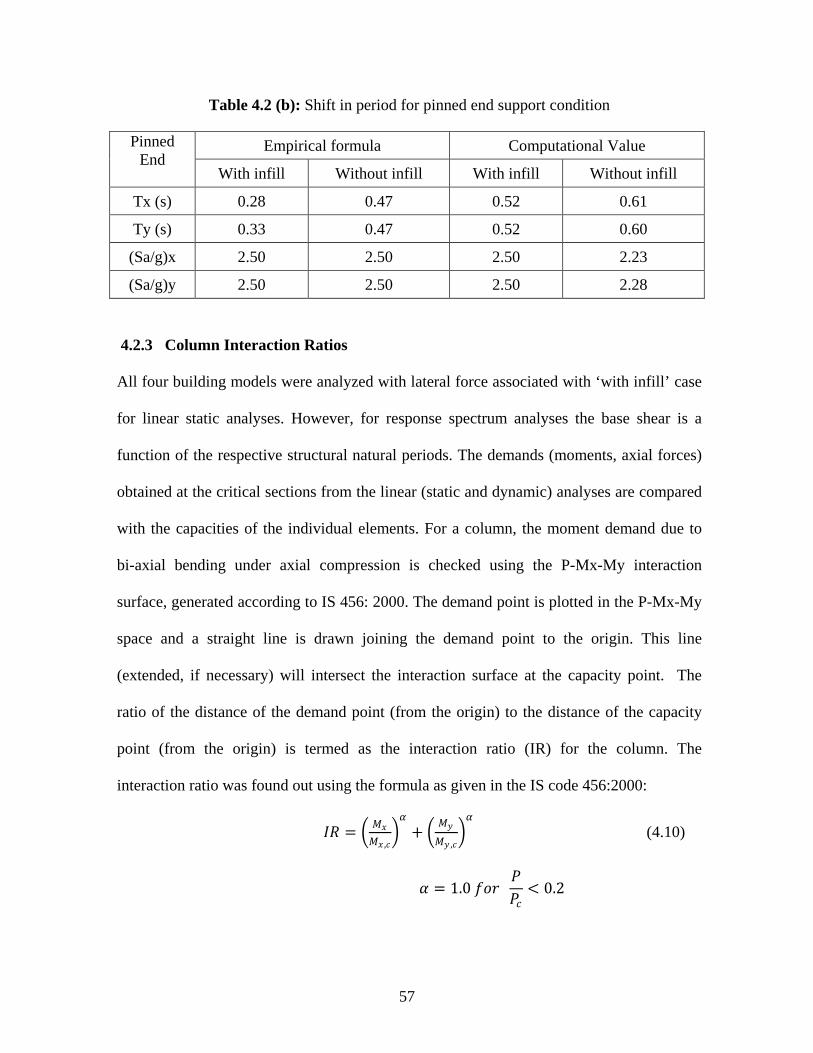
57
Table 4.2 (b): Shift in period for pinned end support condition
Pinned End
Empirical formula Computational Value
With infill Without infill With infill Without infill
Tx (s) 0.28 0.47 0.52 0.61
Ty (s) 0.33 0.47 0.52 0.60
(Sa/g)x 2.50 2.50 2.50 2.23
(Sa/g)y 2.50 2.50 2.50 2.28
4.2.3 Column Interaction Ratios
All four building models were analyzed with lateral force associated with ‘with infill’ case
for linear static analyses. However, for response spectrum analyses the base shear is a
function of the respective structural natural periods. The demands (moments, axial forces)
obtained at the critical sections from the linear (static and dynamic) analyses are compared
with the capacities of the individual elements. For a column, the moment demand due to
bi-axial bending under axial compression is checked using the P-Mx-My interaction
surface, generated according to IS 456: 2000. The demand point is plotted in the P-Mx-My
space and a straight line is drawn joining the demand point to the origin. This line
(extended, if necessary) will intersect the interaction surface at the capacity point. The
ratio of the distance of the demand point (from the origin) to the distance of the capacity
point (from the origin) is termed as the interaction ratio (IR) for the column. The
interaction ratio was found out using the formula as given in the IS code 456:2000:
𝐼𝐼𝑅𝑅 = � 𝑀𝑀𝑥𝑥𝑀𝑀𝑥𝑥 ,𝑐𝑐
�𝛼𝛼
+ � 𝑀𝑀𝑦𝑦
𝑀𝑀𝑦𝑦 ,𝑐𝑐�𝛼𝛼
(4.10)
𝛼𝛼 = 1.0 𝑓𝑓𝑓𝑓𝑓𝑓 𝑃𝑃𝑃𝑃𝑐𝑐
< 0.2
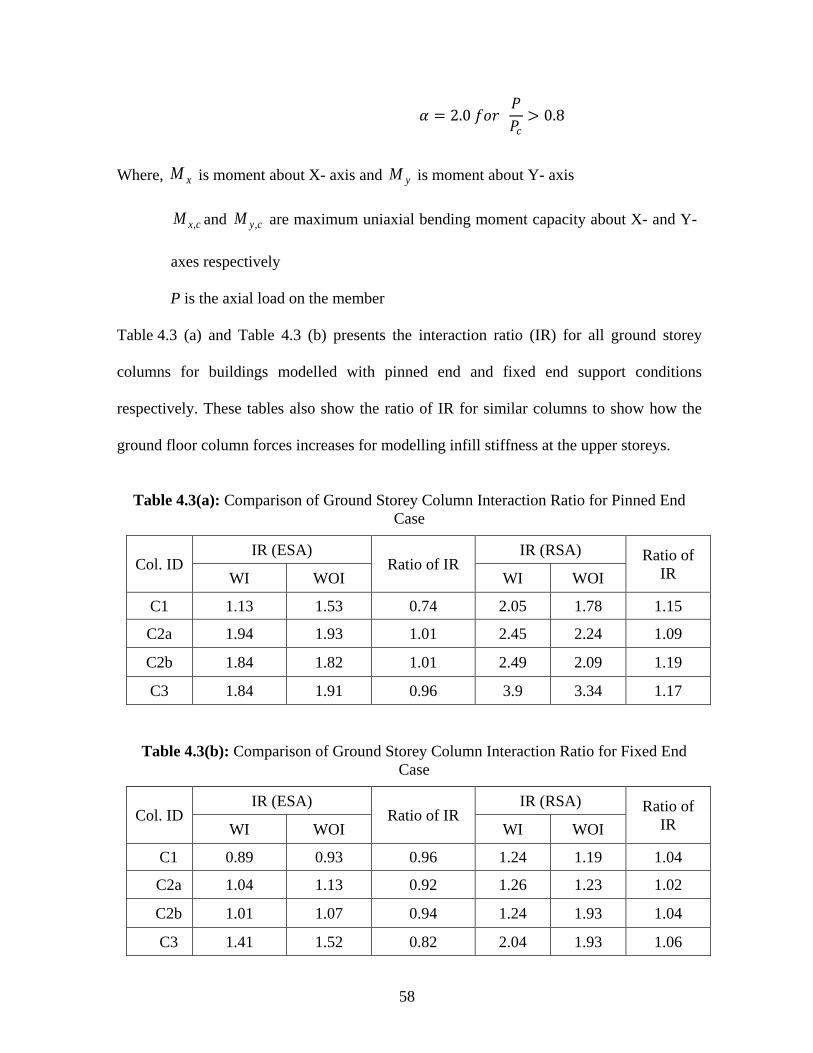
58
𝛼𝛼 = 2.0 𝑓𝑓𝑓𝑓𝑓𝑓 𝑃𝑃𝑃𝑃𝑐𝑐
> 0.8
Where, xM is moment about X- axis and yM is moment about Y- axis
cxM , and cyM , are maximum uniaxial bending moment capacity about X- and Y-
axes respectively
P is the axial load on the member
Table 4.3 (a) and Table 4.3 (b) presents the interaction ratio (IR) for all ground storey
columns for buildings modelled with pinned end and fixed end support conditions
respectively. These tables also show the ratio of IR for similar columns to show how the
ground floor column forces increases for modelling infill stiffness at the upper storeys.
Table 4.3(a): Comparison of Ground Storey Column Interaction Ratio for Pinned End
Case
Col. ID IR (ESA)
Ratio of IR IR (RSA) Ratio of
IR WI WOI WI WOI
C1 1.13 1.53 0.74 2.05 1.78 1.15
C2a 1.94 1.93 1.01 2.45 2.24 1.09
C2b 1.84 1.82 1.01 2.49 2.09 1.19
C3 1.84 1.91 0.96 3.9 3.34 1.17
Table 4.3(b): Comparison of Ground Storey Column Interaction Ratio for Fixed End Case
Col. ID IR (ESA)
Ratio of IR IR (RSA) Ratio of
IR WI WOI WI WOI
C1 0.89 0.93 0.96 1.24 1.19 1.04
C2a 1.04 1.13 0.92 1.26 1.23 1.02
C2b 1.01 1.07 0.94 1.24 1.93 1.04
C3 1.41 1.52 0.82 2.04 1.93 1.06
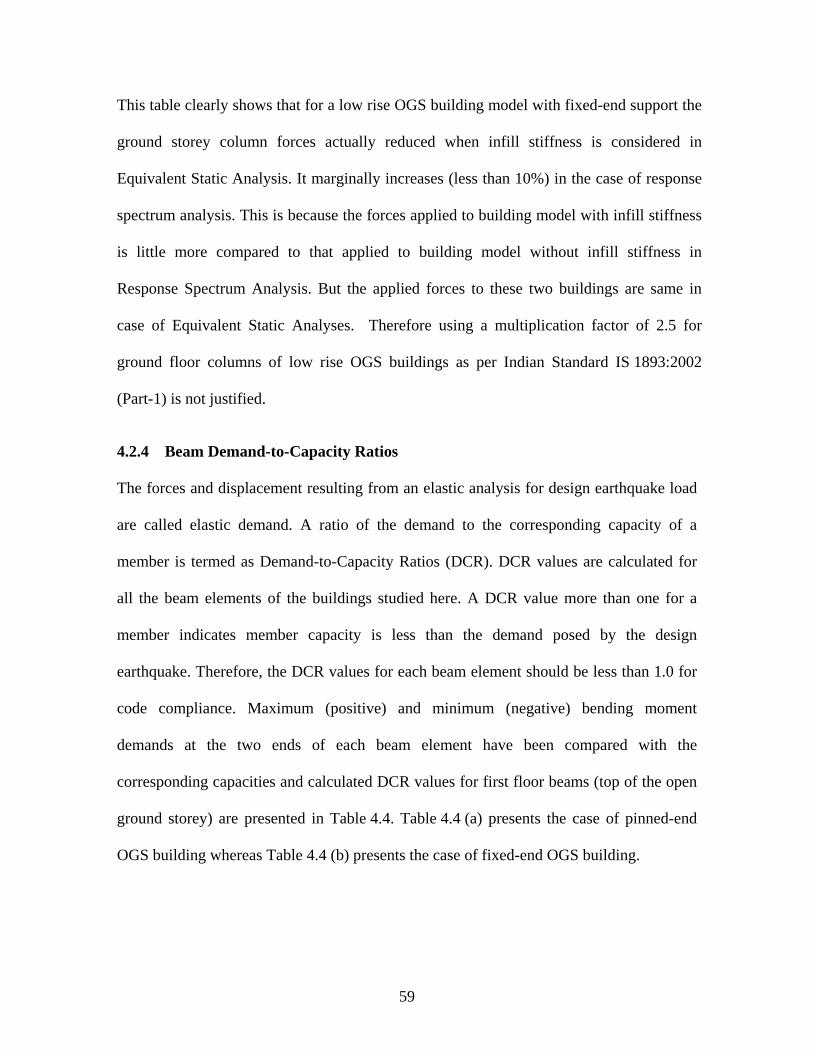
59
This table clearly shows that for a low rise OGS building model with fixed-end support the
ground storey column forces actually reduced when infill stiffness is considered in
Equivalent Static Analysis. It marginally increases (less than 10%) in the case of response
spectrum analysis. This is because the forces applied to building model with infill stiffness
is little more compared to that applied to building model without infill stiffness in
Response Spectrum Analysis. But the applied forces to these two buildings are same in
case of Equivalent Static Analyses. Therefore using a multiplication factor of 2.5 for
ground floor columns of low rise OGS buildings as per Indian Standard IS 1893:2002
(Part-1) is not justified.
4.2.4 Beam Demand-to-Capacity Ratios
The forces and displacement resulting from an elastic analysis for design earthquake load
are called elastic demand. A ratio of the demand to the corresponding capacity of a
member is termed as Demand-to-Capacity Ratios (DCR). DCR values are calculated for
all the beam elements of the buildings studied here. A DCR value more than one for a
member indicates member capacity is less than the demand posed by the design
earthquake. Therefore, the DCR values for each beam element should be less than 1.0 for
code compliance. Maximum (positive) and minimum (negative) bending moment
demands at the two ends of each beam element have been compared with the
corresponding capacities and calculated DCR values for first floor beams (top of the open
ground storey) are presented in Table 4.4. Table 4.4 (a) presents the case of pinned-end
OGS building whereas Table 4.4 (b) presents the case of fixed-end OGS building.
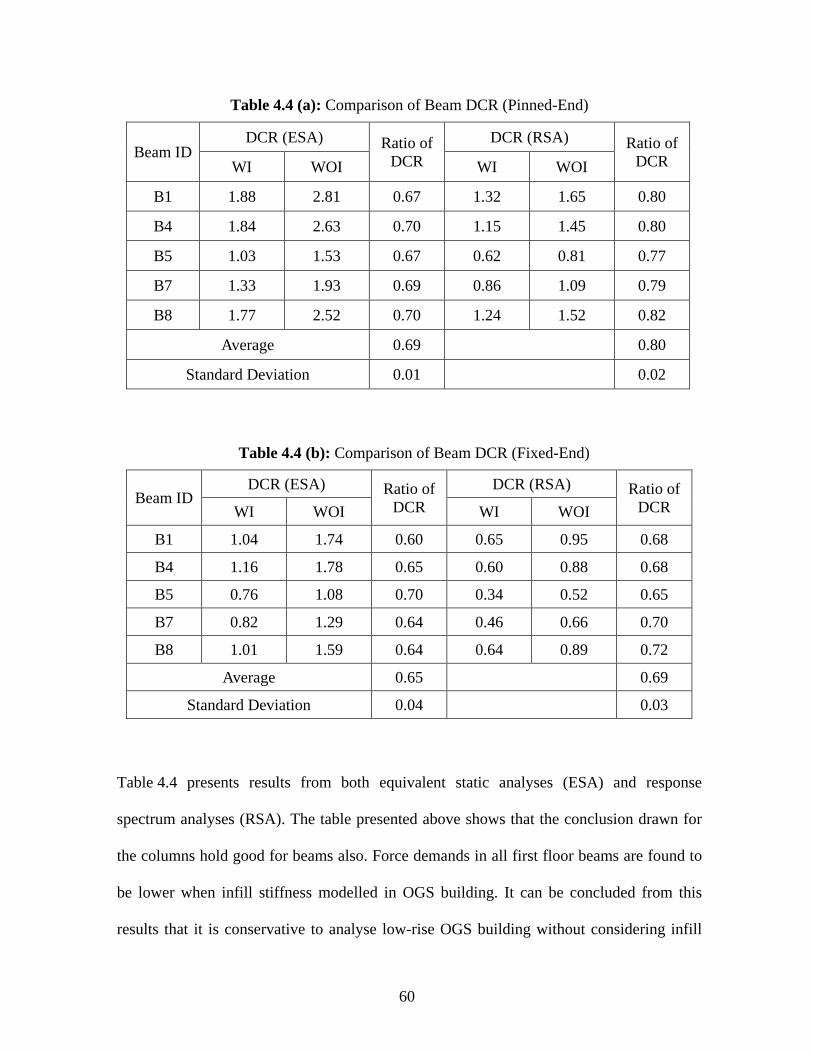
60
Table 4.4 (a): Comparison of Beam DCR (Pinned-End)
Beam ID DCR (ESA) Ratio of
DCR DCR (RSA) Ratio of
DCR WI WOI WI WOI
B1 1.88 2.81 0.67 1.32 1.65 0.80
B4 1.84 2.63 0.70 1.15 1.45 0.80
B5 1.03 1.53 0.67 0.62 0.81 0.77
B7 1.33 1.93 0.69 0.86 1.09 0.79
B8 1.77 2.52 0.70 1.24 1.52 0.82
Average 0.69 0.80
Standard Deviation 0.01 0.02
Table 4.4 (b): Comparison of Beam DCR (Fixed-End)
Beam ID DCR (ESA) Ratio of
DCR DCR (RSA) Ratio of
DCR WI WOI WI WOI
B1 1.04 1.74 0.60 0.65 0.95 0.68
B4 1.16 1.78 0.65 0.60 0.88 0.68
B5 0.76 1.08 0.70 0.34 0.52 0.65
B7 0.82 1.29 0.64 0.46 0.66 0.70
B8 1.01 1.59 0.64 0.64 0.89 0.72
Average 0.65 0.69
Standard Deviation 0.04 0.03
Table 4.4 presents results from both equivalent static analyses (ESA) and response
spectrum analyses (RSA). The table presented above shows that the conclusion drawn for
the columns hold good for beams also. Force demands in all first floor beams are found to
be lower when infill stiffness modelled in OGS building. It can be concluded from this
results that it is conservative to analyse low-rise OGS building without considering infill
61
stiffness. Table 4.4 shows that the average ratio of DCR values (ratio of DCR in WI model
to DCR in WOI model) for first floor beams is below 0.70 for both pinned-end and fixed-
end building in Equivalent Static Analyses. Table 4.4 (b) shows that the average ratio of
DCR values for first floor beams is 0.80 for pinned-end building in Response Spectrum
Analyses although this lies within 0.70 for fixed-end building model. A statistical analysis
of the DCR ratios shows that the DCR ratios for all the beams are very consistent (standard
deviation is within 0.04 for all cases). A conclusion can be drawn from these results that
amplification factor of 2.5 need not be multiplied to the beam forces even when infill
stiffness is not modelled in analysis. However, this statement is valid for low-rise OGS
building and cannot be used for high-rise OGS buildings.
It is observed from Table 4.3 (a), 4.3 (b), 4.4(a), and 4.4 (b) that analysis of the model
without considering infill strength and stiffness gives a conservative estimation for all
beam and column elements in a low-rise open ground storey building. This is true for
equivalent static analysis as well as response spectrum analysis. The response spectrum
analyses present slightly different results for column. As per the response spectrum
analyses, model without considering infill strength and stiffness gives marginally un-
conservative estimate for the columns. This is due to the applied load, in response spectrum
analyses, is more in the model with infill strength and stiffness. This is to be noted that the
applied force were same for both of the two models in equivalent static analyses. Therefore
it can be concluded that if the applied load is fixed the building analysis ignoring infill
strength and stiffness will be conservative even for a low-rise OGS building.
62
4.3 SUMMARY
This chapter starts with a detailed description of equivalent static analysis procedure and
response spectrum analysis procedure as per Indian Standard IS 1893 (Part -1): 2002
followed by the analysis results of selected OGS buildings obtained by these two methods
of analyses.
It is observed from the results presented here that analysis of the model without
considering infill strength and stiffness gives a conservative estimation for all beam and
column elements in a low-rise open ground storey building. This is true for equivalent
static analysis as well as response spectrum analysis. Therefore, amplification factor of 2.5
as recommended in Indian Standard IS 1893 (Part -1): 2002 need not be multiplied to the
beam forces even when infill stiffness is not modelled in analysis. This conclusion based
on linear analysis needs to be validated by nonlinear analysis.
CHAPTER 5
RESULTS FROM NON-LINEAR ANALYSIS
5.1 INTRODUCTION
It is found from the linear (static and dynamic) analyses that the amplification factor of
2.5 as recommended in Indian Standard IS 1893 (Part -1): 2002 for designing open
ground storey beams and columns are too conservative for low-rise OGS buildings. An
effort has been made to verify this conclusion from nonlinear analysis. Pushover Analysis
is selected as it is the simplest among the different nonlinear analysis procedures. First
half of this chapter presents a detailed description on Pushover Analysis and its
procedure. Later half of this chapter presents the results obtained from the pushover
analyses of selected open ground storey building for both pinned and fixed end condition.
Nonlinear analysis requires modelling of all load resisting elements with material
nonlinearity. Modelling nonlinearity for frame elements and infill walls is discussed in
Chapter 3.
5.2 PUSHOVER ANALYSIS
The pushover analysis is a nonlinear static method which is used in a performance based
analysis. The method is relatively simple to be implemented, and provides information on
strength, deformation and ductility of the structure and distribution of demands which
help in identifying the critical members likely to reach limit states during the earthquake
and hence proper attention can be given while designing and detailing. This method
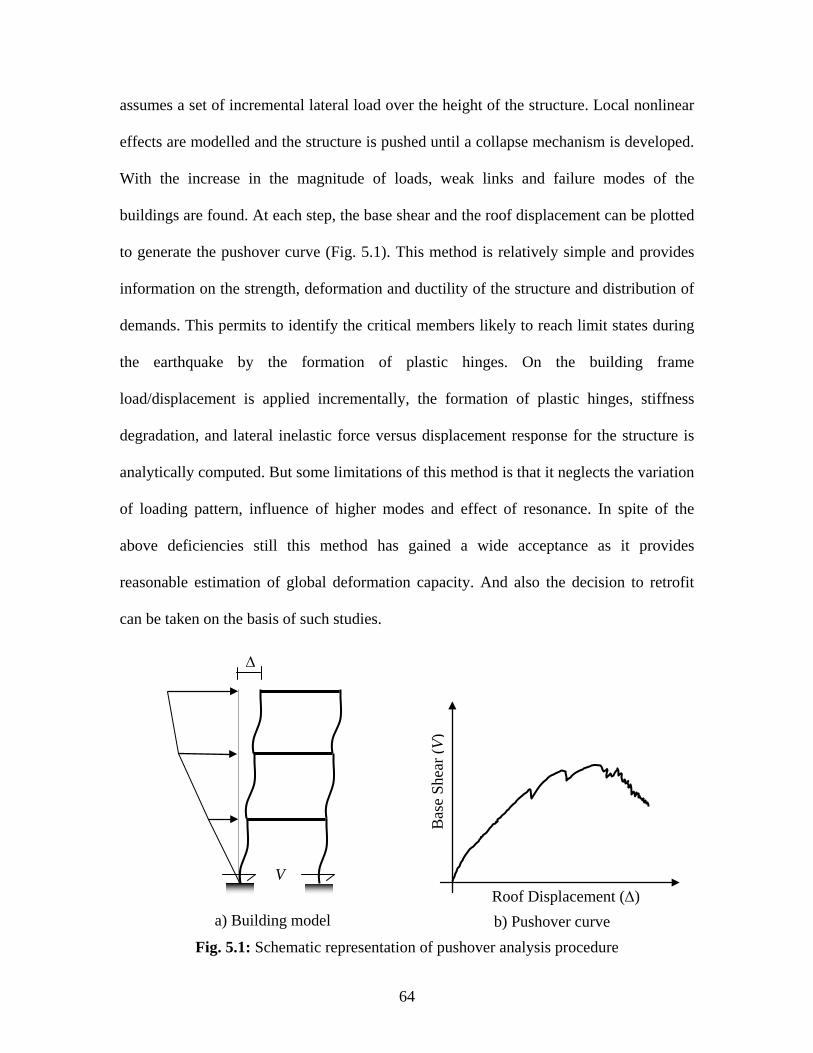
64
assumes a set of incremental lateral load over the height of the structure. Local nonlinear
effects are modelled and the structure is pushed until a collapse mechanism is developed.
With the increase in the magnitude of loads, weak links and failure modes of the
buildings are found. At each step, the base shear and the roof displacement can be plotted
to generate the pushover curve (Fig. 5.1). This method is relatively simple and provides
information on the strength, deformation and ductility of the structure and distribution of
demands. This permits to identify the critical members likely to reach limit states during
the earthquake by the formation of plastic hinges. On the building frame
load/displacement is applied incrementally, the formation of plastic hinges, stiffness
degradation, and lateral inelastic force versus displacement response for the structure is
analytically computed. But some limitations of this method is that it neglects the variation
of loading pattern, influence of higher modes and effect of resonance. In spite of the
above deficiencies still this method has gained a wide acceptance as it provides
reasonable estimation of global deformation capacity. And also the decision to retrofit
can be taken on the basis of such studies.
Fig. 5.1: Schematic representation of pushover analysis procedure
Bas
e Sh
ear (
V)
Roof Displacement (∆) a) Building model b) Pushover curve
∆
V
65
It gives an idea of the maximum base shear that the structure is capable of resisting and
the corresponding inelastic drift. For regular buildings, it also gives an estimate of the
global stiffness of the building.
In pushover analysis, it is necessary to model the nonlinear load versus deformation
behaviour of every element. The beams and columns are modelled as frame elements and
the infill walls are modelled as equivalent struts by truss elements. Since the
deformations are expected to go beyond the elastic range in a pushover analysis, it is
necessary to model the nonlinear load versus deformation behaviour of the members. The
nonlinear behaviour is incorporated in the load versus deformation property of a
concentrated hinge attached to the member.
5.3 PUSHOVER ANALYSIS PROCEDURE
Pushover analysis involves the application of increasing lateral forces or displacements to
a nonlinear mathematical model of a building. The nonlinear load-deformation behaviour
of each component of the building is modelled individually. In a force-controlled push,
the forces are increased monotonically until either the total force reaches a target value or
the building has a collapse mechanism. In a displacement-controlled push, the
displacements are increased monotonically until either the displacement of a predefined
control node in the building exceeds a target value or the building has a collapse
mechanism. For convenience, the control node can be taken at the design centre of mass
of the roof of the building. The target displacement is intended to represent the
maximum displacement likely to be experienced during the earthquake.
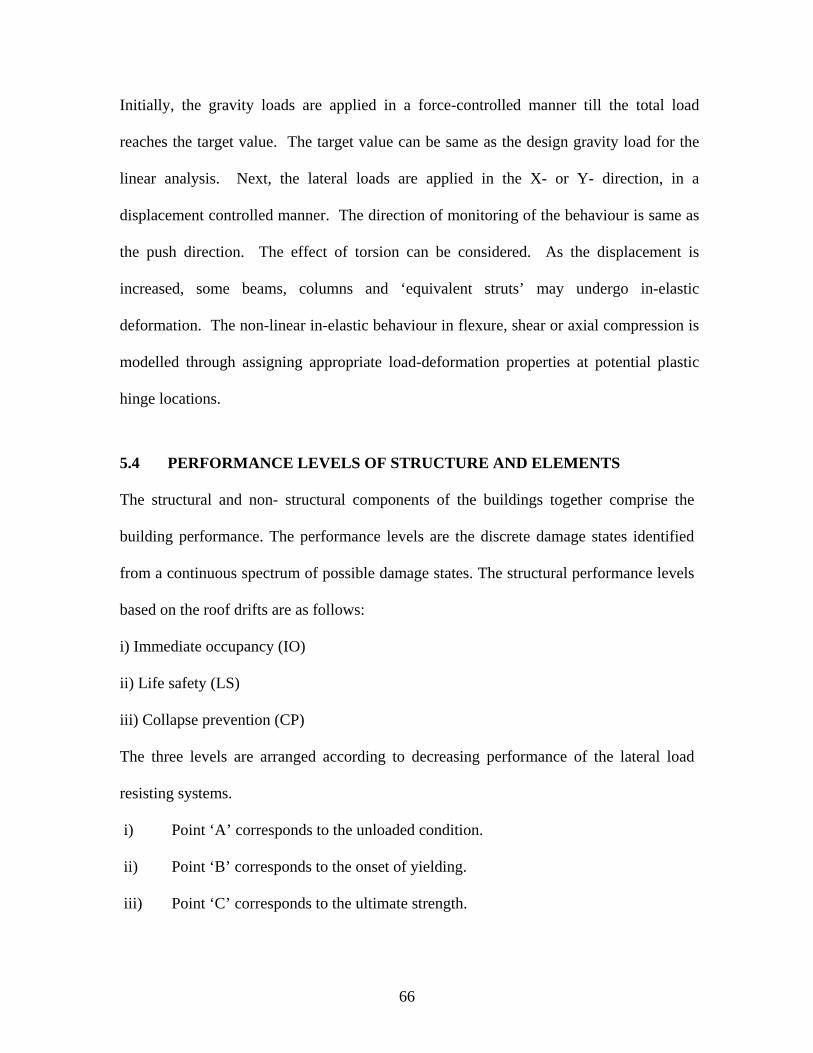
66
Initially, the gravity loads are applied in a force-controlled manner till the total load
reaches the target value. The target value can be same as the design gravity load for the
linear analysis. Next, the lateral loads are applied in the X- or Y- direction, in a
displacement controlled manner. The direction of monitoring of the behaviour is same as
the push direction. The effect of torsion can be considered. As the displacement is
increased, some beams, columns and ‘equivalent struts’ may undergo in-elastic
deformation. The non-linear in-elastic behaviour in flexure, shear or axial compression is
modelled through assigning appropriate load-deformation properties at potential plastic
hinge locations.
5.4 PERFORMANCE LEVELS OF STRUCTURE AND ELEMENTS The structural and non- structural components of the buildings together comprise the
building performance. The performance levels are the discrete damage states identified
from a continuous spectrum of possible damage states. The structural performance levels
based on the roof drifts are as follows:
i) Immediate occupancy (IO)
ii) Life safety (LS)
iii) Collapse prevention (CP)
The three levels are arranged according to decreasing performance of the lateral load
resisting systems.
i) Point ‘A’ corresponds to the unloaded condition.
ii) Point ‘B’ corresponds to the onset of yielding.
iii) Point ‘C’ corresponds to the ultimate strength.
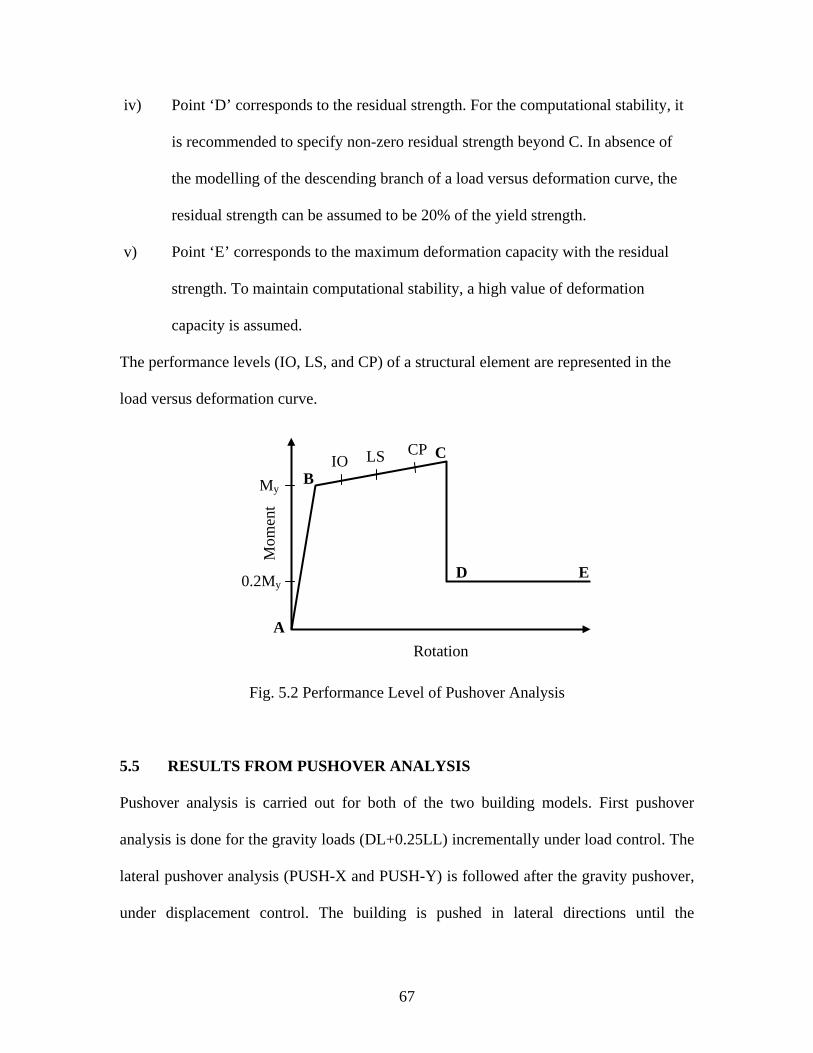
67
iv) Point ‘D’ corresponds to the residual strength. For the computational stability, it
is recommended to specify non-zero residual strength beyond C. In absence of
the modelling of the descending branch of a load versus deformation curve, the
residual strength can be assumed to be 20% of the yield strength.
v) Point ‘E’ corresponds to the maximum deformation capacity with the residual
strength. To maintain computational stability, a high value of deformation
capacity is assumed.
The performance levels (IO, LS, and CP) of a structural element are represented in the
load versus deformation curve.
Fig. 5.2 Performance Level of Pushover Analysis
5.5 RESULTS FROM PUSHOVER ANALYSIS
Pushover analysis is carried out for both of the two building models. First pushover
analysis is done for the gravity loads (DL+0.25LL) incrementally under load control. The
lateral pushover analysis (PUSH-X and PUSH-Y) is followed after the gravity pushover,
under displacement control. The building is pushed in lateral directions until the
A
B C
D E
Rotation
Mom
ent
0.2My
My IO LS CP
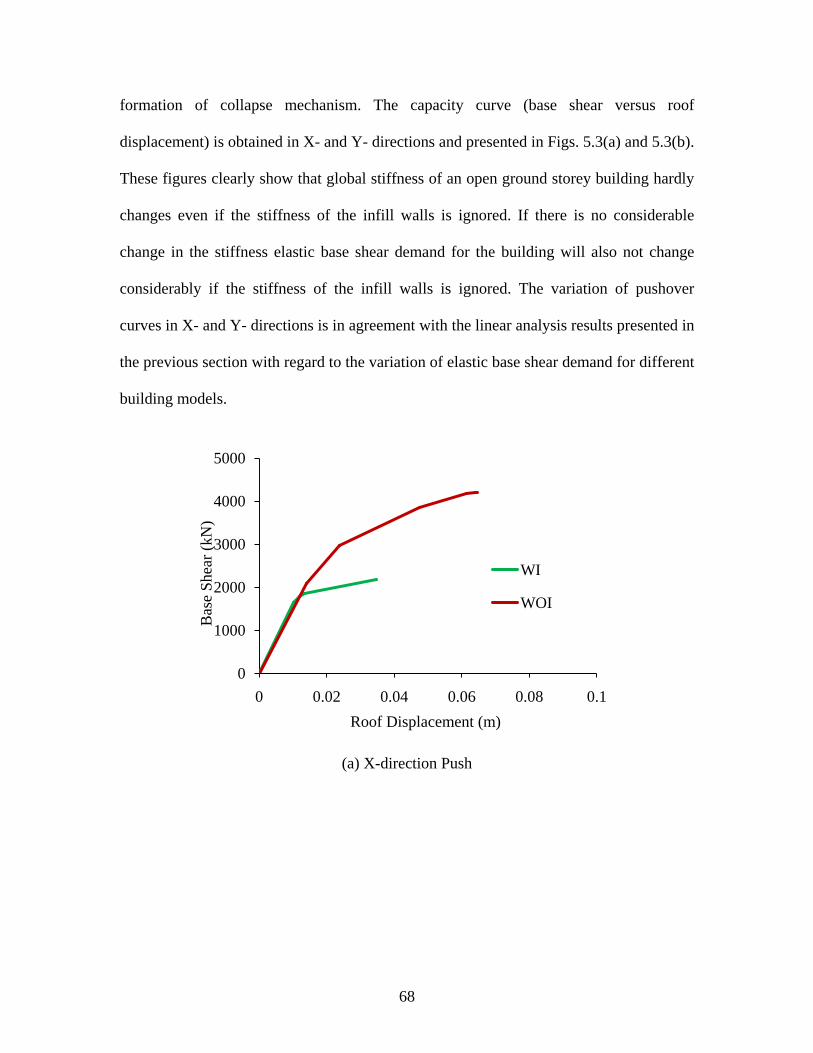
68
formation of collapse mechanism. The capacity curve (base shear versus roof
displacement) is obtained in X- and Y- directions and presented in Figs. 5.3(a) and 5.3(b).
These figures clearly show that global stiffness of an open ground storey building hardly
changes even if the stiffness of the infill walls is ignored. If there is no considerable
change in the stiffness elastic base shear demand for the building will also not change
considerably if the stiffness of the infill walls is ignored. The variation of pushover
curves in X- and Y- directions is in agreement with the linear analysis results presented in
the previous section with regard to the variation of elastic base shear demand for different
building models.
(a) X-direction Push
0
1000
2000
3000
4000
5000
0 0.02 0.04 0.06 0.08 0.1
Bas
e Sh
ear (
kN)
Roof Displacement (m)
WI
WOI
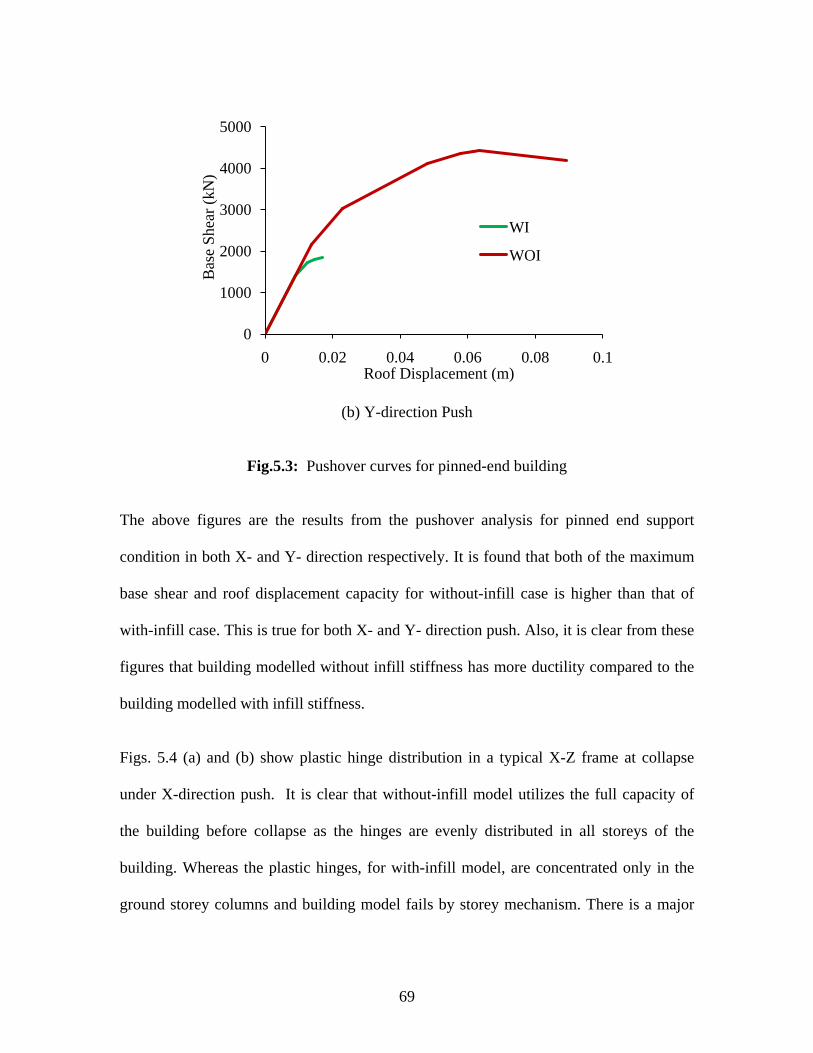
69
(b) Y-direction Push
Fig.5.3: Pushover curves for pinned-end building
The above figures are the results from the pushover analysis for pinned end support
condition in both X- and Y- direction respectively. It is found that both of the maximum
base shear and roof displacement capacity for without-infill case is higher than that of
with-infill case. This is true for both X- and Y- direction push. Also, it is clear from these
figures that building modelled without infill stiffness has more ductility compared to the
building modelled with infill stiffness.
Figs. 5.4 (a) and (b) show plastic hinge distribution in a typical X-Z frame at collapse
under X-direction push. It is clear that without-infill model utilizes the full capacity of
the building before collapse as the hinges are evenly distributed in all storeys of the
building. Whereas the plastic hinges, for with-infill model, are concentrated only in the
ground storey columns and building model fails by storey mechanism. There is a major
0
1000
2000
3000
4000
5000
0 0.02 0.04 0.06 0.08 0.1
Bas
e Sh
ear (
kN)
Roof Displacement (m)
WI
WOI
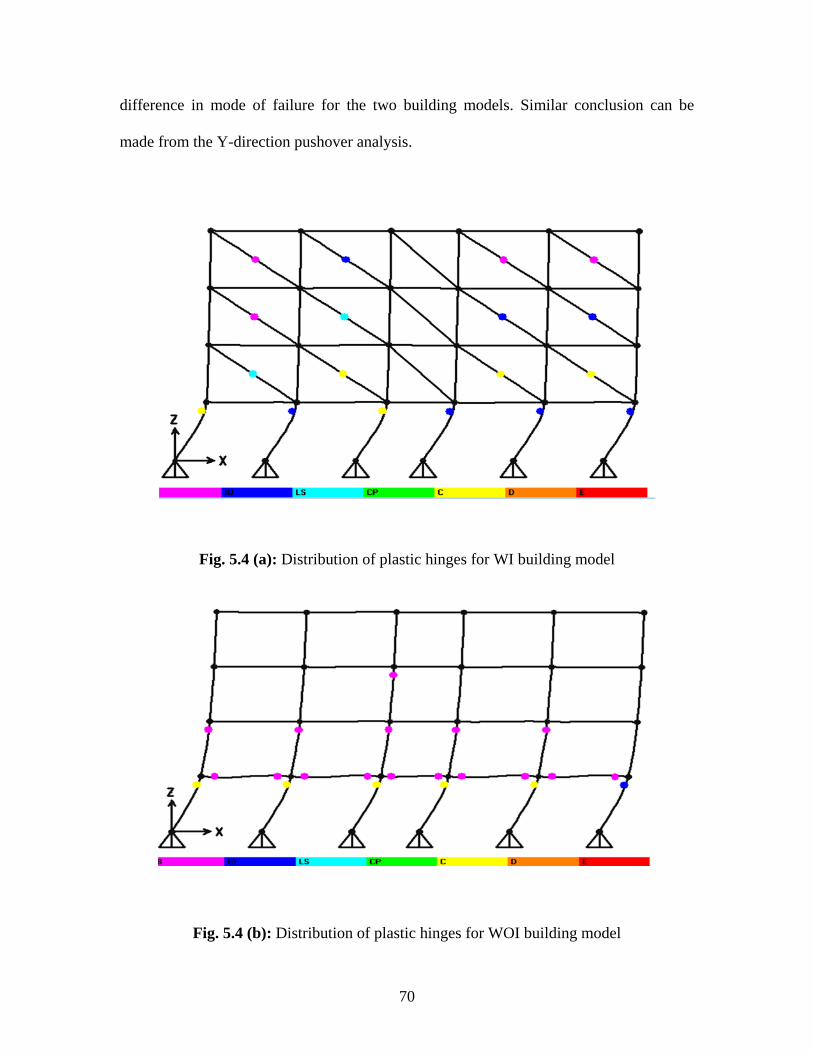
70
difference in mode of failure for the two building models. Similar conclusion can be
made from the Y-direction pushover analysis.
Fig. 5.4 (a): Distribution of plastic hinges for WI building model
Fig. 5.4 (b): Distribution of plastic hinges for WOI building model
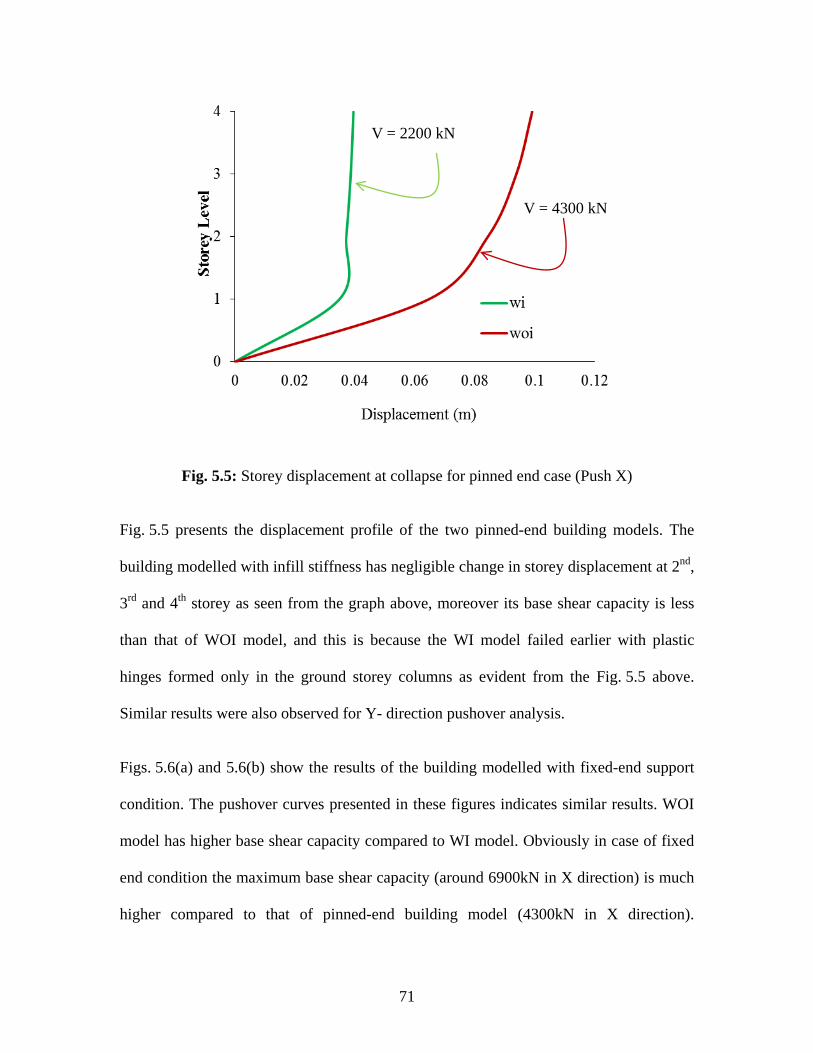
71
Fig. 5.5: Storey displacement at collapse for pinned end case (Push X)
Fig. 5.5 presents the displacement profile of the two pinned-end building models. The
building modelled with infill stiffness has negligible change in storey displacement at 2nd,
3rd and 4th storey as seen from the graph above, moreover its base shear capacity is less
than that of WOI model, and this is because the WI model failed earlier with plastic
hinges formed only in the ground storey columns as evident from the Fig. 5.5 above.
Similar results were also observed for Y- direction pushover analysis.
Figs. 5.6(a) and 5.6(b) show the results of the building modelled with fixed-end support
condition. The pushover curves presented in these figures indicates similar results. WOI
model has higher base shear capacity compared to WI model. Obviously in case of fixed
end condition the maximum base shear capacity (around 6900kN in X direction) is much
higher compared to that of pinned-end building model (4300kN in X direction).
V = 4300 kN
V = 2200 kN
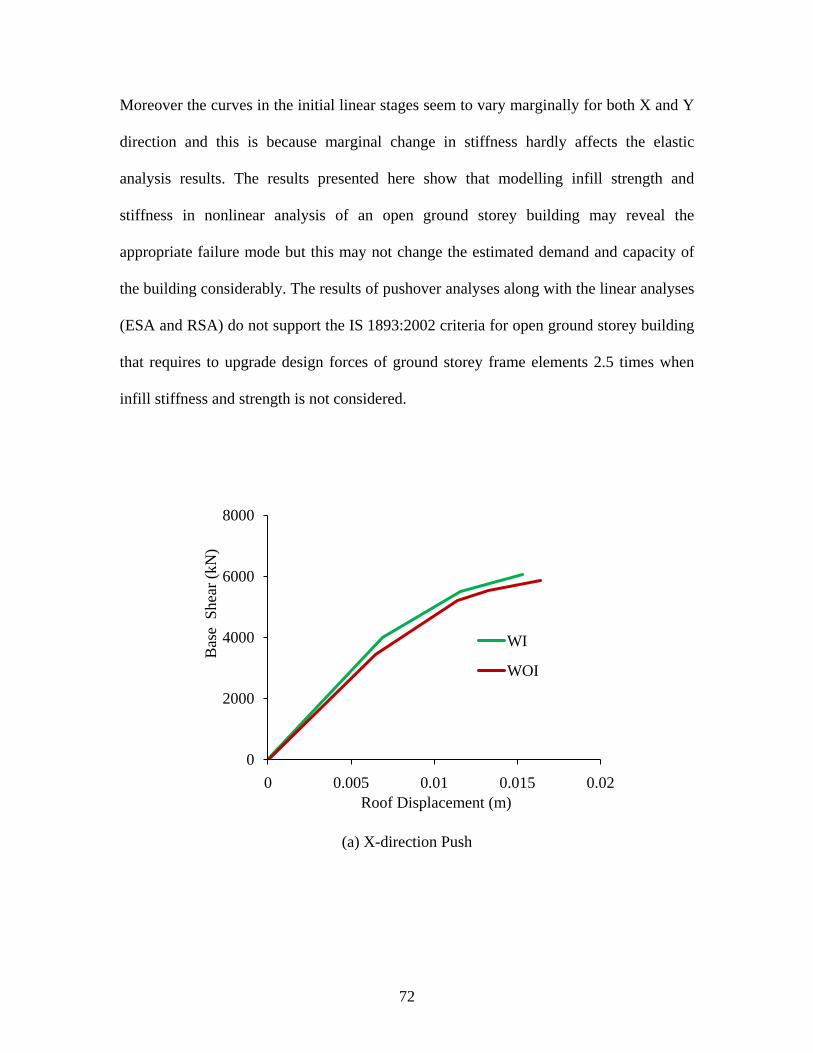
72
Moreover the curves in the initial linear stages seem to vary marginally for both X and Y
direction and this is because marginal change in stiffness hardly affects the elastic
analysis results. The results presented here show that modelling infill strength and
stiffness in nonlinear analysis of an open ground storey building may reveal the
appropriate failure mode but this may not change the estimated demand and capacity of
the building considerably. The results of pushover analyses along with the linear analyses
(ESA and RSA) do not support the IS 1893:2002 criteria for open ground storey building
that requires to upgrade design forces of ground storey frame elements 2.5 times when
infill stiffness and strength is not considered.
(a) X-direction Push
0
2000
4000
6000
8000
0 0.005 0.01 0.015 0.02
WI
WOI
Roof Displacement (m)
Bas
e S
hear
(kN
)
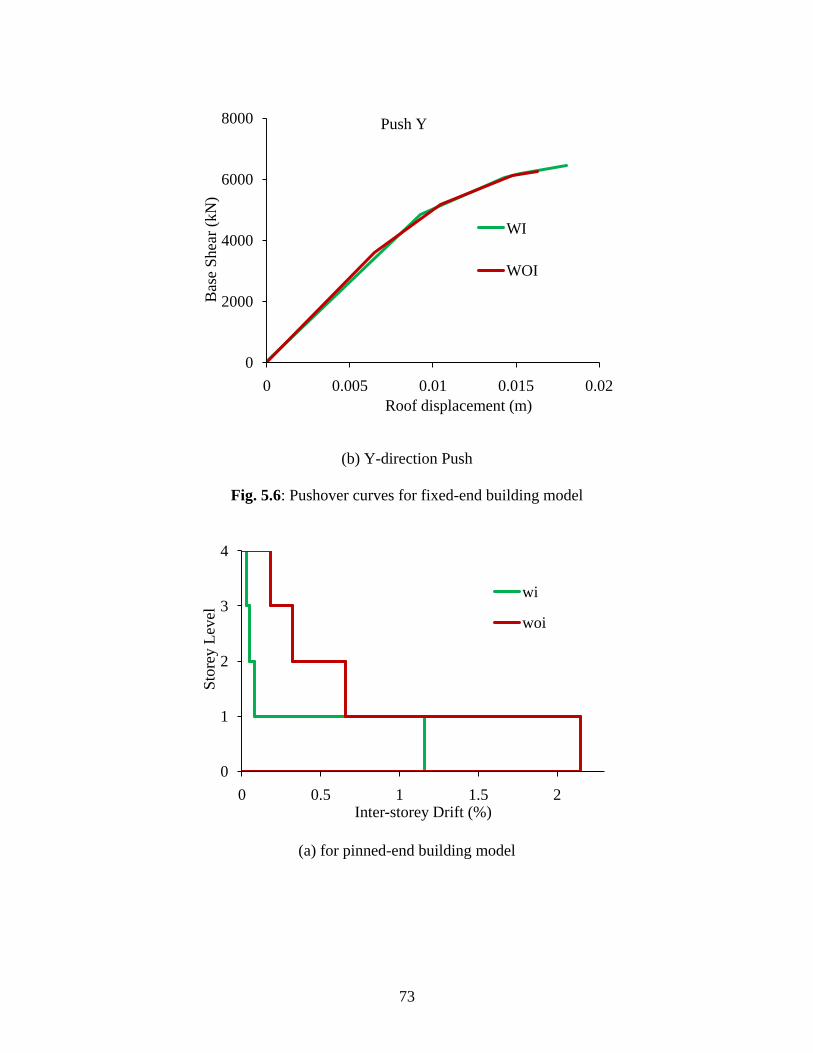
73
(b) Y-direction Push
Fig. 5.6: Pushover curves for fixed-end building model
(a) for pinned-end building model
0
2000
4000
6000
8000
0 0.005 0.01 0.015 0.02
WI
WOI
Roof displacement (m)
Bas
e Sh
ear (
kN)
Push Y
0
1
2
3
4
0 0.5 1 1.5 2
Stor
ey L
evel
Inter-storey Drift (%)
wi
woi
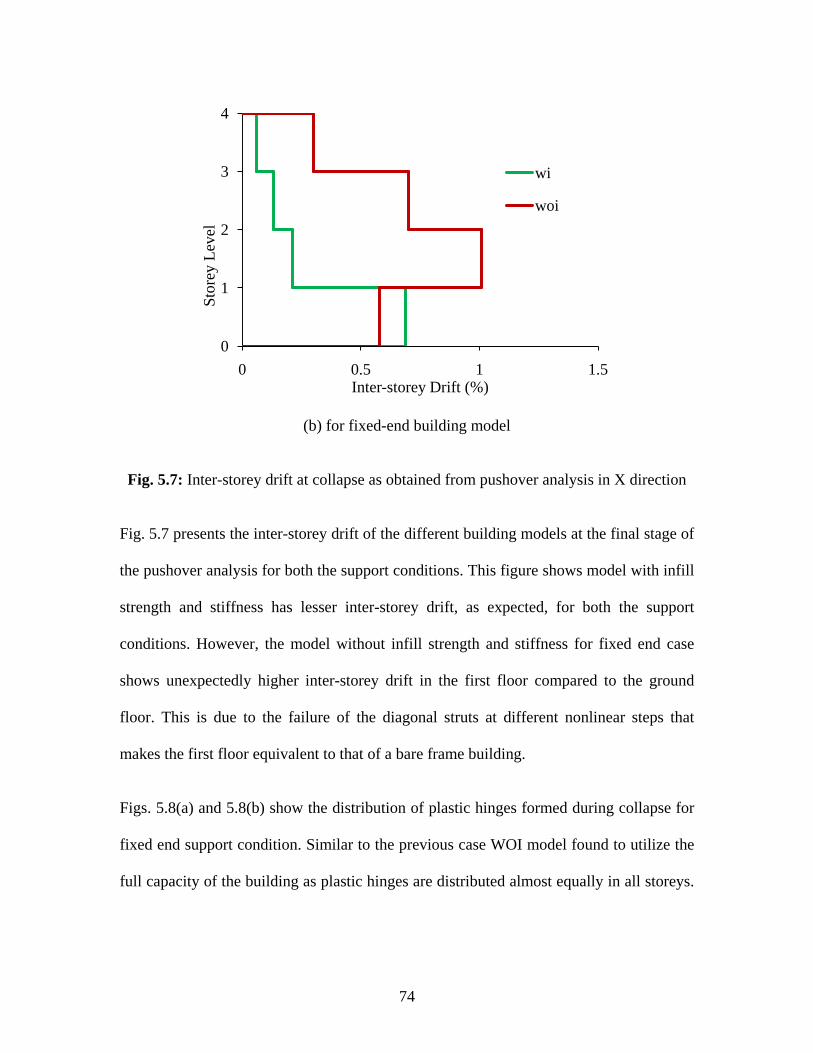
74
(b) for fixed-end building model
Fig. 5.7: Inter-storey drift at collapse as obtained from pushover analysis in X direction
Fig. 5.7 presents the inter-storey drift of the different building models at the final stage of
the pushover analysis for both the support conditions. This figure shows model with infill
strength and stiffness has lesser inter-storey drift, as expected, for both the support
conditions. However, the model without infill strength and stiffness for fixed end case
shows unexpectedly higher inter-storey drift in the first floor compared to the ground
floor. This is due to the failure of the diagonal struts at different nonlinear steps that
makes the first floor equivalent to that of a bare frame building.
Figs. 5.8(a) and 5.8(b) show the distribution of plastic hinges formed during collapse for
fixed end support condition. Similar to the previous case WOI model found to utilize the
full capacity of the building as plastic hinges are distributed almost equally in all storeys.
0
1
2
3
4
0 0.5 1 1.5
Stor
ey L
evel
Inter-storey Drift (%)
wi
woi
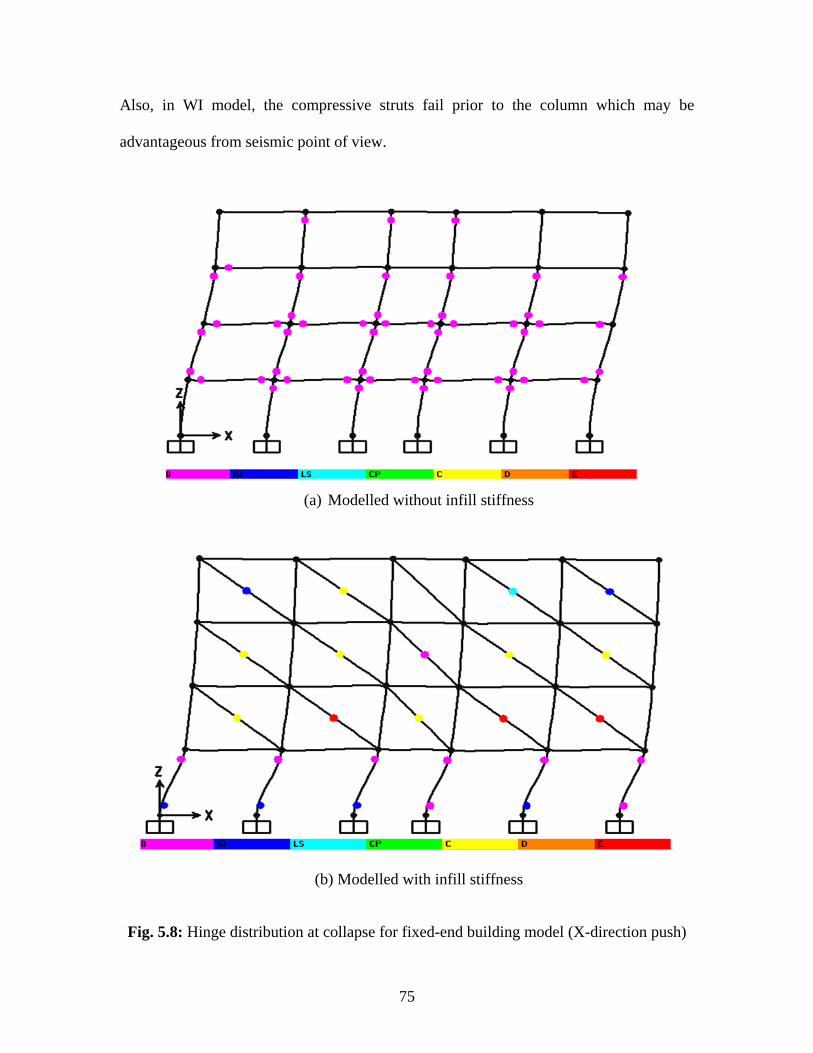
75
Also, in WI model, the compressive struts fail prior to the column which may be
advantageous from seismic point of view.
(a) Modelled without infill stiffness
(b) Modelled with infill stiffness
Fig. 5.8: Hinge distribution at collapse for fixed-end building model (X-direction push)
76
5.6 SUMMARY
Details of Pushover analysis procedure has been presented in this chapter. Pushover
analysis results of the selected building models are discussed. The main conclusion that
can be drawn from the pushover analysis results presented here is estimated elastic force
demand in the frame elements of OGS building do not change much by ignoring the infill
stiffness. But one can wrongly estimate a higher inelastic base shear and displacement
capacity of an OGS building by ignoring infill stiffness. The analysis shows that OGS
building can have a brittle mode of failure when the infill stiffness is correctly modelled.
This cannot be captured when the model ignores the infill stiffness.
CHAPTER 6
SUMMARY AND CONCLUSIONS
6.1 SUMMARY
Open ground storey buildings are considered as vertically irregular buildings as per
IS 1893: 2002 that requires dynamic analysis considering strength and stiffness of the infill
walls. IS 1893: 2002 also permits Equivalent Static Analysis (ESA) of OGS buildings
ignoring strength and stiffness of the infill walls, provided a multiplication factor of 2.5 is
applied on the design forces (bending moments and shear forces) in the ground storey
columns and beams. The objective of the present study is to review the rationality of this
approach. An existing RC framed building (G+3) with open ground storey located in
Seismic Zone-V is analyzed for two different cases: (a) considering infill strength and
stiffness and (b) without considering infill strength and stiffness (bare frame). Infill
weights (and associated masses) were modelled in both the cases through applying static
dead load. Non-integral infill walls subjected to lateral load behave like diagonal struts.
Thus an infill wall can be modelled as an equivalent ‘compression only’ strut in the
building model. Rigid joints connect the beams and columns, but pin joints connect the
equivalent struts to the beam-to-column junctions. Infill stiffness was modelled using a
diagonal strut approach as per Smith and Carter (1969).
Linear static and dynamic analyses of the two building models are carried out to compare
the force demand in the open ground storey frames. The code specified multiplication
factor is compared with the ratio of their force demands. Two different support conditions
78
are considered for the analysis to check the effect of the support conditions on the relative
frame force demand. The support conditions considered are: pinned-end and fixed-end
conditions.
Nonlinear static (pushover) analysis is carried out for all the building models considered.
First pushover analysis is done for the gravity loads incrementally under load control. The
lateral pushover analysis is followed after the gravity pushover, under displacement
control.
6.2 CONCLUSIONS
Followings are the salient conclusions obtained from the present study:
i) IS code gives a value of 2.5 to be multiplied to the ground storey beam and
column forces when a building has to be designed as open ground storey building
or stilt building. The ratio of IR values for columns and DCR values of beams for
both the support conditions and building models were found out using ESA and RSA
and both the analyses supports that a factor of 2.5 is too high to be multiplied to the
beam and column forces of the ground storey. This is particularly true for low-rise
OGS buildings.
ii) Problem of OGS buildings cannot be identified properly through elastic analysis
as the stiffness of OGS building and Bare-frame building are almost same.
iii) Nonlinear analysis reveals that OGS building fails through a ground storey
mechanism at a comparatively low base shear and displacement. And the mode of
failure is found to be brittle.
79
iv) Both elastic and inelastic analyses show that the beams forces at the ground storey
reduce drastically for the presence of infill stiffness in the adjacent storey. And
design force amplification factor need not be applied to ground storey beams.
v) The linear (static/dynamic) analyses show that Column forces at the ground storey
increases for the presence of infill wall in the upper storeys. But design force
amplification factor found to be much lesser than 2.5.
vi) From the literature available it was found that the support condition for the
buildings was not given much importance. Linear and nonlinear analyses show
that support condition influences the response considerably and can be an
important parameter to decide the force amplification factor.
6.3 SCOPE FOR FUTURE WORK
i) The proposed results need to be validated by further case studies. Building models
considered in this study are of low height and therefore influence of period-shift is
negligible. For high-rise buildings shift-in-period can be an additional parameter
what is not accounted in the present study.
ii) Another field of wide research could be the design of the infill walls considering
the door and the window openings which has not been considered in this research
work.
iii) It is found in the present study that the multiplication factor of 2.5 as given in
IS 1893:2002 is not justified through elastic force demand. However this factor
may be required to achieve a ductile mode of failure and to avoid localised storey
mechanism. This can be studied elaborately.
80
REFERENCES
1. A. Asokan, (2006) Modelling of Masonry Infill Walls for Nonlinear Static Analysis
of Buildings under Seismic Loads. M. S. Thesis, Indian Institute of Technology
Madras, Chennai.
2. Agarwal P. and Shrikhande M. (2006) Earthquake resistant design of structures,
PHI Learning Pvt. Ltd., New Delhi.
3. Al-Chaar, G. (2002) Evaluating strength and stiffness of unreinforced masonry infill
structures. U.S. Army Corps of Engineers. Technical Report NO. ERDC/CERL TR-
02-1. Construction Engineering Research Laboratory. Campaign. USA
4. Al-Chaar, G., M. Issa and S. Sweeney (2002) Behaviour of masonry infilled non-
ductile RC frames. Journal of Structural Engineering. American society of Civil
Engineers. 128(8). 1055-1063
5. Arlekar, J.N.; S. K. Jain and C.V.R Murty (1997) Seismic response of RC frame
buildings with soft first storeys. Proceedings of CBRI golden jubilee conference on
natural hazards in urban habitat. New Delhi
6. Asteris P. G. (2003) Lateral stiffness of brick masonry infilled plane frames. Journal
of Structural Engineering. 129(8). 1071-1079
7. Chopra A. K. (1973) Earthquake resistance of buildings with a soft first storey.
Earthquake and Structural Dynamics. 1. 347-355
8. Chug, R. (2004) Studies on RC Beams. Columns and Joints for Earthquake Resistant
Design. M. Tech Project Report. Indian Institute of Technology Madras, Chennai.
India
81
9. Crisafulli F. J. (1999) Seismic Behaviour of reinforced concrete structures with
masonry infills. Ph.D. Thesis. University of Canterbury. New Zealand.
10. Das, S. (2000) Seismic design of vertically irregular reinforced concrete structures.
Ph.D. Thesis. North Carolina State University. Raleigh. NC
11. Das, S. and J. M. Nau (2003) Seismic design aspects of vertically irregular
reinforced concrete buildings. Earthquake Spectra. 19. 455-477
12. Deodhar, S. V. and A. N. Patel (1998) Ultimate strength of masonry infilled steel
frames under horizontal load. Journal of Structural Engineering. Structural
Engineering Research Centre. 24. 237-241
13. Dhansekar, M. and A.W. Page (1986) the influence of brick masonry infill
properties on the behaviour of infilled frames. Proceedings of Institution of Civil
Engineers. Part 2. 81. 593-605
14. Dolsek M and P. Fajfar (2001) Soft storey effects in uniformly infilled reinforced
concrete frames. Journal of Earthquake Engineering. 5(1). 1-12
15. Dolsek M and P. Fajfar (2000) On the seismic behaviour and mathematical
modelling of RC framed structures. 12th World Conference on Earthquake
Engineering. Auckland. New Zealand. 296-305
16. Fardis, M.N. and T. B. Panagiotakos (1997) Seismic design and response of bare
and masonry-infilled concrete buildings. Part II: Infilled structures. Journal of
Earthquake Engineering. 1. 475-503
17. Govindan, P. and D. Vivekanandan(1990 Effect of Opening in Brick Infilled Square
Panel, Indian Concrete Journal. 64. 298-303
18. Hashmi, A. K. and A. Madan (2008) Damage forecast for masonry infilled
82
reinforced concrete framed buildings subjected to earthquakes in India, Current
Science. 94. 61-73
19. Holmes, M. (1961) Steel frames with brick and concrete infilling. Proceedings of
Institution of Civil Engineers. 19. 473-478
20. IS 1893 Part 1 (2002) Indian Standard Criteria for Earthquake Resistant Design of
Structures, Bureau of Indian Standards, New Delhi.
21. Jagadish, R.; H. Achyutha and P. S. Rao (1987) Behaviour of infilled frames with
stiffened openings- an experimental study. Proceedings of International Conference
on Modern Techniques in Construction. Singapore
22. Kanitkar, R. and V. Kanitkar (2004) Seismic performance of conventional multi-
storey buildings with open ground storey floors for vehicular parking. The Indian
Concrete Journal. 78. 99-104
23. Karisiddappa, (1986) Effect of position of openings on the behaviour of infilled
frames. M.Tech Thesis. Indian Institute of Technology Madras, Chennai.
24. Kaushik, H. B. (2006) Evaluation of strengthening options for masonry- infilled RC
frames with open first storey. Ph.D. Thesis. Indian Institute of Technology Kanpur,
25. Liauw, T. C. and K. H. Kwan (1983) Plastic theory of non-integral infilled frames.
Proceedings of Institution of Civil Engineers. Part 2. 379-396
26. Madan, A., A. M. Reinhorn, J. B. Mander and R. Valles (1997) Modelling of masonry
infill panels for structural analysis. Journal of Structural Engineering. 123. 1295–1302
27. Mainstone, R. J. (1971) On the stiffness and strength of infilled frames. Proceedings
of Institution of Civil Engineers. Supplementary. 57-90
28. Mallick D.V. and Severn R.T., (1967), “The Behaviour of Infilled Frames under
Static Loading”, The Institution of Civil Engineers, Proceedings. 39. 639-656.
83
29. Mehrabi, A. B. and P. B. Shing (1997) Finite element modelling of masonry infilled
RC frames. ASCE Journal of Structural Engineering. 123. 604-613
30. Mehrabi, A. B.; P. B. Shing; M. P. Schuller and J. L. Noland (1996) Experimental
evaluation of masonry – infilled RC frames. ASCE Journal of Structural Engineering.
122. 228-237
31. Murty, C. V. R. (2002) Performance of reinforced concrete frame buildings during
2001 Bhuj earthquake. Proceedings of the 7th US National Conference on Earthquake
Engineering. Boston. USA. Paper no. 745
32. Murty, C. V. R. and S. K. Jain (2000) Beneficial influence of masonry infill walls
on seismic performance of RC frame buildings. Proceedings of the 12th World
Conference on Earthquake Engineering. Paper no. 1790
33. Panagiotakos, T. B. and Fardis, M. N. (2001) Deformation of reinforced concrete
members at yielding and ultimate. ACI Structural Journal. 98. 135-148
34. P. R. Davis (2009) Earthquake Resistant Design of Open Ground Storey RC Framed
Buildings. Ph.D. Thesis, Indian Institute of Technology Madras, Chennai.
35. Rahman, S. S. (1988) Influence of openings on the behaviour of infilled frames. Ph.
D. Thesis. Indian Institute of Technology Madras. Chennai.
36. Ramesh, P. (2003) Retrofitting of masonry infill walls to resist earthquake loads.
M.Tech Thesis. Indian Institute of Technology Madras. Chennai.
37. Rao, S. P.; H. Achyutha and R. Jagdish (1982) Infilled frames with opening
strengthened by lintel beam. Proceedings of the 6th International Brick Masonry
Conference. Rome
38. Riddington, J. R. and S. B. Smith (1977) Analysis of infilled frames subject to
84
racking with design recommendations. The Structural Engineer. 55. 263-268
39. Saneinejad, A. and B. Hobbs (1995) Inelastic design of infilled frames. ASCE
Journal of Structural Engineering. 121. 634-650
40. SAP 2000 (Version 11.0). (2007) Integrated Software for Structural Analysis and
Design. Computers & Structures, Inc., Berkeley, California.
41. Sarkar, P. Seismic evaluation of reinforced concrete stepped building frames. Ph. D.
Thesis. Indian Institute of Technology Madras. Chennai. 2008.
42. Sattar, S and Abbie B. L. (2010) Seismic Performance of Reinforced Concrete
Frame Structures with and without Masonry Infill Walls, 9th U.S. National and 10th
Canadian Conference on Earthquake Engineering, Toronto, Canada, July.
43. Scarlet, A. (1997) Design of Soft Stories – A simplified energy approach.
Earthquake Spectra. 13. 305-315
44. Selvakoodalingam, B.; E. B. Perumal Pillai and P. Govindan (1999) Strengthening
of RC Infilled frame with opening. Concrete International. 21(11). 37-42
45. Smith, S. B. (1962) Lateral Stiffness of Infilled Frames. ASCE Journal of the
Structural Division. 88. 183-199
46. Smith, S. B. (1966) Behaviour of Square Infilled frames. ASCE Journal of the
Structural Division. 92. 381-403
47. S. B. Smith and C. Carter, (1969) A Method of Analysis for Infilled Frames.
Proceedings of Institution of Civil Engineers. 44. 31-48
48. Subramanian, N. (2004) Discussion on seismic performance of conventional multi-
storey building with open ground floors for vehicular parking by Kanitkar and
Kanitkar. The Indian Concrete Journal. 78. 11-13