Embed Size (px)
Citation preview

Experimental Properties Evaluation of Fiber Reinforced
Concrete related to Canal-lining
By
Asad Zia
(MCE153015)
MASTER OF SCIENCE IN CIVIL ENGINEERING
(With Specialization in Structures)
DEPARTMENT OF CIVIL ENGINEERING
CAPITAL UNIVERSITY OF SCIENCE & TECHNOLOGY
ISLAMABAD, PAKISTAN
AUGUST 2017

ii
Experimental Properties Evaluation of Fiber Reinforced
Concrete related to Canal-lining
By
Asad Zia
(MCE153015)
A research thesis submitted to the Department of Civil Engineering,
Capital University of Science & Technology, Islamabad, Pakistan
in partial fulfillment of the requirements for the degree of
MASTER OF SCIENCE IN CIVIL ENGINEERING
(With Specialization in Structures)
DEPARTMENT OF CIVIL ENGINEERING
CAPITAL UNIVERSITY OF SCIENCE & TECHNOLOGY
ISLAMABAD, PAKISTAN
AUGUST 2017

iii
CERTIFICATE OF APPROVAL
Experimental Properties Evaluation of Fiber Reinforced Concrete
related to Canal-lining
by
Asad Zia
MCE153015
THESIS EXAMINING COMMITTEE
S No Examiner Name Organization
(a) External Examiner Engr. Dr. Prof. Ayub Elahi UET, Taxila
(b) Internal Examiner Engr. Dr. Munir Ahmad CUST, Islamabad
(c) Supervisor Engr. Dr. Majid Ali CUST, Islamabad
________________________________
Engr. Dr. Majid Ali
Thesis Supervisor
August, 2017
______________________________
Engr. Dr. Ishtiaq Hassan
Head of Department
Department of Civil Engineering
Dated: August, 2017
___________________________
Engr. Dr. Prof. Imtiaz Ahmad Taj
Dean
Faculty of Engineering
Dated: August, 2017
CAPITAL UNIVERSITY OF SCIENCE & TECHNOLOGY
ISLAMABAD Islamabad Expressway, Kahuta Road, Zone-V, Islamabad
Phone: +92 51 111 555 666, Fax: 92 51 4486705 Email: [email protected], Website: http”//www.cust.edu.pk

iv
Copyright © 2017 by Asad Zia
All rights reserved. No portion of the material protected by this copyright notice may be
replicated or utilized in any arrangement or by any means, electronic or mechanical
including photocopy, recording or by any information storage and retrieval system without
authorization from the author.

v
CERTIFICATE
This is to verify that Mr. Asad Zia has integrated all comments, suggestions and
observations made by the external evaluators as well as the internal evaluators and thesis
supervisor. His thesis title is: Experimental Properties Evaluation of Fiber Reinforced
Concrete related to Canal-lining.
Forwarded for necessary action
__________________
Engr. Dr. Majid Ali
(Thesis Supervisor)

vi
DEDICATION
This effort is devoted to my respected and cherishing parents, who helped me through each
troublesome of my life and yielded every one of the comforts of their lives for my brilliant
future. This is likewise a tribute to my best teachers who guided me to go up against the
troubles of presence with ingenuity and boldness, and who made me what I am today.
Mr. Asad Zia
MCE153015

vii
DECLARATION
This thesis is a presentation of my unique research work. Wherever commitments of others
are included, each exertion is made to demonstrate this obviously, with due reference to
the writing, and affirmation of communitarian research and exchanges. The work is carried
out under the supervision of Associate Professor Engr. Dr. Majid Ali, at the Capital
University of Science and Technology, Islamabad, Pakistan.
Mr. Asad Zia
MCE153015
Date: August, 2017

viii
ACKNOWLEDGEMENTS
➢ Wealthiest thanks to Almighty Allah for a tremendous measure of vitality, power
and the miraculous pushes occurring in a sweetly coordinated manner, only a few
to mention, which drive our lives.
➢ I need to express my sincere thanks to Associate Professor Engr. Dr. Majid Ali
under whose direction the research was led. His direction was precious at each
progression of this work. His outstanding showing aptitudes helped me get a handle
on the topic rapidly. His collaboration at every single phase of my basic choices at
capital university has been significant.
➢ I thankfully recognize the affection and financial support received from my parents
for MS studies.
➢ I would thank all my colleagues especially Engr. Faheem Ahmad Gul for his
sincere help. Last but not the least, I would mention my family and friends whose
prayers have enabled me to complete this task.

ix
TABLE OF CONTENTS
CERTIFICATE ...............................................................................................................v
DEDICATION .............................................................................................................. vi
DECLARATION .......................................................................................................... vii
ACKNOWLEDGEMENTS ......................................................................................... viii
TABLE OF CONTENTS ............................................................................................... ix
LIST OF TABLES....................................................................................................... xiii
LIST OF FIGURES ......................................................................................................xiv
LIST OF ABBREVIATIONS .......................................................................................xvi
ABSTRACT .............................................................................................................. xviii
LIST OF INTENDED PUBLICATIONS ....................................................................... xx
Intended journal article .................................................................................................. xx
CHAPTER 1 INTRODUCTION .....................................................................................1
1.1 Prelude ...................................................................................................................1
1.2 Research motivation and problem statement ...........................................................2
1.3 Overall / specific research aims and scope of work .................................................3
1.4 Investigation methodology .....................................................................................3
1.5 Thesis outline .........................................................................................................4
CHAPTER 2 LITERATURE REVIEW ..........................................................................6
2.1 Background ............................................................................................................6
2.2 Water losses in canal-lining and its sources ............................................................6
2.3 Effectiveness of fiber incorporation in concrete for its properties improvement ......8
2.4 Fiber reinforced concrete in canal-lining .............................................................. 14
2.5 Summary .............................................................................................................. 14

x
CHAPTER 3 TEST METHODOLOGIES ...................................................................... 16
3.1 Background .......................................................................................................... 16
3.2 Raw materials....................................................................................................... 16
3.3 Mix design and casting procedures ....................................................................... 16
3.4 Specimens ............................................................................................................ 17
3.5 Testing procedures ............................................................................................... 18
3.5.1 Slump test and density test ............................................................................ 18
3.5.2 Compressive strength test.............................................................................. 18
3.5.3 Splitting-tensile strength test ......................................................................... 18
3.5.4 Flexural strength test ..................................................................................... 19
3.5.5 Water absorption test .................................................................................... 19
3.5.6 Linear shrinkage test ..................................................................................... 19
3.6 Summary .............................................................................................................. 19
CHAPTER 4 TEST RESULTS AND ANALYSIS......................................................... 20
4.1 Background .......................................................................................................... 20
4.2 Material properties of PC and FRCs ..................................................................... 20
4.2.1 Slump and density ......................................................................................... 20
4.2.2 Compressive properties ................................................................................. 21
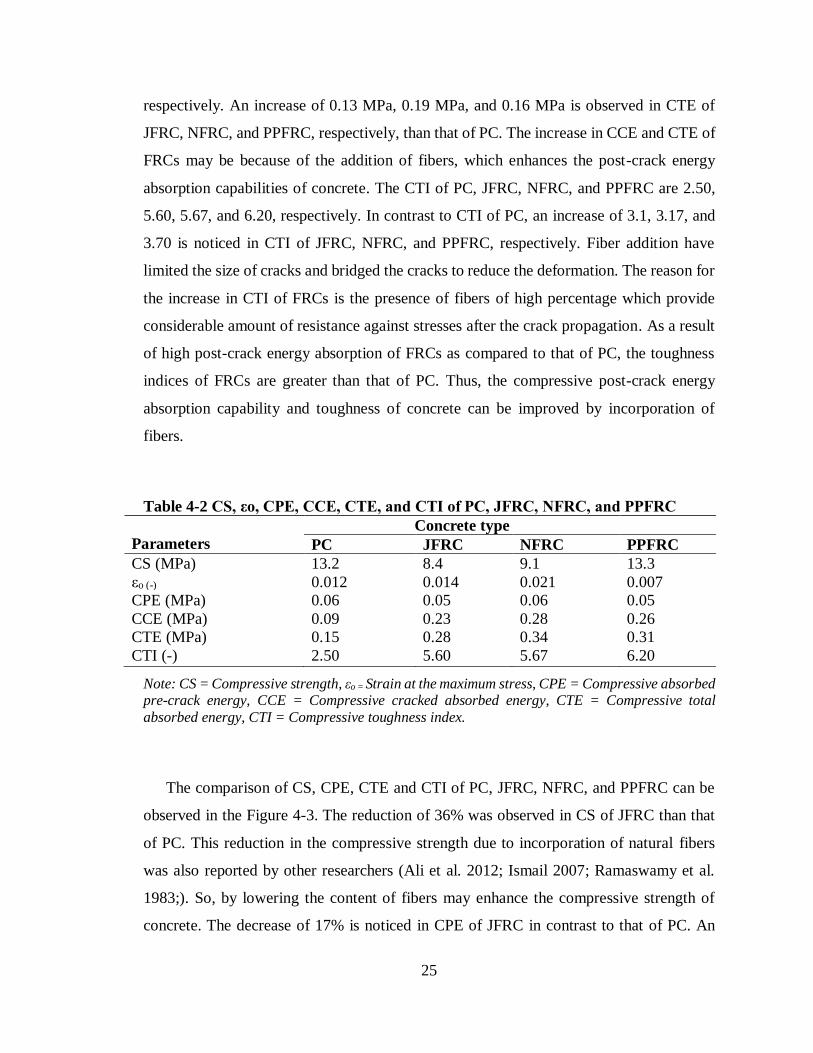
4.2.2.1 Compressive behavior ............................................................................. 21
4.2.2.2 Compressive strength, compressive pre-crack/post-crack absorbed
energies, and compressive toughness index ............................................. 23
4.2.3 Splitting-tensile properties ............................................................................ 27
4.2.3.1 Splitting-tensile behavior......................................................................... 27
4.2.3.2 Splitting-tensile strength, splitting-tensile pre-crack/post-crack
xi
absorbed energies, and splitting-tensile toughness index ........................ 29
4.2.4 Flexural properties ........................................................................................ 32
4.2.4.1 Flexural behavior .................................................................................... 32
4.2.4.2 Flexure strength, flexural pre-crack/post-crack absorbed energies, and
flexural toughness index .......................................................................... 34
4.2.5 Water absorption ........................................................................................... 36
4.2.6 Linear shrinkage ........................................................................................... 38
4.3 Summary .............................................................................................................. 39
CHAPTER 5 DISCUSSIONS ........................................................................................ 41
5.1 Background .......................................................................................................... 41
5.2 Empirical equations .............................................................................................. 41
5.2.1 Empirical relation between water absorption and selected strength
properties ...................................................................................................... 41
5.2.2 Empirical relation between linear shrinkage and selected strength
properties ...................................................................................................... 43
5.3 Relationship between material properties and canal-lining performance ............... 45
5.4 Summary .............................................................................................................. 46
CHAPTER 6 CONCLUSIONS AND RECCOMENDATIONS .................................... 47
6.1 Conclusions .......................................................................................................... 47
6.2 Recommendations ................................................................................................ 48
REFERENCES .............................................................................................................. 50
ANNEXURES ............................................................................................................... 59
Annexure A Compressive stress-strain curves and tested samples of PC, JFRC,
NFRC, and PPFRC (i.e. remaining specimens) ..................................... 59
xii
Annexure B Splitting-tensile load-time curves and tested samples of PC, JFRC,
NFRC, and PPFRC (i.e. remaining specimens) ...................................... 60
Annexure C Flexural load-deflection curves and tested samples of PC, JFRC, NFRC,
and PPFRC (i.e. remaining specimens) ................................................... 61

xiii
LIST OF TABLES
Table 2-1 Strength properties of jute, nylon, polypropylene, glass, and steel fibers
Table 4-1 W/C ratio, slump, and density of PC, JFRC, NFRC, and PPFRC ............ 21
Table 4-2 CS, εo, CPE, CCE, CTE, and CTI of PC, JFRC, NFRC, and PPFRC ...... 25
Table 4-3 SS, SPE, SCE, STE, and STI of PC, JFRC, NFRC, and PPFRC .............. 31
Table 4-4 MoR, ∆o, FPE, FTE, and FTI of PC, JFRC, NFRC, and PPFRC ............. 35
Table 4-5 WA of PC, JFRC, NFRC, and PPFRC .................................................... 37
Table 4-6 LS of PC, JFRC, NFRC, and PPFRC ...................................................... 38
(James et al. 2002) ............................................................................... 8
Table 2-2 Advantages of jute, nylon, polypropylene, glass, and steel fibers .............. 9
Table 2-3 CS, SS, and MoR of PC, JFRC, NFRC, and PPFRC by Previous
Studies .................................................................................................. 13
Table 5-1 Experimental and theoretical values of WA of PC, JFRC, NFRC, and
PPFRC .................................................................................................. 42
Table 5-2 Experimental and theoretical values of LS of PC, JFRC, NFRC, and
PPFRC .................................................................................................. 44
xiv
LIST OF FIGURES
Figure 4-1 Stress-strain curves of PC, JFRC, NFRC, and PPFRC for
compressive strength tests ................................................................... 22
Figure 4-2 Development of cracks in the cylindrical specimens of PC, JFRC,
NFRC, and PPFRC under compressive load ........................................ 23
Figure 4-3 Comparison of compressive strengths, compressive pre-crack
absorbed energies, compressive total absorbed energies, and
compressive toughness indices of PC, JFRC, NFRC, and PPFRC ....... 26
Figure 4-4 Load-time histories of PC, JFRC, NFRC, and PPFRC from the
tests of SS ........................................................................................... 28
Figure 4-5 Development of cracks in the cylindrical specimens of PC, JFRC,
NFRC, ................................................................................................ 28
Figure 4-6 Comparison of the splitting-tensile strengths, splitting-tensile pre-
crack absorbed energies, splitting-tensile total absorbed energies,
and splitting-tensile toughness indices of PC, JFRC, NFRC, and
PPFRC. ............................................................................................... 31
Figure 4-7 Load-deflection curves of PC, JFRC, NFRC, and PPFRC from
flexure strength tests ........................................................................... 33
Figure 4-8 Development of cracks in the beam-lets of PC, JFRC, NFRC, and
PPFRC under flexure load................................................................... 33
Figure 4-9 Comparison of the Flexure strengths, Flexural pre-crack absorbed
energies, Flexural total absorbed energies, and Flexural toughness
indices of PC, JFRC, NFRC, and PPFRC. ........................................... 36
Figure 4-10 Comparison of WA of PC, JFRC, NFRC, and PPFRC ......................... 37
Figure 4-11 Comparison of LS (% decrease) of PC, JFRC, NFRC, and PPFRC ...... 39
Figure 2-1 Observed cracks in concrete canal-lining of Ismaila distributary ............ 8
Figure 5-1 Comparison of values of WA of PC, JFRC, NFRC, and PPFRC
xv
obtained from experimental tests, Eq 1, Eq 2, Eq 3, and Eq 4 ............... 42
Figure 5-2 Comparison of values of LS of PC, JFRC, NFRC, and PPFRC
obtained from experimental tests, Eq 5, Eq 6, Eq 7, and Eq 8 ............... 41
Figure B1 Development of cracks in the cylindrical specimens of PC, JFRC,
NFRC, and PPFRC under splitting-tensile load ..................................... 60
Figure B2 Load-time histories of PC, JFRC, NFRC, and PPFRC from the tests
of SS ..................................................................................................... 60
Figure A1 Development of cracks in the cylindrical specimens of PC, JFRC,
NFRC, and PPFRC under compressive load ...........................................59
Figure A2 Stress-strain curves of PC, JFRC, NFRC, and PPFRC for
compressive strength tests ......................................................................59
Figure C1 Development of cracks in the beam-lets of PC, JFRC, NFRC, and
PPFRC flexure load ............................................................................... 61
Figure C2 Load-deflection curves of PC, JFRC, NFRC, and PPFRC from flexure
strength tests.......................................................................................... 61

xvi
LIST OF ABBREVIATIONS
A = Aggregate
C = Cement
CCE = Compressive cracked absorbed energy (MPa)
CPE = Compressive pre-crack absorbed energy (MPa)
CS = Compressive strength (MPa)
CTE = Compressive total absorbed energy (MPa)
CTI = Compressive toughness index (-)
FS = Flexure strength (MPa)
FCE = Flexural post-crack absorbed energy (kN.mm)
FPE = Flexural pre-crack absorbed energy (kN.mm)
FRC = Fiber reinforced concrete
FRCs = Fiber reinforced concretes
FTI = Flexural toughness index (-)
FTE = Total flexural absorbed energy (kN.mm)
JF = Jute fibers
JFRC = Jute fiber reinforced concrete
kN = kilo-Newton
LS = Linear shrinkage (mm)
mm = millimetre
MoR = Modulus of rupture (MPa)
MPa = Mega Pascal

xvii
NF = Nylon fibers
NFRC = Nylon fiber reinforced concrete
PC = Plain concrete
PPF = Polypropylene fibers
PPFRC = Polypropylene fiber reinforced concrete
S = Sand
SCE = Splitting-tensile post-crack absorbed energy (kN.s)
s = second
SPE = Splitting-tensile pre-crack absorbed energy (kN.s)
SS = Splitting-tensile strength (MPa)
STE = Splitting-tensile total absorbed energy (kN.s)
STI = Splitting-tensile toughness index (-)
WA = Water absorption (%)
W/C = Water-cement
∆ = Deflection (mm)
∆o = Deflection at maximum load (mm)
εo = Strain at the maximum stress (-)

xviii
ABSTRACT
Seepage is a major water loss from the canal as compared to the other forms of water
losses. So, it becomes important to reduce this seepage loss to increase the conveyance
efficiency. Concrete is commonly used for canal-lining to reduce seepage loss since
concrete materials are usually available in the vicinities of the local farmers. Considerable
seepage (15%-20%) has been observed even in the cement–concrete conventional sections.
Concrete lining structure is identical to thin plate in which cracking occurrence is frequent.
The performance of canals decreases with an increase in the rate of cracking in concrete
canal-lining. The rate of cracking in canal-lining can be reduced by improving the flexure,
compressive, and splitting-tensile strengths of concrete. Out of these, splitting-tensile
strength of concrete plays a vital role in controlling cracks. The use of fibers for
characteristics improvement of concrete is very ancient. Natural fibers include many
benefits, like low cost due to its abundance, least health hazards, and flexibility. The use
of synthetic fibers as reinforcement in matrix has also attained intentness by reasons of its
high strength, less water absorption, and low density in nature.
The overall aim of the research program is to explore materials for better performance
of canal-lining in terms of reduced water losses by controlling its rate of cracking due to
alternate wetting and drying, and due to differential settlement, etc. The purpose of this
work is to examine experimental behaviors of jute fiber reinforced concrete (JFRC), nylon
fiber reinforced concrete (NFRC), and polypropylene fiber reinforced concrete (PPFRC)
for controlling the rate of cracking in canal-lining. For this purpose, the mechanical
properties, water absorption, and linear shrinkage of JFRC, NFRC, and PPFRC are
determined experimentally as per ASTM standards. The properties of plain concrete (PC)
are used as reference. The proportion of 1:3:1.5:0.7 (cement: sand: aggregate: water) is
used for PC mix. The mixes of JFRC, NFRC, and PPFRC are manufactured by adding the
JF, NF, and PPF, respectively, in the same mix design as that of PC. For production of each
type of fiber reinforced composite (FRC), respective fibers having length of 50 mm are
added in concrete by an amount of 5% (by mass of cement).
The specimens of both PC and FRCs were tested in the fresh and solid state. The FRCs
were less workable when contrasted with PC for the same W/C ratio. Thus, the slumps of

xix
JFRC, NFRC, and PPFRC were reduced by 61%, 36%, and 39%, respectively, than that of
PC. As compared to compressive strength (CS) of PC, the CS of JFRC and NFRC
decreased by 36% and 31%, respectively, and that of PPFRC improved by 1%. As
compared to splitting-tensile strength (SS) of PC, the SS of JFRC and NFRC showed a
decrease of 19% and 10%, respectively, and an improvement of 5% is observed in SS of
PPFRC. An improvement of 8%, 10%, and 34% is observed in modulus of rupture of JFRC,
NFRC, and PPFRC, respectively, as compared to that of PC. An increase of 87%, 127%,
and 107% is observed in compressive total absorbed energy of JFRC, NFRC, and PPFRC,
respectively, than that of PC. As compared to splitting-tensile total absorbed energy (STE)
of PC, a decrease of 37% and 21% is observed in STE of JFRC and NFRC, respectively,
and an increase of 11% is observed in the STE of PPFRC. And an increase of 53%, 68%,
and 100%, in flexural total absorbed energy of JFRC, NFRC, and PPFRC, respectively, in
comparison to that of PC. The enhancement of 124%, 127%, and 148% is observed in
compressive toughness index of JFRC, NFRC, and PPFRC, respectively, than that of PC.
An enhancement of 2%, 2%, and 3% is observed in splitting-tensile toughness index of
JFRC, NFRC, and PPFRC, respectively, than that of PC. And by comparing to that of PC,
an enhancement of 86%, 91%, and 94% is noticed in flexural toughness index of JFRC,
NFRC, and PPFRC, respectively. As compared to PC, an increase of 8% and 1% is
observed in water absorption (WA) of JFRC and NFRC, respectively, and a decrease of
4% is observed in the WA of PPFRC. Linear shrinkage ‘LS’ (% decrease) of JFRC and
NFRC is 67% and 30%, respectively, more than that of PC. While LS (% decrease) of
PPFRC is 15% less than that of PC. Empirical relations have been developed with the help
of experimental data for prediction of WA and LS. The relationship between WA/LS and
each of the CS, SS, SPE, and FPE are made because of their observed mutual coherence in
experimental outcomes. There is a good agreement between the experimental and empirical
values. The percentage error is 0.4%-20%. Among the tested FRCs, PPFRC showed the
better performance. This may ensure to control the rate of cracking in canal-lining,
ultimately improving its performance.

xx
LIST OF INTENDED PUBLICATIONS
Intended journal article
• Zia A. and Ali M. (2017). Behavior of fiber reinforced concrete for controlling the rate
of cracking in canal-lining. Construction and Building Materials (ISI Impact Factor =
2.421), (Under Review).
Intended referred conference article
• Zia A. and Ali M. (2017). Effectiveness of polypropylene fiber reinforced concrete in
enhancement of long-term durability of hydraulic structures. 2nd International
Conference on Frontiers of Composite Materials (ICFCM2017), Melbourne, Australia,
15-17 November, 2017, (Paper Accepted).

1
CHAPTER 1
INTRODUCTION
1.1 Prelude
Seepage loss (20%-30%) is a major reason of water loss from the canal as compared
to the other forms of water losses (USBR 1978; Badenhorst et al. 2002). So, it becomes
important to reduce this seepage loss for increasing the conveyance efficiency. Concrete
is commonly used for canal-lining to reduce seepage loss, since concrete materials are
usually available in the vicinities of the local farmers (Kasali and Ogunlela 2014).
Concrete lining structure is identical to thin plate in which cracking occurrence is frequent
(Kratz 1980). Kahlown and Kemper (2005) and USBR (1978) also reported occurrence of
considerable seepage loss (15%-20%) even in the cement–concrete conventional sections.
The better performance of concrete lining can help in reducing this water loss. The reasons
accountable for those cracks comprise thermal stress (temperature variation), external
load, differential settlement of the foundation, etc. (Bofang 1999; Cui et al. 2013). The
properties which can enhance the performance of canal-lining are compressive, tensile,
and flexure strengths of concrete. Out of these, tensile strength of concrete played a vital
role in controlling cracks (Montañes 2006). Many engineering/mechanical properties (like
flexural strength, tensile strength, fatigue resistant strength, abrasion and thermal impact)
of composites (cement paste, mortar and/or concrete) can be efficiently improved by
introducing fibers in composites (Mansur and Aziz 1982; Ali et al. 2016; Thakur et al.
2014; Ramakrishna and Sundararajan 2005). Fibers in concrete act as “crack arrester”
(James et al. 2002; Kene et al. 2012). Al-Oraimi and Seibi (1995) verified that the
enhancement in mechanical properties and impact resistance of concrete could be brought
by use of even a low proportion of natural fibers. Artificial fiber reinforced concrete
reduced the rate of cracking in canal-lining by enhancing its mechanical properties (Fang
et al. (2011). It had been investigated that the addition of jute fibers in cement composites
had substantially increased the tensile and flexural strengths and toughness (Liu et al.
2013). Cook et al. (1984) reported that nylon fibers exhibited good tenacity, toughness,

2
and excellent elastic recovery. It also performed well under accelerated aging conditions
(Khajuria et al. 1991). Fang et al. (2011) reported that the incorporation of polypropylene
fibers in concrete significantly increased its splitting-tensile and direct tensile strengths
along with an improvement in its frost resistance and impermeability. The overall aim of
the research program is to explore materials for better performance of canal-lining in terms
of reduced water losses by controlling its rate of cracking due to alternate wetting and
drying and due to differential settlement, etc. In this research work, an investigation has
been carried out to select the most suitable material out of plain cement concrete (PC), jute
fiber reinforced concrete (JFRC), nylon fiber reinforced composite (NFRC), and
polypropylene fiber reinforced concrete (PPFRC) for application of canal-lining.
1.2 Research motivation and problem statement
There is no life without water. Water should be conveyed at desired locations through
canals without losses. Canal-lining is widely used as a water saving measure. However,
cracking in concrete canal-lining is also observed. The initial micro crack in canal-lining
converts to macro cracks with the passage of time, which accelerates the loss of water by
allowing the seepage of water through the lining. The rate of cracking in concrete canal-
lining can be reduced by improving the tensile strength of concrete (Montañes 2006). The
concept of using fibers to improve the characteristics of concrete is very old. Natural fibers
include many benefits, like low cost due to its abundance, biodegradability, and least
health hazards. The use of synthetic fibers as reinforcement in matrix has also attained
intentness by reasons of its high strength, less water absorption and low density in nature.
Improved performance of canal-lining can be insured by controlling its rate of cracking.
The loss of water cannot be reduced unless the crack formation is controlled and
minimized. The reduction in rate of cracking can be based on mechanical performance
criteria associated with enhanced post cracking behavior of fiber reinforced concrete.
Thus, the problem statement is as follows:
“Canal-lining is widely used as a water saving measure. Cracking in canal-
lining reduced its efficiency up to 70% (Swihart and Haynes 2002). One of major
reasons for the increase in the rate of cracking in concrete canal-lining is thermal

3
stress (Cui et al. 2013). Due to this, the performance of canals is decreased with
an increase in water losses. Improving mechanical properties of concrete and
controlling its linear shrinkage can limit cracking in canal-lining (Fang et al.
2011). So, to attain the high-performance concrete for canal-lining application, the
fibers can be utilized in concrete. There is only one study regarding polypropylene
fiber reinforced concrete for canal-lining application. The performance of other
fibers in concrete for canal-lining application still need to be explored in detail.”
1.3 Overall / specific research aims and scope of work
The overall aim of the research program is to explore materials for the better
performance of canal-lining in terms of reduced water losses by controlling its rate of
cracking due to alternate wetting and drying and due to differential settlement, etc.
The specific aim of this MS work is to examine the experimental behaviors of
plain concrete, jute fiber reinforced concrete, nylon fiber reinforced concrete, and
polypropylene fiber reinforced concrete for controlling the rate of cracking in
canal-lining.
This particular objective is accomplished by the following tasks (defining the
scope of present research work):
i. To compute experimentally the mechanical properties (i.e. compressive,
splitting-tensile, and flexural strengths), water absorption, and linear
shrinkage of plain concrete, jute fiber reinforced concrete, nylon fiber
reinforced concrete, and polypropylene fiber reinforced concrete. For
this purpose, a total of 32 specimens i.e. 16 cylinders and 16 beam-lets
were produced. 16 samples mean 4 with PC and 4 with each type of
FRCs.
ii. To develop empirical relations
iii. Based on conducted investigation, to recommend suitable FRC for
controlling the rate of cracking in canal-lining.

4
1.4 Investigation methodology
In this experimental study, the mechanical properties of plain concrete (PC), jute fiber
reinforced concrete (JFRC), nylon fiber reinforced concrete (NFRC), and polypropylene
fiber reinforced concrete (PPFRC) are determined in laboratory. The mix design ratio for
PC is 1:3:1.5:0.7 (cement: sand: aggregate: water). The fibers of jute, nylon, and
polypropylene are added in concrete mixer for the production of JFRC, NFRC, and
PPFRC, respectively. For production of each type of FRC, fibers having length of 50 mm
and 5% contents, by mass of cement, are added in concrete. The workability of mixes of
PC and FRCs is computed in fresh state by using the standard procedure of slump cone
test. Standard specimens are cast and tested for determining the compressive, splitting-
tensile, and flexural strengths, water absorption, and linear shrinkage of PC and considered
FRCs in the hardened state. Servo-hydraulic testing machine is used for the strength testing
of all specimens in order to get their pre-crack and post-crack behaviors.
1.5 Thesis outline
The thesis contains six chapters. These are:
Chapter 1 includes of introduction. It explains the sources of water losses in canal-lining,
research motivation and problem statement, overall or specific research aims and scope of
work, investigation methodology, and thesis outline.
Chapter 2 contains the literature review. It comprises of background, water losses in canal-
lining and its sources, effectiveness of fiber incorporation in concrete for its properties
improvement, fiber reinforced concrete in canal-lining, and summary of chapter 2.
Chapter 3 incorporates the test methodology. It covers the background, raw materials, the
techniques of PC and FRCs mixing and casting, specimen details, testing methodologies,
and summary of chapter 3.
Chapter 4 encompasses the results obtained from tests and their analysis. It describes the
background, material-properties of the mixes (i.e. PC, JFRC, NFRC, and PPFRC),
mechanical properties (CS, SS, and FS), LS, WA, and behavior of the specimens during
the testing, and summary of chapter 4.

5
Chapter 5 encompasses of discussion. It consists of background, empirical equations
between the water absorption or linear shrinkage and selected strength properties, role of
mechanical properties of concrete in controlling the rate of cracking in concrete canal-
lining, and summary of chapter 5.
Chapter 6 comprises of conclusions and recommendations.
Consecutive to the end of chapter 6, all the references are given.
Annexure A explains the details of compressive load-time curves and behavior of other
tested specimens during the compressive strength test.
Annexure B explains the details of splitting-tensile load-time curves and behavior of other
tested specimens during the splitting-tensile strength test.
Annexure C explains the details of flexural load-time curves and behavior of other tested
specimens during the testing of the flexural strength test.

6
CHAPTER 2
LITERATURE REVIEW
2.1 Background
There are many forms of water losses in canals. In comparison to other forms of water
loss, seepage is a major water loss. Considerable seepage has also been observed in the
concrete, which is commonly used for canal-lining to reduce the seepage loss. The
performance of canals decreases with an increase in the rate of cracking in concrete canal-
lining. The rate of cracking in concrete canal-lining can be decreased by enhancing the
compressive, splitting-tensile, and flexure strengths of concrete. These properties can be
improved by incorporation of fibers in concrete. In this chapter, the effectiveness of fiber
incorporation in concrete and application of FRCs for canal-lining is discussed in detail.
2.2 Water losses in canal-lining and its sources
The movement of water in downward direction into soil or substratum from a source
of supply like reservoir or irrigation channel is known as seepage (Michael 1978). When
the water achieves the field, it had been evaluated that the losses due to seepage were equal
to 45% of the total quantity of water provided at the head of the channel (Sharma and
Chawla 1975). Seepage (20%-30%) is a major water loss from the canal as compared to
the other forms of water losses (USBR 1978; Badenhorst et al. 2002). Luthra (1980)
investigated the type and quantity of losses in canals. It was reported that, for unlined
canals, the conveyance losses varied from 25% to 60%. Krishnamurthy and Rao (1969)
studied the canal losses in gangal canal as pioneer and the seepage losses of 2.2 m3/day/m
was reported. Raja et al. (1983) evaluated the losses due to seepage from an unlined
channel by using the nuclear technique and detailed that the losses due to seepage fluctuate
from 1.3 to 4.3 m3/1106 m2 of the wetted surface area. For lined canal systems, depending
on the lining material, the loss due to seepage was limited. Kraatz (1975) found that an
average of 17.5% loss of flow occurred as seepage per km of irrigation canals in western
Greece. So, it becomes important to reduce this seepage loss for increasing the conveyance

7
efficiency. Karad et al. (2013) reported that, if lining is provided in minors, the seepage
losses could be reduced by nearly 39%. Arshad et al. (2009) carried out an investigation
to evaluate the differences in water losses through the lined and unlined watercourses in
the specific territory of Indus Basin of Pakistan. Hydrogeologic characteristics of soil were
considered same for all of these watercourses. Comparing the average water loss of 44%
from lined and the average water loss of 66% from unlined watercourses, it was reported
that the water loss decreased by 23% due to lining. Different types of materials had been
applied by Irrigation Research Institute (1992) for the reduction of losses due to seepage
from the watercourses. For this purpose, 16 watercourses were investigated. The results
showed that water seepage losses from lined watercourses extended from 8 to 20% of
inflow. Concrete is commonly used for canal-lining to reduce the seepage loss, because
concrete materials are usually available in the vicinities of the local farmers (Kasali and
Ogunlela 2014). Concrete lining structure is identical to thin plate in which cracking
occurrence is frequent (Kraatz 1980). Kahlown and Kemper (2005) and USBR (1978) also
reported the occurrence of considerable seepage (15%-20%) even in the cement–concrete
conventional sections. The estimation of canal losses is beneficial in measuring the
performance of the canal-lining. The better performance of concrete lining can help in
reducing the water loss. The reasons accountable for those cracks comprise of thermal
stress (temperature variation), external load, differential settlement of the foundation, etc.
(Bofang 2013). Arshad et al. (2009) reported that the abundance of water leakage through
the waterways was most likely because of cracks, disintegrated mortar, and structural
failure of the lined walls. Cui et al. (2013) conducted an analysis on the causes of cracks
in concrete canal-lining. Factors, responsible for cracks, were classified on the basis of
data collected. Also, the method of 3D contact nonlinear finite element was used for a
sensitivity analysis on these factors. Based on outcomes, it was reported that the factors
responsible for concrete cracks were external loads, temperature difference, irregular
settlement of foundation, expansion deformation of foundation soil, and humidity, etc.
Observed cracks in concrete canal-lining of Ismaila distributary at a reduced distance of
about 5000 feet (Sub-division Shehbaz Garhi, Division Swabi, KPK Department of
Irrigation) are shown in Figure 2-1.

8
Figure 2-1 Observed cracks in concrete canal-lining of Ismaila distributary
2.3 Effectiveness of fiber incorporation in concrete for its properties
improvement
The strength properties along with the rate of water absorption of jute, nylon, and
polypropylene fibers as reported by James et al. (2002) are shown in Table 2-1. It can be
observed that jute, nylon, and polypropylene fibers have high tensile strengths and elastic
moduli and also having low tendency of water absorption. Among the easily and locally
Table 2-1 Strength properties of jute, nylon, polypropylene, glass, and steel fibers
(James et al. 2002)
Fiber type Tensile
strength
ksi
Elastic modulus
ksi
Water absorption per
ASTM D 570,
percent by weight
Jute 36-51 3770- 4640 Not Available
Nylon 140 750 2.8-5.0
Polypropylene 20-100 500-700 Nil
Glass 450 9400 Not Available
Steel* 50-435* 29007* Not Available
* Data from Banthia (2010)
available fibers, the selected fibers possess good strength properties for the application of
canal-lining. The good tensile strength of the selected fibers is likely to be helpful in
controlling the formation of cracks due to the tensile stresses by enhancing the tensile
strength of FRCs. The smaller water absorption of the selected fibers also compelled the
Cracking

9
concentration towards their use for the application of canal-lining as compared to other
available fibers. The available type of glass fiber is not considered for the application of
canal-lining due to the findings that glass (non-resistant to alkaline effects) fibers were
chemically attacked by hydration products, leading to weak glass surface (Banthia 2010).
It was also reported that the loss of fiber strength occurred due to growth of hydration
products around the glass fibers, at an early stage of concrete curing (Bentur and Diamond
1984). The steel fibers are also not considered due to their corrosive nature. Due to the
corrosion, the bond between the concrete and steel fibers is adversely affected.
Table 2-2 Advantages of jute, nylon, polypropylene, glass and steel fibers
Fibers Advantages References
Jute Seven times lighter than steel fibers,
high energy absorption capability, high
breaking strength, cheaply available.
Kundu et al. (2012), and
Ramaswamy et al. (1983)
Nylon Strong, light weight, better resistive to
heat and cold conductance, good
tenacity, toughness, and outstanding
elastic recovery, zero water absorption,
stable, and exceptional capability of
abrasion resistance.
Banthia (2010),
James et al. (2002), and
Cook (1984)
Polypropylene Low specific gravity, more ductility,
zero water absorption capacity, high
elasticity and energy absorption,
outstanding capability to oppose
friction, bond by mechanical interaction
with cement matrix and does not
chemically interact with cement, lowest
thermal conductivity among the
available fibers.
Banthia (2010),
James et al. (2002),
Rice et al. (1987), and
Galanti (1964)
Glass Low density, more ductility, light
weight, energy efficient.
Shakor and Pimlikar (2011)
and James et al. (2002)
Steel Hight density, more ductility, energy
efficient, zero water absorption.
James et al. (2002)

10
Table 2-2 displays the advantages of the jute, nylon, and polypropylene fibers. It can
be seen that, despite good strength properties, the used types of fibers also contain
sufficient benefits reported by different researchers. The better tensile breaking strength,
low density, low cost, and easy availability have made jute fibers distinguished from other
natural fibers. The nylon fibers encompass number of benefits like better resistance to heat
and thermal conductivity, zero water absorption and exceptional capability of abrasion
resistance (Banthia 2010; Cook 1984; James et al. 2002). The polypropylene fibers also
contain number of benefits like lowest thermal conductivity among the available artificial
fibers, high energy absorption capability and zero water absorption (James at al. 2002;
Banthia 2010; Galanti 1964). The glass fibers contain benefits like light weight and
ductility (Shakor and Pimlikar 2011; James et al. 2002). But due to unavailability of
alkaline resistant type of glass fibers at local level, the available type of glass fiber (non-
resistant to alkaline effect) is not considered due to its less durable nature. Similar to glass
fibers steel fibers also encompass benefits like zero water absorption and good ductility
but due to corrosive nature the steel fibers are also ignored for the application of canal-
lining. Thus, fibers are selected based on their good tensile strength, low/no water
absorption, and easy availability at low cost.
The properties, which can enhance the performance of concrete canal-lining, are
compressive, tensile, and flexure strengths of concrete. Out of these, the tensile strength
of concrete played a vital role in controlling cracks (Montañes 2006). Many
engineering/mechanical properties (like flexural strength, tensile strength, fatigue resistant
strength, abrasion and thermal impact) of composites (cement paste, mortar and/or
concrete) can be efficiently improved by introducing fibers in it (Thakur et al. 2014; Ali
2014; Ali 2016; Ramakrishna and Sundararajan 2005; Wambua et al. 2013; Aziz et al.
1981; Swift and Smith 1979; Cook et al. 1978; Racines and Pama 1978; Salyer 1975).
Fibers in concrete act as “crack arrester” (Kene et al. 2012; James et al. 2002). The impact
resistance and mechanical properties of concrete could be improved by use of even a low
proportion of natural fibers (Al-Oraimi and Seibi 1995). Merta and Tschegg (2013) carried
out an experimental investigation on fracture energy of concrete composites reinforced
with natural fibers. It was found that the addition of natural fibers enhanced the fracture
energy of composites. Joshi et al. (2004) reported that, in most of the cases, natural fiber

11
reinforced composites were environmentally superior to glass fiber reinforced composites.
Artificial fiber reinforced concrete reduced the rate of cracking in canal-lining by
enhancing its mechanical properties (Fang et al. 2011). Wang et al. (1987) conducted an
experimental study on synthetic fiber reinforced cementitious composites. Three types of
tests (i.e. compaction tension, splitting-tensile, and flexure tests) were performed to study
the tensile properties of concrete composites reinforced with acrylic, nylon, and aramid
fibers. It was concluded that the properties of concrete composites were greatly enhanced
by the incorporation of artificial fibers. It had been investigated that the addition of jute
fibers in cement composites had substantially increased the tensile and flexural strengths,
and toughness (Liu et al. 2013). It was investigated by different researchers that the jute
fibers (i) acted as crack-arresters, (ii) absorbed a significant amount of energy after the
occurrence of cracks, and (iii) carried a major portion of the tensile stress in the composite
material (Zakaria et al. 2016; Zhou et al. 2013; Mansur and Aziz 1982; Gupta et al. 1978;
Singh 1975; Siraskar and Kumar 1972). Kundu et al. (2012) investigated that jute fibers,
having high tensile strength of 250–300 MPa, were about seven times lighter than steel
fibers (having tensile strength of approximately 400-1200 MPa (Won et al. 2008)).
Ramaswamy et al. (1983) examined the tensile elongation ratios and tensile-breaking
strength of jute fiber. Two conditions were considered i.e. natural air-dry state and an
alkaline environment (by submerging in the solution of sodium hydroxide having pH value
of 11 for 28 days). It was reported that jute fiber had quite high breaking tensile strength
of 2260 kg/cm2 in natural dry state. During the period of immersion in alkaline medium,
the loss of strength varied from 5% to 32%. Chandar and Balaji (2015) reported significant
enhancement of 27%, 12%, and 44% in compressive, splitting-tensile, and flexural
strengths, respectively, of concrete due to incorporation of jute fibers. Cook et al. (1984)
reported that nylon fibers exhibited good tenacity, toughness, and excellent elastic
recovery. Nylon fiber reinforced concrete (NFRC) performed well under accelerated aging
conditions (Khajuria et al. 1991). Nylon fibers had the ability to act as crack arrestor
(Sridhara et al. 1971). Nylon fibers were also effective in sustaining and enhancing the
load carrying capability of concrete after the first crack (Goldfein 1965). Jagannathan et
al. (2016) conducted an experimental investigation on the use of nylon fibers in concrete.
It was concluded that NFRC had the ability to hold on the cracks of concrete. The addition

12
of 1% nylon fibers enhanced the compressive, tensile, and flexural strengths by 7.5%,
9.6%, and 12.5% respectively, than that of plain concrete. The ductility of concrete was
also improved. Subramanian et al. (2016) conducted an experimental investigation on
concrete composite incorporating nylon fibers. The effects of adding nylon fibers in
concrete of M20 grade on compressive strength of cubes and splitting-tensile strength of
cylinders were evaluated. Four test groups were constituted with the nylon fiber
percentages of 0%, 1%, 2% and 3%. The results showed that the incorporation of nylon
fibers in concrete improved its compressive and splitting-tensile strengths. Al-Tayyib et
al. (2013) reported that the inclusion of polypropylene fibers (PPF) in concrete improved
the tensile and flexural strengths of concrete and also resulted in decrease of the drying
shrinkage varied from 2% to 11% than that of plain concrete at an age of 70 days. Zollo
(1984) investigated that the addition of PPF in concrete had increased its splitting-tensile
and flexural strengths along with a significant reduction in shrinkage. Ramujee (2013)
reported enhancement of 34% and 40% in compressive strength and splitting-tensile
strength, respectively, of concrete due to incorporation of polypropylene fibers. Saadun et
al. (2016) and Rajguru et al. (2014) also reported a significant increase in compressive,
splitting-tensile, and flexural strengths due to incorporation of polypropylene fibers.
Kakooei et al. (2012) investigated the influence of adding polypropylene fibers in concrete.
Concrete samples were examined for its compressive strength, permeability and electric
resistivity. The amounts of fibers used for production of concrete samples varied from 0
to 2 kg/m3. It was concluded that the addition of PPF resulted in reduced permeability due
to which the starting of the degradation process had been delayed. In addition to this, the
amount of expansion and shrinkage of concrete were also reduced.
Previous studies that has been carried so far to study mix designs with fiber content
and with fiber length of JFRC, NFRC, and PPFRC are given in Table 2-3. As a nutshell,
JFRC has so far been studied for mix designs of 1:1.74:3.24, 1:1.5:3, 1:1.5:2.7, and 1:2:4
with fiber contents of 0.6 kg and 4.4 kg by 1 m3 of concrete, 1%, by mass of cement, 0.25%
and 0.50%, by volume fraction of concrete, and with fiber lengths of 15 mm, 30 mm, 40
mm, and 50 mm. It was reported that compressive strength (CS), splitting-tensile strength
(SS), and modulus of rupture (MoR) of JFRC came out to be 88%-128%, 78%-113%, and
90%-154%, respectively, of that of PC (Liu et al. 2013; Chandar and Balaji 2015; Kundu

13
et al. 2012; Zakaria et al. 2016). NFRC has so far been studied for mix designs of
1:3.33:1.67, 1:1.22:2.8, and 1:1.5:3 with fiber contents of 5%, by mass of cement, 1%,
1.5%, and 2%, by volume fraction of concrete, and with fibre lengths of 12 mm, 20 mm,
24 mm, and 45 mm. It was reported that CS, SS, and MoR of NFRC came out to be 94%-
127%, 94%-169%, and 93%-113%, respectively, of that of PC (Khan and Ali 2016;
Jagannathan et al. 2016; Subramanian et al. 2016). PPFRC has so far been studied for mix
Table 2-3 CS, SS, and MoR of PC, JFRC, NFRC, and PPFRC by Previous Studies
Fiber
Content Mix Design
ratio
Fiber
Length
(mm)
CS
(%)
SS
(%)
MoR
(%) References
PC ― ― 100 100 100 ―
JFRC
0.6 kg/m3 1:1.74:3.24 30 119 ― 154 Liu et al. (2013)
1%a 1:1.5:3 40 128 112 144 Chandar and Balaji (2015)
4.4 kg/m3 1:1.5:2.7 50 106 ― 111 Kundu et al. (2012)
0.25%b 1:1.5:3 15 105 105 119
Zakaria et al. (2016) 0.50%b 1:1.5:3 15 98 78 90
0.25% b 1:2:4 15 102 101 111
0.50% b 1:2:4 15 88 113 101
NFRC
5%a 1:3.33:1.67 50 94 108 103 Khan and Ali (2016)
1%b 1:1.22:2.8 45 108 110 113 Jagannathan et al. (2016)
1.5%b 1:1.22:2.8 45 94 94 93
1%b 1:1.5:3 20 127 112 ― Subramanian et al. (2016) 2%b 1:1.5:3 20 107 169 ―
PPFRC
0.25%a 1:1.5:3 24 106 172 - Vairagade et al. (2012)
1.5%b 1:1.5:3 12 134 140 - Ramujee (2013)
1%b 1:1.27:2.76 12 107 119 118 Rajguru et al. (2014) 0.25%b 1:1.27:2.76 12 103 107 105
1 kg/m3 1:1.36:2.52 54 104 113 102 Saadun et al. (2016) 2 kg/m3 1:1.36:2.52 38 84 118 115
Note: a content by mass of cement, b content by volume fraction of concrete.
designs of 1:1.5:3, 1: 1.27: 2.76, and 1:1.36:2.52 with fiber contents of 1 kg and 2 kg by 1
m3 of concrete, 0.25%, by mass of cement, 0.25%, 1.5%, and 1%, by volume fraction of

14
concrete, and with fibre lengths of 12 mm, 24 mm, 38 mm, and 54 mm. It was reported
that CS, SS, and MoR of PPFRC came out to be 84%-134%, 107%-140%, and 102%-
118%, respectively, of that of PC (Vairagade et al. 2012; Ramujee 2013; Rajguru et al.
2014; Saadun et al. 2016). The permeability of PPFRC has also been studied in terms of
water penetration for mix design of 1:1.38:1.75 with fiber contents of 0.5 kg, 0.7 kg, 0.9
kg, 1.5 kg, 2 kg, and 4 kg by 1 m3 of concrete and with fiber length of 12 mm. It was
reported that water penetration depth came out to be 8.5 mm to 9.5 mm. The minimum
water penetration depth was 7.7 mm for the specimen with 0.7 kg/m3 of fiber content,
which was 30% lower than that of PC (Ramezanianpour et al. 2013). PPFRC has also been
studied for shrinkage for mix design of 1:1.62:2.48 with fiber contents of 0.05%, 0.10%,
and 0.15%, by volume fraction of concrete, and with fiber length of 18 mm. A reduction
of 40% was reported in drying shrinkage of PPFRC as compared to that of PC (Kumar et
al. 2013). No research has been reported to study (at the same time) the effect of jute fibers,
nylon fibers, and polypropylene fibers on the mechanical properties, water absorption, and
linear shrinkage of concrete and their correlation.
2.4 Fiber reinforced concrete in canal-lining
Fang et al. (2011) studied the feasibility of the use of polypropylene fiber reinforced
concrete in canal-lining. For this purpose, the effect of polypropylene fibers (PPF) on
concrete shrinkage and crack resistance was analyzed. The properties of polypropylene
fiber reinforced concrete were compared to that of standard plain concrete. It was reported
that, incorporation of PPF in concrete enhanced its splitting-tensile and axial-tensile
strengths, toughness, frost resistance, and impermeability. The incorporation of PPF in
concrete effectively prevented and suppressed the crack formation in concrete. It was
concluded that PPFRC could improve the performance of canal-lining.
2.5 Summary
There is only one limited study by Fang et al. (2011) on PPFRC for canal-lining
application. On other hand, researchers have studied the mechanical properties (i.e.
compressive, splitting-tensile, and flexural strengths) of FRCs along with the permeability

15
and shrinkage of PPFRC only for other civil engineering applications. But an in-depth
knowledge of mechanical properties of FRCs along with their water absorption and
shrinkage are necessary for canal-lining application. To the best of authors knowledge, a
detail study on the suitability of fiber reinforced concrete (FRC) with different fibers for
canal-lining application has not been carried out up to now. The improved performance of
canal-lining can be insured by controlling its rate of cracking. The loss of water cannot be
reduced unless the crack formation is controlled and minimized. The initial micro crack in
canal-lining converts to macro cracks with the passage of time, which accelerates the loss
of water by allowing the seepage of water through the lining. The rate of cracking in
concrete canal-lining can be reduced by improving the tensile strength of concrete.
Improving mechanical properties of concrete and controlling its linear shrinkage can also
limit cracking in canal-lining.

16
CHAPTER 3
TEST METHODOLOGIES
3.1 Background
Natural fibers have attained the attention because of the low cost, less health hazard,
and flexibility. Artificial fibers also include many advantages like high strength, less water
absorption and low density in nature. Jute fibers are good in energy absorption and also
have high tensile breaking strength. Nylon fibers have good tenacity, toughness, and zero
water absorption. Polypropylene fibers also include benefits like chemically inertness, zero
water absorption and high tensile strength. As stated in the previous chapter that a detail
study on the suitability of fiber reinforced concrete (FRC) with different fibers for canal-
lining application has not been carried out up to now. Therefore, mechanical properties of
FRCs along with the water absorption and linear shrinkage are studied. In this chapter, raw
materials, the techniques of PC and FRCs mixing and casting, specimen details, testing
methodologies are examined in detail in this chapter.
3.2 Raw materials
The ingredients utilized for the preparation of PC, JFRC, NFRC, and PPFRC includes
Ordinary Portland cement, portable water, locally available sand, aggregates, jute fibers,
nylon fibers and polypropylene fibers. The aggregates having maximum size of 38 mm are
used.
3.3 Mix design and casting procedures
The ratio of 1, 3, and 1.5 is used for cement, sand, and aggregates, respectively, in mix
design of PC with a water-cement (W/C) ratio of 0.7. The purpose behind utilizing more
sand contrasted with total is that more mortar is accessible for grabbing fibers in case of
FRCs. A saturated surface dry condition is missing. Therefore, a relatively high w/c ratio
is used for the concrete mix. It may also be noted that no bleeding is observed during
workability test and filling of moulds (which may insure no loss in strength of FRCs). The

17
mix design for JFRC, NFRC, and PPFRC is the same as that of the PC except that 50 mm
long respective fibers having content of 5%, by mass of cement, are added. All materials
are batched by mass.
Concrete is prepared by using the non-tilting rotating type drum concrete mixer. For
production of PC, all materials along with the water are poured in the drum of the mixer,
and the duration for the rotation of mixer is three minutes. A slump test is conducted before
pouring the PC into moulds. For preparing JFRC, NFRC, and PPFRC mixes, one third of
all dry materials (in the sequence of aggregates, fibers, sand, and cement) are poured in
layers in mixer drum. Then, the same process is repeated for the addition of remaining dry
materials in the same sequence in the mixer. Initially, the two third of total water (as per
W/C ratio of 0.7, similar to that of PC) is added, and the concrete mixer is rotated for a
duration of three minutes. In the last phase, the rest of water is added and the rotation of
concrete mixer is repeated for another period of three minutes. All FRCs mixes are
workable at this stage and the fibers are approximately evenly dispersed. The slump tests
for the JFRC, NFRC, and PPRFC are also performed before pouring the mixes into
moulds. These tests are performed in the same manner as performed for that of PC. For
filling the moulds with PC, the standard procedure (i.e. filling moulds with three layers
and tempering each layer with 25 blows by 16 mm diameter rod) is adopted. However, for
filling moulds with FRCs, in addition to standard procedure, the mechanism of lifting up
of moulds to a distance of about 165 mm – 230 mm and then allowing it free fall to the
floor is followed for possible self-compaction and removal of voids due to air from the
FRCs. Selection of the best suitable method among the available methods for attaining an
enhanced slump of FRCs is recommended. The curing of all specimens is carried out for
28 days before testing.
3.4 Specimens
Cylinders having diameter of 100 mm and height of 200 mm, for the tests of splitting-
tensile and compressive strengths, and beam-lets of 100 mm width, 100 mm depth and 450
mm length, for flexure strength and linear shrinkage are prepared for PC and FRCs. For
the test of water absorption, the broken beam-lets after flexure strength test are used. An

18
average of two readings are taken to represent the properties of hardened concrete. Other
researchers also reported results by taking average of two readings, even the average of
crack length was presented (Lim et al. 2000). ASTM C39 also supports the average of two.
A total of 32 specimens i.e. 16 cylinders and 16 beam-lets are produced. 16 samples mean
4 with PC and 4 with each type of FRCs. Labels PC, JF, NF and PPF are used for PC,
JFRC, NFRC and PPFRC samples, respectively. Labels of C, S, F and L are marked
additionally to indicate the specimens specified for the tests of compressive, splitting-
tensile, and flexure strengths and linear shrinkage, respectively. 1 and 2 along with labels
delineated the mark of the sample for each specimen.
3.5 Testing procedures
3.5.1 Slump test and density test
ASTM standard C143/C143M−15a is adopted for workability determination of both
fresh PC and FRCs. The densities of both PC and FRCs in hardened state are measured as
per ASTM standard C642-13. The procedure for measuring the workability and densities
of FRCs is same as that of PC, due to non-availability of respective standards for FRCs.
3.5.2 Compressive strength test
Servo-hydraulic testing machine is used as per ASTM standard C39 / C39M-17 for
compressive strength, compressive behavior, compressive pre-crack/post-crack energies,
and compressive toughness index. The uniform distribution of load is ensured by capping
each cylinder with plaster of paris prior to testing.
3.5.3 Splitting-tensile strength test
ASTM standard C496/C496M-11 is followed for testing of cylindrical specimens
of PC and FRCs by using servo-hydraulic testing machine. The outcomes of tests include
splitting-tensile strength, splitting-tensile behavior, splitting tensile pre-crack/post-crack
energies, and splitting-tensile toughness index.

19
3.5.4 Flexural strength test
Following the ASTM standard C293 / C293M-16, servo-hydraulic testing machine is
used for flexural strength test of all beam-lets. The flexure strength tests are performed to
study the modulus of rupture (MoR), flexural behavior, flexural pre-crack/post-crack
energies, and flexural toughness index.
3.5.5 Water absorption test
Water absorption test is performed as per ASTM standard C642-13, to determine the
water absorption. The size of the specimens used for water absorption test is 100 mm x
100 mm x ~225 mm because the selected tested beam-lets in flexural strength tests are
utilized for determining the water absorption. Only that halves of the tested beam-lets are
selected which have no apparent crack in that portion.
3.5.6 Linear shrinkage test
As no single document is available for determination of linear shrinkage of hardened
concrete. Therefore, ASTM C157/C157M-08, is employed to determine the length change
for estimating the linear shrinkage of PC, JFRC, NFRC, and PPFRC by determining the
change in length of beam-lets (OPSS LS-435 standard). The test is performed as per ASTM
C157/C157M-08, with the exception that the test specimen sizes are 100 mm x 100 mm x
450 mm, and accordingly, the gauge length reference bar is used.
3.6 Summary
The proportion of concrete, sand, aggregates for PC and FRCs is 1, 3, and 1.5 with a
w/c proportion of 0.7. In addition to that, 5% fiber content, by mass of cement, and fiber
length of 50 mm are utilized in the case of FRCs. A total of 32 specimens i.e. 16 cylinders
and 16 beam-lets are produced. ASTM standards are followed for the execution of slump,
density, compressive, splitting-tensile, modulus of rupture, water absorption, and linear
shrinkage tests. The properties of FRCs are also determined by using the same standards
of ASTM. The investigation and results are talked about in detail in the next chapter (i.e.
chapter 4).

20
CHAPTER 4
TEST RESULTS AND ANALYSIS
4.1 Background
The mix design ratio of 1:3:1.5 and a W/C ratio of 0.7 is used for casting the specimens
of PC. The same mix design ratio is used for preparation of FRCs aside from addition of
5% fiber content, by mass of cement, having a length of 50 mm. This chapter contains the
detail discussion on the results of the tests performed on the specimens of PC, JFRC,
NFRC, and PPFRC.
4.2 Material properties of PC and FRCs
4.2.1 Slump and density
The values of slump for fresh PC, JFRC, NFRC, and PPFRC are displayed in the third
column of Table 4-1. The slumps of PC, JFRC, NFRC, and PPFRC are 44 mm, 17 mm,
28 mm, and 27 mm, respectively. The FRCs are less workable when contrasted with PC
for the same W/C ratio. Due to the retention and confinement effect of fibers, the reduced
values of slump are observed in case of FRCs than that of PC. The reduction of 27 mm,
16 mm, and 17 mm has been observed in slump in the cases of JFRC, NFRC, and PPFRC,
respectively, than that of PC. Thus, the slumps of JFRC, NFRC, and PPFRC are reduced
by 61%, 36%, and 39%, respectively, than that of PC for the same W/C ratio. The slump
of JFRC reduces most as compared to NFRC and PPFRC because of the high water-
absorption capacity of jute fibers, being natural fibers. Other researchers also reported that
the incorporation of fibers into a mix decreased the workability (Ozomaka 1976; Lewis
and Mirihagalia 1979).
The fourth column of Table 4-1 displays the densities of the specimens of hardened
PC, JFRC, NFRC, and PPFRC. The inclusion of fibers in FRCs caused a decrease in
densities of FRCs compared to that of PC due to fiber low unit weight. The densities of
PC, JFRC, NFRC, and PPFRC are 2204 kg/m3, 2139 kg/m3, 2182 kg/m3, and 2191 kg/m3,
respectively. In contrast to that of PC, a decrease of 65 kg/m3, 22 kg/m3, and 13 kg/m3, is

21
observed in densities of JFRC, NFRC, and PPFRC, respectively. Hence, the densities of
JFRC, NFRC, and PPFRC are reduced by 3%, 1%, and 0.6%, in comparison to that of PC.
The density of JFRC is reduced by 2% and 2.4% as compared to that of NFRC and PPFRC,
respectively. Hence, among the FRCs, the lowest density is observed for JFRC. This is
because the unit weight of the jute fibers (being natural fibers) is less than that of nylon
and polypropylene fibers.
Table 4-1 W/C ratio, slump, and density of PC, JFRC, NFRC, and PPFRC
Batch
(1)
Water-cement
ratio
Slump
(mm)
Density
(kg/m3)
(2) (3) (4)
PC 0.7 44 2204
JFRC 0.7 17 2139
NFRC 0.7 28 2182
PPFRC 0.7 27 2191
4.2.2 Compressive properties
4.2.2.1 Compressive behavior
Figure 4-1 displays the compressive stress-strain curves of PC, JFRC, NFRC, and
PPFRC. Figure 4-2 shows the scenario observed during the testing of PC, JFRC, NFRC,
and PPFRC specimens at first crack, cracks at the peak load and cracks at the ultimate
load. Throughout the testing of PC, JFRC, NFRC, and PPFRC specimens, the expected
behaviour is observed. Though, here in this work, the information such as (i) location and
length of first crack, (ii) locations, length and number of cracks at the peak loads and (iii)
locations, length and number of cracks at the ultimate loads has been exposed. The first
crack in the specimen of PC, JFRC, NFRC, and PPFRC is observed at 86%, 99%, 86%,
and 92% of their corresponding peak loads. The length and width of first crack in FRCs
are much less than that in PC. The length of first crack in PC, JFRC, NFRC, and PPFRC
is about 40 mm, 35 mm, 30 mm, and 20 mm, respectively, (refer to upper four photos in
Figure 4-2). At the peak load as compared to PC, the observed number of cracks, cracks
length and width are less in JFRC, NFRC, and PPFRC. At the peak load, the maximum

22
crack lengths in the specimens of PC, JFRC, NFRC, and PPFRC are enlarged up to about
80 mm, 70 mm, 60 mm, and 55 mm, respectively, (refer to middle four photos in Figure
4-2). At the ultimate load, the crack lengths for the specimens of JFRC, NFRC, and PPFRC
are further enlarged up to about 100 mm, 90 mm, and 80 mm, respectively, (refer to bottom
respective photos in Figure 4-2). While in case of PC, a portion of specimen is detached.
The specimens of FRCs do not shatter into pieces and show a relative ductile/tough mode
of failure. The presence of jute, nylon, and polypropylene fibers in concrete bridge the
cracks to resist the deformation. The use of fibers results in multiple more closely spaced
cracks with reduced crack width and length for FRCs specimens. In the case of PC, the
ultimate failure occurs along the narrow region where fewer cement particles existed
around the aggregate particles and the breaking of aggregates is also observed because of
its low crushing strength. In the cases of JFRC, NFRC, and PPFRC after the completion
of test at the ultimate load, their intentionally broken specimens demonstrate that mostly
the de-bonding of fibers in concrete mix is observed, rather than the breaking of fibers.
For the failure of the jute fibers, the ratio is about 35:65 amongst fibers debonding and
fiber fracture. In the case of nylon and polypropylene fibers, the ratios of nearly 70:30 and
85:15, respectively, are observed amongst fibers debonding and fiber fracture. The highest
debonding and lowest fiber fracture is observed for the polypropylene fibers due to its
better tensile strength and lower bond strength. Whereas, the lowest debonding and highest
Figure 4-1 Stress-strain curves of PC, JFRC, NFRC, and PPFRC for compressive
strength tests
0
4
8
12
16
0.00 0.02 0.04 0.06 0.08 0.10
Co
mpre
ssiv
e st
ress
(M
Pa)
Strain (-)
PC
JFRC
NFRC
PPFRC

23
fracture of fibers is observed in the case of jute fiber failure because of its low tensile
strength and better bond strength. The bond strength can be improved by carrying out
surface treatment of fibers which improves its surface roughness in order to provide a firm
grip between the fiber and adjoining matrix. The additives can also be used to increase the
bond strength amongst the fibers and matrix.
PC JFRC NFRC PPFRC
Fir
st c
rack
Cra
cks
at t
he
pea
k l
oad
Cra
cks
at t
he
ult
imat
e lo
ad
Figure 4-2 Development of cracks in the cylindrical specimens of PC, JFRC, NFRC,
and PPFRC under compressive load
4.2.2.2 Compressive strength, compressive pre-crack/post-crack absorbed energies,
and compressive toughness index
The compressive strength is considered equal to the largest value of stress from the stress-
strain curves. The area beneath the stress-strain curve up to the stress of first crack is
considered as the compressive pre-crack absorbed energy (CPE). The area beneath the

24
stress-strain curve from the stress at first crack to the stress at the ultimate load is
considered as the compressive cracked absorbed energy (CCE). The total area lying below
the stress-strain curve from the point of zero stress to the stress at the ultimate load is
considered as the compressive total absorbed energy (CTE). The ratio between the
compressive total absorbed energy and the compressive pre-crack absorbed energy (i.e.
CTE / CPE) is taken as the compressive toughness index (CTI). Table 4-2 displays the CS,
CPE, CCE, CTE, and CTI of PC, JFRC, NFRC, and PPFRC. The CS of 13.2 MPa, 8.4
MPa, 9.1 MPa, and 13.3 MPa are observed for PC, JFRC, NFRC, and PPFRC,
respectively. In contrast to CS of PC, a decrease of 4.8 MPa and 4.1 MPa was observed in
CS of JFRC and NFRC, respectively. In comparison to that of PC, an increase of 0.1 MPa
was observed in CS of PPFRC. Bayasi et al. (1993) and Tavakoli (1994) also found that
polypropylene fibers had a moderately little ideal impact on compressive strength of
concrete. The possible reason for relatively high CS of PC and PPFRC could be the better
compaction in PC and PPFRC than that in JFRC and NFRC. The reason for decrease in
compressive strengths of JFRC and NFRC could be addition of large amount of less dense
jute and nylon fibers, which enhanced the heterogeneousness of mixes up to some extent.
Another possible cause could be the presence of a relatively lesser amount of cement in
the JFRC and NFRC due to the addition of large amount of fibers (being low dense fibers)
in such a mix design ratio (1:3:1.5) that was similar to that of PC. The values of strain (εo)
at the maximum stress of PC, JFRC, NFRC, and PPFRC are 0.012, 0.014, 0.021 and 0.007,
respectively. An enhanced value of strain is observed for NFRC as compared to that of
other investigated materials which ensures that NF have high elongation capability which
permits it to hold the mixture together even at the time of breaking and thus prevents the
effect of shattering force. Another reason can be the slippage of NF due to relatively less
bond strength. The CPE of PC, JFRC, NFRC, and PPFRC are 0.06 MPa, 0.05 MPa, 0.06
MPa, and 0.05 MPa, respectively. As compared to CPE of PC, a decrease of 0.01 MPa is
observed in CPE of both JFRC and PPFRC and CPE of NFRC remained similar to that of
PC. The CCE of PC, JFRC, NFRC, and PPFRC are 0.09 MPa, 0.23 MPa, 0.28 MPa, and
0.26 MPa, respectively. In comparison to CCE of PC, an increase of 0.14 MPa, 0.19 MPa,
and 0.17 MPa was observed in CCE of JFRC, NFRC and PPFRC, respectively. The CTE
of PC, JFRC, NFRC, and PPFRC are 0.15 MPa, 0.28 MPa, 0.34 MPa, and 0.31 MPa,
25
respectively. An increase of 0.13 MPa, 0.19 MPa, and 0.16 MPa is observed in CTE of
JFRC, NFRC, and PPFRC, respectively, than that of PC. The increase in CCE and CTE of
FRCs may be because of the addition of fibers, which enhances the post-crack energy
absorption capabilities of concrete. The CTI of PC, JFRC, NFRC, and PPFRC are 2.50,
5.60, 5.67, and 6.20, respectively. In contrast to CTI of PC, an increase of 3.1, 3.17, and
3.70 is noticed in CTI of JFRC, NFRC, and PPFRC, respectively. Fiber addition have
limited the size of cracks and bridged the cracks to reduce the deformation. The reason for
the increase in CTI of FRCs is the presence of fibers of high percentage which provide
considerable amount of resistance against stresses after the crack propagation. As a result
of high post-crack energy absorption of FRCs as compared to that of PC, the toughness
indices of FRCs are greater than that of PC. Thus, the compressive post-crack energy
absorption capability and toughness of concrete can be improved by incorporation of
fibers.
Table 4-2 CS, εo, CPE, CCE, CTE, and CTI of PC, JFRC, NFRC, and PPFRC
Parameters
Concrete type
PC JFRC NFRC PPFRC
CS (MPa) 13.2 8.4 9.1 13.3
εo (-) 0.012 0.014 0.021 0.007
CPE (MPa) 0.06 0.05 0.06 0.05
CCE (MPa) 0.09 0.23 0.28 0.26
CTE (MPa) 0.15 0.28 0.34 0.31
CTI (-) 2.50 5.60 5.67 6.20
Note: CS = Compressive strength, εo = Strain at the maximum stress, CPE = Compressive absorbed pre-crack energy, CCE = Compressive cracked absorbed energy, CTE = Compressive total
absorbed energy, CTI = Compressive toughness index.
The comparison of CS, CPE, CTE and CTI of PC, JFRC, NFRC, and PPFRC can be
observed in the Figure 4-3. The reduction of 36% was observed in CS of JFRC than that
of PC. This reduction in the compressive strength due to incorporation of natural fibers
was also reported by other researchers (Ali et al. 2012; Ismail 2007; Ramaswamy et al.
1983;). So, by lowering the content of fibers may enhance the compressive strength of
concrete. The decrease of 17% is noticed in CPE of JFRC in contrast to that of PC. An

26
enhancement of 87% and 124% is observed in CTE and CTI, respectively, of JFRC as
compared to that of PC. The reduction of 31% is observed in the CS of NFRC than that of
PC. The CPE, CTE, and CTI of NFRC are improved by 0%, 127%, and 127%,
respectively, than that of PC. As compared to CS of PC, an increase of 1% is observed in
CS of PPFRC. In comparison to that of PC, a decrease of 17% is observed in CPE of
PPFRC and an increase of 107% and 148% is observed in CTE and CTI, respectively, of
PPFRC. The PPFRC outperformed its JFRC and NFRC companions in upgrading of CS
and CTI. While the NFRC outperformed its JFRC and PPFRC in upgrading of CPE, CCE,
and CTE. An improved post post-crack energy absorption capability of NFRC is observed
as compared to JFRC and PPFRC due to incorporation of high content of high strength
nylon fibers, which resists relatively more fragmentation of cylinder due to crushing load.
The degradation in post-crack energy absorption of PPFRC as compared to NFRC may be
due to presence of less volume of PPF in a such mix design ratio (1:3:1.5) as in NFRC
because of high density of PPF as compared to that of NF. The improved CS and CTI of
PPFRC may be due to the relatively well dispersal of the fibers through the concrete mix.
The strength, absorbed energies, and toughness index of JFRC are very low as compared
to that of NFRC and PPFRC because of the low strength and low density of jute
Figure 4-3 Comparison of compressive strengths, compressive pre-crack absorbed
energies, compressive total absorbed energies, and compressive toughness indices of
PC, JFRC, NFRC, and PPFRC
0
100
200
300
CS CPE CTE CTI
Per
centa
ge
PC JFRC NFRC PPFRCPPFRC
27
fibers as compared to that of PPF and NF. By comparing the results of compression
strength tests of the investigated materials, the PPFRC demonstrates the better results in
terms of enhanced CTI and CS. This ensures that PPFRC can resist well the effects of
erosion and abrasion on canal-lining due to improved post cracking behavior (improved
CTI) with highest value of CS among the investigated materials.
4.2.3 Splitting-tensile properties
4.2.3.1 Splitting-tensile behavior
Load-time curves under splitting-tensile loading are shown in Figure 4-4. Figure 4-5
displays the scenario observed during the testing of PC, JFRC, NFRC, and PPFRC
specimens at first crack, cracks at the peak loads and cracks at the ultimate loads.
Throughout the testing of PC, JFRC, NFRC, and PPFRC specimens, the anticipated
splitting-tensile behaviour is observed. The upper four photos in Figure 4-5 show the first
crack in PC, JFRC, NFRC, and PPFRC. The first crack in the specimen of PC, JFRC,
NFRC, and PPFRC is observed at 100%, 93%, 98%, and 99% of their corresponding peak
loads. The length and width of first crack in FRCs are much less than that in PC. The length
of about 50 mm, 60 mm and 70 mm is observed for the first crack in JFRC, NFRC, and
PPFRC. At this stage, it can be observed that the PC shatter into pieces adjacently to first
crack without any time gap, while specimens of FRCs are held together because of the
constrainment effect of fibers in specimens. At the peak load, as compared to PC, the
observed number of cracks, cracks length and width at the peak load are less in JFRC,
NFRC, and PPFRC as can be seen in the middle four photos of Figure 4-5. At this stage,
the maximum crack lengths in the specimens of JFRC, NFRC, and PPFRC are enlarged
up to about 65 mm, 70 mm, and 80 mm, respectively. The test is continued even after the
peak load to observe the specimen behaviour. At the extreme load, there are multiple
cracks and the maximum crack lengths for the specimens of JFRC, NFRC, and PPFRC are
enlarged up to about 75 mm, 80 mm, and 90 mm, respectively, (refer to bottom four photos
in Figure 4-5). As per expectations, for all the cases i.e. JFRC, NFRC, and PPFRC, the
small size of first crack is observed than that of cracks produced at the peak and extreme
loads. This shows that as soon as the cracking of concrete started, the fibers ensured the

28
Figure 4-4 Load-time histories of PC, JFRC, NFRC, and PPFRC from the tests of SS
PC JFRC NFRC PPFRC
Fir
st c
rack
Cra
cks
at t
he
pea
k l
oad
Cra
cks
at t
he
extr
eme
load
Figure 4-5 Development of cracks in the cylindrical specimens of PC, JFRC, NFRC,
and PPFRC under splitting-tensile load
0
20
40
60
80
0 100 200 300 400
Splitt
ing
-ten
sile
lo
ad (
kN
)
Time (s)
PC
JFRC
NFRC
PPFRC
Broken at
first crack
Broken at
first crack

29
tough behavior of concrete by arresting the crack formation and propagation. So, by
incorporation of fibers, the brittle character of concrete can be avoided by improving its
post cracking behavior. The observation of fibers failure in case of FRCs has been carried
out by intentionally breaking the cylinders into two portions. The visual inspection of
JFRC cylinder shows that the ratio of about 30:70 exists for the failure of fibers between
fiber pull-out and fiber fracture on the ruptured surface. In NFRC cylinder, the ratio of
about 65:35 is observed for the failure of fiber between the pull-out and fracture of fibers
on the fragmented surface of specimens. In case of PPFRC cylinder, the ratio of about
75:25 is observed for the failure of fiber between the pull-out and fracture of fibers on the
fragmented surface of specimens. The highest debonding and lowest fiber fracture is
observed for the polypropylene fibers due to its better tensile strength and lower bond
strength. Whereas, lowest debonding and highest fracture of fibers is observed in the case
of jute fibers because of its low tensile strength and better bond strength. The fiber pull-
out is resulted due to smaller embedment length of fibers in any one broken side of the
half cylinder. The existence of the smaller embedment length results in smaller bond
strength than the fiber tensile strength. The equal embedment length of broken fibers is
expected on each half of cylinders.
4.2.3.2 Splitting-tensile strength, splitting-tensile pre-crack/post-crack absorbed
energies, and splitting-tensile toughness index
The largest value of load is considered from the splitting-tensile load-time histories of
for the calculation of the splitting-tensile strength (SS). The area beneath the load-time
history up to the load at first crack is considered as splitting-tensile pre-crack absorbed
energy (SPE). The area beneath the splitting-tensile load-time history from the load at first
crack to the peak load is considered as the splitting-tensile post-crack absorbed energy
(SCE). It may be noted that the load at first crack and peak load are same in case of PC
because it was splitted into two pieces at these stages. The total area lying below the
splitting-tensile load-time history from the point of zero load to the peak load is considered
as the splitting-tensile total absorbed energy (STE). The ratio between the splitting-tensile
total absorbed energy and the splitting-tensile pre-crack absorbed energy (that is STE /
SPE) is considered as the splitting-tensile toughness index (STI). Table 4-3 displays the

30
SS, SPE, SCE, STE, and STI of PC, JFRC, NFRC, and PPFRC. The SS of 2.1 MPa, 1.7
MPa, 1.9 MPa, and 2.2 MPa, are observed for PC, JFRC, NFRC, and PPFRC, respectively.
In contrast to SS of PC, a reduction of 0.4 MPa, and 0.2 MPa is observed in the SS of
JFRC and NFRC, repectively. And an increase of 0.1 MPa is observed in the SS of PPFRC.
Tavakoli (1994) also reported an increase in SS of concrete due to addition of
polypropylene fibers as observed in the current study in case of PPFRC. The values of SPE
for PC, JFRC, NFRC, and PPFRC are 12973 kN.s, 7956 kN.s, 10017 kN.s, and 13978
kN.s, respectively. In comparison to SPE of PC, a reduction of 5017 kN.s and 2956 kN.s
is observed in SPE of JFRC and NFRC, respectively. And an increase of 1005 kN.s is
observed in SPE of PPFRC. In contrast to that of PC, a decreased value of SPE is noticed
for JFRC and NFRC, due to presence of high percentage of low dense fibers in a mix
design (i.e. 1:3:1.5) similar to that of PC. The incorporation of high dosage of fibers
adversely affect the shear strength of JFRC and NFRC due to decrease in bond strength.
And as a result, due to decreased value of shear resistance, it’s become difficult for JFRC
and NFRC to resist the early formation of first crack and thus SPE is reduced. While for
PPFRC, the well dispersal and presence of relatively small dosage of polypropylene fibers
(in the same mix design of 1:3:1.5) improved its resistance to shear forces by avoiding
early formation of first crack. And thus, an improved value of SPE is observed for PPFRC
than that of all investigated materials. The value of 0 kN.s, 178 kN.s, 229 kN.s, and 353
kN.s, are observed for SCE of PC, JFRC, NFRC, and PPFRC, respectively. In comparison
to that of PC, 100 times increase is observed in SCE of JFRC, NFRC, and PPFRC,
respectively. The improved SCE of FRCs shows that the post-crack energy absorption
capability of FRCs are much greater than that of PC because of the crack bridging effect
of fibers. The STE of PC, JFRC, NFRC, and PPFRC are 12973 kN.s, 8134 kN.s, 10246
kN.s, and 14331 kN.s, respectively. In comparison to STE of PC, a reduction of 4839 kN.s
and 2727 kN.s is observed in the STE of JFRC and NFRC, respectively, and an increase
of 1358 kN.s is observed in the STE of PPFRC. The STI of 1, 1.02, 1.02, and 1.03 are
observed for PC, JFRC, NFRC, and PPFRC, respectively. An increase of 0.02, 0.02, and
0.03 is observed in STI of JFRC, NFRC, and PPFRC, respectively, than that of PC.
The SS, SPE, STE, and STI of PC, JFRC, NFRC, and PPFRC are compared in Figure
4-6. In contrast to that of PC, a reduction of 19%, 39%, and 37% is observed in SS, SPE,

31
Table 4-3 SS, SPE, SCE, STE, and STI of PC, JFRC, NFRC, and PPFRC
Parameters
Concrete type
PC JFRC NFRC PPFRC
SS (MPa) 2.1 1.7 1.9 2.2
SPE (kN.s) 12973 7956 10017 13978
SCE (kN.s) 0 178 229 353
STE (kN.s) 12973 8134 10246 14331
STI (-) 1.00 1.02 1.02 1.03
Note: SS = Splitting-tensile strength, SPE = Splitting-tensile absorbed pre-crack energy, SCE =
Splitting-tensile post-crack absorbed energy, STE = Splitting-tensile total absorbed energy, STI = Splitting-tensile toughness index.
and STE, respectively, of JFRC. In contrast to STI of PC, an increase of 2% is observed
in STI of JFRC. When contrasted with that of PC, a decrease of 10%, 23%, and 21% is
observed in SS, SPE, and STE, respectively, of NFRC. In contrast to STI of PC, an increase
of 2% is observed in STI of NFRC. An improvement of 5%, 8%, 10%, and 3% is noticed
in the SS, SPE, STE, and STI, respectively, of PPFRC in comparison to that PC. As a
result of high post-crack energy absorption capability of FRCs as compared to that of PC,
the toughness indices for the FRCs are greater than 1. While in case of PC, the STI is equal
to 1 because of the existence of first crack load and peak load at the same point. So, an
improved post-crack energy absorption capability and better crack arresting mechanism
Figure 4-6 Comparison of the splitting-tensile strengths, splitting-tensile pre-crack
absorbed energies, splitting-tensile total absorbed energies, and splitting-tensile
toughness indices of PC, JFRC, NFRC, and PPFRC
0
50
100
150
SS SPE STE STI
Per
centa
ge
PC JFRC NFRC PPFRCPPFRC

32
can be ensured by introducing the fibers in concrete. As per the outcomes of splitting-
tensile tests for the PC, JFRC, NFRC, and PPFRC, the PPFRC shows better results in
terms of improved SS, SPE, SCE, STE, and STI as compared to other studied materials.
The better results for PPFRC may be due to the random distribution and high tensile
strength of PPF. The random distribution of fibers ensures the utilization of maximum
fibers in improving the strength of PPFRC. So, it can be suggested that PPFRC can perform
well in controlling the cracks due to tensile stresses because of its high governing splitting-
tensile properties.
4.2.4 Flexural properties
4.2.4.1 Flexural behavior
Figure 4-7 displays the load-deflection curves for flexure strength test. Figure 4-8
displays the formation of first crack, cracks at the peak load, and cracks at the ultimate
load in the beam-lets of PC, JFRC, NFRC, and PPFRC. The upper four photos of Figure
4-8 show the first crack in PC, JFRC, NFRC, and PPFRC beam-lets. The first crack in the
beam-lets of PC, JFRC, NFRC, and PPFRC is observed at 100%, 97%, 99%, and 95% of
their corresponding peak loads. The length of about 60 mm, 50 mm, and 50 mm is observed
for first crack in JFRC, NFRC, and PPFRC, respectively. The length and width of first
crack in FRCs beam-lets are much less than that in PC beam-lets. It can be observed that
the PC beam-lets shatter into two pieces, while beam-lets of FRCs are held together
because of the constrainment effect of fibers in beam-lets. At the peak load, as compared
to PC, the observed number of cracks, cracks length and width at the peak load are less in
JFRC, NFRC, and PPFRC. At this stage, the crack lengths in the specimens of JFRC,
NFRC, and PPFRC are enlarged up to about 80 mm, 83 mm, and 76 mm, respectively,
(refer to middle four photos in Figure 4-8). At the ultimate load, the crack lengths for the
specimens of JFRC, NFRC, and PPFRC are enlarged up to about 94 mm, 94 mm, and 82
mm, respectively, (refer to bottom four photos in Figure 4-8). For better observation of
fiber failure, the beam-lets of FRCs are intentionally broken into two portions. The visual
inspection of fracture surface of JFRC shows that the ratio of about 30:70 exists between
fiber pull-out from the matrix and fiber fracture. In NFRC beam-lets, the ratio of about
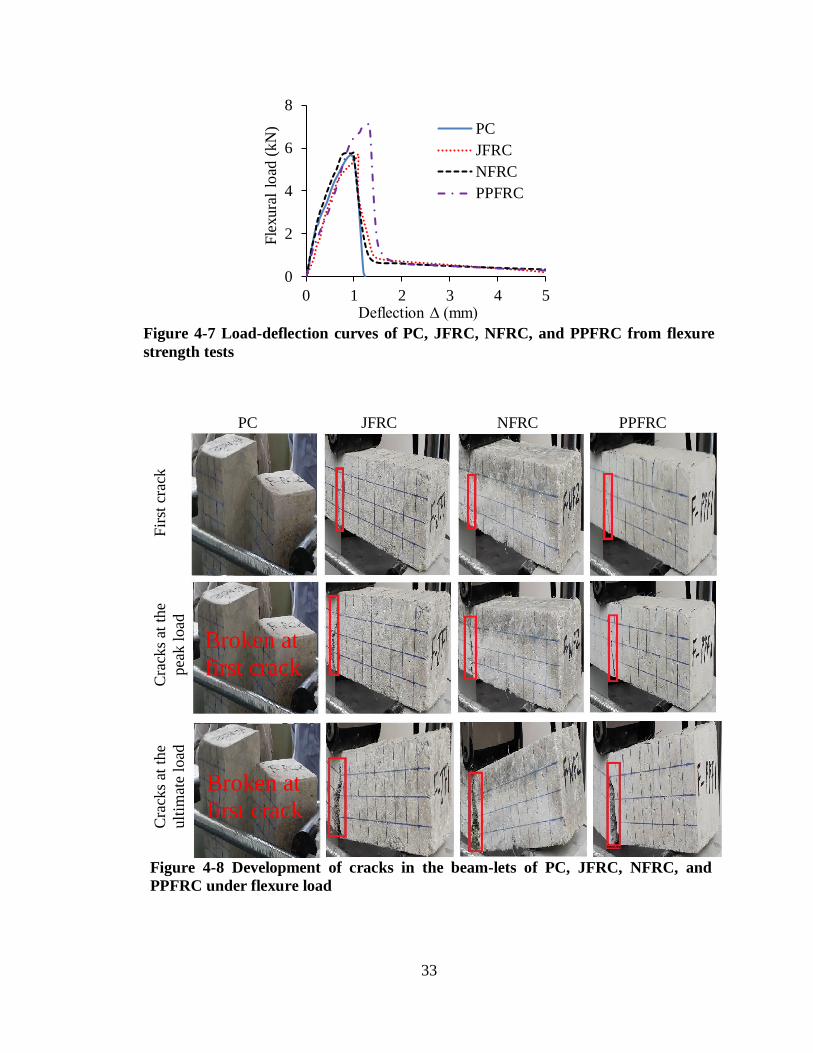
33
Figure 4-7 Load-deflection curves of PC, JFRC, NFRC, and PPFRC from flexure
strength tests
PC JFRC NFRC PPFRC
Fir
st c
rack
Cra
cks
at t
he
pea
k l
oad
Cra
cks
at t
he
ult
imat
e lo
ad
Figure 4-8 Development of cracks in the beam-lets of PC, JFRC, NFRC, and
PPFRC under flexure load
0
2
4
6
8
0 1 2 3 4 5
Fle
xura
l lo
ad (
kN
)
Deflection ∆ (mm)
PC
JFRC
NFRC
PPFRC
Broken at
first crack
Broken at
first crack

34
60:40 is observed for the failure of fiber between the pull-out and fracture of fibers on the
fragmented surface of specimens. In PPFRC beam-lets, the ratio of about 80:20 is observed
for the failure of fiber between the pull-out and fracture of fibers on the fragmented surface
of specimens. By visual inspection of the fractured surfaces of the beam-lets of FRCs, it is
found that the random distribution and dispersal of polypropylene fibers is much better
than that of nylon and jute fibers. In the case of flexure test, the reasons for fibers pull-out
and fracture are identical to that of explained in preceding chapter of “splitting-tensile
behavior”.
4.2.4.2 Flexure strength, flexural pre-crack/post-crack absorbed energies, and
flexural toughness index
The modulus of rupture (MoR) is calculated by considering the largest value of load
from the load-deflection curves of flexure strength tests. The area beneath the load-
deflection curve of flexure strength test up to the load at first crack is taken as the flexural
pre-crack absorbed energy (FPE). It may be noted that the load at first crack and peak load
are same in case of PC beam-let as it was broken into two halves at these stages. The area
beneath the flexure load-deflection curve from the load at first crack to the ultimate load
is considered as the flexural post-crack absorbed energy (FCE). The total area lying below
the flexure load-deflection curve is considered as the flexural total absorbed energy (FTE).
The ratio between the flexural total absorbed energy and the flexural pre-crack absorbed
energy (that is FTE / FPE) is chosen as the flexural toughness index (FTI). Table 4-4
displays the MoR, ∆o, FPE, FCE, FTE, and FTI of PC, JFRC, NFRC, and PPFRC. The
values of 2.68 MPa, 2.90 MPa, 2.94 MPa, and 3.60 MPa, are observed for MoR of PC,
JFRC, NFRC, and PPFRC, respectively. By comparing to that of PC, the MoR of JFRC,
NFRC, and PPFRC enhances by an amount of 0.22 MPa, 0.26 MPa, and 0.92 MPa,
respectively. The similar trend of the presence of increase in MoR and decrease in SS/shear
strength for the same material was also reported by different researchers (Vitkar et al.
2017; Bei-xing et al. 2004). The deflections (∆o) at the peak load of PC, JFRC, NFRC and
PPFRC are 0.99 mm, 1.10 mm, 1 mm, and 1.33 mm, respectively. A larger ∆o is observed
for PPFRC as compared to that of other studied materials. The possible reason can be the
higher ratio (about 80%) of fiber pull-out in PPFRC. The FPE of PC, JFRC, NFRC, and

35
PPFRC are 4.09 kN.mm, 3.37 kN.mm, 3.60 kN.mm, and 4.11 kN.mm, respectively. As
compared to PC, the FPE of JFRC and NFRC decreases by 0.72 kN.mm and 0.49 kN.mm,
respectively, while that of PPFRC increases by 0.02 kN.mm. The reason for increased
value of FPE is well dispersal and random distribution of PPF fibers which helps in
resisting crack propagation. The FCE of JFRC, NFRC, and PPFRC are 2.91 kN.mm, 3.29
kN.mm, and 4.09 kN.mm, respectively. The FTE of PC, JFRC, NFRC, and PPFRC are
4.09 kN.mm, 6.28 kN.mm, 6.89 kN.mm, and 8.20 kN.mm, respectively. The FTE of JFRC,
NFRC, and PPFRC increases by 2.19 kN.mm, 2.80 kN.mm, and 4.11 kN.mm,
respectively, than that of PC. The FTI of 1, 1.86, 1.91, and 1.99, is observed for PC, JFRC,
NFRC, and PPFRC, respectively. As compared to PC, an increase of 0.86, 0.91, and 0.99
is observed in FTI of JFRC, NFRC, and PPFRC, respectively. Better post-crack behavior
and higher post-crack energy absorption of FRCs increases the flexure toughness indices
of FRCs. The crack arresting mechanism and constrainment effect of jute, nylon, and
polypropylene fibers resist the propagation of cracks which results in enhanced post-crack
energy absorption of concrete.
Table 4-4 MoR, ∆o, FPE, FTE, and FTI of PC, JFRC, NFRC, and PPFRC
Parameters
Concrete type
PC JFRC NFRC PPFRC
MoR (MPa) 2.68 2.90 2.94 3.60
∆o (mm) 0.99 1.10 1.00 1.33
FPE (kN.mm) 4.09 3.37 3.60 4.11
FCE (kN.mm) 0.00 2.91 3.29 4.09
FTE (kN.mm) 4.09 6.28 6.89 8.20
FTI (-) 1.00 1.86 1.91 1.99
Note: FS = Flexure strength, ∆o = Deflection at the maximum load, FPE = Flexural absorbed pre-
crack energy, FCE = Flexural post-crack absorbed energy, FTE = Flexural total absorbed energy, FTI = Flexural toughness index.
Figure 4-9 presents the comparison of MoR, FPE, FTE, and FTI of PC, JFRC, NFRC,
and PPFRC. In comparison to that of PC, an increase of 8%, 53%, and 86%, is observed
in MoR, FTE, and FTI, respectively, of JFRC and a decrease of 18% is observed in FPE
of JFRC. The MoR, FTE, and FTI of NFRC exceeds the corresponding properties of PC

36
by an amount of 10%, 68%, and 91%, respectively, and a decrease of 12% is noticed in
FPE of NFRC in comparison to that of PC. In contrast to that of PC, an increase of 34%,
0.5%, 100%, and 99%, is observed in MoR, FPE, FTE, and FTI of PPFRC, respectively.
As per the outcomes of flexural tests for the FRCs, the PPFRC shows the better results in
terms of improved MoR, FPE, FTE, and FTI as compared to its other two companions.
The addition of PPF is seen to enhance the pre-peak as well as post-peak region of the
load–deflection curve for PPFRC, also causing an increase in toughness index. On the
basis of enhanced flexural properties of PPFRC, it can be suggested that PPFRC is likely
to perform well in controlling the cracking of concrete due to differential settlement and
external impact loads.
4.2.5 Water absorption
Water absorption is defined as the transport of liquids in porous solids by virtue of
surface tension acting in capillaries and is taken equal to the total mass of water absorbed
by specimen divided by the total mass of specimen (Basheer et al. 2001; ASTM standard
C642-13). Table 4-5 displays the water absorption of PC, JFRC, NFRC, and PPFRC. The
WA of 2.41%, 2.61%, 2.44%, and 2.32% are observed for PC, JFRC, NFRC, and PPFRC,
respectively. As compared to WA of PC, WA of JFRC and NFRC is increased by 0.2%
and 0.03%, respectively. The possible reason for high WA of JFRC could be the high
Figure 4-9 Comparison of the Flexure strengths, Flexural pre-crack absorbed
energies, Flexural total absorbed energies, and Flexural toughness indices of PC,
JFRC, NFRC, and PPFRC
0
100
200
MoR FPE FTE FTI
Per
centa
ge
PC JFRC NFRC PPFRCPPFRC

37
water-absorption capacity of jute fibers. Due to this, the high amount of water has been
absorbed by JFRC as compared to other investigated materials. The water absorption of
NFRC is little higher than that of PC due to the high porosity because of the presence of
high content of nylon fibers which adversely affect the better compaction of NFRC. As
compared to WA of PC, a decrease of 0.09% is observed in WA of PPFRC. The possible
reason for less WA of PPFRC could be the zero water-absorption of polypropylene fibers,
presence of suitable amount of fibers, and better compaction as compared to that of NFRC
and JFRC.
Table 4-5 WA of PC, JFRC, NFRC, and PPFRC
Parameter
Concrete type
PC JFRC NFRC PPFRC
WA (%) 2.41 2.61 2.44 2.32
Figure 4-10 Comparison of WA of PC, JFRC, NFRC, and PPFRC
Figure 4-10 displays the comparison of results obtained from water absorption tests of
PC, JFRC, NFRC, and PPFRC. As compared to WA of PC, an increase of 8% and 1% is
observed in WA of JFRC and NFRC, respectively, and a decrease of 4% is observed in the
WA of PPFRC. The final results of water absorption tests demonstrate that PPFRC
outperformed the PC, JFRC, and NFRC in reducing the rate of water absorption. The
100108 101 96
0
50
100
150
PC JFRC NFRC PPFRC
Per
centa
ge
WA
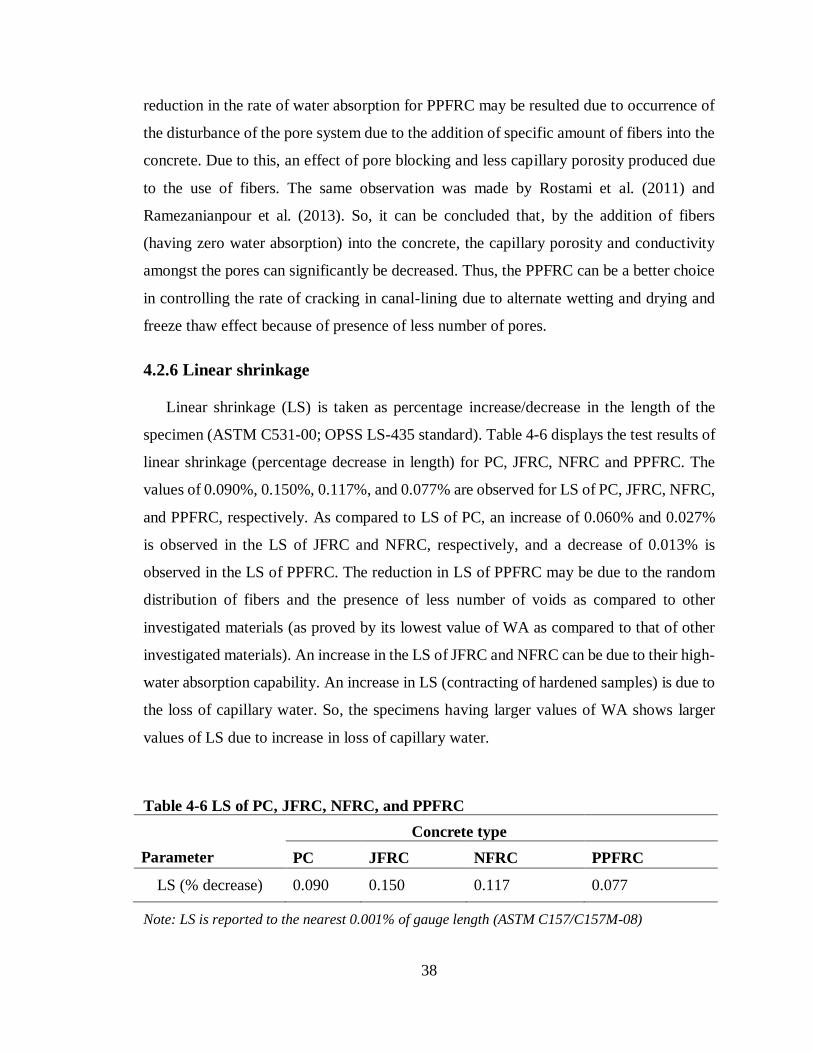
38
reduction in the rate of water absorption for PPFRC may be resulted due to occurrence of
the disturbance of the pore system due to the addition of specific amount of fibers into the
concrete. Due to this, an effect of pore blocking and less capillary porosity produced due
to the use of fibers. The same observation was made by Rostami et al. (2011) and
Ramezanianpour et al. (2013). So, it can be concluded that, by the addition of fibers
(having zero water absorption) into the concrete, the capillary porosity and conductivity
amongst the pores can significantly be decreased. Thus, the PPFRC can be a better choice
in controlling the rate of cracking in canal-lining due to alternate wetting and drying and
freeze thaw effect because of presence of less number of pores.
4.2.6 Linear shrinkage
Linear shrinkage (LS) is taken as percentage increase/decrease in the length of the
specimen (ASTM C531-00; OPSS LS-435 standard). Table 4-6 displays the test results of
linear shrinkage (percentage decrease in length) for PC, JFRC, NFRC and PPFRC. The
values of 0.090%, 0.150%, 0.117%, and 0.077% are observed for LS of PC, JFRC, NFRC,
and PPFRC, respectively. As compared to LS of PC, an increase of 0.060% and 0.027%
is observed in the LS of JFRC and NFRC, respectively, and a decrease of 0.013% is
observed in the LS of PPFRC. The reduction in LS of PPFRC may be due to the random
distribution of fibers and the presence of less number of voids as compared to other
investigated materials (as proved by its lowest value of WA as compared to that of other
investigated materials). An increase in the LS of JFRC and NFRC can be due to their high-
water absorption capability. An increase in LS (contracting of hardened samples) is due to
the loss of capillary water. So, the specimens having larger values of WA shows larger
values of LS due to increase in loss of capillary water.
Table 4-6 LS of PC, JFRC, NFRC, and PPFRC
Parameter
Concrete type
PC JFRC NFRC PPFRC
LS (% decrease) 0.090 0.150 0.117 0.077
Note: LS is reported to the nearest 0.001% of gauge length (ASTM C157/C157M-08)

39
Figure 4-11 displays the comparison of results obtained from linear shrinkage tests of
PC, JFRC, NFRC, and PPFRC. In contrast to LS (% decrease) of PC, the LS of JFRC and
NFRC are more (67% and 30%, respectively). However, in contrast to LS (% decrease) of
plain concrete, the LS of PPFRC is 15% less. PPFRC outperforms the JFRC and NFRC
by showing less LS due to high tensile strength of PPF as compared to that of other two
fibers. The change in length of concrete specimen is due to the processes of wetting and
drying. So, the less value of LS for PPFRC shows that it can perform well in limiting the
tensile stresses due to alternate wetting and drying. As a result, it can be suggested that the
cracks due to tensile stresses can be reduced effectively by incorporation of PPF in
concrete canal-lining.
Figure 4-11 Comparison of LS (% decrease) of PC, JFRC, NFRC, and PPFRC
4.3 Summary
The mechanical properties, water absorption, and linear shrinkage of plain concrete
(PC), jute fiber reinforced concrete (JFRC), nylon fiber reinforced concrete (NFRC), and
polypropylene fiber reinforced concrete (PPFRC) with mix design ratio of 1:3:1.5 and W/C
ratio of 0.7 are determined. In comparison to that of PC, decreased values of slumps and
densities are observed for fiber reinforced concrete (FRCs). The compressive and splitting-
tensile strengths of JFRC and NFRC are decreased in comparison to that of PC. Whereas,
an increased value of compressive strength (CS) and splitting-tensile strength (SS) is
observed for PPFRC, than that of respective PC. An increased value of modulus of rupture
100
167
130
85
0
100
200
PC JFRC NFRC PPFRC
Per
centa
ge
LS

40
(MoR) is observed for FRCs than that of PC. An increased linear shrinkage (LS) and water
absorption (WA) has been observed for JFRC and NFRC as compared to that of PC. While
a decreased LS and WA is observed for PPFRC as compared to that of PC. As compared
to that of PC, an enhanced post-crack energy absorption and toughness indices are
observed for FRCs. PPFRC outperforms all the investigated materials in upgrading CS,
SS, MoR, CTI, STI, FTI, SPE and FTE. Also, decreased WA and LS of PPFRC are
observed as compared to that of all other investigated materials. So, PPFRC is expected to
perform well in controlling the rate of cracking in canal-lining.

41
CHAPTER 5
DISCUSSIONS
5.1 Background
The material properties (compressive, splitting-tensile, and flexure strengths), water
absorption (WA), and linear shrinkage (LS), behavior during different loadings, mode of
failure and the outcomes of the different tests has been explained in chapter 4. It is found
that PPFRC outperforms all the investigated materials in upgrading most of the properties.
In this chapter, the development of empirical relation between the WA or LS and the
selected strength properties and correlation between the material properties and canal-
lining performance has been explained.
5.2 Empirical equations
5.2.1 Empirical relation between water absorption and selected strength
properties
Following empirical equations have been established with the help of experimental
data by means of best fit curve (R2 ranging from 0.70 to 0.93) along with the simplification
of coefficients and exponents of input variables for numerically predicting the water
absorption ‘WA’ (in %):
WA = 3.7*CS-0.2 Eq 1
WA = 3.2*SS-0.4 Eq 2
WA = 13.2*SPE-0.2 Eq 3
WA = 4.4*FPE-0.5 Eq 4
Where CS is compressive strength in MPa, SS is splitting-tensile strength in MPa, SPE is
splitting-tensile pre-crack absorbed energy in kN.s, and FPE is flexural pre-crack absorbed
energy in kN.mm.

42
Table 5-1 represents the experimental and empirical values of WA (in %). It can be
observed that a correlation exists amongst the water absorption and each of CS, SS, SPE
and FPE. An inverse relation has been found amongst the linked properties and WA. So,
it will be true to say that an improved strength properties of a material can result in
reduction in WA. The theoretical value of WA (i.e. 2.33%) calculated by Eq 2 for PPFRC
is the closest to the experimental value of WA (i.e. 2.32%) for PPFRC. Only a slight
difference of 0.1% exits between the experimental and empirical values of WA of PPFRC.
Likewise, for all types of investigated materials, the same trend (i.e. least difference) is
observed between the experimental and theoretical values calculated by Eq 2.
Table 5-1 Experimental and theoretical values of WA of PC, JFRC, NFRC, and
PPFRC
Specimens
WA (%)
Exp Eq 1 Eq 2 Eq 3 Eq 4
PC 2.41 2.21 2.38 1.99 2.18
JFRC 2.61 2.42 2.59 2.19 2.40
NFRC 2.44 2.38 2.48 2.09 2.32
PPFRC 2.32 2.21 2.33 1.96 2.17
Figure 5-1 Comparison of values of WA of PC, JFRC, NFRC, and PPFRC obtained
from experimental tests, Eq 1, Eq 2, Eq 3, and Eq 4
80
100
120
PC JFRC NFRC PPFRC
Per
centa
ge
Experimental
Eq 1 Eq 2 Eq 3 Eq 4Eq 4

43
Figure 5-1 represents the comparison between the experimental and empirical values
of WA. It can be observed that the WA obtained by using Eq 1 is closer to that of
experimental value as compared to the values of WA calculated by using Eq 2, Eq 3 or Eq
4. This shows the existence of a close correlation between the WA and splitting-tensile
strength (SS) of a material. There is a good agreement between the experimental and
empirical values of WA. The percentage errors of 2%-8%, 0.4%-2%, 14%-17%, and 5%-
10% are observed for Eq 1, Eq 2, Eq 3, and Eq 4, respectively.
5.2.2 Empirical relation between linear shrinkage and selected strength
properties
Following empirical equations have been established with the help of experimental
data by means of best fit curve (R2 ranging from 0.91 to 0.99) along with the simplification
of coefficients and exponents of input variables for numerically predicting the linear
shrinkage ‘LS’ (in %):
LS = 1.6*CS-1.2 Eq 5
LS = 0.6*SS-2.5 Eq 6
LS = 4140*SPE-1.14 Eq 7
LS = 5*FPE-2.9 Eq 8
Where CS is compressive strength in MPa, SS is splitting-tensile strength in MPa, SPE is
splitting-tensile pre-crack absorbed energy in kN.s, and FPE is flexural pre-crack absorbed
energy in kN.mm.
Table 5-2 represents the experimental and empirical values of LS (in % decrease). It
can be observed that a correlation exists amongst the linear shrinkage and each of CS, SS,
SPE and FPE. An inverse relation has been found amongst the linked properties and LS.
So, it will be true to say that improved strength properties of a material can result in
reduction in LS. The theoretical value of LS (i.e. 0.078%) calculated by Eq 7 for PPFRC
is the closest to the experimental value of LS (i.e. 0.077%) for PPFRC. Only a slight
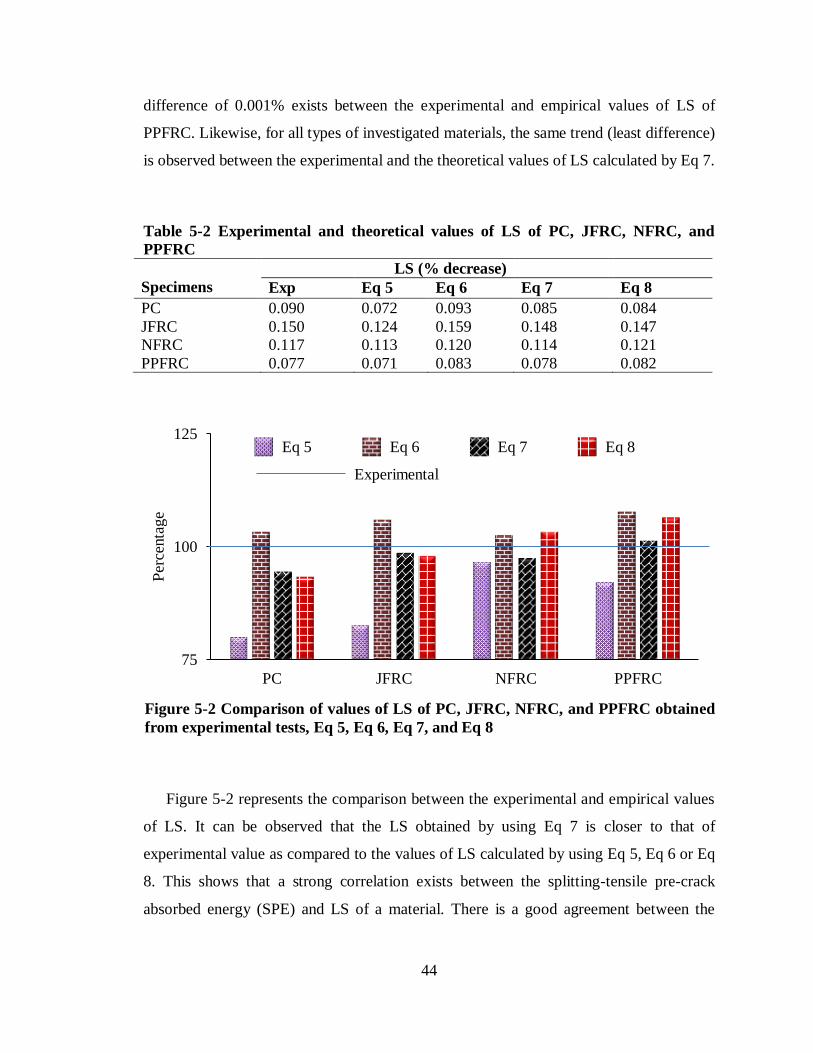
44
difference of 0.001% exists between the experimental and empirical values of LS of
PPFRC. Likewise, for all types of investigated materials, the same trend (least difference)
is observed between the experimental and the theoretical values of LS calculated by Eq 7.
Table 5-2 Experimental and theoretical values of LS of PC, JFRC, NFRC, and
PPFRC
Specimens
LS (% decrease)
Exp Eq 5 Eq 6 Eq 7 Eq 8
PC 0.090 0.072 0.093 0.085 0.084
JFRC 0.150 0.124 0.159 0.148 0.147
NFRC 0.117 0.113 0.120 0.114 0.121
PPFRC 0.077 0.071 0.083 0.078 0.082
Figure 5-2 represents the comparison between the experimental and empirical values
of LS. It can be observed that the LS obtained by using Eq 7 is closer to that of
experimental value as compared to the values of LS calculated by using Eq 5, Eq 6 or Eq
8. This shows that a strong correlation exists between the splitting-tensile pre-crack
absorbed energy (SPE) and LS of a material. There is a good agreement between the
75
100
125
PC JFRC NFRC PPFRC
Per
centa
ge
Experimental
Eq 5 Eq 6 Eq 7 Eq 8Eq 8
Figure 5-2 Comparison of values of LS of PC, JFRC, NFRC, and PPFRC obtained
from experimental tests, Eq 5, Eq 6, Eq 7, and Eq 8

45
experimental and empirical values of LS. The percentage errors of 3%-20%, 3%-8%, 1%-
6%, and 2%-7% are observed for Eq 5, Eq 6, Eq 7, and Eq 8, respectively.
5.3 Relationship between material properties and canal-lining
performance
The rate of cracking in concrete canal-lining can be related to number of factors like
shrinkage, water absorption, permeability, differential settlement, and tensile strength, etc.
(Cui et al. 2013). Cracking due to shrinkage can be avoided if the tensile stresses induced
by shrinkage are less than the tensile strength of concrete. This shows that the tensile
strength of concrete has a key role in controlling its shrinkage cracks. An increase in the
rate of water absorption of concrete canal-lining increases its rate of deterioration
(Reinhardt 1997). The differential settlement of concrete structure introduces the bending
stresses into it. The cracking due to differential settlement can be avoided if the flexural
strength of concrete also known as bend strength exceeds the bending stresses. So, the
role of flexural strength of concrete in controlling the rate of cracking due to bending is
also required to be considered. The brittle characteristic of concrete is also one of the
causes that contribute in increasing the rate of cracking. For this reason, it is required to
increase the toughness and post-crack energy absorption of concrete in order to get
ductile/tough mode of failure. So, it is important to explore materials in terms of less
shrinkage and water absorption along with the better mechanical properties (especially
tensile and flexural strengths and toughnesses) for reducing the rate of cracking in canal-
lining.
In present study, the experimental behaviors of PC, JFRC, NFRC, and PPFRC for
controlling the rate of cracking in canal-lining are examined. The PPFRC shows higher
values of compressive, splitting-tensile, and flexural strengths as compared to that of other
investigated materials. An increase in CTI, STI, FTI, STE, and FTE of PPFRC is also
observed as compared to that of other investigated materials. The reduced values of WA
and LS are observed in case of PPFRC as compared to that of other investigated materials.
So, in the case of PPFRC, the rate of cracking in canal-lining can be less, conclusively it
is highly likely to improve the performance of canal-lining in terms of reduced water
46
losses. Improved ductility of canal-section is also expected in case of PPFRC as compared
to other materials due to increased values of toughnesses of PPFRC. It is also important to
mention that NFRC and JFRC also showed improved values of CTI, STI, FTI, CTE, and
FTE as compared to that of PC. This shows that the use of JFRC and NFRC can be a good
choice as compared that of PC due to their better post-crack behavior and high post-crack
energy absorption capabilities.
5.4 Summary
Empirical relations are developed between WA/LS and each of the CS, SS, SPE, and
FPE with the help of experimental data because of their mutual coherence in studied
parameters. A good relation among the experimental and empirical values is found i.e. an
error of as low as 0.4% and as high as 20% is observed. A strong relation between the
material properties and the performance of canal-lining has been discussed. A significant
role of different types of material properties in controlling the different types of possible
cracks in concrete canal-lining is also discussed. As compared to PC, the FRCs are
expected to perform better in controlling the rate of cracking in canal-lining because of
their better post-crack behaviors and high post-crack energy absorption capabilities. As
per the final recommendations, PPFRC is expected to be more effective for performance
improvement of canal-lining as compared to other investigated materials.

47
CHAPTER 6
CONCLUSIONS AND RECCOMENDATIONS
6.1 Conclusions
The various types of FRCs, which can improve the performance of canal-lining by
decreasing the rate of cracking, are discussed. Artificial and natural fibers can play a vital
role in improvement of mechanical properties of concrete. In this study, the experimental
behaviors of jute, nylon, and polypropylene fiber reinforced concrete (JFRC, NFRC, and
PPFRC, respectively) are explored in order to check their suitability to control the rate of
cracking in canal-lining. The considered parameters for material properties include
compressive, splitting-tensile, and flexural strengths, water absorption, and linear
shrinkage. The properties of PC are taken as reference. The FRCs are prepared by the fiber
addition of 5% content, by mass of cement, and 50 mm length in the same mix design of
PC i.e. 1:3:1.5. Following characteristics are observed during the investigation:
➢ For the same ratio of water-cement, the slump of JFRC, NFRC, and PPFRC are
decreased by 61%, 36%, and 39%, respectively, than that of PC. The densities of
JFRC, NFRC, and PPFRC are reduced by 3%, 1%, and 0.6%, respectively, in
comparison to that of PC.
➢ As compared to compressive strength (CS) of PC, the CS of JFRC and NFRC are
decreased by 36% and 31%, respectively, and that of PPFRC is improved by 1%. As
compared to splitting-tensile strength (SS) of PC, the SS of JFRC and NFRC shows
a decrease of 19% and 10%, respectively, and an improvement of 5% is observed in
SS of PPFRC. An improvement of 8%, 10%, and 34% is observed in modulus of
rupture of JFRC, NFRC, and PPFRC, respectively, as compared to that of PC.
➢ An improvement of 87%, 127%, and 107% is observed in compressive total absorbed
energy of JFRC, NFRC, and PPFRC, respectively, than that of PC. As compared to
splitting-tensile total absorbed energy (STE) of PC, a decrease of 37% and 21% is
observed in STE of JFRC and NFRC, respectively, and an increase of 11% is
observed in the STE of PPFRC. And an increase of 53%, 68%, and 100%, in flexural

48
total absorbed energy of JFRC, NFRC, and PPFRC, respectively, is observed in
comparison to that of PC.
➢ The enhancement of 124%, 127%, and 148% is observed in compressive toughness
index of JFRC, NFRC, and PPFRC, respectively, than that of PC. An enhancement
of 2%, 2%, and 3% is observed in splitting-tensile toughness index of JFRC, NFRC,
and PPFRC, respectively, than that of PC. And by comparing to that of PC, an
enhancement of 86%, 91%, and 99% is noticed in flexural toughness index of JFRC,
NFRC, and PPFRC, respectively.
➢ As compared to water absorption (WA) of PC, an increase of 8% and 1% is observed
in WA of JFRC and NFRC, respectively, and a decrease of 4% is observed in the WA
of PPFRC. Linear shrinkage ‘LS’ (% decrease) of JFRC and NFRC is 67% and 30%,
respectively, more than that of PC. While LS (% decrease) of PPFRC is 15% less than
that of PC.
➢ Empirical relations have been developed with the help of experimental data for
prediction of WA and LS. The relationship between WA/LS and each of the CS, SS,
SPE, and FPE are made because of their observed mutual coherence in experimental
outcomes. There is a good agreement between the experimental and empirical values.
The percentage error is 0.4%-20%.
Based on the outcomes and examined behaviors, JFRC, NFRC, and PPFRC are likely
to be effective in controlling the rate of cracking in canal-lining. Among the investigated
types of FRCs, PPFRC is likely to be more effective in controlling the rate of cracking in
canal-lining because of the highest improvement in most of the investigated properties as
compared to other studied materials.
6.2 Recommendations
Following are the recommendations:
➢ Performance of the prototype model of canal section made with PPFRC is necessary
in comparison to that with PC in order to proceed towards its practical applications.
➢ The cost-effective analysis of PC and PPFRC for application of canal-lining needs to
be investigated.

49
➢ Behavior of fresh FRC in standard tests e.g. slump cone test and compaction factor
tests etc. keeping in mind its placement in canal-lining.

50
REFERENCES
Ali, M. (2014). Seismic performance of coconut-fibre-reinforced-concrete columns with
different reinforcement configurations of coconut-fibre ropes. Construction and
Building Materials, 70, 226-230.
Ali, M. (2016). Use of coconut fibre reinforced concrete and coconut-fibre ropes for
seismic-resistant construction. Materiales de Construcción, 66(321), 073.
Al-Oraimi, S. K., & Seibi, A. C. (1995). Mechanical characterisation and impact
behaviour of concrete reinforced with natural fibers. Composite Structures, 32(1-4),
165-171.
Al-Tayyib, A. J., Al-Zahrani, M. M., & Al-Sulaimani, G. J. (1988). Effect of
polypropylene fiber reinforcement on the properties of fresh and hardened concrete
in the Arabian Gulf environment. Cement and Concrete Research, 18(4), 561-570.
Arshad, M., Ahmad, N., Usman, M., & Shabbir, A. (2009). Comparison of water losses
between unlined and lined watercourse in Indus Basin of Pakistan. Pakistan Journal
Agriculture Sciences, 46(4), 2076-0906.
ASTM C39 / C39M-17, Standard Test Method for Compressive Strength of Cylindrical
Concrete Specimens, ASTM International, West Conshohocken, PA,
2017, www.astm.org
ASTM C143 / C143M-15a, Standard Test Method for Slump of Hydraulic-Cement
Concrete, ASTM International, West Conshohocken, PA, 2015, www.astm.org
ASTM C157 / C157M-08(2014)e1, Standard Test Method for Length Change of
Hardened Hydraulic-Cement Mortar and Concrete, ASTM International, West
Conshohocken, PA, 2014, www.astm.org
ASTM C293 / C293M-16, Standard Test Method for Flexural Strength of Concrete
(Using Simple Beam with Center-Point Loading), ASTM International, West
Conshohocken, PA, 2016, www.astm.org

51
ASTM C496 / C496M-11, Standard Test Method for Splitting Tensile Strength of
Cylindrical Concrete Specimens, ASTM International, West Conshohocken, PA,
2004, www.astm.org
ASTM C531-00(2012), Standard Test Method for Linear Shrinkage and Coefficient of
Thermal Expansion of Chemical-Resistant Mortars, Grouts, Monolithic Surfacings,
and Polymer Concretes, ASTM International, West Conshohocken, PA, 2012,
www.astm.org
ASTM C642-13, Standard Test Method for Density, Absorption, and Voids in Hardened
Concrete, ASTM International, West Conshohocken, PA, 2013, www.astm.org
Aziz, M. A., Paramasivam, P., & Lee, S. L. (1981). Prospects for natural fiber reinforced
concretes in construction. International Journal of Cement Composites and
Lightweight Concrete, 3(2), 123-132.
Badenhorst, J. W., De Lange, M., Mokwena, M. E., & Rutherford, R. J. (2002). Water
conservation and water demand management in agriculture: development of water
management plans by irrigation water suppliers in South Africa. ICID Eighteenth
Congress Best Paper for 6th Hassan Ismail Award Paper, Montreal.
Banthia, N. (2010). Report on the physical properties and durability of fiber-reinforced
concrete. ACI 544.5 R-10, Reported by ACI Committee 544, 1-3.
Basheer, L., Kropp, J., & Cleland, D. J. (2001). Assessment of the durability of concrete
from its permeation properties: a review. Construction and Building
Materials, 15(2), 93-103.
Bayasi, Z., & Zeng, J. (1993). Properties of polypropylene fiber reinforced
concrete. Materials, 90(6), 605-610.
Bei-xing, L., Ming-xiang, C., Fang, C., & Lu-ping, L. (2004). The mechanical properties
of polypropylene fiber reinforced concrete. Journal of Wuhan University of
Technology--Materials Science Edition, 19(3), 68-71.
Bentur, A., & Diamond, S. (1984). Fracture of glass fiber reinforced cement. Cement
and Concrete Research, 14(1), 31-42.

52
Bofang, Z. (2013). Thermal stresses and temperature control of mass concrete.
Butterworth-Heinemann.
Chandar, S. P. and Balaji, C. J. (2015). Experimental study on the mechanical properties
of concrete mixed with jute fiber and steel fiber. International Research Journal of
Engineering and Technology, 1(2),77-82.
Cook, D. J., Pama, R. P., & Weerasingle, H. L. S. D. (1978). Coir fiber reinforced
cement as a low cost roofing material. Building and Environment, 13(3), 193-198.
Cook, J. G. (1984). Handbook of Textile Fibers, Morrow Publishing Company, Ltd.,
Durham, England, 261-283.
Cui, J. H., Xie, Z. Q., & Xiao, H. J. (2013). Cause analysis on the cracks in concrete
plate of canal lining. Applied Mechanics and Materials, 405, 2596-2599.
Fang, H. G., Liu, P. H., & Zhang, T. (2011). Experimental investigation on the
polypropylene fiber concrete performance of yellow river canal lining in the middle
line of South-to-North water transfer project. Applied Mechanics and Materials, 52,
1987-1991.
Galanti, A. V. (1964). Polypropylene fibers. M.Sc. thesis, Department of chemical
engineering, Newark college of engineering, New Jersey.
Goldfein, S. (1965). Fibrous reinforcement for portland cement. Modern Plastics, 42(8),
156-160.
Gupta, N. D., Paramasivam, P., & Lee, S. L. (1978). Mechanical properties of coir
reinforced cement paste composites. Housing Science, 2(6), 391-406.
Irrigation Research Institute. (1992). Studies on water losses from watercourses and
their lining measures. Lahore, Pakistan.
Ismail, M. A. (2007). Compressive and tensile strength of natural fiber-reinforced
cement base composites. Al-Rafidain Eng, 15(2), 42-51.
Jagannathan, S., Rangasamy, S., & Kumarasamy, K. (2016). An experimental
investigation on nylon fibre (textile waste) reinforced concrete. Journal of Recent
Research and Applied Studies, 3(15), 70-74.

53
James, I. D., Gopalaratnam, V. S., & Galinat, M. A. (2002). State-of-the-art report on
fiber reinforced concrete. Manual Concrete Practice, 21, 2-66.
Joshi, S. V., Drzal, L. T., Mohanty, A. K., & Arora, S. (2004). Are natural fiber
composites environmentally superior to glass fiber reinforced
composites?. Composites Part A: Applied Science and Manufacturing, 35(3), 371-
376.
Kahlown, M. A., & Kemper, W. D. (2005). Reducing water losses from channels using
linings: Costs and benefits in Pakistan. Agricultural Water Management, 74(1), 57-
76.
Kakooei, S., Akil, H. M., Jamshidi, M., & Rouhi, J. (2012). The effects of
polypropylene fibers on the properties of reinforced concrete structures. Construction
and Building Materials, 27(1), 73-77.
Kasali, M.Y., & Ogunlela, A.O. (2014). Evaluation of the strength of some potential
local irrigation canal lining materials from moisture-density relationship. Ethiopian
Journal of Environmental Studies & Management, 7(4), 445-451.
Karad, M. M., Panke, R. A., & Hangargekar, P. A. (2013). Seepage losses through
canals & minors. International Journal of Engineering Research and Technology,
2(11), 1125-1134.
Kene, K. S., Vairagade, V. S., & Sathawane, S. (2012). Experimental study on behavior
of steel and glass fiber reinforced concrete composites. Bonfring International
Journal of Industrial Engineering and Management Science, 2(4), 125.
Khajuria, A., Bohra, K., & Balaguru, P. (1991). Long-term durability of synthetic fibers
in concrete. Durability of Concrete. Second International Conference, 2, 126-46.
Khan, M., & Ali, M. (2016). Use of glass and nylon fibers in concrete for controlling
early-age micro cracking in bridge-decks. Construction and Building Materials, 125,
800-808.

54
Kundu, S. P., Chakraborty, S., Roy, A., Adhikari, B., & Majumder, S. B. (2012).
Chemically modified jute fiber reinforced non-pressure (NP) concrete pipes with
improved mechanical properties. Construction and Building Materials, 37, 841-850.
Kraatz, D. B. (1980). Irrigation Canal Lining. China Water Power Press, China.
Kraatz, D. B. (1975). Reduction in conveyance losses in sandy soils. Soils Bull Food
Agric Organ UN.
Krishnamurthy, K., & Rao, S. (1969). Theory and experiment in canal seepage
estimation using radioisotopes. Journal of Hydrology, 9(3), 277-293.
Kumar, R., Goel, P., & Mathur, R. (2013). Suitability of concrete reinforced with
synthetic fiber for the construction of pavements. Proceedings of the 3rd
International Conference on Sustainable Construction Materials and Technologies.
Kyoto Research Park, Kyoto, Japan, August 18-21. Paper e197.
Lewis, G. and Mirihagalia, P. (1979). Natural vegetable fibers as reinforcement in
cement sheets. Magazine of Concrete Research, 31(107), 104-8.
Lim, C. C., Gowripalan, N., & Sirivivatnanon, V. (2000). Microcracking and chloride
permeability of concrete under uniaxial compression. Cement and Concrete
Composites, 22(5), 353-360.
Liu, B., Zhang, L. Z., Liu, Q. X., & Ji, T. (2013). Study on behaviors of jute fiber
reinforced cement based materials. Applied Mechanics and Materials, 253, 508-511.
Luthra, S. D. L. (1980). Conveyance losses in lined irrigation canal systems—A brief
review. Water and Energy International, 37(3), 329-336.
Mansur, M. A., & Aziz, M. A. (1982). A study of jute fiber reinforced cement
composites. International Journal of Cement Composites and Lightweight
Concrete, 4(2), 75-82.
Merta, I., & Tschegg, E. K. (2013). Fracture energy of natural fiber reinforced
concrete. Construction and Building Materials, 40, 991-997.
Montañes, J. L. (2006). Hydraulic canals: design, construction, regulation and
maintenance. Hydraulic canals: design, construction, regulation and maintenance.

55
Michael, A. M. (1978). Irrigation: Theory and Practice. Vikas publishing house.
Ozomaka, O. J. (1976). Characteristics of akwara as a reinforcing fiber. Magazine of
Concrete Research, 28(96), 162-1-67.
OPSS LS-435, Method of Test for Linear Shrinkage of Concrete, Ministry of
transportation, Ontario Laboratory Testing Manual, 2001.
Racines, P. G., & Pama, R. P. (1978). A study of bagasse fiber-cement composite as
low-cost construction materials. Proceedings International Conference on Materials
for Developing Countries, 191-206.
Raja, R. K., Kumar, A., & Chhabra, S. S. (1983). Estimation of seepage losses from an
unlined channel-a field study by nuclear techniques, proceeding, Volume II—
Hydraulics, CBIP. Fiftieth Annual Research and Development Session. Simla,
Himachala Pradesh.
Rajguru, R. S., Ghode, A. R., Pathan, M. G., & Rathi, M. K. (2014). Effect of volume
fraction of polypropylene fiber on mechanical properties of concrete. International
Journal of Engineering Research and Applications, 1(4), 67-69.
Ramakrishna, G., & Sundararajan, T. (2005). Impact strength of a few natural fiber
reinforced cement mortar slabs: a comparative study. Cement and Concrete
Composites, 27(5), 547-553.
Ramaswamy, H. S., Ahuja, B. M., & Krishnamoorthy, S. (1983). Behaviour of concrete
reinforced with jute, coir and bamboo fibers. International Journal of Cement
Composites and Lightweight Concrete, 5(1), 3-13.
Ramezanianpour, A. A., Esmaeili, M., Ghahari, S. A., & Najafi, M. H. (2013).
Laboratory study on the effect of polypropylene fiber on durability, and physical and
mechanical characteristic of concrete for application in sleepers. Construction and
Building Materials, 44, 411-418.
Ramujee, K. (2013). Strength properties of polypropylene fiber reinforced
concrete. International Journal of Innovative Research in Science, Engineering and
Technology, 2(8), 3409-3413.

56
Reinhardt, H. E. (Ed.). (1997). Penetration and permeability of concrete: barriers to
organic and contaminating liquids (Vol. 16). CRC Press.
Rice, E. K., Vondran, G. L., & Kunbargi, H. O. (1987). Bonding of fibrillated
polypropylene fibers to cementitious materials. MRS Online Proceedings Library
Archive, 114.
Rostami, V., Shao, Y., & Boyd, A. J. (2011). Durability of concrete pipes subjected to
combined steam and carbonation curing. Construction and Building
Materials, 25(8), 3345-3355.
Saadun, A., Mutalib, A. A., Hamid, R., & Mussa, M. H. (2016). Behaviour of
polypropylene fiber reinforced concrete under dynamic impact load. Journal of
Engineering Science and Technology, 11(5), 684-693.
Salyer, I. O., Ball, G. L., Usmani, A. M., & Workminister, D. W. (1975). Development
of low cost roofings from indigenous materials of developing nations. AID/US, 190.
Sharma, H. D., & Chawla, A. S. (1975). Manual of canal lining. Technical Report No.
l4. Central Board of Irrigation and Power New Delhi.
Shakor, P. N., & Pimplikar, S. S. (2011). Glass fibre reinforced concrete use in
construction. International Journal of Technology and Engineering System, 2(2),
632-634.
Singh, T. P. (1975). Structural properties of fiber reinforced concrete. M.Sc. Thesis,
Dept. of Civil Eng, University of Roorkee, India.
Siraskar, K. A., & Kumar, S. (1972). Fiber reinforcement for shatter proofness of
concrete. Proceedings Symposium on Modern Trends in Civil Engineering,
University of Roorkee, India, 254-59.
Sridhara, S., Kumar, S., & Sinare, M. A. (1971). Fiber reinforced concrete. Indian
Concrete Journal, 45(10), 428-30, 433.
Subramanian E. S., Vaishnave V.R., and Vignesh V.T.S. (2016). Experimental
investigation of concrete composites using nylon fiber. International Journal of
Engineering Sciences & Research Technology, 5(12), 998-1002.

57
Swift, D. G., & Smith, R. B. L. (1979). The flexural strength of cement-based
composites using low modulus (sisal) fibers. Composites, 10(3), 145-148.
Swihart, J., & Haynes, J. (2002). Canal-lining demonstration project year 10 final report.
Tavakoli, M. (1994). Tensile and compressive strengths of polypropylene fiber
reinforced concrete. Special Publication, 142, 61-72.
Thakur, V. K., Thakur, M. K., & Gupta, R. K. (2014). Graft copolymers of natural fibers
for green composites. Carbohydrate Polymers, 104, 87-93.
USBR. (1978). Drainage Manual. A water resources technical publication, US
Government Printing Office: Denver, Colorado, second printing; 287.
Vairagade, V., Kene, K., & Deshpande, N. (2012). Investigation of compressive and
tensile behavior of fibrillated polypropylene fibers reinforced concrete. International
Journal of Engineering Research and Applications, 2(3), 1111-1115.
Vitkar, A., Kawde, P., Mavchi, S., & Kuwar, P. (2017). Experimental study of jute fiber
with optimum replacement of natural sand with artificial sand. International
Research Journal of Engineering and Technology, 4(4), 3313-3316.
Wambua, P., Ivens, J., & Verpoest, I. (2003). Natural fibers: can they replace glass in
fiber reinforced plastics?. Composites Science and Technology, 63(9), 1259-1264.
Wang, Y., Backer, S., & Li, V. C. (1987). An experimental study of synthetic fiber
reinforced cementitious composites. Journal of Materials Science, 22(12), 4281-
4291.
Won, J. P., Park, C. G., Lee, S. W., Jang, C. I., & Won, C. (2008). Effect of crimped
synthetic fibre surface treatments on plastic shrinkage cracking of cement-based
composites. Magazine of Concrete Research, 60(6), 421-427.
Zhou, X., Ghaffar, S. H., Dong, W., Oladiran, O., & Fan, M. (2013). Fracture and impact
properties of short discrete jute fiber-reinforced cementitious composites. Materials
& Design, 49, 35-47.
58
Zakaria, M., Ahmed, M., Hoque, M. M., & Islam, S. (2016). Scope of using jute fiber
for the reinforcement of concrete material. Textiles and Clothing Sustainability, 2(1),
11.
Zollo, R. F. (1984). Collated fibrillated polypropylene fibers in FRC. Special
Publication, 81, 397-410.

59
ANNEXURES
Annexure A Compressive stress-strain curves and tested samples of PC, JFRC, NFRC, and
PPFRC (i.e. remaining specimens)
PC JFRC NFRC PPFRC
Fir
st c
rack
Cra
cks
at t
he
pea
k l
oad
Cra
cks
at t
he
ult
imat
e lo
ad
Figure A1 Development of cracks in the cylindrical specimens of PC, JFRC,
NFRC, and PPFRC under compressive load
Figure A2 Stress-strain curves of PC, JFRC, NFRC, and PPFRC for compressive
strength tests
0
4
8
12
16
0.00 0.02 0.04 0.06 0.08 0.10
Co
mpre
ssiv
e st
ress
(M
Pa)
Strain (-)
PC
JFRC
NFRC
PPFRC

60
Annexure B Splitting-tensile load-time curves and tested samples of PC, JFRC, NFRC, and
PPFRC (i.e. remaining specimens)
PC JFRC NFRC PPFRC
Fir
st c
rack
Cra
cks
at t
he
pea
k l
oad
Cra
cks
at t
he
extr
eme
load
Figure B1 Development of cracks in the cylindrical specimens of PC, JFRC, NFRC,
and PPFRC under splitting-tensile load
Figure B2 Load-time histories of PC, JFRC, NFRC, and PPFRC from the tests of SS
0
40
80
120
0 100 200 300 400
Splitt
ing
-ten
sile
lo
ad (
kN
)
Time (s)
PC
JFRC
NFRC
PPFRC
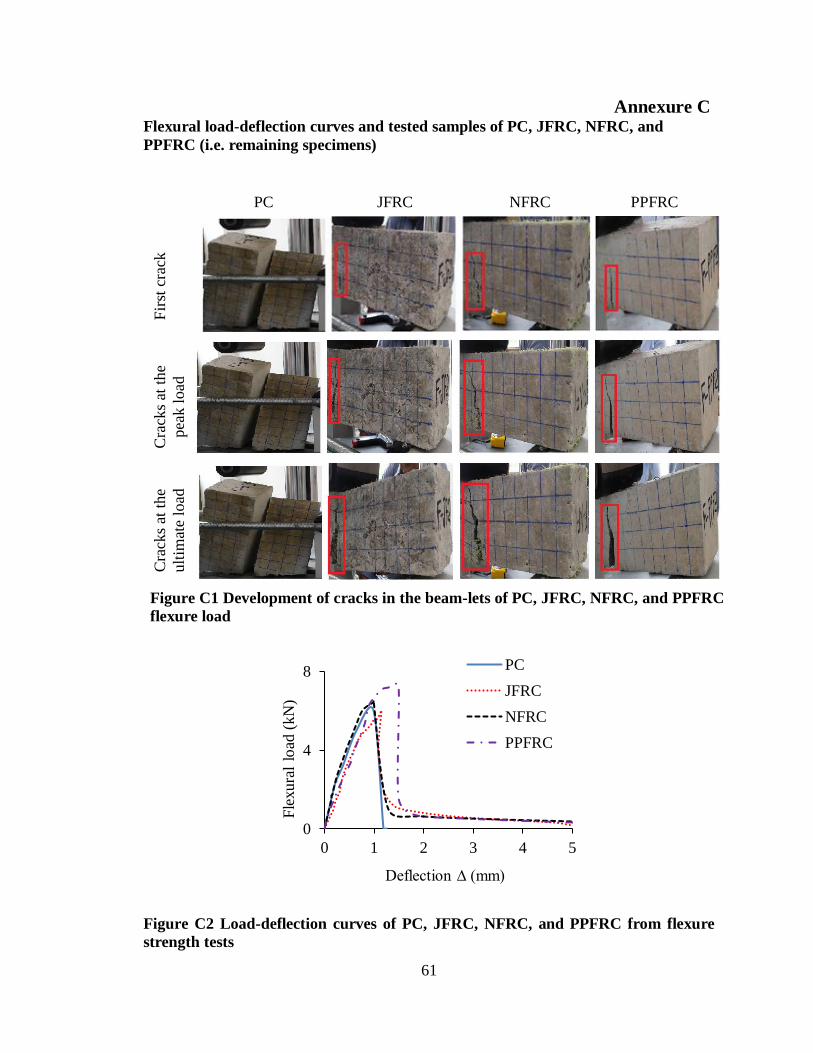
61
Annexure C
Flexural load-deflection curves and tested samples of PC, JFRC, NFRC, and
PPFRC (i.e. remaining specimens)
PC JFRC NFRC PPFRC
Fir
st c
rack
Cra
cks
at t
he
pea
k l
oad
Cra
cks
at t
he
ult
imat
e lo
ad
Figure C1 Development of cracks in the beam-lets of PC, JFRC, NFRC, and PPFRC
flexure load
Figure C2 Load-deflection curves of PC, JFRC, NFRC, and PPFRC from flexure
strength tests
0
4
8
0 1 2 3 4 5
Fle
xura
l lo
ad (
kN
)
Deflection ∆ (mm)
PC
JFRC
NFRC
PPFRC

![Modulehandbook Civil, Geo and Environmental Engineering … · [MW2412] Spacecraft Technology 1 (ESPACE) [SCT 1 (ESPACE)] Modules 3. Semester Specialization Subjects Specialization](https://img.pdfslide.us/doc/110x75/60a430d006548c2cad18d628/modulehandbook-civil-geo-and-environmental-engineering-mw2412-spacecraft-technology.jpg)


![[Ths]2012 bd-00-civil structures](https://img.pdfslide.us/doc/110x75/54bc1d404a79594f698b45d1/ths2012-bd-00-civil-structures.jpg)