Embed Size (px)
Citation preview

AN INVESTIGATION INTO THE BUSINESS ENVIRONMENT OF SMALL, MEDIUM AND MICRO INDEPENDENT CATERERS IN CAPE
TOWN
by
Jocelyn Lawrence
submitted in accordance with the requirements
for the degree of
MASTER OF COMMERCE
in the subject
BUSINESS MANAGEMENT
at the
UNIVERSITY OF SOUTH AFRICA
Supervisor: Prof S. Rudansky-Kloppers
August 2020

i
DECLARATION
I declare that this dissertation entitled “An Investigation into the Business
Environment of Small, Medium and Micro Independent Caterers in Cape Town”
is my own work and that all the sources that I have used or quoted have been indicated
and acknowledged by means of complete references.
I further declare that I submitted the dissertation to originality checking software and
that it falls within the accepted requirements for originality.
I further declare that I have not previously submitted this work, or part of it, for
examination at Unisa for another qualification or at any other higher education
institution.
18 August 2020
Mrs. J Lawrence Date

ii
ACKNOWLEDGEMENTS
I would like to express my sincere thanks and gratitude to my supervisor, Professor
Sharon Rudansky-Kloppers. Your clear guidance and direction and your insightful and
knowledgeable comments and advice were of tremendous value and benefit to me
throughout the dissertation and I learned a great deal. I also greatly appreciated your
quick response to the submission of chapters and queries and your continual support
of and commitment to my research project.
A very special thank you goes to Dr Marthi Pohl. Thank you so much for your
willingness to assist me with the statistical analysis. I am very grateful. Thank you also
for your expert guidance in this field. It is deeply appreciated.
I would like to thank Dr Dion van Zyl for his valuable input into the questionnaire and
early data analysis. Thank you also to Diederik van Zyl for his assistance with the
online survey.
I thank Retha Burger for her excellent editing of the dissertation.
To my husband, Colin and daughter Joëlle, thank you very much for your
encouragement and support during this time.
Last, but not least, I would like to give honour and praise to God for His grace and
mercy throughout my studies.
.

iii
ABSTRACT
The environment in which a business operates consists of various forces which exert
positive or negative influences on the business. Since they contribute to or deter from
the achievement of business objectives, it is essential that they be identified and
investigated. The aim of this study was to determine the environmental forces which
affect the operations of small, medium and micro independent caterers in Cape Town.
In this context, the micro, market and macro-environments were examined. It is hoped
that the results of the study will assist these caterers in their awareness of pertinent
factors in their business environment, as well as the strengths, weaknesses,
opportunities and threats arising therein. They can use this information in strategy
development, to reach their objectives, and to enhance their competitive advantage
and profitability.
Primary data was collected from the business owners or managers through an online
survey. The survey covered firmographic business details, as well as demographic
details of the owners/managers. Thereafter, their opinions were elicited regarding the
impact of various factors in their business environment. The main findings are the
following: The greatest positive impacts on the small, medium and micro independent
caterers are the abilities of the owners/managers, relationships with suppliers, the
internet, and the control of materials and production processes. The greatest
challenges faced are financial resources, marketing strategies, online services,
competitors, customer demands, the current state of the economy and legal
regulations.
Keywords: Business environment, Environmental forces, Micro-environment, Market
environment, Macro-environment, SWOT analysis, Small and Medium Enterprises
(SMEs), Small, Medium and Microenterprises (SMMEs), Small, Medium and Micro
Independent Caterers (SMMICs), Cape Town, South Africa

iv
OPSOMMING
Die omgewing waarin 'n onderneming werksaam is, bestaan uit verskeie magte wat
die onderneming positief of negatief kan beïnvloed. Aangesien dit tot die onderneming
se doelstellings kan bydra of keer dat die onderneming dit bereik, is dit noodsaaklik
dat dit geïdentifiseer en ondersoek word. Die doel van hierdie studie was om die
omgewingsmagte te bepaal wat die werksaamhede van klein, medium en mikro-
onafhanklike spyseniers in Kaapstad beïnvloed. In hierdie konteks is die mikro-, mark-
en makro-omgewings ondersoek. Die hoop is dat die bevindings van die studie hierdie
spyseniers sal help om bewus te wees van die toepaslike faktore in hul sakeomgewing
asook hul sterkpunte, swakpunte, geleenthede en bedreigings wat daarin tot stand
kom. Hulle kan hierdie inligting gebruik om 'n strategie te ontwikkel om hul doelstellings
te bereik en hul mededingingsvoorsprong en winsgewendheid te bevorder.
Primêre data is van sake-eienaars of -bestuurders verkry deur 'n aanlyn opname. Die
opname het die onderneming se firmografiese besonderhede asook die
eienaars/bestuurders se demografiese besonderhede gedek. Daarna is hul menings
oor die invloed van verskeie faktore in hul sakeomgewing gevra. Die volgende is
bevind: Die grootste positiewe invloede op klein, medium en mikro-onafhanklike
spyseniers is die eienaars/bestuurders se vermoëns, verhoudings met verskaffers, die
internet en die beheer van materiale en produksieprosesse. Die grootste uitdagings
was finansiële hulpbronne, bemarkingstrategieë, aanlyn dienste, mededingers, klante
se eise, die huidige stand van die ekonomie en wetlike regulasies.
Sleutelwoorde: Sakeomgewing, Omgewingsmagte, Mikro-omgewing,
Bemarkingsomgewing, Makro-omgewing, SWOT-ontleding, Klein en medium
ondernemings (KMOs), Klein, medium en mikro-ondernemings (KMMOs), Klein,
medium en mikro-onafhanklike spyseniers (KMMOSs), Kaapstad, Suid-Afrika

v
ISISHWANKATHELO
Indawo eliqhubeka kuyo ishishini inamasolotya amaninzi asenokuba nefuthe elihle
okanye elibi kwishishini elo. Njengoko la masolotya encedisa okanye ethintela
ukuphunyezwa kweenjongo zeshishini, kubalulekile ukuba anakanwe kwaye
aphandwe. Injongo yesi sifundo yayikukuphonononga amanqanaba achaphazela
ukusebenza kwamashishini okupheka azimeleyo, amancinci, aphakathi namancinci
kakhulu eKapa. Kule meko, kwaqwalaselwa iindawo zokusebenza ezincinci kakhulu,
ezinkulu kakhulu neemarike. Kuthenjwa ukuba iziphumo zesi sifundo ziya kubanceda
oosomashishini bokupheka ukuze baqaphele imibandela ebalulekileyo malunga
nomsebenzi wabo, baqonde amandla, ubuthathaka kunye namathuba avelayo kolu
shishino. Bangalusebenzisa olu lwazi ekuqulunqeni amacebo obulumko okuphumeza
iinjongo zabo kunye nokomeleza amathuba abo okuphumelela kukhuphiswano
nokwenza inzala.
Kwenziwa uhlolo zimvo kusetyenziswa i-intanethi ekuqokeleleni ulwazi ngqo kubanini
nabaphathi bamashishini. Olu hlolo zimvo lwaqwalasela iinkcukacha ezingundoqo
zamashishini kwakunye nesibalo sabanini/abaphathi bamashishini. Emva koko,
kwafunwa izimvo zabo malunga nefuthe lemiba ethile kwiindawo zabo zoshishino.
Okuphambili okwafunyaniswayo koku: Okona kukhulu okuchaphazela kakuhle
amashishini okupheka azimeleyo amancinci, aphakathi namancinci kakhulu
ngamandla okuba nakho abanini/abaphathi, ulwalamano nabo bathengisa izixhobo
zokuqhuba ishishini, i-intanethi, kunye nolawulo lweenkqubo zokuvelisa. Eyona
mingeni iphambili yimithombo yemali, amacebo okubhengeza ishishini, iinkonzo
zokuthenga ngeintanethi, abakhuphisani, izinyanzeliso zabaxumi, isimo sezoqoqosho
esigqubayo kwakunye nemigaqo yomthetho.
Amagama aphambili: Isimo esigqonge ushishino, Iimeko ezingqongileyo, Isimo
esingqonge ishishini elincinci kakhulu, Isimo esingqonge ukubhegeza ishishini, Isimo
esingqonge ishishini elikhulu kakhulu, uhlalutyo lwamandla nobuthathaka (i-SWOT),
Amashishini Amancinci Naphakathi (iiSMEs), Amashishini Amancinci, Aphakathi

vi
TABLE OF CONTENTS
DECLARATION ..................................................................................................................... i
ACKNOWLEDGEMENTS ..................................................................................................... ii
ABSTRACT ....................................................................................................................... iii
OPSOMMING ....................................................................................................................... iv
ISISHWANKATHELO ........................................................................................................... v
TABLE OF CONTENTS ....................................................................................................... vi
LIST OF FIGURES ................................................................................................................ x
LIST OF TABLES ............................................................................................................... xii
LIST OF ABBREVIATIONS AND ACRONYMS ................................................................. xiv
CHAPTER 1: BACKGROUND AND PROBLEM STATEMENT ............................................ 1
1.1 INTRODUCTION ................................................................................................... 1
1.2 BACKGROUND TO THE STUDY ......................................................................... 1
Cape Town .................................................................................................... 3
Motivation for the study .................................................................................. 4
1.3 LITERATURE REVIEW ......................................................................................... 4
The business environment ............................................................................. 5
Micro environment ......................................................................................... 5
Market environment ....................................................................................... 6
Macro environment ........................................................................................ 7
SWOT analysis .............................................................................................. 9
Challenges faced by SMEs/SMMEs in the business environment .................. 9
1.4 RESEARCH PROBLEM AND OBJECTIVES ...................................................... 10
1.5 LIMITATIONS OF THE STUDY ........................................................................... 11
1.6 RESEARCH DESIGN AND METHODOLOGY .................................................... 12
Primary research.......................................................................................... 12
Target population ......................................................................................... 13
Sample frame .............................................................................................. 13
Sampling method and size ........................................................................... 13
Data collection ............................................................................................. 14
Ethical considerations .................................................................................. 14
Data processing and analysis ...................................................................... 15
Research validity and reliability .................................................................... 16
1.7 CHAPTER OUTLINE ........................................................................................... 16
1.8 CONCLUSION .................................................................................................... 17
CHAPTER 2: SMMICS IN CAPE TOWN AS PART OF THE SOUTH AFRICAN HOSPITALITY INDUSTRY ........................................................................... 18
2.1 INTRODUCTION ................................................................................................. 18
2.2 THE HOSPITALITY INDUSTRY .......................................................................... 19

vii
Characteristics of the hospitality industry offering ......................................... 19
2.3 FOOD AND BEVERAGE SECTOR ..................................................................... 21
Nature of the food and beverage offering ..................................................... 22
Food and beverage statistics in South Africa ............................................... 23
Sub-sectors in the food and beverage sector ............................................... 25
Demand in the food and beverage sector .................................................... 26
Critical success factors in the food and beverage sector .............................. 30
2.4 CATERING SEGMENT OF THE FOOD AND BEVERAGE SECTOR ................. 31
Concept of catering ...................................................................................... 31
Brief history of catering ................................................................................ 32
Types of caterers ......................................................................................... 33
Catering industry in South Africa .................................................................. 38
2.5 SMALL, MEDIUM AND MICRO INDEPENDENT CATERERS (SMMICS) .......... 39
Nature of SMMICs ....................................................................................... 39
Business context of SMMICs ....................................................................... 40
Demand and supply with regard to SMMICs ................................................ 43
Quality assurance of SMMICs ...................................................................... 46
2.6 CONCLUSION .................................................................................................... 46
CHAPTER 3: THE BUSINESS ENVIRONMENT OF SMALL, MEDIUM AND MICRO INDEPENDENT CATERERS ........................................................................ 47
3.1 INTRODUCTION ................................................................................................. 47
3.2 THE NATURE OF THE BUSINESS ENVIRONMENT ......................................... 47
3.3 THE MICRO ENVIRONMENT ............................................................................. 49
Vision, mission and objectives ..................................................................... 49
Management functional areas ...................................................................... 51
Resources of the business ........................................................................... 60
3.4 THE MARKET ENVIRONMENT .......................................................................... 61
The market environment .............................................................................. 62
The competitive environment ....................................................................... 63
The supply environment ............................................................................... 67
The intermediary environment...................................................................... 69
3.5 THE MACRO ENVIRONMENT ............................................................................ 70
The socio-cultural environment .................................................................... 70
The technological environment .................................................................... 71
The economic environment .......................................................................... 73
The physical environment ............................................................................ 75
The political-legal environment..................................................................... 76
The international environment ...................................................................... 77
3.6 SWOT ANALYSIS ............................................................................................... 78
3.7 CONCLUSION .................................................................................................... 80
CHAPTER 4: RESEARCH METHODOLOGY ..................................................................... 81
viii
4.1 INTRODUCTION ................................................................................................. 81
4.2 CONCEPTUALISATION OF THE RESEARCH ................................................... 81
4.3 THE RESEARCH PROCESS .............................................................................. 81
Step 1: Identify and define problem .............................................................. 82
Step 2: Develop research objectives ............................................................ 83
Step 3: Select research design .................................................................... 83
Step 4: Conduct secondary research ........................................................... 88
Step 5: Select primary research method ...................................................... 88
Step 6: Determine sample frame .................................................................. 94
Step 7: Conduct pre-test .............................................................................. 95
Step 8: Collect data ...................................................................................... 96
Step 9: Process data .................................................................................... 97
Step 10: Data analysis ................................................................................. 98
Step 11: Develop and report findings and conclusions ............................... 102
4.4 RESEARCH ETHICS ........................................................................................ 102
4.5 CONCLUSION .................................................................................................. 103
CHAPTER 5: DESCRIPTIVE DATA ANALYSIS AND INTERPRETATION ...................... 104
5.1 INTRODUCTION ............................................................................................... 104
5.2 DESCRIPTIVE ANALYSIS OF THE RESEARCH FINDINGS ........................... 104
Firmographics ............................................................................................ 104
Demographics ............................................................................................ 113
The micro environment .............................................................................. 116
The market environment ............................................................................ 120
The macro environment ............................................................................. 126
Other factors .............................................................................................. 134
5.3 SUMMARY OF THE FINDINGS ........................................................................ 136
5.4 CONCLUSION .................................................................................................. 142
CHAPTER 6: INFERENTIAL DATA ANALYSIS AND INTERPRETATION ...................... 143
6.1 INTRODUCTION ............................................................................................... 143
6.2 EXPLORATORY FACTOR ANALYSIS ............................................................. 143
Micro-environment (General management) ................................................ 144
Market environment: Customers and competitors ...................................... 144
Market environment: Suppliers ................................................................... 145
Market environment: Intermediaries ........................................................... 146
Macro environment: Various factors ........................................................... 147
6.3 FACTOR DESCRIPTIVES ................................................................................. 149
6.4 RELATIONSHIP ANALYSIS ............................................................................. 151
6.5 DIFFERENCE TESTING ................................................................................... 155
Differences between the age groups and roles/positions of the owners/managers regarding impact of business environment factors ........ 155

ix
Differences between males and females regarding impact of business environment factors ................................................................................... 158
Differences between businesses located in houses versus business premises regarding impact of business environment factors ..................................... 161
Differences between small and very small businesses regarding impact of business environment factors .................................................................... 165
Differences between businesses that have actively maintained websites versus businesses that do not regarding impact of business environment factors . 169
6.6 CATEGORICAL PRINCIPAL COMPONENT ANALYSIS OF QUESTION 13 ... 173
Component descriptives ............................................................................. 175
Relationship analysis ................................................................................. 175
Difference testing ....................................................................................... 176
6.7 SUMMARY OF THE FINDINGS ........................................................................ 186
6.8 CONCLUSION .................................................................................................. 193
CHAPTER 7: CONCLUSIONS AND RECOMMENDATIONS ........................................... 194
7.1 INTRODUCTION ............................................................................................... 194
7.2 ADDRESSING THE RESEARCH AIM AND OBJECTIVES .............................. 194
7.3 FINDINGS, CONCLUSIONS AND RECOMMENDATIONS BASED ON THE ANALYSIS OF THE RESEARCH ...................................................................... 195
Firmographic profile of the SMMICs ........................................................... 195
Demographic profile of the respondents ..................................................... 196
Conclusions and recommendations related to the micro environment of SMMICs ..................................................................................................... 197
Conclusions and recommendations related to the market environment of SMMICs ..................................................................................................... 201
Conclusions and recommendations related to the macro environment of SMMICs ..................................................................................................... 205
Conclusions and recommendations related to the open-ended question .... 210
Conclusions and recommendations for questions 12, 13, 14, 15, 16, 17 .... 211
7.4 SYNCHRONISATION OF THE RESEARCH OBJECTIVES WITH THE FINDINGS AND RECOMMENDATIONS OF THE STUDY .................................................. 215
7.5 LIMITATIONS OF THE STUDY ......................................................................... 225
7.6 SUGGESTIONS FOR FURTHER RESEARCH ................................................. 225
7.7 CONCLUSION .................................................................................................. 226
LIST OF REFERENCES ................................................................................................... 228
APPENDICES ................................................................................................................... 240
APPENDIX A: ETHICAL CLEARANCE CERTIFICATE ................................................... 241
APPENDIX B: PARTICIPANT INFORMATION AND CONSENT FORM .......................... 243
APPENDIX C: QUESTIONNAIRE ..................................................................................... 248
APPENDIX D: FREQUENCY TABLES OF DESCRIPTIVE STATISTICS ......................... 257
APPENDIX E: MEAN RANKS TABLES ........................................................................... 301
APPENDIX F: DECLARATION OF PROFESSIONAL EDIT ............................................. 305

x
LIST OF FIGURES
Figure 1.1: The business environment of South African SMEs/SMMES ............................ 5
Figure 2.1: Progression from the hospitality industry to SMMICs ..................................... 18
Figure 2.2: Characteristics of the hospitality industry ....................................................... 20
Figure 2.3: Examples of food and beverages at restaurants or catering events ............... 22
Figure 2.4: Contribution of outlet types to food sales for December 2019 ........................ 24
Figure 2.5: Segmentation variables for consumer markets .............................................. 28
Figure 2.6: Critical success factors in the food and beverage sector ............................... 30
Figure 2.7: Scenes depicting the history of catering ........................................................ 32
Figure 2.8: Various types of catering operations ............................................................. 34
Figure 2.9: Off-premise catering model ........................................................................... 45
Figure 3.1: The business environment of SMMICs .......................................................... 48
Figure 3.2: Micro environment of small, medium and micro independent caterers .......... 49
Figure 3.3: Qualities of a successful caterer .................................................................... 51
Figure 3.4: Organisation chart of an off-premise caterer ................................................. 52
Figure 3.5: Marketing Cycle ............................................................................................ 54
Figure 3.6: Examples of locations used in off-premise catering events............................ 56
Figure 3.7: Example of a commercial kitchen .................................................................. 57
Figure 3.8: Catering staff ................................................................................................. 57
Figure 3.9: Examples of serving ware ............................................................................. 59
Figure 3.10: Categories of resources in an organisation ................................................... 60
Figure 3.11: The market environment of the business ....................................................... 61
Figure 3.12: The corporate and social markets of SMMICs ............................................... 63
Figure 3.13: Major factors offsetting market attractiveness................................................ 64
Figure 3.14: Map of the greater Cape Town area .............................................................. 65
Figure 3.15: Example of SMMICs in Cape Town promoting their offerings on their websites ........................................................................................................ 66
Figure 3.16: Examples of SMMICs in Cape Town highlighting areas of differentiation ...... 67
Figure 3.17: Web pages of food and catering equipment suppliers in Cape Town ............ 68
Figure 3.18: Macro-environment variables which impact SMMICs .................................... 70
Figure 3.19: 3D-food printing ............................................................................................. 72
Figure 3.20: South African inflation rate (2011 – 2019) ..................................................... 74
Figure 3.21: SWOT factors applicable to caterers ............................................................. 79
Figure 4.1: The research process .................................................................................... 82
Figure 4.2: Descriptors of the research design ................................................................ 84
Figure 4.3: Important aspects in the design and use of questionnaires ........................... 90
Figure 5.1: House vs business premises (n=112) .......................................................... 106

xi
Figure 5.2: Number of years in operation (n=112) ......................................................... 107
Figure 5.3: Forms of promotion (n=112) ........................................................................ 108
Figure 5.4: Category of business according to size (n=109) .......................................... 109
Figure 5.5: Associations (n=112) ................................................................................... 110
Figure 5.6: Role or position in the business (n=112) ..................................................... 113
Figure 5.7: Number of years in role or position (n=112) ................................................. 114
Figure 5.8: Gender (n=112) ........................................................................................... 115
Figure 5.9: Age group (n=112) ...................................................................................... 115
Figure 5.10: Mission, vision and objectives (n=112) ........................................................ 116
Figure 5.11: Qualities of the owner/manager (n=112) ..................................................... 117
Figure 5.12: Functional areas and resources (n=112) ..................................................... 118
Figure 5.13: Customers (n=112) ..................................................................................... 121
Figure 5.14: Competitors (n=112) ................................................................................... 122
Figure 5.15: Suppliers (n=112) ........................................................................................ 123
Figure 5.16: Intermediaries (n=112) ................................................................................ 125
Figure 5.17: Socio-cultural factors (n=112) ...................................................................... 126
Figure 5.18: Technological factors (n=112) ..................................................................... 128
Figure 5.19: Physical factors (n=112) .............................................................................. 129
Figure 5.20: Political-legal factors (n=112) ...................................................................... 130
Figure 5.21: International factors (n=112) ....................................................................... 131
Figure 5.22: Economic factors (n=112) ........................................................................... 133
Figure 5.23: Macro environmental factors (n=112) .......................................................... 134
Figure 5.24: Other factors (n=112) .................................................................................. 135

xii
LIST OF TABLES
Table 2.1: Sub-sectors in the food and beverage sector .................................................. 25
Table 2.2: Sub-sectors in the food and beverage sector .................................................. 37
Table 2.3: Classification of the categories of SMEs in accordance with the standard industrial classification .................................................................................... 41
Table 2.4: Classification of the categories of SMEs relating to the catering sector .......... 43
Table 4.1: Details of the questionnaire ............................................................................ 93
Table 5.1: Location (n=112) .......................................................................................... 105
Table 5.2: Full-time, part-time and seasonal employees ................................................ 109
Table 5.3: Contribution to revenue from business catering and social catering.............. 111
Table 5.4: Contribution to revenue from on-premise and off-premise catering ............... 112
Table 5.5: Catering for budget events, mid-scale events and upscale events ................ 112
Table 5.6: Summary of the findings ............................................................................... 137
Table 6.1: Factor loadings: General management ......................................................... 144
Table 6.2: Factor loadings: Customers and competitors ................................................ 145
Table 6.3: Factor loadings: Suppliers ............................................................................ 146
Table 6.4: Factor loadings: Intermediaries ..................................................................... 147
Table 6.5: Factor loadings: Macro environmental factors .............................................. 148
Table 6.6: Variable descriptives .................................................................................... 150
Table 6.7: Pearson Correlation Coefficients .................................................................. 152
Table 6.8: Kruskal-Wallis test for Age ............................................................................ 156
Table 6.9: Kruskal-Wallis test for Role/Position ............................................................. 156
Table 6.10: Mean and standard deviation for business environment impact factors per gender group ................................................................................................ 158
Table 6.11: Student t-test: differences between males and females with regard to the impact of each of the business environment factors ................................................. 159
Table 6.12: Mean and standard deviation for business environment impact on location .. 162
Table 6.13: Student t-test: differences between location in houses versus business premises ..................................................................................................................... 163
Table 6.14: Mean and standard deviation for business environment impact on size ........ 166
Table 6.15: Student t-test: differences between small and very small businesses with regard to the impact of each of the business environment factors ............................ 167
Table 6.16: Mean and standard deviation for business environment impact on website .. 170
Table 6.17: Student t-test: differences between businesses that have actively maintained websites versus those that do not with regard to the impact of each of the business environment factors ....................................................................... 171
Table 6.18: Component loadings: Functional areas and resources ................................. 174
Table 6.19: Variable descriptives .................................................................................... 175
Table 6.20: Pearson Correlation Coefficients .................................................................. 176

xiii
Table 6.21: Kruskal-Wallis test for age ............................................................................ 177
Table 6.22: Kruskal-Wallis test for role/position ............................................................... 178
Table 6.23: Mean and standard deviation for functional dimension impact on website .... 179
Table 6.24: Student t-test: differences between businesses that have actively maintained websites versus those that do not with regard to the existence of each of the functional dimensions ................................................................................... 180
Table 6.25: Mean and standard deviation for functional dimension impact per gender group ............................................................................................................ 181
Table 6.26: Student t-test: differences between males and females with regard to the existence of each of the three functional dimensions .................................... 182
Table 6.27: Mean and standard deviation for functional dimension impact on location .... 183
Table 6.28: Student t-test: differences between businesses located in houses versus business premises concerning the existence of each of the three functional dimensions. .................................................................................................. 184
Table 6.29: Mean and standard deviation for functional dimension impact on size .......... 185
Table 6.30: Student t-test: differences between small and very small businesses with regard to the existence of each of the three functional dimensions .......................... 186
Table 6.31: Summary of the findings ............................................................................... 187
Table 7.1: Firmographic profile of the SMMICs.............................................................. 196
Table 7.2: Demographic profile of the respondents ....................................................... 197
Table 7.3: Summary of the research objectives, main findings and recommendations .. 216

xiv
LIST OF ABBREVIATIONS AND ACRONYMS
The following abbreviations are used throughout the study.
CATHSSETA Culture, Arts, Tourism, Hospitality and Sport Sector Education
and Training Authority
FEDHASA Federated Hospitality Association of South Africa
HACCP Hazard Analysis Critical Control Point
SA CHEFS The South African Chefs Association
StatsSA Statistics South Africa
SMEs Small and medium-sized enterprises
SMMEs Small, medium and micro-sized enterprises
SMMICs Small, medium and micro independent caterers
SWOT Strengths, weaknesses, opportunities, threats

1
CHAPTER 1:
BACKGROUND AND PROBLEM STATEMENT
1.1 INTRODUCTION
The chapter commences with a brief discussion of the background to and motivation
for the study. Thereafter, a brief literature review is presented, the research problem
is explained and the objectives of the study outlined. Some limitations in the research
are also noted. Next, the research design and methodology used in the study are
described. Finally, the layout of the chapters of the study is indicated.
1.2 BACKGROUND TO THE STUDY
The purpose of this research study was to analyse the business environment of small,
medium and micro independent caterers (SMMICs) in Cape Town.
Caterers fall within the catering industry, which in turn, resorts under the hospitality
industry in South Africa. The Federated Hospitality Association of South Africa
(FEDHASA) is the official representative of the hospitality industry and is the umbrella
association for hotels, restaurants, conference centres, caterers, self-catering
accommodation, home-hosting establishments (bed and breakfasts, guest houses),
clubs, taverns, shebeens, suppliers and trainers, consultants and service providers to
the hospitality industry in South Africa (FEDHASA, 2019). The hospitality industry also
falls under the Culture, Arts, Tourism, Hospitality and Sport Sector Education and
Training Authority (CATHSSETA) in South Africa, where it comprises the largest sub-
sector (at 69%) and is also the largest employer (at 67%) of employees in the sector
(CATHSSETA, 2019).
From a global perspective, the hotel, catering and tourism sector is one of the fastest
growing sectors worldwide and because it is labour-intensive, it is one of the best
sectors for creating jobs (International Labour Organization, 2019). In South Africa,
the restaurant, fast food and catering sector provides estimated employment to more
than 200 000 people, and in 2018, generated revenue of R68.27 billion with a real
revenue growth of 2.8% (Veitch, 2016, 2019).
Catering is defined as the “planned service of food and beverages”, and catering
services can generally be provided in a range of different types of venue (Scanlon,

2
2013:vii). There are various types of enterprises which offer catering services. These
include full-service restaurants, hotel food-and-beverage facilities, contract caterers,
independent caterers, country clubs, gourmet food shops and delicatessens (Scanlon,
2013:vii).
As the focus of this study, contract caterers and independent caterers need to be
further defined. The Cambridge English dictionary online (2019) defines a contract
caterer as “a company that prepares meals for other companies and organisations and
not to the general public.” In contrast, independent caterers are defined as businesses
which ”offer catering services to the general public and operate with and without
permanent facilities of their own in which to hold functions” (Scanlon, 2013:42). They
also “operate independently”, as opposed to caterers who are “sizeable corporate
entities with dozens and even hundreds of employees.” Weinberg (2007:1). In
addition, most small independent caterers focus on off-premise catering, which entails
preparing the food at their premises and then transporting and serving it at a location
of the client’s choice (Shock & Steffanelli, 2001:1).
The research focus is on small, medium and micro-sized independent caterers
(SMMICs) that fall under the classification of small and medium-sized enterprises
(SMEs), or small, medium and micro-sized enterprises (SMMEs). A lack of coherence
exists in how SMEs are defined, with definitions differing across different studies,
policy documents and legislation (SBIBaseline, 2020:2). In addition, SME and SMME
classifications are used interchangeably in South Africa (WRSeta, 2014:9).
A general definition of an SME is that it “has a relatively small share of the market
place; it is managed by owners, or part owners, in a personalised way and not through
the medium of a formalised management structure; and it is independent in that it is
not part of a larger enterprise.” (WRSeta, 2014:6-7). An example of how the SMMEs
and SMEs overlap is shown in the next paragraph. (Although the term ‘SME’ is used,
it also refers to micro businesses, which fall under SMMEs.)
It is estimated that in South Africa, SMEs constitute 91% of formalised businesses,
and employ about 60% of the labour force, while their total economic output accounts
for about 34% of the gross domestic product (GDP) (Banking Association of South
Africa, 2019). However, the Small Business Institute estimates that, while SMEs made
up 98.5% of formal firms (micro firms - 66%, small firms - 26%, medium firms - 6.5%)

3
in 2016, they only employed about 28% of the working population, compared to 60%-
70% in other parts of the world. In addition, micro firms had the lowest number of
employees, followed by small and medium firms (SBIBaseline, 2020).
In a similar example, it is noted that SMEs (including SMMEs) are recognised as
important drivers of job creation, economic growth and development in South Africa
(SME South Africa, 2019).
It is thus evident that SMEs and SMMEs are regarded and analysed separately by
some authors and publications, while viewed and treated in a collective sense by
others.
Research on SMMEs has established that they experience difficulties with regard to
access to finance and credit, poor infrastructure, inadequately educated work force,
burdensome labour legislation, inefficient government bureaucracy, high levels of
crime, and limited access to markets (SEDA, 2016, 6-10).
Further information on SMEs/SMMEs and on the catering industry is provided in
Chapter 2 which explores the literature on the catering industry as part of the
hospitality industry in South Africa. The nature, business context and customers of
SMMICs are also investigated.
As the research was conducted in the City of Cape Town, some statistics relating to
the economy of the City of Cape Town are provided below.
Cape Town
Cape Town, with a population of just over four million people, is recognised as an
important economic and business hub in South Africa. PricewaterhouseCoopers
(PwC) recognised Cape Town as the top opportunity city in Africa (PwC, 2018).
Between 2012 and 2017, the city experienced an average growth rate of 2%,
compared to 1.7% nationally, and it was also the second highest contributor to total
employment in South Africa in 2017 (City of Cape Town, 2018a). In 2017, the real
GDP per capita in Cape Town was R106 839, compared to R82 262 nationally, while
the highest contributing industries were finance, trade and manufacturing (City of Cape
Town, 2018b).
The food and beverage industry in Cape Town was the largest contributing non-tertiary
sector to its economic growth between 2014 and 2018, with a growth rate of more than

4
2% per annum, and it contributed 4.1% of formal employment (Invest Cape Town,
2019).
The city has committed to assisting and enabling about 500 SMEs per year until 2022
with support, such as skills development and guidance related to regulatory
compliance (City of Cape Town, 2018a). In addition, the Invest Cape Town Business
Hub supports local entrepreneurs and SMEs with information in setting up and running
businesses (Invest Cape Town, 2019). SMMICs in Cape Town are thus able to take
advantage of and benefit from these aid initiatives.
Motivation for the study
It is envisaged that the knowledge gained from this research into the business
environment of SMMICs in Cape Town will assist the owners or managers of these
enterprises by enhancing their awareness and understanding of the factors in the
business environment that impact on their businesses. It is anticipated that this will
contribute to improving their competitive advantage and ultimate profitability. It is also
envisioned that the study will contribute toward the academic literature of caterers, as
SMMEs in South Africa.
The next section presents a short literature review of the business environment of
SMEs as further background information to the study.
1.3 LITERATURE REVIEW
The literature review in this research study is covered in Chapters 2 and 3. As indicated
earlier, Chapter 2 explores the literature on the catering industry as part of the
hospitality industry in South Africa. Chapter 3 analyses the business environment of
SMMICs in detail, specifically the micro, market and macro environments. In addition,
the elements of a SWOT analysis are examined in the context of this business
environment.
A brief literature review is presented below. As there is a paucity of academic
resources on caterers in South Africa, the focus is on SMEs, since the caterers in the
study fall within this category.

5
The business environment
The business environment consists of all the factors that have an influence on a
business, whether positive or negative, and that therefore aid or deter the business
from reaching its objectives (Botha, 2018:29). Figure 1.1 below is a representation of
the business environment as it applies to South African SMEs/SMMEs.
Figure 1.1: The business environment of South African SMEs/SMMES
Source: Researcher’s own interpretation
As can be seen in the figure, the business environment is comprised of the micro,
market and macro environments. Each of these environments is composed of various
variables as shown in the figure. Although the enterprise exercises full control over the
micro environment, it has no control over the market and macro environments. In turn,
the micro and market environments have a direct influence on the enterprise, while
the macro environment generally exercises an indirect influence on it.
The micro, market and macro environments, as well as SWOT analysis, are briefly
discussed below.
Micro environment
The micro environment is situated within the business and consists of three main
groups of variables. These are the vision, mission and objectives, the various
functional management areas and the resources of the business (Erasmus, Strydom

6
& Rudansky-Kloppers, 2019:126). Management has a direct influence on this
environment (Botha, 2018:34).
Important factors for SME owners to consider for optimal business performance are
drawing up mission and vision statements, conducting environmental scanning and
engaging in formal strategic planning (Sandada, 2014:66). Research also indicates
that SMEs that implement the following business practices perform optimally:
marketing practices, strategic planning practices, human resource management
practices, risk management practices, performance management practices and
teamwork practices (Neneh & Van Zyl, 2012:138).
With regard to management, since SMEs are so important to the growth of the South
African economy, it is imperative that they are properly managed to ensure that they
survive and grow. It is recommended that managers obtain professional degrees and
also invest in training to enhance their managerial, financial, marketing and organising
skills, amongst others (Asah, Fatoki & Rungani, 2015:317-318). Education,
managerial competence, as well as relevant experience appear to be significant
positive factors related to the successful performance of SMEs (Mothibi, 2015:7).
Using the business resources, such as knowledge resources, financial resources,
human resources, and stock, buildings and equipment, efficiently is a way for
businesses to build up competitive advantage and to ensure success (Evans,
2015:77;79). However, many SMEs in South Africa do not have adequate access to
important resources. This includes, in particular, a lack of access to financial and
technological resources, as well as an evident shortage of managerial skills (Sitharam
& Hoque, 2016:286).
Market environment
The market environment surrounds the business and is, in turn, surrounded by the
macro environment. It consists of customers, competitors and suppliers of resources
and services. The suppliers include intermediaries such as wholesalers, brokers and
banks (Botha, 2018:34-38).
While a growing customer base and customer satisfaction are important to ensure the
success of SMEs, research shows that some factors that contribute to business failure
and which South African SME owners are most concerned about, are ineffective

7
marketing, a lack of market knowledge, low product demand and increased
competition (Cant, 2012:1110-1111). Research has shown that SME owners in South
Africa consider quality and customer demand as the most important influencing factors
when making decisions regarding a product strategy (Cant, Wiid & Kallier, 2015:628).
In terms of competition, according to Porter’s Five Forces Model (Burns 2011:146),
the following competitive forces are found in the market environment:
new competitors in the industry,
the threat of substitute products and services,
rivalry among firms in the industry,
the behaviour and power of suppliers in the industry, and
the behaviour and power of buyers in the industry (Thompson & Martin,
2017:126).
Some SMEs in South Africa experience significant competition which has a negative
impact on their business performance (Sitharam & Hoque, 2016:283).
Suppliers impact businesses, particularly with regard to price, delivery and quality
(Foskett, Paskin & Pennington, 2016:247). Research on SMEs in Gauteng found that
small retailers formed positive long-term relationships with their suppliers, focusing on
the sharing of information (Makhitha, 2019:14).
Intermediaries facilitate the transfer of goods and services to the consumer. Traditional
intermediaries include wholesalers, retailers, agents, and brokers (Weedmark, 2019).
Examples of financial intermediaries are banks, insurance companies and pension
funds (Pettinger, 2018). With regard to banks, research shows that the main factors
influencing the access of SMEs to bank finance is related to their creditworthiness,
their collateral, and also whether they adopt e-banking technologies (Mutezo,
2015:224).
Macro environment
The purpose of analysing the macro or general environment is to ascertain the
opportunities that can be explored and to identify the threats that should be avoided.
These opportunities and threats reside in various forces which influence and affect
businesses (David & David, 2015:231). The pertinent forces in this environment are

8
socio-cultural forces, technological forces, economic forces, political-legal (statutory)
forces, environmental forces and international forces (Botha, 2018:38). These forces
are briefly explained below.
The socio-cultural environment refers to various trends, such as lifestyles,
demographics, values and behaviours, which have an influence on consumers and
their buying decisions (Cant & Van Heerden, 2018:50). Caterers need to understand
the various demographic and social trends which impact on customers and they
should determine where they can take advantage of the relevant marketing
opportunities that may arise (Scanlon, 2013:67).
In terms of technology, various inventions and innovations have resulted in benefits
for businesses, such as increased productivity and new ways of interacting with
customers (Hermann & Du Plessis, 2016:46). Frequent use of the internet can benefit
SMEs, for example, through improved market share and reputation (Akhtar, Azeem &
Mir, 2014:26). Moreover, SMEs employing internet marketing have reported higher
productivity, improved sales and customer support (Van Scheers, 2016:60). The
advent of social media has also opened up avenues for SMEs to cost-effectively
promote their businesses (Van Scheers & Van Scheers, 2015:89).
Economic forces affect the availability and cost of capital as well as the demands of
customers (Thompson & Martin, 2017:123). Most SMEs have experienced the
negative consequences of South Africa’s weak economy (Sitharam & Hoque,
2016:284). One study found that economic factors, such as interest rates, the
recession and low economic growth, were the main impediments restricting progress
by SMEs (Meyer & Meyer, 2017:135).
Political-legal (political and statutory) forces, such as legislation and regulations, can
have a big impact on the strategies of businesses (David & David, 2015:235). Many
SME owners in South Africa are negatively impacted by stringent tax and labour
legislation, as well as government bureaucracy (Sitharam & Hoque, 2016:284).
Various SMEs have different interactions with the forces in the physical environment.
This could be due to a perceived added expense or lack of adequate knowledge of the
advantages of proactive management in this regard (Brammer, Hoejmose & Marchant,
2012:432). However, recent research indicates that when SMEs become concerned
about and involved in environmental issues and environmental sustainability, this

9
translates into improved performance regarding innovations, and social and
environmental outcomes for the business (Masocha, 2018:8).
With regard to the international environment, research has shown that various factors
related to globalisation, such as technological advances, a decrease in the cost of
communication and transport, and various markets opening up to trade and
investment, have had some impact on SMEs in Africa (Felix & Mutalemwa, 2015).
In the following section, the SWOT analysis will be discussed as it applies to
SMEs/SMMEs.
SWOT analysis
The SWOT analysis is a management tool which assesses all aspects of a business
in terms of internal weaknesses and strengths, and external opportunities and threats
(Davis, Lockwood, Pantelidis & Alcott, 2018:101-102). Examples of strengths may be
superior skills, resources or knowledge, while examples of weaknesses could be
financial constraints or managerial problems. Externally, the business can find
opportunities to help it achieve growth and profitability, while avoiding or dealing with
threats that can obstruct progress (Cant & Van Heerden, 2018:51-52).
A study by Wiid, Cant and Holtzhausen (2015:452) established that SME owners in
South Africa may not be making optimum use of the SWOT analysis, although they
are aware of deficiencies in functional areas. In addition, financial management and
marketing management were regarded as the biggest drivers for achieving internal
goals.
Challenges faced by SMEs/SMMEs in the business environment
Businesses should constantly be aware of environmental forces and changes, and
should mobilise their resources to take advantage of the opportunities and to counter
the threats in the environment (Thompson & Martin, 2017:113-114). SMEs face unique
challenges in the business environment, and therefore, they need to develop
successful strategies to deal with these forces to ensure a continued and profitable
existence (Banham, 2010:1).
Studies on SMEs in South Africa indicate that most SMEs do not survive beyond five
years, and that they do not receive adequate support and funding in the early years of
establishment. Furthermore, SMEs have limited access to markets and face high rates
10
of competition (SME South Africa, 2018). According to Van Scheers (2016:351-352),
SMEs are affected by various factors, such as poor managerial skills, lack of adequate
finance, crime, labour and economic factors. In addition, SMEs lack funding and
resources with regard to physical premises, communication facilities and various
professional services. Moreover, SMEs have to deal with challenging legislation and
regulations, onerous labour laws, and experience a lack of management skills and
training (Wiid & Cant, 2018:211-214).
Further obstacles facing, specifically, SMMEs in South Africa include limited access
to affordable credit, poor business and finance skills, lower educational levels, limited
infrastructural support, low skilled labour and various constricting policies, legislation
and regulations (Bhorat, Asmal, Lilenstein & Van Der Zee, 2018:33-55).
Extremely limited academic research has been done on the business environment of
SMMICs in South Africa, and indeed worldwide. Available research in the USA lists
challenges such as the demands of customers, lack of good management and
organisational skills, high staff turnover, long working hours and food wastage
(McDaniel, 2018), as well as high levels of competition and logistical and operational
challenges (Maness, 2016). In the UK, financial constraints such as rental and wage
costs, specialised dietary demands by customers, maintaining an up-to-date media
presence, and also challenges related to sustainability issues are experienced
(Denley, 2019). Limited research in South Africa reveals challenges such as
competition, customer demands and complaints, finding competent staff, event
logistics, quality control, food price changes, and obtaining licences and permits
(Profitable Venture, 2016).
The research problem and objectives as well as the limitations of the study are
discussed below.
1.4 RESEARCH PROBLEM AND OBJECTIVES
From the discussion above, it is evident that SMMEs and those operating as SMMICs
face a number of challenges and difficulties in the business environment. The major
question to be investigated is:
What are the significant challenges that SMMICs in Cape Town face in the business
environment?

11
Given the substantial contribution made by the food and beverages industry in Cape
Town to its economic growth, as noted earlier in Section 1.2.1, it is evident that
research into the business environment of firms in the industry (SMMICs in this case)
would be beneficial in adding to the body of knowledge that would assist
entrepreneurs, business owners or managers of SMMICs in Cape Town who wish to
enter or are already operational in this industry.
Specific objectives have been developed for the study. They are listed below.
Primary objective:
To determine the key factors in the business environment that impact on SMMICs in
Cape Town.
Secondary objectives:
To analyse the micro environment of SMMICs in Cape Town.
To analyse the market environment of SMMICs in Cape Town.
To analyse the macro environment of SMMICs in Cape Town.
To identify strengths, weaknesses, opportunities and threats (SWOT) in the
business environment of SMMICs in Cape Town.
To determine the relationships between the micro, market, and macro business
environment factors and functional dimensions, respectively.
To determine if differences exist between the categories of different demographic
and company variables with regard to the business environment factors and
functional dimensions.
1.5 LIMITATIONS OF THE STUDY
Some limitations of the study are noted below.
As the study is limited to SMMICs in the greater Cape Town area, the findings
cannot be applied and generalised to all SMMICs in South Africa.
Although the aim of the research was to only survey SMMICs who are registered
businesses, verification of this was not possible.

12
As the SMMICs range in size from micro to medium, the experiences of the
owners/managers with regard to the business environment differ widely in some
aspects.
The respondents may have exhibited personal bias to some questions which
may not necessarily be fully accurate (for example, with regard to their
managerial abilities).
The research design and methodology which was used in the study is discussed in
the next section.
1.6 RESEARCH DESIGN AND METHODOLOGY
The research methodology commences with the selection of a research design, which
is a plan or blueprint of the details of how the research questions will be answered.
This includes making decisions about the research objectives, sample population, data
collection and data analysis (Saunders, Thornhill & Lewis, 2019:173). The secondary
research is covered in Chapters 2 and 3, as explained in Section 1.3.
Primary research
Descriptive research, also called correlational research, determines the relationship
between various variables. It further aims to collect data that describes the features of
an existing situation or population (Sekaran & Bougie, 2016:43-44). This research
study is identified as being descriptive in nature, as it sought to identify the factors in
the business environment which impact on SMMICs in Cape Town.
This study is furthermore classified as a quantitative study. Quantitative research,
which generally makes use of samples, structured questionnaires or interviews, is
based on objectivity and standardisation, with the data usually being reduced to
numbers for statistical analysis (Patten & Newhart, 2018:22). As this research was of
a factual nature, with the aim of obtaining specific data about the business
environment of SMMICs in Cape Town, quantitative research was deemed to be the
most suitable.
Further discussion of the primary research methodology, consisting of a description of
the target population, sampling method and data collection follows below.

13
Target population
The population refers to the total group of potential participants to which the results of
a study would be generalised (Salkind, 2018:85). The target population consisted of
all the SMMICs active in the greater Cape Town area. This area included the Cape
Town CBD, as well as outlying suburbs and towns stretching as far as Simons Town
in the south, Melkbosstrand and Durbanville in the north, and Paarl, Stellenbosch,
Somerset West and Gordon’s Bay in the east.
Sample frame
The sample frame was all the SMMICs in Cape Town that have an online presence
(for example, social media, website or listing in the online Yellow Pages). As,
according to FEDHASA, there is no official list or record of SMMICs in Cape Town,
searches were made on Google, Facebook, the online Yellow Pages, Snupit and
Instagram to find the caterers. A variety of search keywords were used, such as
“caterers Cape Town”, “food caterers Cape Town” and “catering services Cape Town”.
Sampling method and size
There are two approaches that are relevant to collecting quantitative data, namely, by
means of a census or a sample. A census is where data is collected from every
member of a target population, whereas a sample is a subgroup of that population
(Saunders et al., 2019:292). The two main sampling strategies are probability
sampling and non-probability sampling. In probability sampling every member of the
population has an equal chance of being selected, whereas in non-probability
sampling this is not guaranteed (Patten & Newhart, 2018:89,100). An example of non-
probability sampling is convenience sampling. Convenience sampling refers to the
convenience and ease with which members of a population can be sampled (Salkind,
2018:92).
Non-probability sampling, specifically convenience sampling, was used for this
research study. The rationale for this method is that it was suitable for an arbitrary
selection process, since the research was limited to SMMICs in Cape Town that have
an online presence and are thus easily contactable. Contacting the SMMICs by
telephone, and sending emails with the link to the online survey, also took minimal

14
effort at little cost, as did the subsequent retrieval of the data. Convenience sampling
also suited the time frame of the research.
Of the 403 SMMICs contacted via telephone or email, 253 were active, while the rest
(150) either appeared to be inactive or stated that they were no longer operating. The
final sample size of valid participants was 112.
Data collection
Data was collected using a questionnaire administered as an online survey. Survey
research, incorporating questionnaires, is suitable for contacting many respondents in
a short space of time, and also for making conclusions about a larger population
(Nardi, 2016:72). The questionnaire was developed in consultation with a statistician,
and consisted of structured questions, with the exception of the last question which
allowed for an open-ended response (see Appendix C).
Pilot studies or pre-tests are conducted in order to ascertain whether certain measures
work, for example, whether the questions in a questionnaire are clear and
unambiguous (Patten & Newhart, 2018:110). For the purpose of this study, a pilot
study was done with four caterers. As only a couple of minor changes were
subsequently made to the questionnaire, they were included in the sample.
Caterers were contacted telephonically over a period of two months (March and April,
2018). The purpose of the research was explained to them and they were requested
to participate by completing the online survey which would be emailed to them. It was
explained to them that all the information pertaining to the research would be included
in the email. Emails were sent to those owners or managers who responded positively
to the telephone call. The emails contained an explanation of the purpose of the
research, as well as an attached informed consent form, a participant information
sheet and the link to the online survey. Emails were also sent to a few caterers who
could not be contacted telephonically.
Ethical considerations
Research should be conducted ethically throughout each stage of the research
process. Participants in a research study should be respected, not harmed or
pressurised, and their confidentiality should be assured (Saunders et al., 2019:17
233). In the present study, care was taken to fulfil these requirements.

15
In order to adhere to the ethical standards as set by the University of South Africa
(UNISA), the questionnaire was examined by members of the ethics committee
comprised of senior academics in the Department of Business Management at UNISA,
after which an ethics certificate was issued for the study (see Appendix A). The
participants in the research were also fully informed about the ethical and confidential
aspects of the research. This was communicated to them via the participant
information sheets and the informed consent forms that were included in the emails
sent to them. The final stages of the research methodology, data processing and
analysis and reliability and validity considerations, will be briefly discussed below.
Data processing and analysis
Participants were asked to complete the questionnaire electronically via LimeSurvey,
an online survey tool, and to press the submit key at the end. This sent the survey
directly to the Structured Query language (SQL) database at UNISA, to be
electronically captured.
Of the 122 submissions, five were submitted but not filled in. A further five were
discarded because they were completed by staff other than the owner or manager.
Thus a total of 112 surveys were used in the analysis.
The statistical software program, Statistical Package for the Social Sciences (SPSS),
Version 24, and MS Excel 2016 were used to compile the data, which was first
inspected and edited for accuracy and correctness. Codes were allocated to all the
questions for analysis, including the open-ended question for which relevant themes
were first identified.
Thereafter, descriptive data analysis was carried out on the data, and various
frequency tables and figures were constructed to display the findings. Following that,
inferential statistical analysis was conducted on the data to test the various hypotheses
that had been formulated. The following tests on the data were performed: Exploratory
factor analysis, Categorical Principal Component Analysis (CATPCA), the Pearson
correlation coefficient test, the non-parametric Kruskal-Wallis test and the parametric
Student T test for independent groups.
16
The detailed analyses of the data and relevant findings are discussed in Chapters 5
and 6 of the dissertation, while the conclusions and recommendations of the research,
based on the findings, are discussed in Chapter 7.
Research validity and reliability
Reliability and validity are two important assessment tools which help to ensure that
the correct conclusions are derived at when doing research (Salkind, 2018:100).
Reliability refers to the consistency of a measuring instrument when measuring
something, while validity refers to how accurately an instrument measures what it is
intended to measure (Sekaran & Bougie, 2016:150). These tools are discussed in
Chapter 4 (Section 4.3.10). Both reliability and validity were ensured by the researcher
during the research process of this study.
1.7 CHAPTER OUTLINE
The dissertation consists of seven chapters. A brief explanation of each chapter is
given below.
Chapter 1: Background and problem statement
Chapter 1 introduces the research. The chapter commences with a discussion of the
background to and motivation for the study, followed by a preliminary literature review.
Next, the research problem, objectives and limitations were presented. This was
followed by an overview of the research design and methodology. Finally, the layout
of the chapters was indicated.
Chapter 2: SMMICs in Cape Town as part of the South African hospitality
industry
Chapter 2 sets out a literature review of the catering industry as part of the hospitality
industry in South Africa. The operations of the independent caterer are analysed and
the nature of SMMICs explored.
Chapter 3: Business environment of SMMICs
Chapter 3 reviews the literature on the theory related to the business environment of
SMMICs, namely, the micro, market and macro environments. The elements of a
SWOT analysis are also examined in the context of SMMICs.

17
Chapter 4: Research methodology
Chapter 4 presents a discussion of the methodology used to carry out the research.
Elements such as secondary resources, primary sources, population, sample and data
collection procedures are discussed.
Chapter 5: Descriptive data analysis, results and discussion
Chapter 5 focuses on the descriptive analysis and interpretation of the data. The
methods used to analyse the data are described and the findings are presented.
Chapter 6: Inferential data analysis, results and discussion
Chapter 6 presents with the inferential analysis and interpretation of the data. The
methods used to analyse the data are described and the findings are presented.
Chapter 7: Conclusions and recommendations
Chapter 7 outlines the conclusions reached in the study and the recommendations
made. These are correlated with the objectives stated earlier. The chapter ends with
an overall conclusion and suggestions for further research in the field.
1.8 CONCLUSION
This chapter provided an overview of the dissertation, commencing with the
background and motivation for the study, continuing with the literature review and a
discussion of the research problem and objectives. Some limitations of the research
and also the research design and methodology were briefly discussed. Finally, the
chapter layout was presented.
The next chapter focuses on SMMICs in Cape Town, tracing the industry, sector and
segment in which they operate.

18
CHAPTER 2:
SMMICS IN CAPE TOWN AS PART OF THE SOUTH
AFRICAN HOSPITALITY INDUSTRY
2.1 INTRODUCTION
As background to the study which investigated small, medium and micro independent
caterers (SMMICs) in Cape Town, this chapter focuses on the industry, sector and
segment under which these SMMICs fall. In this regard, it traces a progression,
starting with the hospitality industry, continuing to the food and beverage sector, then
to the catering segment, and ending with SMMICs, as depicted in Figure 2.1 below.
Figure 2.1: Progression from the hospitality industry to SMMICs
Source: Researcher’s own interpretation
As shown in the figure, the broader hospitality industry will first be examined. Some
important terms will be defined and essential characteristics of the industry identified.
Thereafter, the food and beverage sector will be discussed. The nature of the food
and beverage offering and the positioning of this sector within the hospitality industry
will be highlighted. Following this, the elements of the catering segment of the food
and beverage sector will be identified and explained. Finally, SMMICs will be
discussed. Aspects such as the nature of SMMICs, the business context of these
caterers and their customers will be analysed.

19
2.2 THE HOSPITALITY INDUSTRY
The term ‘hospitality’ denotes a sense of comfort, warmth and pleasure, and is broadly
defined as “the act of kindness in welcoming and looking after the basic needs of
customers or strangers, mainly in relation to food, drink and accommodation” (Chan &
Mackenzie, 2013:11).
The hospitality industry can broadly be defined as any commercial activity concerned
with providing food, beverage and accommodation away from home (Davis et al.,
2018:2). While some scholars agree with this interpretation (Foskett et al., 2016:1),
others take a broader view of the industry to include sectors such as travel, recreation,
airlines, gaming and amusement parks (Moulton & Leow, 2015:4; Chan & Mackenzie,
2013:20). In addition, some authors further consider the hospitality industry to be a
sector of the bigger multi-sectoral tourism industry (Herman & Du Plessis, 2016:4),
while others view the two industries as distinctive but highly interrelated (Evans, 2015).
It is thus evident that the term ‘hospitality industry’ has different meanings and
encompasses a wide range of activities and establishments. The elements of food,
beverages and accommodation, however, appear to be a common factor in all of
these.
Another commonly used term is ‘hospitality product’. Foskett et al. (2016:1) define it
as the “elements of food, drink and accommodation, together with the service,
atmosphere and image that surround or contribute to the product”. Thus the hospitality
industry has a lot in common with service industries but with the further challenge of a
production process where production and delivery often has to take place in a specific
time period (Foskett et al., 2016:1).
The characteristics of the hospitality offering are discussed below.
Characteristics of the hospitality industry offering
In considering the nature of the hospitality industry, it is seen to have the following
features in common with other industries (Wood, 2015:xv):
low barriers to entry,
the existence of many small, medium and micro-sized businesses, and
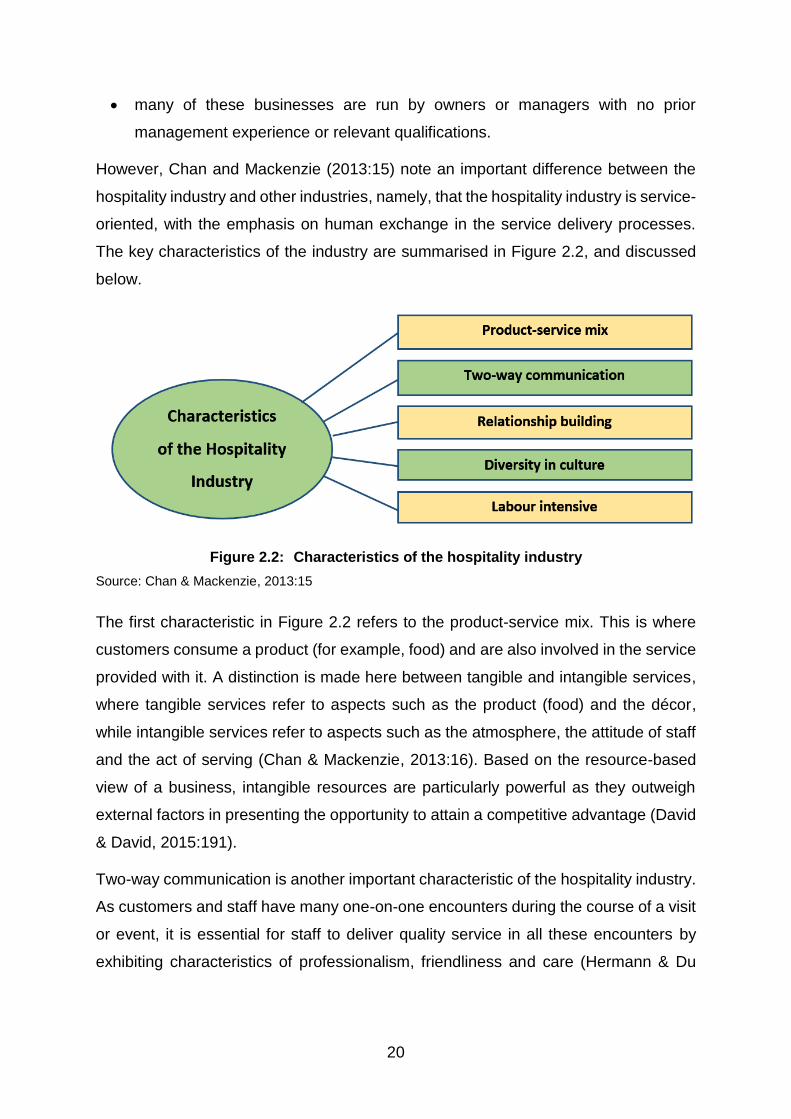
20
many of these businesses are run by owners or managers with no prior
management experience or relevant qualifications.
However, Chan and Mackenzie (2013:15) note an important difference between the
hospitality industry and other industries, namely, that the hospitality industry is service-
oriented, with the emphasis on human exchange in the service delivery processes.
The key characteristics of the industry are summarised in Figure 2.2, and discussed
below.
Figure 2.2: Characteristics of the hospitality industry
Source: Chan & Mackenzie, 2013:15
The first characteristic in Figure 2.2 refers to the product-service mix. This is where
customers consume a product (for example, food) and are also involved in the service
provided with it. A distinction is made here between tangible and intangible services,
where tangible services refer to aspects such as the product (food) and the décor,
while intangible services refer to aspects such as the atmosphere, the attitude of staff
and the act of serving (Chan & Mackenzie, 2013:16). Based on the resource-based
view of a business, intangible resources are particularly powerful as they outweigh
external factors in presenting the opportunity to attain a competitive advantage (David
& David, 2015:191).
Two-way communication is another important characteristic of the hospitality industry.
As customers and staff have many one-on-one encounters during the course of a visit
or event, it is essential for staff to deliver quality service in all these encounters by
exhibiting characteristics of professionalism, friendliness and care (Hermann & Du
21
Plessis, 2016:144). Good communication is also essential between management and
workers to prevent misunderstandings and mistakes.
Relationship building concerns the building of relationships with customers. This is
important as it is a way to ensure repeat custom, which holds financial benefits for
organisations. Organisations can build relationships with customers through various
initiatives, such as instituting loyalty programmes and interacting with customers in an
informal, friendly way (Chan & Mackenzie, 2013:17). Relationship building also
includes promoting a positive atmosphere in the organisation and boosting the morale
of employees. The result of this is teamwork and professional service to customers
(Shiring, 2014:239).
Diversity in culture is identified next. Organisations derive benefit when cultural
differences among workers, for example, regarding their backgrounds, race and
viewpoints are accepted and managed (Herman & Du Plessis, 2016:104). Customers
are respected and accommodated in the same way with regard to their specific
requirements, for example, relating to their religious beliefs, foods they desire and
services they request (Chan & Mackenzie, 2013:17).
The last characteristic of the hospitality industry is that it is labour intensive. This also
denotes a high level of interaction between staff and customers, and when staff are
friendly, helpful and genuinely concerned that customers have a great experience, it
creates a competitive edge for the business (Herman & Du Plessis, 2016:142).
As outlined above, the hospitality industry encompasses food, drink and
accommodation. With the focus of the dissertation however, being on SMMICs, it is
necessary to concentrate on the food and drink section of the industry. In this regard,
the food and beverage sector, as part of the hospitality industry, will be discussed
below.
2.3 FOOD AND BEVERAGE SECTOR
The discussion of the food and beverage sector, as part of the hospitality industry,
commences with an investigation into the nature of the food and beverage offering.
Thereafter, various factors affecting the sector will be analysed. These include the
nature of the food and beverage offering, statistics on the sector in South Africa,
demand and supply factors in the sector, and critical success factors in the sector.

22
Nature of the food and beverage offering
The authors, Cousins, Lillicrap and Weeks (2014:4) define food and beverage
operations as “the provision of food and drink ready for immediate consumption (but
excluding retailing and food manufacturing).” They assert that food can be categorised
in a number of ways: according to country (for example, British food), according to
cuisine (for example, oriental food) or according to speciality (for example, vegetarian,
fish).
They categorise beverages as comprising of alcoholic drinks (for example, wine,
cocktails, liqueur, spirits, beer) and non-alcoholic drinks (for example, juices, mineral
water, carbonated water, tea, coffee, chocolate, milk).
Figure 2.3 below shows some examples of the food and beverages that are typically
served at a restaurant or catered event.
Figure 2.3: Examples of food and beverages at restaurants or catering events

23
Food and beverage statistics in South Africa
It is difficult to get consistent statistics on the hospitality and food and beverage
industries due to the wide diversity of operations offered in these industries, and also
because there is no common definition of the industries and subsectors (Davis et al.,
2018:1).
With reference to South Africa, the key sectors, according to Statistics South Africa,
(StatsSA) which contribute to the South African economy, are as listed below.
Agriculture
Mining
Manufacturing
Electricity and water
Construction
Wholesale, retail and motor trade, catering and accommodation
Transport, storage and communication
Finance, real estate and business services
Government services
Personal services
Based on the key sectors listed above, the wholesale, retail and motor trade, catering
and accommodation sector appears to be the one which represents the food and
beverage sector in South Africa, with the term “catering” used in this regard. It is an
important sector in the South African economy, being the third biggest contributor to
GDP, both in 2018 (R653 billion) and 2019 (R685 billion) (StatsSA, 2018, 2019b).
There is also a separate set of statistics in the form of a monthly survey that StatsSA
uses to monitor trends in the food and beverage industry. The survey is conducted on
various registered and tax-paying enterprises (public and private) that provide food
and beverages for immediate consumption. These enterprises are divided into three
outlet types, namely, restaurants and coffee shops, takeaway and fast-food outlets,
and catering services.
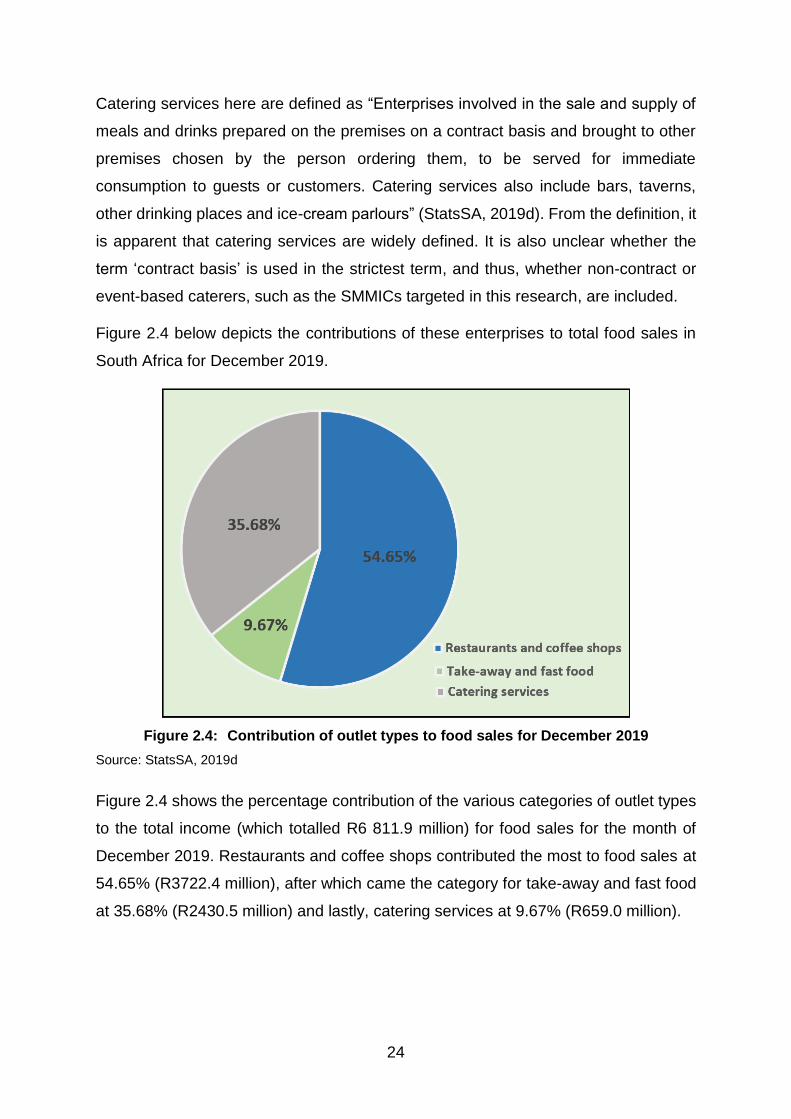
24
Catering services here are defined as “Enterprises involved in the sale and supply of
meals and drinks prepared on the premises on a contract basis and brought to other
premises chosen by the person ordering them, to be served for immediate
consumption to guests or customers. Catering services also include bars, taverns,
other drinking places and ice-cream parlours” (StatsSA, 2019d). From the definition, it
is apparent that catering services are widely defined. It is also unclear whether the
term ‘contract basis’ is used in the strictest term, and thus, whether non-contract or
event-based caterers, such as the SMMICs targeted in this research, are included.
Figure 2.4 below depicts the contributions of these enterprises to total food sales in
South Africa for December 2019.
Figure 2.4: Contribution of outlet types to food sales for December 2019
Source: StatsSA, 2019d
Figure 2.4 shows the percentage contribution of the various categories of outlet types
to the total income (which totalled R6 811.9 million) for food sales for the month of
December 2019. Restaurants and coffee shops contributed the most to food sales at
54.65% (R3722.4 million), after which came the category for take-away and fast food
at 35.68% (R2430.5 million) and lastly, catering services at 9.67% (R659.0 million).

25
Sub-sectors in the food and beverage sector
It is important to consider the various sub-sectors in the food and beverage sector
which meet the demands of consumers. The various forms of outlets or food beverage
operations are discussed below.
Food and beverage operations are characterised by their diversity. This ranges, for
example, from private to public sector outlets; from small independently-owned
operators to very large multinational corporations; and from prison catering at the one
end of the spectrum to deluxe hotel catering at the other end (Davis et al., 2018:1).
Table 2.1 below lists the various outlets or sub-sectors in the food and beverage sector
according to the purpose or needs that they serve. The table shows each sub-sector,
its purpose, as well as relevant examples of establishments in the sub-sector.
Table 2.1: Sub-sectors in the food and beverage sector
SUB-SECTOR PURPOSE EXAMPLES
Hotel and tourist accommodation
Provision of food and drink together with accommodation.
e.g. hotels, motels, guest houses, bed & breakfasts (B&Bs)
Restaurants Provision of food and drink generally at high price with high levels of service.
e.g. conventional and specialist restaurants (such as carveries)
Popular catering Provision of food and drink generally at low/medium price with limited levels of service.
e.g. cafés, pizza, ‘Wimpy’, grills, specialist coffee shops, ‘Spur’, steak houses
Fast foods Provision of food and drink in a highly specialised environment, characterised by high investment, high labour costs and vast customer throughput.
e.g.: ‘McDonalds’, ‘Burger King’, ‘KFC’
Takeaway Fast provision of food and drink.
e.g. sandwich bars, ethnic foods, fish and chips, kiosks
Retail stores Provision of food and drink as adjunct to provision of retailing.
e.g. ‘Woolworths’, ‘Pick n Pay’
Events/conferencing/ Exhibitions/banqueting
Provision of large-scale food and drink for events (originally associated with hotels).
e.g. events at Cape Town International Convention Centre
Garages Provision of food together with retail and petrol services.
e.g. ‘Total’, ‘Engen’, ‘Shell’ convenience shops

26
Leisure attractions Provision of food and drink for people engaged in another leisure pursuit
e.g. theme parks, galleries, theatres, airline terminals
Industrial catering Provision of food and drink to people at work.
e.g. in-house operations or provided by catering contractors
Welfare catering Provision of food and drink to people through social need, primarily determined by an authority.
e.g. hospitals, schools, colleges, universities, forces, prisons
Licensed trade Provision of food and drink in an environment dominated by licensing requirements.
e.g. public houses, wine bars, licensed clubs, members’ clubs
Transport catering Provision of food and drink to people on the move.
e.g. railways, airlines, shipping
‘Outdoor’ catering or ‘off-premises’ catering or ‘event’ catering
Provision of food and drink away from the home base; usually associated with a major event.
Catering market
Source: Adapted from Cousins et al., 2014:4
Based on the table above, it is evident that there is a wide variety of outlets or sub-
sectors in the food and beverage sector to cater for the wide variety of demand that
exists. For example, some sub-sectors cater for the general public, while others cater
for certain groups only; some cater for different groups at different times; some operate
as distinct food and beverage outlets, while in certain instances, they may operate as
part of another business, such as transport and welfare catering (Cousins, Foskett &
Pennington, 2011).
For the purpose of this study, it is evident that SMMICs fall in the category of outdoor,
off-premise or event catering, as presented in Table 2.1.
Demand in the food and beverage sector will be explained in the section below.
Demand in the food and beverage sector
Demand in the food and beverage sector is influenced by the motivation and needs of
customers. There is also the need to determine the various segments in the target
market of the sector. These are important factors to consider as they influence the
discussion and research of the factors in the market environment which can impact on
27
SMMICs in Cape Town. The means of supply of this market segment are discussed
in the sub-sections below.
2.3.4.1 Customer motivations and needs
Customers have a range of different motivations and needs related to food and
beverages at various different times (Cousins et al., 2014), as listed below:
They may have a physiological need: the need to satisfy appetite and/or thirst.
They may have an economic need: the need for good value, rapid fast service
and a convenient location.
They may have a social need: the need to go out with friends or business
colleagues or to attend a function in order to meet others.
They may have a psychological need: the need for enhancement of self-esteem,
for fulfilling lifestyle needs or the need for variety.
Finally, they may have a convenience need: for example, the need to buy
something to eat on their way home from work, or on their way to or from
attending an event such as the cinema or theatre, or a desire to take a break
from cooking.
Foskett et al. (2016:349) add that customer needs are not constant, and that
organisations should therefore frequently monitor their customers’ satisfaction levels.
The implication of the motivations and needs of customers discussed above is that
they are manifested as demands by customers for different kinds of products and
services at different times. Given the laws of supply and demand, various types of food
and beverage providers emerge onto the market to satisfy the needs of customers.
For example, a delicatessen (deli) could arise to cater for an economic need, a high-
end restaurant could arise to cater for a self-esteem or lifestyle need, and SMMICs
could arise to cater for a convenience need, such as the demand for weddings and
parties by customers who are unwilling or unable to have these events at home.
The next section discusses how the different food and beverage providers target
specific market segments to satisfy customers in a profitable manner.

28
2.3.4.2 Target market segmentation
Given the wide variety of motivations and needs explained above, it is evident that no
one specific type of food and beverage provider would be able to satisfy all the needs
or demands of customers. Each food and beverage provider would therefore benefit
from targeting a specific group of customers. This group of customers makes up a
market segment. A market segment is defined as a group of people that have one or
more characteristic(s) in common, which causes them to have some shared needs
when buying a product (Lamb, Hair, McDaniel, Boshoff, Terblanche, Elliot & Klopper,
2015:201).
A target market consists of all those consumers who share a common set of
characteristics that a business specifically selects to serve (Shiring, 2014:139).
Factors to consider in identifying a target segment include aspects such as the profile,
size, accessibility, uniqueness, durability and profitability of the segment (Foskett et
al., 2016:334).
The well-known variables used to segment markets are: demographic variables,
geographic variables, psychographic variables and behaviouristic variables. These
variables are depicted in Figure 2.5 below. A brief explanation of each variable follows.
Figure 2.5: Segmentation variables for consumer markets
Source: Cant & Van Heerden, 2018:84

29
Demographic variables are the most often used to segment consumer markets. They
include, for example, age, race, gender family size and occupation (Cant & Van
Heerden, 2018:87).
Geographic variables refer to the type of area served, its density and also the type of
location. They include, for example, a neighbourhood, city, urban, suburban,
downtown or residential location (Shiring, 2014:138).
Psychographic variables include personality attributes, motives and lifestyles. These
give added depth to segmenting markets, overcoming the limitations of demographic
limitations (Lamb et al., 2015:213).
The last set of segmentation variables are behaviouristic variables. These concern the
benefits sought by customers from a product, as well as the behaviour of consumers
toward a product. Examples of these are attitudes to the product, usage rate and
loyalty status (Cant & Van Heerden, 2018:91).
Based on all the variables above, food and service providers, such as SMMICs, could
for example, decide to target high income, status-conscious families in urban areas
who regularly entertain at home. Businesses, therefore, select the market segment
that would be the most profitable for them and that then becomes their target market.
Referring to caterers specifically, Shiring (2014:58) defines a caterer’s market as: “the
group of all customers in a geographic surface area who have unmet needs, wants or
demands requiring food and beverage service”.
There are a variety of ways in which food and beverage operators can try to segment
markets to satisfy the needs and wants of consumers. For their part, Cousins et al.
(2011) identify three types of markets: (1) the so-called ‘captive’ market where
customers have no choice, for example, the army or prisons; (2) the ‘non-captive’
market where customers have free choice, for example, restaurants, takeaways and
catering; and (3) the ‘semi-captive’ market where there is limited choice, for example,
customers flying on an airline are restricted to what food items are on offer.
This research focused on the non-captive market, specifically on customers who have
a need for a caterer and who are free to select the type of caterer they want. The kinds
of customers that form this non-captive catering market will be discussed in more detail
later in the section on the catering segment.

30
Some of the critical success factors in the food and beverage sector are discussed in
the next section.
Critical success factors in the food and beverage sector
The critical success factors in the food and beverage sector are important as they
provide a background to the forthcoming discussion and research on the factors in the
environment which impact SMMICs in Cape Town.
Figure 2.6 depicts six of these critical success factors. They are briefly discussed
below.
Figure 2.6: Critical success factors in the food and beverage sector
Source: Infiniti Research, 2016
The following are the critical success factors in the food and beverage sector:
Catering to changing consumer preferences: For example, consumers are
concerned about the high salt and sugar content in food. In this case, food and
beverage providers could provide healthier food options that use less of these
ingredients.

31
Estimating the demand for new products: For example, customers these days
demand more gluten-free, vegetarian or vegan products. It would be important
to develop food items which cater for these customers.
Improving return on investment (ROI) on in-store and out-of-store
promotional activities: This means ensuring that promotional activities provide
real value and profitability for the food and beverage provider. One activity could
be to advertise in neighbourhood newsletters or newspapers in the same location
as the provider.
Promoting digital strategies to improve consumer engagement: This
involves using the internet and social media to connect with consumers. For
example, a Facebook page could be set up and satisfied customers asked to like
that page.
Managing commodity and raw material price fluctuations: During times of
excessive price fluctuations they could for example, consider broadening their
product range, or offering alternative products.
Improving operational efficiency: There are numerous ways in which this can
be done. One example is to focus on more efficient transportation of raw
materials, or to invest in more economical kitchen equipment.
In the following section, the catering segment of the food and beverage sector will be
discussed.
2.4 CATERING SEGMENT OF THE FOOD AND BEVERAGE
SECTOR
The discussion of the catering industry as a segment of the food and beverage sector
commences with a brief history of catering. Thereafter, the various types of caterers
are analysed, followed by a discussion of the various associations that caterers can
belong to in South Africa.
Concept of catering
Catering is defined in a number of ways. A broad definition thereof is “the planned
service of food and beverages” (Scanlon, 2013:vii). Another definition is “the business
of providing food and drink, typically at social events and in a professional capacity

32
either on-site or at a remote site” (Riley, 2013) .These definitions are however, unable
to depict the sheer diversity of catering and food and beverage operations since they
are so multifaceted, ranging from SMMICs catering for a small number of guests to
large corporate concerns catering for great numbers of people (Davis et al., 2018:1;
Scanlon, 2013:26).
Even within the category of SMMICs, the type of caterer and the type of event varies
widely, for example, ranging from simply dropping off a food platter, to a full-service
caterer that provides not only the food but also the décor, table settings, flowers and
staff for an event (Artnetw0rk, n.d.).
From the discussion and interpretations above, it is clear that catering encompasses
a very broad field of customers and products and services being offered.
The next section provides a brief history of catering. After that the various types of
caterers will be explained.
Brief history of catering
Catering has a long history going as far back as the 4th millennium BC in China (Riley,
2013). Signs of the catering profession as it is known today, are also found in other
ancient civilizations, such as that of Egypt, Greek and Rome. Written records,
paintings, ancient cookware and foodstuffs allude to a wide variety of banquets and
the types of food eaten (Scanlon, 2013:2-3). This is illustrated in Figure 2.7 below.
Figure 2.7: Scenes depicting the history of catering
33
In Europe, snippets of catering history indicate that in the Middle Ages catering was
focused on monasteries and Christian pilgrimages. After the French Revolution in the
18th century, the first French restaurants were started by people who had prior to that
time, catered for the French aristocracy (Riley, 2013). During the Middle Ages catering
evolved into providing meals for soldiers and travellers, and eventually became so
popular that Germany became the first country in the 14th and 15th centuries to put
regulations in place regarding the quality of food and beer (Artnetw0rk, n.d.).
In the United States of America, catering started in the colonies (Scanlon, 2013), and
as a separate operation, became increasingly popular when companies that had
catered for World War II operations entered the field. They became successful as the
economy grew and people had more disposable income. This led to a demand by
ordinary citizens for the type of catering services which had previously been the
preserve of the rich (Riley, 2013).
From the simple provision of food for travellers in the past, catering today plays a vital
role in society, and has evolved into much more diverse and sophisticated
presentation of food and accompanying services (Artnetw0rk, n.d.).
Types of caterers
Although the term ‘catering’ is often used when food and beverages are provided in
any setting, there are differences, however. For example, the fundamental ways in
which a catering operation and a restaurant differ is that for a caterer, the menu,
number of guests and the cost involved are pre-arranged and the food is prepared
beforehand, so that it only needs final heating, brief cooking or assembly before use
(Mattel, 2016:2).
Thomas and Hansen (2012:2) explain that caterers can choose to specialise in various
areas. For example, there are ‘drop-off caterers’ who supply food only (typically cold)
for an event. Secondly, there are ‘hot buffet caterers’ who offer hot foods and also
provide serving staff if required. Thirdly, there are ‘full-service caterers’ that supply
food and serving staff, as well as any other requirements such as crockery, china,
tables, chairs, flowers, décor and music. It is evident, of course, that SMMICs could
choose to provide some or all of these types of catering.

34
Furthermore, from the definition and explanations above it would appear that any, or
all of the food and beverage operators listed in Table 2.1 (Sub-sectors in the food and
beverage sector), even those not linked to catering, could decide to include catering
activities in their product and service offering if they wish to do so. For example, a Spur
steakhouse could cater for a children’s party, or a Pick ‘n Pay supermarket could
provide food platters for a corporate event.
The discussion above focused on the basic nature of the catering offering. A distinction
will now be made with regard to how caterers (or food and beverage operations) can
be categorised. This can be done in various ways, for example, according to their profit
orientation, to the markets they serve, to the premises that they operate out of, and
according to whether they are contracted or not. These forms of catering are depicted
in Figure 2.8 and will be discussed below.
Figure 2.8: Various types of catering operations
Source: Researcher’s own interpretation
2.4.3.1 Commercial catering versus non-commercial catering
The first two categories, as shown in Figure 2.8, are commercial catering (also called
for-profit operations) and non-commercial catering (also called not-for-profit-
operations). As is evident, the purpose of commercial catering is to make a profit.
Examples of commercial caterers are hotels, motels, restaurants, private clubs and
independent caterers (Shiring, 2014:5).

35
Non-commercial catering is also known as welfare catering (Cousins et al., 2014:4)
and institutional catering (Mattel, 2016:3), and is not profit-based and works within
given budgets with the aim to minimise cost. It involves catering to large numbers of
people on an ongoing basis, usually at the institution itself. Examples are prisons,
universities, schools and the armed forces (Mattel, 2016:3; Foskett et al., 2016:12).
2.4.3.2 Corporate (business) catering versus social catering
Another method of distinguishing between catering operations as shown in Figure 2.8
is between corporate (business) catering and social catering. The corporate market is
comprised of businesses that require catering for events such as product launches,
conventions, meetings, award ceremonies, product launches, and various banquets
(Murugi, 2014). It is estimated that this form of catering delivers about 75% of all
catering sales in most markets, due to the large numbers of people served at these
business functions and the fact that corporate clients have larger budgets than those
planning for social events (Shock, Sgovio & Stefanelli, 2011:3).
Social catering refers to catering for events such as wedding receptions, private house
parties, reunions, charity events and birthday parties (Murugi, 2014; Shiring, 2014:52).
It is estimated that social catering delivers about 25% of all catering sales, due to the
fact that these clients often have smaller budgets than the corporate market (Shock et
al., 2011:3).
SMMICs can decide to target either the corporate catering segment or the social
catering segment, or both segments, depending on their competencies and resources.
Within corporate catering and social catering, three levels of catering are further
identified, typically based on budget. The first level concerns budget events which are
low-priced with a low level of service, and with basic food items such as food platters.
The next level concerns midscale events which are modestly priced and involve a
higher level of service. The third level concerns upscale events which require the
highest level of service, offer many courses and use the finest décor, linens and cutlery
(Thomas & Hansen, 2012:321). These levels of catering would be especially important
for SMMICs to consider in the decision related to their target market based on their
capabilities, desires and finances.

36
2.4.3.3 On-premise versus off-premise catering
Another way to categorise caterers, is according to whether they are on-premise or
off-premise caterers. On-premise catering is where the function is held on the physical
premises of the caterer (Shiring, 2014:5). In this type of operation there is a production
area (kitchen) and an adjacent area for dining (Matell, 2016:7). On-premise catering
has the advantage of offering many kinds of services, as well as providing adequate
space for the event, and sometimes, parking. Examples of food and beverage
operators offering on-premise catering are restaurants, hotels, resorts and cruise lines
(Shock et al., 2011:2).
Off-premise catering is a type of catering where the function or event takes place at a
location other than the one where the food is prepared. It requires the transporting of
the food, equipment and staff to the location. This presents the unique logistical
challenges of relocation and working in unfamiliar settings (Shiring, 2014:17).
Thomas and Hansen (2012:5) assert that off-premise catering is much more
challenging than on-premise catering. One reason is that this type of catering focuses
on meeting the needs of all market segments with their widely varying needs and
demands. Another reason is that off-premise caterers have to work in unfamiliar
locations, and deal with the challenges of transporting food, supplies and equipment
to the venue. However, this type of catering can be rewarding due to the wide variety
of work and varying experiences. Mattel (2016:11) adds that the biggest benefit of off-
premise catering is its significantly lower start-up costs. SMMICs would therefore be
more likely to select this form of catering. Off-premise catering will be explained in
detail in Chapter 3.
A variation of off-premise catering is outdoor catering, whereby a catering firm takes
complete charge of an outdoor event. Outdoor events typically require travelling,
outdoor locations and a great variety of activities. These can include garden parties,
sporting events such as horse racing and various agricultural and horticultural shows
(Foskett et al., 2016:15). SMMICs could, depending on their capacity, experience and
aspirations, choose to cater for outdoor events, or possibly specialise in certain types
of outdoor events only.
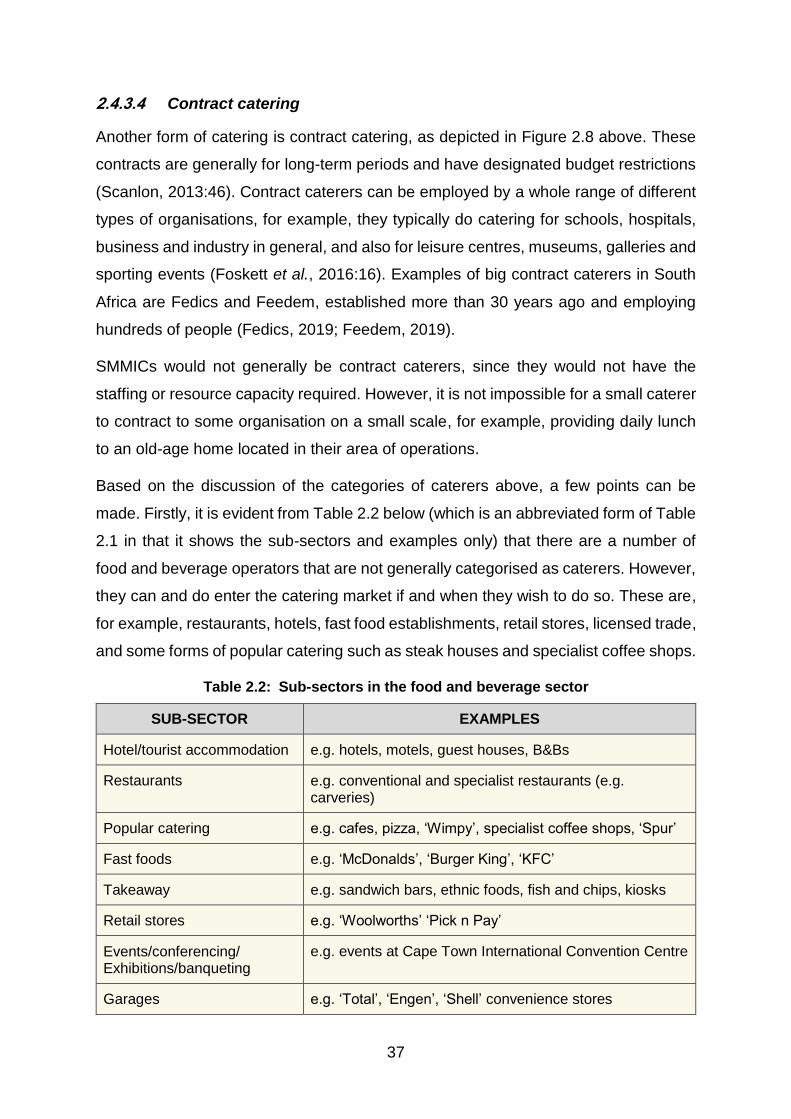
37
2.4.3.4 Contract catering
Another form of catering is contract catering, as depicted in Figure 2.8 above. These
contracts are generally for long-term periods and have designated budget restrictions
(Scanlon, 2013:46). Contract caterers can be employed by a whole range of different
types of organisations, for example, they typically do catering for schools, hospitals,
business and industry in general, and also for leisure centres, museums, galleries and
sporting events (Foskett et al., 2016:16). Examples of big contract caterers in South
Africa are Fedics and Feedem, established more than 30 years ago and employing
hundreds of people (Fedics, 2019; Feedem, 2019).
SMMICs would not generally be contract caterers, since they would not have the
staffing or resource capacity required. However, it is not impossible for a small caterer
to contract to some organisation on a small scale, for example, providing daily lunch
to an old-age home located in their area of operations.
Based on the discussion of the categories of caterers above, a few points can be
made. Firstly, it is evident from Table 2.2 below (which is an abbreviated form of Table
2.1 in that it shows the sub-sectors and examples only) that there are a number of
food and beverage operators that are not generally categorised as caterers. However,
they can and do enter the catering market if and when they wish to do so. These are,
for example, restaurants, hotels, fast food establishments, retail stores, licensed trade,
and some forms of popular catering such as steak houses and specialist coffee shops.
Table 2.2: Sub-sectors in the food and beverage sector
SUB-SECTOR EXAMPLES
Hotel/tourist accommodation e.g. hotels, motels, guest houses, B&Bs
Restaurants e.g. conventional and specialist restaurants (e.g. carveries)
Popular catering e.g. cafes, pizza, ‘Wimpy’, specialist coffee shops, ‘Spur’
Fast foods e.g. ‘McDonalds’, ‘Burger King’, ‘KFC’
Takeaway e.g. sandwich bars, ethnic foods, fish and chips, kiosks
Retail stores e.g. ‘Woolworths’ ‘Pick n Pay’
Events/conferencing/ Exhibitions/banqueting
e.g. events at Cape Town International Convention Centre
Garages e.g. ‘Total’, ‘Engen’, ‘Shell’ convenience stores

38
Leisure attractions e.g. theme parks, galleries, theatres, airline terminals
Industrial catering e.g. in-house operations or provided by catering contractors
Welfare catering e.g. hospitals, schools, colleges, universities, forces, prisons
Licensed trade e.g. public houses, wine bars, licensed/members’ clubs
Transport catering e.g. railways, airlines, shipping
Outdoor catering/off-premises/event catering
Catering market
Source: Adapted from Cousins et al., 2014:4
There are other food and beverage operators, such as convenience stores at garages
and takeaways, which are unlikely to be part of the catering market. For example, a
customer is not likely to enquire about catering from a garage forecourt retailer when
filling up on petrol, or from a server when buying a sandwich at a kiosk. The rest of the
food and beverage operators in the table clearly operate as caterers in one form or
another. These belong to the categories of industrial catering, welfare catering,
transport catering, conferencing, exhibitions, banqueting, leisure attractions and
outdoor catering/off-premises/event catering. SMMICs, the topic of this research
would fall into the last category, namely outdoor catering/off-premises/event catering.
Catering industry in South Africa
Aside from its demarcation by StatsSA, as an economic segment for statistical
purposes, the catering industry in South Africa falls under the Culture Art Tourism
Hospitality and Sports Sector Education and Training Authority (CATHSSETA). Codes
within CATHSSETA for the hospitality industry include hotels, motels, guest houses,
B&Bs, restaurants, fast food establishments, caterers, night clubs, pubs and time
share (CATHSSETA, 2019). It is evident therefore that catering falls specifically within
the hospitality industry in CATHSSETA.
The catering industry is also associated with the Federated Hospitality Association of
South Africa (FEDHASA), which is a national trade association recognised by the
South African government as representing the South African hospitality industry on
the various levels, whether local, provincial, national and global (FEDHASA, 2019). As
previously stated, FEDHASA is the umbrella association for hotels, restaurants,

39
conference centres, caterers, self-catering accommodation, B&Bs, guest houses,
clubs, taverns, shebeens, suppliers and trainers, and consultants and service
providers to the hospitality industry. Specifically FEDHASA has the following
membership segments (FEDHASA, 2019):
Hotels
Small accommodations: Guesthouses/B&Bs
Restaurants and catering
Allied: Suppliers and service providers to the industry
Youth: Students/trainees and entrants into the industry
Another association representing the catering industry is the South African Chefs
Association (SA Chefs). This is a non-profit organisation which represents chefs,
cooks and caterers at all levels. Its aim is to set and maintain excellent culinary and
food standards in South Africa. It focuses on skills development while running various
chef and cooking competitions, as well as a Certification and Designation Awards
Programme for uncertified chefs and cooks in South Africa (SA Chefs, 2019).
The next section focuses on SMMICs as the focal point of this research.
2.5 SMALL, MEDIUM AND MICRO INDEPENDENT CATERERS
(SMMICS)
As explained previously, SMMICs are a part of the catering segment of the food and
beverage sector, which is in turn part of the hospitality industry. It was also explained
above how SMMICs can fit into a number of categories within the catering segment.
This section presents an analysis of the nature of SMMICs and discusses the different
types of customers that these caterers cater for. The section concludes with a
discussion of the business context of SMMICs, and the quality assurance matters that
apply to these caterers.
Nature of SMMICs
Independent caterers are defined as “private businesses offering catering services to
the general public”. Some independent caterers have their own production facilities
and warehouse space, while others have to hire or rent these facilities (Scanlon,

40
2013:42). Independent caterers operate on their own and autonomously, in contrast
to some caterers that are large business concerns with a sizeable staff complement
(Weinberg 2007:1).
An interesting further description of a caterer is given as someone who has to be
knowledgeable about many things, including sales, the different types of food and
beverages, various kinds of events, religious practices, dietary requirements, keeping
up to date with trends, and even production and audio-visual services (Polici, cited in
Shock et al., 2011:viii). This description is particularly apt for SMMICs, as there would
typically be only one owner or manager who would need to be familiar with all these
factors.
As depicted in Tables 2.1 and 2.2, the catering market falls within the category of
outdoor catering/off-premises/event catering. This would apply to SMMICs, as they
cater for specific events, which for them, are most likely to take place at some off-
premise rather than on-premise location. These caterers can also choose to offer
outdoor catering.
Business context of SMMICs
With regard to the business context of SMMICs, Table 2.3 below provides a
classification of the various categories of SMEs within the various sectors or
subsectors in South Africa. The categories are determined according to the number of
full-time employees, total turnover and total gross asset value (excluding property). It
is noted that although a newer classification now exists, the questionnaire in this
research was based on the classification below.
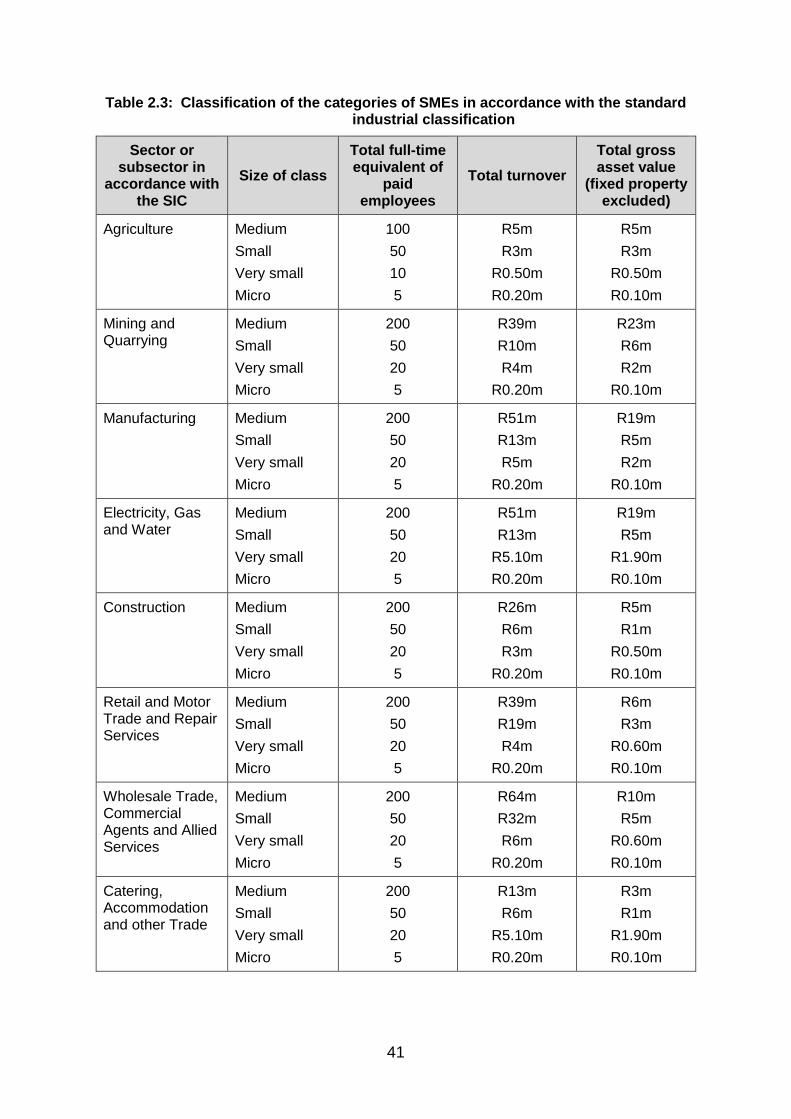
41
Table 2.3: Classification of the categories of SMEs in accordance with the standard industrial classification
Sector or subsector in
accordance with the SIC
Size of class
Total full-time equivalent of
paid employees
Total turnover
Total gross asset value
(fixed property excluded)
Agriculture Medium
Small
Very small
Micro
100
50
10
5
R5m
R3m
R0.50m
R0.20m
R5m
R3m
R0.50m
R0.10m
Mining and Quarrying
Medium
Small
Very small
Micro
200
50
20
5
R39m
R10m
R4m
R0.20m
R23m
R6m
R2m
R0.10m
Manufacturing Medium
Small
Very small
Micro
200
50
20
5
R51m
R13m
R5m
R0.20m
R19m
R5m
R2m
R0.10m
Electricity, Gas and Water
Medium
Small
Very small
Micro
200
50
20
5
R51m
R13m
R5.10m
R0.20m
R19m
R5m
R1.90m
R0.10m
Construction Medium
Small
Very small
Micro
200
50
20
5
R26m
R6m
R3m
R0.20m
R5m
R1m
R0.50m
R0.10m
Retail and Motor Trade and Repair Services
Medium
Small
Very small
Micro
200
50
20
5
R39m
R19m
R4m
R0.20m
R6m
R3m
R0.60m
R0.10m
Wholesale Trade, Commercial Agents and Allied Services
Medium
Small
Very small
Micro
200
50
20
5
R64m
R32m
R6m
R0.20m
R10m
R5m
R0.60m
R0.10m
Catering, Accommodation and other Trade
Medium
Small
Very small
Micro
200
50
20
5
R13m
R6m
R5.10m
R0.20m
R3m
R1m
R1.90m
R0.10m
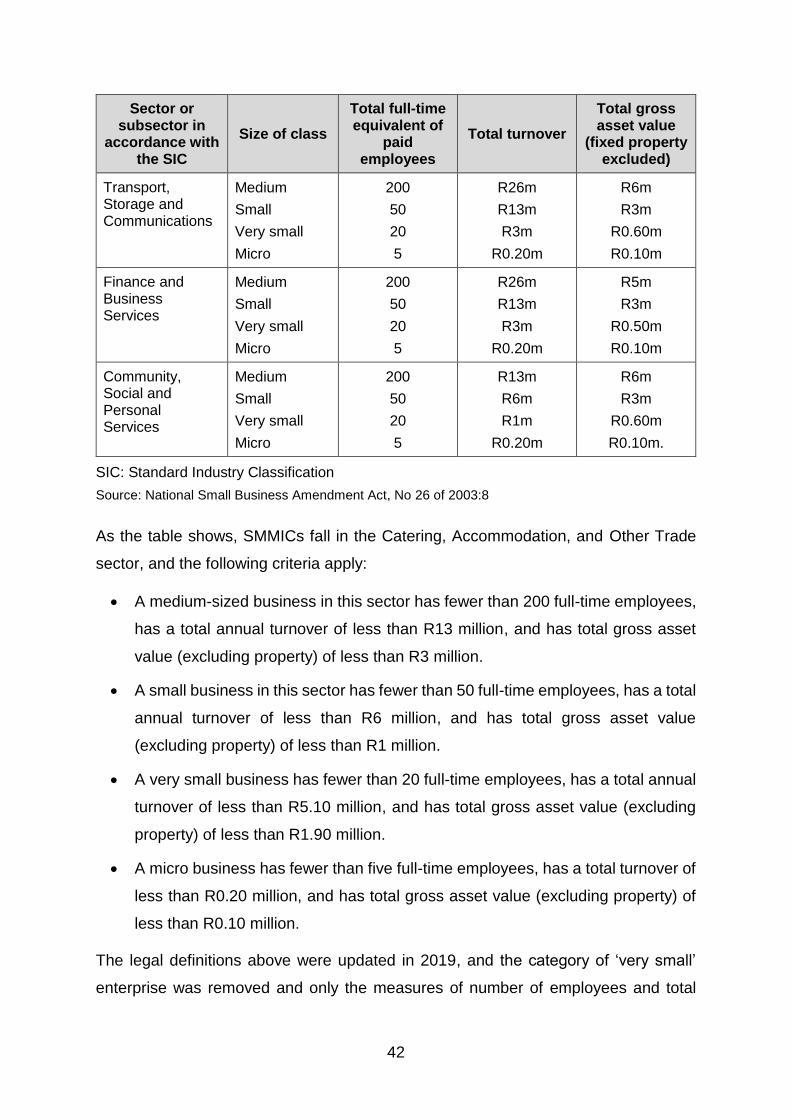
42
Sector or subsector in
accordance with the SIC
Size of class
Total full-time equivalent of
paid employees
Total turnover
Total gross asset value
(fixed property excluded)
Transport, Storage and Communications
Medium
Small
Very small
Micro
200
50
20
5
R26m
R13m
R3m
R0.20m
R6m
R3m
R0.60m
R0.10m
Finance and Business Services
Medium
Small
Very small
Micro
200
50
20
5
R26m
R13m
R3m
R0.20m
R5m
R3m
R0.50m
R0.10m
Community, Social and Personal Services
Medium
Small
Very small
Micro
200
50
20
5
R13m
R6m
R1m
R0.20m
R6m
R3m
R0.60m
R0.10m.
SIC: Standard Industry Classification
Source: National Small Business Amendment Act, No 26 of 2003:8
As the table shows, SMMICs fall in the Catering, Accommodation, and Other Trade
sector, and the following criteria apply:
A medium-sized business in this sector has fewer than 200 full-time employees,
has a total annual turnover of less than R13 million, and has total gross asset
value (excluding property) of less than R3 million.
A small business in this sector has fewer than 50 full-time employees, has a total
annual turnover of less than R6 million, and has total gross asset value
(excluding property) of less than R1 million.
A very small business has fewer than 20 full-time employees, has a total annual
turnover of less than R5.10 million, and has total gross asset value (excluding
property) of less than R1.90 million.
A micro business has fewer than five full-time employees, has a total turnover of
less than R0.20 million, and has total gross asset value (excluding property) of
less than R0.10 million.
The legal definitions above were updated in 2019, and the category of ‘very small’
enterprise was removed and only the measures of number of employees and total

43
annual turnover are currently used to determine the size for micro, small, medium and
micro businesses (De Wet, 2019). This is depicted in Table 2.4 as it relates to the
catering sector in particular.
Table 2.4: Classification of the categories of SMEs relating to the catering sector
Source: De Wet, 2019
Demand and supply with regard to SMMICs
It is important to determine the demand and supply factors that pertain to SMMICs. To
this end, the customers of these caterers will first be discussed. Thereafter, some ways
in which the caterers can satisfy the demand will be explained.
2.5.3.1 Customers of SMMICs
A caterer’s market is defined as “the group of all customers in a geographic surface
area who have unmet needs, wants or demands requiring food and beverage service”
(Shiring, 2014:58). SMMICs would thus typically focus on a specific geographic area
and define their target markets in that area.
To determine the target market, the caterer would need to determine exactly who its
customers are, as well as determine their needs and expectations. Waller (2009:x)
suggests that the following questions would be important to ask in this regard:
Who are our potential customers?
Why do people eat away from home?
When do they eat, at which times of the day and on which occasions?
Where do they eat and where do they look for the information that influences
their choices?
What do they eat and what influences their preference/choice?
Sector Size or class Total full-time
equivalent of paid employees
Total turnover
Catering, Accommodation and other Trade
Micro
Small
Medium
0-10
11-50
51-250
≤ R5M
≤ R15M
≤ R40M

44
As explained earlier (Section 2.4.3), the typical customers of SMMICs fall either in the
category of corporate business catering (for example, meetings, seminars and
ceremonies), or in the category of social catering (for example, weddings, parties and
reunions). SMMICs could decide to cater for one or both of these customer groups.
2.5.3.2 Supply by SMMICs
Once the target market has been identified, SMMICs need to determine what would
be the most profitable ways for them to cater for that target market. Some may find
that partial or restricted catering is the most suitable. This could entail, for example,
the preparation of cold food platters only which are dropped off with no added service.
Alternatively, a caterer may decide to provide cold and warm food platters, with or
without added service. Another option could be where a caterer may decide to provide
dishes which are picked up at its premises only. A further option is where a caterer
may choose to provide full buffet meals, with or without added service. There is also
the choice of full-service catering, where the caterer provides food and staff as well as
tableware, flowers, decorations and music. Many caterers cater for one or more of
these options, depending on the wishes of the customer (Artnetw0rk, n.d.).
Another important decision that SMMICs need to make is whether to be on-premise
caterers or off-premise caterers, or both. Most SMMICs do off-premise catering. As
explained earlier (Section 2.4.3), this entails caterers preparing the food at their
premises and then transporting and serving it at a location of the client’s choice
(Shiring, 2014:16; Scanlon, 2013:42).
Figure 2.9 below depicts an off-premise catering model which identifies the factors
involved in off-premise catering.

45
Figure 2.9: Off-premise catering model
Source: Thomas & Hansen, 2012:30
The model starts with the information that the caterer must know before commencing
operations. This is knowledge of managerial principles and philosophy, and also
knowledge of the various regulations that are applicable to off-premise caterers.
The model then outlines four basic functions which the caterer carries out. These are
planning, preparation, the party (or event), and output. In planning, the caterer makes
decisions with regard to marketing, site inspections and other items such as menu,
staff, pricing and contracts. After the planning is completed and contracts with the
client are drawn up and signed, the next stage is the preparation phase. This entails
the purchasing of food ingredients and equipment, generating a ‘pull sheet’ (which
details all the items required to produce the party) and checking on staffing matters.
On the day of the party, the emphasis is on delivery, cooking, serving and cleaning up.
After that the final stage, called output, is where financial information, such as revenue,
expenses and profit and loss, is calculated and also where the client generates an
opinion about the event (Thomas & Hansen, 2012:30-31).
Off-premise catering will be discussed further in Chapter 3.

46
Quality assurance of SMMICs
The term ‘quality’ is explained as the opinion of an individual about how good or bad
a product is, based on the individual’s perception or beliefs. Customers become more
critical of quality, the more often they patronise a business, for example, if the standard
of quality they have come to expect is not maintained (Scanlon, 2013:206,208). At
present, word-of-mouth and written evaluations (written personally or via social media)
appear to be the chief avenue of quality assurance for SMMICs in Cape Town.
Although SMMICs are not compelled to join any trade, grading or award granting
association, there are two associations that caterers can join, namely, the Federated
Hospitality Association of Southern Africa (FEDHASA) and the South African Chefs
Association (SA Chefs). These associations were discussed earlier (Section 2.4.4).
Johannesburg has the annual Readers’ Choice Awards, which includes a category for
best caterer (Best of Joburg, Readers’ Choice Awards, 2019). However, Cape Town,
where this research was conducted, does not appear to have any kind of award for
caterers. Therefore, there are no avenues for SMMICs in Cape Town to receive public
recognition, besides word-of-mouth recommendations from customers, and
comments or recommendations on Facebook and other social media.
2.6 CONCLUSION
In this chapter, a line was traced from the huge hospitality industry down to the level
of SMMICs. In the discussion, various aspects of the hospitality industry, the food and
beverage sector, the catering segment and SMMICs were considered. These included
the important characteristics of the hospitality industry, the supply and demand factors
in the food and beverage sector, the various types of caterers in the catering segment,
and the nature of SMMICs.
The next chapter focusing on the business environment of SMMICs will discuss the
micro, market and macro environment in which SMMICs operate.

47
CHAPTER 3:
THE BUSINESS ENVIRONMENT OF SMALL, MEDIUM AND
MICRO INDEPENDENT CATERERS
3.1 INTRODUCTION
The purpose of this chapter is to focus on the factors in the business environment of
small, medium and micro independent caterers (SMMICs) in Cape Town that could
have an impact on their operations. In this context, the nature and importance of the
business environment will be examined. After that, the micro, market and macro
environments of the SMMICs will be discussed, as well as possible strengths,
weaknesses, opportunities and threats in these environments.
3.2 THE NATURE OF THE BUSINESS ENVIRONMENT
The business environment is comprised of all the factors that may have a positive or
negative influence on a business, and which therefore assist, or deter, the business
from reaching its objectives (Botha, 2018:29). As the business environment is not
static and can sometimes change, the business needs to adapt and change as well.
Change involves new resources, a new vision and mission, new strategies and goals,
and discovering new strengths and weaknesses (David & David, 2015:41).
Businesses should therefore constantly be aware of environmental forces that cause
changes, and should mobilise their resources to take advantage of the opportunities
in the environment, and they should similarly be able to counter the threats that arise
(Thompson & Martin, 2017:113).
There are some important characteristics of the business environment that should be
noted (Botha, 2018:30):
The variables in the environment are interrelated, and there is increasing change
and volatility in the environment due to the links between the variables.
Some industries experience more fluctuations than others.
The level of environmental uncertainty is dependent on the amount of information
available about the environment.
The business environment is complex and unpredictable.

48
When applying some of these characteristics to catering it can be seen, for example,
that a trend toward healthier eating in the social environment would cause changes in
the internal environment, whereby caterers would need to revise their menus,
marketing strategies, and some of their purchasing and operations patterns.
The business environment consists of three following sub-environments, with their
related variables: the micro environment, the market environment and the macro
environment, as depicted in Figure 3.1 below.
Figure 3.1: The business environment of SMMICs
Source: Adapted from Erasmus et al., 2019:127
As shown in Figure 3.1, the micro environment is comprised of the following variables:
mission, vision and objectives, functional management areas and resources. The
market environment is comprised of the market, suppliers, intermediaries and
competitors. The macro environment consists of the following environments: the social
environment, technological environment, economic environment, physical
environment, political-legal environment and the international environment. The
degree of influence that each of these sub-environments has on the business and the
amount of control that the business in turn has over the environments is also shown
in the figure.

49
A detailed discussion of these three environments follows in the next sections. In order
to manage the impact of the factors in the business environment and remain
competitive, a business has to identify and analyse the strengths, weaknesses,
opportunities and threats using the technique of a SWOT analysis. The SWOT
analysis is explained in Section 3.6.
The next section discusses the micro environment of SMMICs.
3.3 THE MICRO ENVIRONMENT
The micro environment is situated within the business and consists of the following
three main groups of variables:
1. The vision, mission and objectives;
2. The business management and organisational functions; and
3. The production factors, which include the resources of the business.
Management has direct control over this environment (Botha, 2018:31-34).
Figure 3.2 illustrates this environment in the context of SMMICs. It is shown how the
variables directly impact on the SMMICs, and in turn, how the SMMICs directly control
the variables. These variables will be discussed in detail in this section.
Figure 3.2: Micro environment of small, medium and micro independent caterers
Source: Researcher’s own interpretation
Vision, mission and objectives
The mission and vision statements of an organisation are encapsulated in its strategic
direction. The mission refers to the purpose of the organisation, and the reason for its
50
existence. The vision refers to a desired position that the organisation would like to be
in the future. The vision and mission statements form the basis for establishing the
strategic direction and objectives of an organisation (David & David, 2015:171,173).
Research done on SMEs in South Africa indicates that they perform at higher levels
of business performance when they have invested in mission and vision statements,
engage in environmental scanning, and formally carry out strategic planning
(Sandada, 2014:65).
Mission statements are important because they create a structure which guides
management and employees. They also incorporate all aspects of the business, such
as price, quality, service and relationships with customers and the community (Botha,
2018:87). It appears that SMMICs who devote time to drawing up mission and vision
statements, and that ensure that they are adhered to, exhibit a stronger foundation for
the business, and that those who do not would be exposing a weakness. An example
of a mission statement for a caterer could be “to fulfil the catering needs of households
in Area X by providing professional service and excellent food quality”, while its vision
statement could be “to delight customers with amazing food and faultless service”.
After the vision and mission statements have been set, a caterer would need to set
specific objectives or goals. These could relate to, for example, sales volumes,
customer satisfaction, consistent quality and service, cultivation of an image, being
dependable, flexible and delivering what is promised (Shock et al., 2011:11). The
goals could be set according to ‘SMART’ principles: Specific, Measurable, Attainable,
Relevant and Time-bound (Thomas & Hansen, 2012:13). An example of a SMART
goal for a caterer could be “to increase sales income by 15% per year for the next
three years”.
Management can face a number of challenges in trying to meet its objectives. These
can include struggling to market a distinct image, spending too much time with clients,
attending to unique demands from customers, difficulty in costing and pricing, ethical
issues, division of responsibility, time pressures, coordinating with other agencies,
retaining qualified workers, and lack of food knowledge (Shock et al., 2011:28).
Therefore, setting realistic, viable objectives and being able to reach them would be a
strength for SMMICs, while setting unrealistic objectives or being unable to reach them
would be a weakness.

51
Management functional areas
Some aspects of the general function of management, as well as the various business
functions pertaining to SMMICs, are discussed below.
3.3.2.1 The general management function
The management function entails the management tasks of planning, organising,
leadership and control. For a caterer, management commences with planning for a
catering event. The first step involves ascertaining the customer’s wants and needs.
Next, objectives for the event are formulated, after which, decisions are made and
operational tasks set up concerning budget, menu, location, number of guests and
labour requirements.
Organising revolves around creating the menu, writing specifications, ordering,
receiving, issuing, producing, transporting and service. Since good service is a crucial
element of a successful event, the caterer ensures that staff members are well trained
and motivated, and are able to professionally serve customers. After the event, the
caterer performs the control function by monitoring performance compared to the
objectives set, and evaluating aspects such as cash income, food, beverages,
equipment and service (Shiring, 2014:124-271). A caterer needs to exhibit certain
qualities to be able to succeed. A number of these qualities, as identified by Mattel
(2016:5), are depicted in Figure 3.3 below.
Figure 3.3: Qualities of a successful caterer
Source: Researcher’s own interpretation (Mattel, 2016:5)
The qualities directly linked to management are the following: excellent organisational
skills, excellent networking skills, a high level of written and verbal communication

52
skills, leadership and motivational skills, good negotiating skills, and quick thinking and
problem solving skills. It is clear that a caterer who possesses these wide-ranging
qualities would be a source of strength for the business.
A typical organisation chart of an off-premise caterer, as explained in Chapter 2
(Section 2.4.3.3), is depicted in Figure 3.4 below. Most SMMICs focus on off-premise
catering, which entails preparing the food at their premises and then transporting and
serving it at a location of the client’s choice (Scanlon, 2013:42).
Figure 3.4: Organisation chart of an off-premise caterer
Source: Mattel, 2016:89
A few of the most important positions in the chart will be briefly explained. The head
chef is in charge of everything that takes place in the kitchen and also does the
following: the planning of menus, the developing of recipes and consequent creating
of the recipe manual, the ordering of food, the training of kitchen staff, liaising with
event planners and reporting to the business owner or manager.
Another important position is that of sous chef who is generally an assistant to the
head chef. In the service area, there is the position of service manager who is in charge
of service in all areas. Below that position is the captain who supervises the wait staff

53
and who takes responsibility for certain sections in the service area (Mattel, 2016:88,
90).
A strength for SMMICs would be good organising skills in setting up job categories,
and in allocating the appropriate authority, responsibility and accountability.
It should be noted that not all SMMICs would have all the staff positions as indicated
on the chart.
3.3.2.2 The marketing function
Marketing is “the process of developing sales plans, recognising industry trends,
identifying customer needs, developing products, prices, advertising and promotion
and sales (both direct and indirect) and measuring the success of all of these efforts
combined” (Scanlon, 2013:66). There is a positive correlation between the success of
a business and the relevant marketing skills, and therefore, marketing activities result
in the growth of a business, and in turn, the general economic upliftment of society
(Cant, 2012:1115).
It is therefore evident that caterers need to invest in marketing. Scanlon (2013:66)
emphasises that marketing is required for catering businesses to grow and develop,
and that weak marketing plans and activities can cause businesses to fail. Research
by Cant & Wiid (2013:8) on SMEs in Tshwane South reveals that incorrect pricing
strategies, the low demand for products, business site location, and lack of knowledge
of the target market are the most important marketing challenges which affect these
SMEs.
Marketing entails the four main elements of the marketing mix, namely, product,
pricing, promotion and place, which are used to influence consumer behaviour to
purchase. For a food and beverage concern, the ‘product’ would entail aspects such
as the menu, food quality, décor and demeanour of serving staff. ‘Pricing’ is
determined based on the need for profitability versus what customers are willing to
pay, as well as taking into account any specials and discounts. ‘Promotion’ is
performed through various advertising channels. The use of social media for
promotion is discussed below. ‘Place’ includes aspects such as the location of the
service point, the location of the central cooking unit and transportation methods
(Davis et al., 2018:305,306).

54
The marketing cycle of the caterer, as outlined in Figure 3.5, is briefly explained.
Figure 3.5: Marketing Cycle
Source: Scanlon, 2016:67
The first step in the marketing cycle is to identify customer needs. Successful caterers
should recognise the demographic and social trends that influence customer needs.
Next is the creation of a product or service. The use of customer surveys, focus groups
and feedback forms can generate ideas for new products and services. In developing
customer interest, a caterer can make use of various promotional strategies to inform
and persuade customers, for example, through as direct-mail campaigns and social
media. Finally, the caterer measures success, based on the number of customer
responses, and sales and profitability figures (Scanlon, 2013: 67-74).
Successful caterers are those who develop a unique selling point, or are able to target
a niche market, and thereby create a competitive advantage. This may be, for
example, specialising in party platters, or upmarket home dining, or special dietary
needs (Mattel, 2016:6).
There are a number of methods that caterers can use to promote their businesses.
These include flyers, brochures, business directories and sponsorships. Social media
is another powerful tool where caterers can post pictures of food, share original
recipes, demonstrate cooking videos, produce blog posts and share relevant new
items (Picinu, 2019). Examples of social media are Facebook, Twitter, Pinterest,
Instagram, YouTube, websites and blogs. Shiring (2014:98,100) states that using
social media “is a way for a caterer to build credibility, generate buzz and increase
revenue.”
According to Essential Chef (2015), an example of the power of social media in the
catering industry is illustrated in the quote below:
Dining is no longer just a personal experience, but a chance to stage an
extraordinary event along with the bragging rights that come along with these
galas. With the popularity of social media and easy photo sharing, food art,

55
plating and lighting become increasingly important as party-goers share
every aspect of the event on Instagram, Snapshot, Facebook, and Twitter.
Customers collaborate to put on the show.
However, while it is vitally important to have an effective up-to-date website, word-of-
mouth is the most powerful means of advertising for a foodservice operation (Shock
et al., 2011:71, 81). It is noted that word-of-mouth testimonials are (also) spread via
the internet and social media (Shiring, 2014:98).
Based on the evidence above, SMMICs who invest time in marketing will benefit
greatly from their efforts and this will be a definite strength for the business. However,
SMMICs must ensure that the customer is fully satisfied at a catering event so that
word-of-mouth advertising can spread.
3.3.2.3 The operations function
The operations function deals with the process that creates goods and services. This
is performed by the transformation of inputs into outputs (Hermann & Du Plessis,
2016:198). An effective operations structure will reduce expenses, create a
competitive advantage, and result in a well-run, productive business (Van Aardt &
Bezuidenhout, 2014:316).
The steps involved in a catering event were demonstrated in the off-premise catering
model which was depicted and explained in Chapter 2 (Section 2.5.3.2). The model
indicates that the operations of the caterer commences with the determination of
managerial principles and philosophy. Thereafter, the operations functions are
planning, preparation, the party (which is the show or event) and output. Output refers
to the calculation of expenses and profit and loss of the event (Hansen & Thomas,
2015:30-31). Shiring (2014:120) adds that monitoring and controlling should be done
throughout the event, and that the caterer should ensure that all legal, risk and
insurance measures are in place.
The planning and carrying out of the logistical operations for an off-premise event is a
very important management function. It is vital for off-premise caterers to visit the
venue beforehand and to ensure that the correct equipment is used to prepare,
transport and serve the food on location (Shiring, 2014:16). Based on the above, it is
apparent that a caterer who does careful planning for off-premise catering events, and
who pays attention to detail exhibits a strength for the business.

56
Some important components of the operations function include the location, the
facilities needed for production and the equipment required (Van Aardt &
Bezuidenhout, 2014:316).
Location
With regard to location, as stated previously, SMMICs are typically off-premise
caterers. Off-premise caterers cater for events in any location. Examples of two off-
premise locations are illustrated in Figure 3.6 below.
Figure 3.6: Examples of locations used in off-premise catering events
Source: The Heights Catering, 2019
Production facilities
An important aspect for SMMICs is their food preparation areas. The manner in which
the catering kitchen is designed and laid out is key for the successful operation of a
caterer. Proper systems should be in place for the receiving and storage of food, for
the preparation and assembly of food, for worker and food safety, and for clearing and
cleaning (Mattel, 2016:52). A workflow should be created where there is minimum
obstruction, and that allows for the optimal use of equipment with the least time and
effort involved (Foskett et al., 2016:95).
Equipment
With regard to kitchen equipment, the two main categories are basic large equipment
(for example, stoves, deep fryers and pressure-less steamers), and basic small
equipment (for example, pots, knives and sheet trays). Equipment should always be
carefully cleaned and stored (Shiring, 2014: 211, 212).
Figure 3.7 below illustrates a typical commercial kitchen used by a caterer.

57
Figure 3.7: Example of a commercial kitchen
Source: The Artisan Kitchen, 2019
3.3.2.4 The human resource function
Since productive and motivated employees are vitally important to the small business
it is essential to search for, hire and retain the best staff available. Competitive
businesses manage their staff capably and efficiently (Van Aardt & Bezuidenhout,
2014:329).
Caterers require kitchen staff as well as service staff. In both areas, a successful
catering business requires staff members that exhibit the required expertise and who
can fit in with flexible schedules (Scanlon, 2013:70). Staff should also be well trained,
capable and have the goal of customer satisfaction at all times (Foskett et al.,
2016:361). Images of catering staff are shown in Figure 3.8 below.
Source: Local Event Caterers, 2019 Source: Weddbook, 2019
Figure 3.8: Catering staff

58
Many caterers find that problems with staff constitute the most difficult part of their
business, and this includes work absenteeism, personality issues and insubordination.
In addition, termination is not automatically an option since it is difficult and expensive
to replace a trained employee (Mattel, 2016:110). Management needs to direct and
motivate staff to ensure the productivity and profitability of the business. Motivation
strategies could include financial rewards for good performance, giving praise or
recognition, and granting extra responsibility or authority (Foskett et al., 2016:372).
It is apparent from the evidence above that having loyal and committed staff would be
a tremendous strength for a catering business, and that staff who are not dedicated to
their jobs would be a source of great weakness.
There are a number of laws and bargaining council regulations relating to the
employment of hospitality staff that could affect SMMICs in Cape Town. The Acts that
are applicable to the hospitality industry, include the Occupational Health and Safety
Act, the Compensation for Occupational Injuries and Diseases Act and the
Employment Equity Act. In addition, there are two bargaining councils, the Tearoom,
Restaurant and Catering Bargaining Council and the Restaurant, Catering and Allied
Bargaining Council which negotiate on behalf of their members (Business Partners
LTD, cited in SME Toolkit South Africa, 2016).
3.3.2.5 The finance function
The finance function entails acquiring appropriate financial resources, and ensuring
the optimal use of finances to achieve the desired results. Relevant activities include
securing prerequisite funding at the best terms possible, recording all financial
transactions accurately and timeously, and safeguarding payments and cash received
(Fourie & Conradie, 2017:4). Organisations need to assess their financial strengths
and weaknesses before determining their plans and strategies. In this regard, they
need to consider their working capital, liquidity, cash flow and assets (David & David,
2015:202).
Lack of adequate finance and the cost of finance are often listed by owner-managers
as obstacles to growth (Burns, 2011:259). For foodservice operations particularly, a
primary cause of failure is shortage of funds for working capital. Business owners need
to ensure that they have adequate financial resources for items such as product

59
purchases, maintenance, and repair work, and that salaries are adequately provided
for (Foskett et al., 2016:284).
It is evident that there are benefits for caterers who manage their finances carefully,
and that those who do not pay careful attention to their finances could place their
businesses in a precarious position.
3.3.2.6 The purchasing and supply function
The purchasing function refers to the activities involved in obtaining materials, goods
and services (commodities) for the business. The objective is that the flow of these
commodities should be continuous, delivered timeously, in the right quantities, and
also at terms favourable to the business (Badenhorst, 2018:4). The purchasing
process is concerned with determining purchasing needs, identifying suppliers,
negotiating with suppliers, placing and following-up orders, receiving and inspecting
items and stock-keeping (Van Aardt & Bezuidenhout, 2014:277).
Figure 3.9 below shows examples of purchases of serving ware that are required by
caterers. These include serving dishes, tableware, and glassware and crockery.
Figure 3.9: Examples of serving ware
Source: Wilkes Group, 2019
When buying food supplies the purchaser should write down the purchase
specification of each item that is on the menu for an event. It is also important to buy
produce at the right time, and purchasers should be aware of the shelf life of products.
It is also essential when selecting suppliers, to find out about their reputation, their
knowledge of their products, their stock lists and their pricing policies (Thomas &
Hansen, 2012:390,392,394).
Based on the information above, a business strength is derived from caterers taking
care in the purchase of their equipment, serving ware and food supplies, while also

60
paying attention to selecting the right suppliers and cultivating a good relationship with
them.
Resources of the business
A key area that should be analysed in the micro environment of a business is its
resources, both tangible and intangible (Moore, Petty, Palich & Longenecker,
2010:74). Resources are key assets or inputs that a business requires to be able to
operate. They can be tangible (for example, cash, buildings, equipment and labour) or
intangible (for example, skills, knowledge, reputation and brand) (Evans, 2015: 80).
Resources assist in making the products and services of a business unique and
appealing, and it is therefore important for a business to identify, develop and use a
set of resources able to achieve this (Amason, 2011:111-112). Viewing the business
in the context of resources is a way of gaining a competitive advantage through
prioritising the application of internal resources in the correct mix, type, nature and
amount (David & David, 2015:191). An audit and evaluation of strategic resources
entails identifying the main skills and resources within an organisation, after which they
are compared with those of competitors, and also in terms of what is required to
succeed in the industry (Thompson & Martin, 2017:164).
While there are different ways of categorising resources, Figure 3.10 presents one
way of depicting the important resources that an organisation should evaluate.
Figure 3.10: Categories of resources in an organisation
Source: Thompson, 2017:165; Evans, 2015:85

61
The figure depicts six main categories of resources, namely, financial, information,
operations, human, marketing and intangible, with examples of each. All of these
resources appear to be fully applicable to catering businesses. Based on the
discussion above, it is evident that caterers should take time to carefully evaluate their
resources and determine which are strengths for the business, and which are
weaknesses. They should then take steps to remedy the problem areas.
The next section evaluates the market environment in the context of the opportunities
and threats which exist in this environment for the caterer.
3.4 THE MARKET ENVIRONMENT
The market environment is found directly outside the business. It influences, and in
turn, is influenced by the micro and macro environments. It is generally composed of
customers, suppliers and competitors, and also intermediaries such as wholesalers,
brokers and banks (Botha, 2018:34-38).
The market environment and its impact on the SMMICs are depicted in Figure 3.11
below.
Figure 3.11: The market environment of the business
Source: Researcher’s own interpretation
The green arrows indicate the limited influence that SMMICs have on the variables in
the environment, while the other arrows indicate the much stronger influence that the
variables in the environment have on the SMMICs. The four variables are discussed
below.

62
The market environment
The target market of a business can be defined as comprising of existing or potential
consumers who are willing to engage in a process of exchange to obtain goods or
services which will satisfy their wants or needs (Van Aardt & Bezuidenhout, 2014:297).
In order to market products cost effectively, market segments should be identified.
Market segmentation was discussed in Chapter 2 (Section 2.3.4.2). In the food service
industry, market segmentation can be done according to geographic area, age group,
socio-economic status, disposable income and family life cycle (Davis et al.,
2018:300,301).
Caterers, therefore, need to understand the various demographic and social trends
which impact on customers, and to capitalise on the relevant marketing opportunities
that may be perceived (Scanlon, 2013:67). Shock et al. (2011:35) point out succinctly
that “catering is a consumer-driven industry that is stimulated by clients who demand
exceptional quality and excellent value for a reasonable price.” They add that there
are many types of potential customers for caterers, and that new types of clients
appear all the time.
Various methods, such as profiling and demographic market surveys, are used by
businesses to obtain information about their target customers. Profiling provides
information on the demographics, geographics and psychographics pertaining to the
consumer. Some questions which can be asked in this regard are (Hiduke & Ryan,
2013:91,117):
What are the needs of the customers?
What quality do they wish for with regard to the product and services?
What price will they pay?
What is the competition?
Demographic market surveys reveal information such as population, age, income,
religion and spending habits (Mattel, 2016:17). However, according to Scanlon
(2013:55), it can be difficult to determine a final customer profile for catering services
because of the diversity of age groups and needs. For example, there are demands
for a wide variety of functions such as banquets, weddings, business functions and
parties by various age groups.

63
The two major off-premise catering markets are the corporate market and the social
market (Thomas & Hansen, 2012:318), as depicted in Figure 3.12. As stated in
Chapter 2, these are the two markets that SMMICs primarily cater for.
Figure 3.12: The corporate and social markets of SMMICs
Source: Researcher’s own interpretation
A further way in which caterers can divide markets is to select different geographic
areas and to create budget ranges for customers within each area. These ranges are
classified generally as low-end, mid-level and high-end (Shock et al., 2011:35).
Finally, it is important to note that customer satisfaction is paramount, and is the base
for the growth and profitability of a business. In planning for catering events, customers
should be served professionally at all times and full attention should be paid to their
needs, wants and demands (Shiring, 2014:75). Excellent food should be served in an
atmosphere where customers feel welcome and at ease (Foskett et al., 2016:344).
The competitive environment
It is important for a business to be aware of the competitive forces it faces in its
industry. A tool used to analyse the competitive environment of a firm, the Five Forces
framework or model, was developed by Michael Porter (Burns, 2011:146). Figure 3.13
below is a depiction of the Five Forces model.

64
Figure 3.13: Major factors offsetting market attractiveness
Source: Moore et al., 2010:73
The model shows: 1) the power of buyers, 2) the power of suppliers, 3) the threat of
new entrants, 4) the threat of substitutes, and 5) the competitive rivalry in the industry.
The weaker the five forces, the better the chances that the business will survive and
perform well. The strengths of these factors are depicted as weights which could
potentially outweigh the attractiveness of the market if they are strong enough to do
so (Burns, 2011:146).
Applying the framework to SMMICs in Cape Town, it is apparent that the first
competitive force in the model, the threat of new competition, is a significant factor. It
is not difficult to start a small catering business, as the main requirements are a
business licence and a certificate of availability (City of Cape Town, 2019b). It is
therefore fairly easy for new caterers to enter the industry.
The second competitive force, substitute products or services, implies that customers
can make use of other products and services to fulfil the same function (Moore et al.,
2010:72). A substitute for a catered event could be to hold the function at a restaurant
where patrons make their choice from the menu or buffet if one is provided.

65
Consumers could also decide to cater for the event themselves or ask friends and
family to do the catering. Another option could be to purchase the necessary food
items from a supermarket or one of the other food and beverage providers, as
mentioned in Chapter 2.
The third competitive force, intensity of rivalry among existing competitors, appears to
be a possible threat in the catering industry in Cape Town. For example, an internet
search revealed that there are about 250 active SMMICs advertising their services in
the greater Cape Town area.
Figure 3.14 below shows a map of the area.
Figure 3.14: Map of the greater Cape Town area
Source: Vacations Dream, 2019
As seen on the left of the map, important towns range from Simon’s Town and
Noordhoek in the south, the City Bowl in the middle, and Milnerton, Durbanville and
Bloubergstrand in the north. In the middle of the map are found Grassy Park and
Mitchells Plain (not shown) to the right of Muizenberg, Bellville in the middle, and
Durbanville in the north. On the right of the map there are Strand and Gordon’s Bay,
with Somerset West in the south, Stellenbosch in the middle and Paarl in the north.

66
Many caterers offer their services all over the greater Cape Town area, as shown in
extracts taken from their websites (depicted in Figure 3.15 below). Many also indicate
that they cater for the corporate as well as the social market.
Figure 3.15: Example of SMMICs in Cape Town promoting their offerings on their websites
The fourth competitive force refers to the bargaining power of suppliers in the industry.
An internet search for food and equipment suppliers in Cape Town reveals that there
are a number of food manufacturers, wholesalers and suppliers of catering equipment
available to supply the needs of the SMMICs. It is not known how powerful these
suppliers are and how much bargaining power they have.
The final competitive force concerns the buyers or customers in the industry. Through
the internet, consumers have a lot of information about all the types of caterers and
options available to them. This means that consumers can switch caterers very easily.
Social media is also a way for buyers to quickly express their satisfaction or
dissatisfaction. This could be a threat or opportunity for the business, depending on
what the nature of the feedback is.
It is important for SMMICs to conduct a thorough analysis of their competitors to allow
them to determine ways of differentiating their business from the competition, and to
determine any potential new market niches. The type of information that can be

67
gathered about a competitor include the name and address of the competitor, the kind
of function space that it has, the types of customers it serves, the number of guests it
can take, the products and services it offers, and the kind of atmosphere that it
promotes, for example, sophisticated, traditional, rustic or elegant (Shock et al.,
2011:56-57).
Thereafter, SMMICs need to determine their competitive strategies. Some could follow
closely what their competitors are offering, while others could try to be completely
different, for example, regarding their menu items. Various strategies could involve
differences in quality, service, pricing, novelty, types of foods, and a good sales
approach (Mattel, 2016:25).
Competitive forces could pose significant threats to SMMICs in Cape Town. It is
evident that some SMMICs attempt to differentiate themselves in particular ways.
Figure 3.16 below gives examples of differentiation by caterers, as taken from their
websites.
Figure 3.16: Examples of SMMICs in Cape Town highlighting areas of differentiation
The supply environment
Suppliers deliver the inputs that businesses use to make and provide their products
and services. These inputs range from raw materials and equipment to finance and
labour resources (Erasmus et al., 2019:133). Caterers and food suppliers need to
develop good working relationships, and should foster an understanding of each
other’s responsibilities, particularly with regards to price, delivery and quality or
standards (Foskett et al., 2016:247; Mattel, 2016:34). In particular, caterers should

68
evaluate suppliers in terms of the following six areas: product range, product samples,
price lists, trading terms, other customers, and supply chain (Davis et al., 2018:162).
An efficient supply of catering equipment and food and beverage products is essential
for SMMICs in Cape Town. Regarding food supplies, Cape Town is well established
as a national centre for the manufacturing of food and beverage, and hosts some of
South Africa’s largest food and beverage manufacturing companies (Invest Cape
Town, 2019).
A google search using the keywords “catering equipment cape town” reveals more
than 40 suppliers of new or second-hand catering equipment. These suppliers
generally all have sophisticated websites, with detailed descriptions of their products
and services. The same applies to the websites of food distributors in Cape Town.
Figure 3.17 below is an example of the website pages of two catering equipment
suppliers and two food suppliers.
Figure 3.17: Web pages of food and catering equipment suppliers in Cape Town
The equipment that SMMICs generally need falls within the categories of cooking,
refrigeration, food preparation, beverage, dishwashing, cleaning equipment, butchery,
kitchen utensils, buffetware, tableware and uniforms (Premium Kitchens, 2019).

69
Supplies with regard to food and beverages include dry goods, frozen goods,
refrigerated goods, dairy, treats and dessert, canned food, cordials and drinks, deli
items, spices and condiments. Other types of supplies are cleaning materials and
packaging (Gourmet Food Distributors, 2019).
Information and communication technologies are revolutionising the way food and
drink services are rendered and businesses are run in the hospitality sector
(Sekulovska, 2016). At present, there does not appear to be any company providing
IT systems specifically designed for caterers in Cape Town, although there are various
vendors offering catering software online.
The intermediary environment
Intermediaries enable goods and services to be transferred to the consumer.
Examples are wholesalers, retailers, agents, and brokers (Weedmark, 2019). There
are also financial intermediaries which include banks, insurance companies and
pension funds (Pettinger, 2018). For example, SMMICs would require services from
wholesalers and distributors, and also banks and insurance agents should they require
financial assistance.
Another type of intermediary is the agent who facilitates business between the
customer and the SMMIC. These could be, for example, party or wedding planners
who are hired by customers and who take responsibility for everything, including
catering. Other examples of intermediaries are transportation companies and travel
agents who book catered meals for clients, or event planners who require the services
of a caterer.
Local government agencies are also regarded as intermediaries as they render
services when events are scheduled to take place in a public area, or which involve
fire, parking, an off-site liquor licence, and off-premise kitchen facilities (Shock et al.,
2011:329).
There are also new forms of intermediaries coming on the market, for example,
smartphone applications (apps) which enable customers to order from caterers or
restaurants, and have the food delivered to their choice of location (Khan, 2019). This
could be a threat or opportunity for SMMICs, depending on whether they are able or
willing to make use of these apps or not.

70
The macro environment of the SMMICs is discussed in the next section.
3.5 THE MACRO ENVIRONMENT
There are a range of variables in the macro environment that can influence the
business. It is particularly important to consider the various forces in the macro
environment which can influence SMEs/SMMEs. For example, research in Tshwane,
South Africa, indicated that the major macro environmental variables affecting SMEs
in that area, are crime, legal requirements, and economic factors such as
unemployment, inflation and interest rates (Cant & Wiid, 2013:8).
The variables in the macro environment can be combined into various acronyms, such
as STEEPLE, PESTLE or SLEPT, and they basically indicate some or all of the
following: socio-cultural, technological, economic, environmental (physical), political-
legal and international variables. The variables are depicted in Figure 3.18 below.
Figure 3.18: Macro-environment variables which impact SMMICs
Source: Researcher’s own interpretation
Each of the variables in the figure will be discussed below.
The socio-cultural environment
The socio-cultural environment refers to various trends in society that affect the needs
of consumers, as well as their buying decisions, such as, for example, lifestyles,
demographics and values and behaviours (Cant & Van Heerden, 2018:50).
A number of changes have been identified in the socio-cultural environment worldwide
that influence the catering industry. For example, there is mass urbanisation, which
has contributed to a change in eating habits, such as a move to processed food. There
are demographic trends, such as the increase in single households, and the

71
phenomenon of smaller families, which fuels the demand for ready-to-eat foods. There
is also the trend to more healthful living and organic products, as well as the
increasingly important issue of food waste (Neves, 2014:4).
The needs of catering customers are influenced by various demographic and societal
trends. For example, there is the increase in double-income families and the general
aging of the population. With increased income and less time available for food
preparation, customers often choose to enter the convenience food market. (Scanlon,
2013:67).
With more people from all strata of society eating out, customers are also becoming
more knowledgeable and also increasingly more aware of value.
Various fads, fashions and trends also influence the industry, such as the influence of
culture, religion, healthful eating and vegetarianism (Cousins et al., 2014:1). Examples
of healthier food options are those listed as organic, sugar-free, dairy-free and gluten-
free. The media also plays a significant role. Television, radio and the print media can
influence consumers to make healthy food choices but can also have the opposite
effect if unhealthy food items are promoted (Lopez, 2014).
Opportunities exist for SMMICs to recognise how these trends can be beneficial to
their business. However, SMMICs that do not pay attention to the trends that could
affect them, and/or that do not prepare for them, could face threats in not being able
to cope with various demands by customers.
The technological environment
According to David and David (2015:236), “Technological advancements can
dramatically affect organisations’ products, services, markets, suppliers, distributors,
competitors, customers, manufacturing process, marketing practices, and competitive
position”.
In relation to technology and its impact on the food and beverage sector, it is apparent
that a huge innovation has been the increasing speed of communication and media
that enable access to new ideas and opportunities. However, there is potential for
more progress such as advancements in recycling technology (Neves, 2014:57).
Currently, in the food industry, new technological innovations are arising, such as
robotic machines, 3D printing of food, drones in agriculture and edible packaging, as

72
well as bacteria-fighting packaging (Martin, 2019). Figure 3.19 below depicts an
illustration of 3D-food printing.
Figure 3.19: 3D-food printing
Source: Rajan, 2018
3D food printers are forecast to become regularly-used appliances in food production,
producing anything from nutritional bars to pizzas, and they are eventually expected
to be used as personalised nutrition printers for use at home (Rajan, 2018).
Another example of technological change in the catering industry is the ever-
increasing variety of catering software programs which are being developed on apps
or computers. These include programs for accounting, staffing systems, menus, food
costing and online ordering (Sacks, 2018).
Various other technological changes are related to product development, such as the
development of alternatives to dairy produce and also the production of irradiated
foods. There is also the mechanisation of food production systems (Davis et al.,
2018:18).
The advent of the internet and social media has had the biggest impact on caterers in
the last few years. Common social media platforms for caterers are websites,
Facebook, Twitter, YouTube and Instagram. Social media sites allow caterers to
communicate with and interact with customers and potential clients. Thus, consumers
can easily share word-of-mouth testimonials about their experiences with caterers
(Shiring, 2014:98). For the caterer, the benefits of social media include being able to
work on and improve a digital media strategy, the ability to better target customers,
expand the audience base, increase the chance for reservations, allow for direct

73
dialogue with customers, gain improved insight into customers, and retain loyal
customers (Davis et al., 2018:322).
A recent trend, driven by technology is the high-speed delivery of food to homes,
offices, or wherever the client wishes. All this is smartphone driven, from locating a
food provider, to ordering and making payment. Another linked trend is for the food to
be ordered from so-called dark kitchens (also called ghost, virtual or cloud kitchens).
These are restaurants or caterers that are established for food delivery only, using
app-based delivery companies, such as Uber Eats and Mr D Food (Van Tilburg, 2019).
Given the tremendous impact of the internet, social media and smart phones, it
appears that new opportunities and potential threats in the technological environment
are continually arising for SMMICs.
The economic environment
In the economic environment there are various variables, such as inflation, interest
rates, the growth rate of the economy, and exchange rates that affect the business, as
well as the consumer’s disposable income and buying behaviour (Botha, 2018:39).
Some other economic variables that have an influence on food production and prices
are growth in GDP, exchange rates, inflation, interest rates, and investment
undertaken in food and agriculture (Neves, 2014:4; Cousins et al., 2011).
The South African economy has been characterised by poor economic growth, and
was in a recession in the first quarter of 2020. Overall, real GDP increased by 1.4% in
2017, 0.8% in 2018, and 0.2% in 2019 (StatsSA, 2019e, 2020a). In March 2020, there
was an unemployment rate of 29.1%, interest rates at 6.25%, an inflation rate of 4.5%,
and a rand dollar exchange rate of around R16.54. At the time of writing this
dissertation, government debt was estimated at 55.5% of GDP (Trading Economics,
2020a).
Reasons for the poor economic performance include weak global growth, the volatile
prices of commodities, the high public sector wage bill, the poor performance of state-
owned enterprises, regular electricity shortages, unpredictable weather, strikes, higher
input prices and weak demand (African Development Bank Group, 2020).
However, in figures more specifically related to catering, in 2019, the wholesale, retail
and motor trade; catering and accommodation industry expanded by R33 billion to

74
R685 billion. This was the third highest contributor to GDP, after Finance, real estate
and business services and General government services (StatsSA, 2020b).
Another economic indicator linked to food, and ultimately, catering is the consumer
price index (CPI). The CPI in South Africa “measures changes in the prices paid by
consumers for a basket of goods and services” (Trading Economics 2020b), while the
inflation rate is “the change in the CPI for all items of the relevant month of the current
year compared with the CPI for all items of the same month in the previous year
expressed as a percentage”. The inflation statistics for the country were on average
4.6% (2015), 6.4% (2016), 5.3% (2017), 4.7% (2018) and 4.13% (2019) (StatsSA,
2019b).
Figure 3.20 below depicts the inflation rate from 2011 to November 2019.
Figure 3.20: South African inflation rate (2011 – 2019)
Source: StatsSA, 2019e
Figure 3.20 shows that the inflation rate fell from a peak of 7.0% in February 2016 to
3.6% in November 2019, the lowest since December 2010. Although the inflation rate
has declined, it is clear from the other economic data above that the disposable income
of consumers has diminished. This is a potential threat for the catering industry.
It is not known whether the corporate market has reduced its use of catering services.
It appears unlikely, however, that corporate and private consumers will stop using
catering services, as important business and life events still have to be celebrated.
They may, however, choose to utilise catering services on a cheaper scale instead.

75
With the yet unknown effects of COVID-19 on the economy in 2020, it is unclear what
impact this will have on the hospitality industry and on the catering segment, in
particular.
The physical environment
The physical environment refers to all the natural resources that exist within a country
(Botha, 2018:42). All caterers need to be aware of changes taking place in the physical
environment, on a macro scale as well as on a micro level. For example, there is
increased interest in the origins of food such as where it is grown or reared. There is
also more concern about food safety and sustainable farming methods (Foskett et al.,
2016:147).
There is immense pressure on farming resources on an international level. Firstly, the
world population is growing at an incredible rate, resulting in an increasing demand for
food. Secondly, there are factors putting additional pressure on food commodities’
markets, which include the following: farm and agricultural land being utilised for other
purposes, climate change, droughts, water shortages, increases in farming input
costs, and plagues and diseases affecting animals and farmland (Neves, 2014:6-7).
Important threats for SMMICs in the physical environment could be problems with
supply, water quality, and energy (particularly with regard to load shedding which could
greatly affect the capacity to prepare and serve food for an event). Other factors which
impact on the physical environment, are energy conservation issues and the impact
of genetically modified foods (Cousins et al., 2011). In this respect, the City of Cape
Town is committed to the manufacturing of food and beverages in a sustainable and
ethical manner (Invest Cape Town, 2019).
Sustainable agriculture requires the establishment of farms that have good soil and
produce healthy food, while at the same time, doing profitable business. Thus,
environmental sustainability requires an ongoing commitment toward better
technologies, and green products and methods.
Caterers should respond by following greener business practices (Shiring,
2014:365,372). To this end, food and beverage businesses could invest in the best
possible energy-conserving equipment, check their ventilation systems regularly, and
review their cooking and storage methods (Foskett et al., 2016:124,125). They could
76
also commit to reducing waste, managing water usage more efficiently, and using
more sustainable resources (Davis et al., 2018:354). By implementing these
measures, SMMICs could promote themselves as caring businesses that have a
regard for the environment.
The political-legal environment
Political-legal (political and statutory) factors consist of the legislation and regulations
that affect the strategies of businesses (David & David, 2015:235). For example,
governments play a regulatory function in the food industry. These include restricting
foreign investment in land, environmental protection legislation, various subsidies and
grants, food safety regulations, employment contracts, licencing legislation, and the
imposing of various taxes (Neves, 2014; Cousins et al., 2011).
In South Africa, anyone who wishes to start a food business will need to acquire a
business licence. This is according to the Business Act, No 71 of 1991. In addition,
there is hygiene legislation, relating to the Foodstuffs Cosmetics and Disinfectants Act,
Act 54 of 1972 which must be adhered to. Included in these regulations (R638), is the
requirement of a Certificate of Acceptability by anyone who handles food or who allows
food to be handled on a food premises (Jackson, 2017, 2018)
The City of Cape Town also has a food quality and safety programme that monitors
the safety of food products. This includes the licencing and certification of food
preparation facilities, inspection (without prior notice) and food sampling, investigating
of food poisoning cases, and also the investigation of any customer complaints related
to the provision of food products and services.
Various other regulations and legislation applying to a food business, include general
hygiene requirements, transporting of food, liquor trading licences, labour laws and
taxation laws (City of Cape Town, 2019c). In addition, a regulation that applies to
caterers, depending on the size of the event, is the by-law applying to events (City of
Cape Town, 2019b).
Food safety is of utmost importance to any catering establishment. According to
Shiring (2014:145), “The single most important guarantee any caterer can imply to a
client is the serving of honestly presented food free of bacterial, physical or chemical
contaminants”. An internationally recognised system called Hazard Analysis Critical

77
Control Point (HACCP) identifies various hazards (chemical, physical or
microbiological) which can impact an organisation (Davis et al., 2018:179). This food
safety management system identifies critical control points at which contamination can
occur. Controls are subsequently set up to prevent this happening (Foskett et al.,
2016:65). The system is being phased in in South Africa, and is currently applicable
to food handling enterprises dealing with meat and poultry (Government Gazette, No
41707, 2018).
An additional regulatory measure affecting the food and beverage sector is a sugar
tax that came into effect in 2018 in an attempt to reduce the excessive consumption
of sugar, and decrease related disease in South Africa (SARS, 2019).
It is important for SMMICs to be aware of all the relevant government and local
regulations which affect their businesses so that they can be proactive in dealing with
any threats or opportunities that may arise.
The international environment
There are a number of ways in which SMMICs can be influenced by the international
environment. For example, the instability in oil prices affects food prices (Neves,
2014:3). Globalisation is another factor that has to be considered, as it has resulted in
freer trade, in innovation and product development, and it grants businesses new
opportunities and worldwide market access (Erixon, 2019).
It is evident that customers who have travelled internationally have gained knowledge
of other countries’ foods and beverages, and this could influence their demands (Bowe
& Buttle, 2013:21). Some travellers are active food tourists, and they specifically seek
out local producers, restaurants, food festivals and specialist food production areas in
a country (Foskett et al., 2016:20). This has an impact on the local food industry and
could open up access to new food products and ideas.
Catering trends that emerge every year in the international media can influence the
way SMMICs operate and the dishes they make. Some examples of trends that were
identified in 2019 and 2020 include cooking demonstrations at the event, menus
designed with locally grown ingredients, cannabis/CBD oil-infused food, healthy
menus, and natural and organic food (Abers, 2019). In addition, there is increased use
of foodservice technologies, such as digital reservations systems and tracking the food

78
ordering histories of customers. More emphasis is also being placed on ‘clean-and
green’ catering practices, such as changing to biodegradable catering supplies
(Stoehr, 2020).
Although the high-speed delivery of food to the client’s location of choice and dark
kitchens (as explained earlier) have been trending internationally, they have just
recently been introduced in South Africa. Another trend originating overseas, and
which has been adopted locally, is having meal kits delivered to homes with
instructions on how to make the dish (Whiteman, 2016, 2019). Meal kits are sold in
South Africa by various supermarkets and dedicated companies such as UCOOK and
Daily Dish.
By following and putting into practice some of these overseas trends, SMMICs may
discover new opportunities to attract customers. However, SMMICs who do not pay
attention to overseas trends may lose out on new ideas and information, and may face
threats from customers who go elsewhere, or competitors who take some of their
market share.
The SWOT analysis, as it applies to SMMICs, is discussed in the next section.
3.6 SWOT ANALYSIS
A SWOT analysis is a management tool which involves a systematic assessment of
all aspects of a business in the context of evaluating internal (micro environment)
weaknesses and strengths, while considering external (market and macro
environments) opportunities and threats (Davis et al., 2018:101,102).
Strengths may be, for example, superior skills, resources or knowledge that the
business possesses that provides it with a competitive advantage. Weaknesses may
be, for example, financial or managerial difficulties that prevent the business from
achieving optimal performance. As mentioned above, opportunities and threats occur
in the external business environment. The former can be utilised favourably by
management to help achieve growth and profitability, while the latter can impede this
from happening (Cant & Van Heerden, 2018:51,52).
A SWOT analysis also establishes a clear position from which to determine future
strategic options (Evans, 2015:241), and therefore allows for the building of a
competitive advantage and favourable position (Hiduke & Ryan, 2013:136). According

79
to Foskett et al. (2016:333), management should conduct a SWOT analysis every
three months. David and David (2015:190) assert that management and staff should
isolate and prioritise the most important 10 to 20 strengths and weaknesses of the
business in relation to the management, marketing, finance/accounting, production/
operations, research and development and management information systems.
Figure 3.21 below shows examples of SWOT factors that are applicable to caterers.
Figure 3.21: SWOT factors applicable to caterers
Source: Shiring, 2014:63-69
As can be seen from the figure, many of the factors listed are applicable to all types of
organisations. However, relating some factors to SMMICs particularly, indicates that
quality food and an appealing personality, as well as building a positive reputation are
important factors. Additionally, SMMICs need to guard against tasks not executed well
and lack of specialised knowledge, and they should be aware of threats from
competitors and adverse economic fluctuations.
In this study, the researcher will attempt to determine the strengths, weaknesses,
opportunities and threats of SMMICs in Cape Town, South Africa, specifically.

80
3.7 CONCLUSION
The chapter focused on the business environment of SMMICs, namely, the micro
environment, the market environment and the macro environment. In each of the
environments, the most pertinent factors which affect SMEs and SMMICs, in
particular, were discussed within the context of the SWOT analysis.
The next chapter discusses the methodology that was used to conduct the research.
81
CHAPTER 4:
RESEARCH METHODOLOGY
4.1 INTRODUCTION
This chapter presents a discussion of the research methodology of the study. The
primary objective of the research, as a guide to the purpose and aim of the study, will
first be outlined. After that, the conceptual framework of the research will be briefly
explained. Next, the eleven components of a research process model will be
examined. These include the research design, and data collection and analysis. The
chapter concludes with a short discussion of research ethics.
The primary objective of this study is to determine the key factors in the business
environment that impact on small, medium and micro independent caterers (SMMICs)
in Cape Town. The secondary objectives linked to the main objective are outlined in
Section 4.3.2 (Step 2) of the research process.
4.2 CONCEPTUALISATION OF THE RESEARCH
As the theoretical basis of quantitative research, a conceptual framework needs to be
outlined (Bryman, Bell, Hirschsohn, Dos Santos, Du Toit, Masenge, Van Aardt,
Wagner, 2014:11). For the purpose of this study, Figure 3.3: The business
environment of SMMICs (see Chapter 3) was used as the conceptual framework. The
figure outlined the three dimensions that constitute the business environment of the
SMMICs, namely, the micro environment, the market environment and the macro
environment. These environments were explained in detail in Chapter 3. A further
theoretical basis for the study was provided in Chapter 2, where SMMICs in Cape
Town, as part of the South African hospitality industry, were discussed.
4.3 THE RESEARCH PROCESS
The research process entails the observance of certain guidelines and the following
of a ‘standard sequence of steps’. This ensures trust and confidence by researchers
in the results obtained by other researchers. The steps may be presented in various
forms but all follow the same basic structure (Salkind, 2018:16). A model of the

82
research process is presented below in Figure 4.1. The steps in the model will be
explained in detail in the sections that follow.
Figure 4.1: The research process
Source: Lamb et al., 2015:172
Step 1: Identify and define problem
The first step in the research process refers to identifying and defining the problem
(Lamb et al., 2015:172). As was discussed in Chapter 1 (Section 1.3), SMEs/SMMEs
in South Africa, and indeed worldwide, face various obstacles and challenges. As was
further indicated, SMMICs as part of the SMEs/SMMEs, are subject to these
challenges, as well as those uniquely experienced in the food and beverage industry.

83
With, as previously indicated, very little research having been conducted on caterers
in South Africa, the research question therefore is to determine what the significant
challenges are that SMMICs in Cape Town experience in the business environment.
Thus the research aims to investigate the factors in the business environment (micro,
market and macro) which impact on SMMICs in Cape Town, as well as determining
the strengths, weaknesses, opportunities and threats which they experience.
Step 2: Develop research objectives
The purpose for the development of research objectives is to ensure that the problem
will be resolved. They also serve as a check on the relevance of the instruments of
measurement used, such as questionnaires. They are further used to assess the
results of the analysis of the data (Lamb et al., 2015:173).
As stated previously, the main objective of this research study is to determine the key
factors in the business environment that impact on SMMICs in Cape Town.
The following secondary objectives were formulated for the study:
To analyse the micro environment of SMMICs in Cape Town
To analyse the market environment of SMMICs in Cape Town
To analyse the macro environment of SMMICs in Cape Town
To identify strengths, weaknesses, opportunities and threats (SWOT) in the
business environment of SMMICs in Cape Town.
To determine the relationships between the micro, market, and macro business
environment factors and functional dimensions, respectively.
To determine if differences exist between the categories of different demographic
and company variables with regard to the business environment factors and
functional dimensions.
Step 3: Select research design
The research design sets up a framework for all the procedures that will be carried out
in the study to obtain the desired information. It includes aspects, such as determining
the method of research, the measurement techniques, and the plan for data analysis
(Malhotra 2020:35).

84
Figure 4.2 below details the various descriptors of research design. Each of these
eight descriptors, as relating to this study, are discussed below.
Figure 4.2: Descriptors of the research design
Source: Adapted from Blumberg, Cooper & Schindler, 2011:148
4.3.3.1 The degree to which the research question has been crystallised
The most appropriate study is dependent on the stage or level to which knowledge
has been obtained on the subject matter. Studies range from exploratory to descriptive
and causal studies. Exploratory research is conducted when not much information is
available about the current situation. Descriptive research, also called correlational
research, describes the various features of a situation as it exists, and this is where
the relationship between various variables is determined (Sekaran & Bougie, 2016:43-
44).
The term ‘formal study’ is also used for descriptive research, including the hypotheses
or research questions, and it follows specific procedures and specifications of sources

85
of data (Blumberg, Cooper & Schindler, 2014:166). Causal studies seek to obtain
confirmation about cause-and-effect relationships, that is, the effect of one variable
upon another variable (Malhotra 2020:101).
In terms of the present study on SMMICs in Cape Town, as it is factual in nature and
determines the relationship between the factors in the business environment and their
impact on SMMICs, it has been identified as a descriptive or formal study in nature.
4.3.3.2 The method of data collection
The method of data collection depends on the procedures used by the researcher to
get the required information. For example, there is monitoring, where activities are
noted by the researcher without him or her interacting directly with the subject. A
communication study, however, requires some form of interaction by the researcher
with the respondent. It includes questioning, using methods such as interviews,
telephone and emails and collecting responses (Blumberg et al., 2014:204).
The current study is termed a communication study, since it required that the
respondents, as owners or managers of SMMICs in Cape Town, be contacted by the
researcher to take part in the research. Subsequently, questionnaires (link to an online
survey) were emailed to the owners/managers and their responses collected and
recorded.
4.3.3.3 The power of the researcher to produce effects in the variables under
study
Some types of research studies, such as causal and experimental studies, require the
researcher to take a fairly active role in the manipulation of various variables, while in
other studies, such as a correlational study, the researcher has minimal involvement
in the operations of the system being studied and his or her role is limited to the survey
or interview being conducted (Sekaran & Bougie, 2016:99).
Also termed ex-post facto design, it is essential that the researcher’s role is confined
to establishing the correct sampling, determining the statistical findings, and in not
influencing the variables in any way (Blumberg et al., 2011:148). In this ex-post facto
study on SMMICs in Cape Town, the role of the researcher was minimal in that there
was very little interference by the researcher in the activities and operations of the
SMMICs. The researcher only required the owners/managers of the SMMICs to
complete an online survey.

86
4.3.3.4 The purpose of the study
Following the explanation of descriptive and causal studies in Section 4.3.3.1 above,
it is important to note further that the difference between the two lies in their objectives.
The purpose of descriptive research is to describe something, such as functions or
characteristics. In the process, the ‘who’, ‘what’, ‘when’, ‘why’ and ‘how’ of the research
is answered. As stated earlier, the purpose of causal research is to find evidence of a
cause-and-effect relationship between variables (Malhotra 2020:96,101).
Quantitative research presents results as numbers or as quantities which are usually
expressed in statistical analysis. Qualitative research, on the other hand, presents
results in words which are expressed in the identification of various themes (Patten &
Newhart, 2018:22).
This study is descriptive in nature and consists of a quantitative study which seeks to
identify the pertinent factors in the business environment that affect SMMICs in Cape
Town. Because of the factual nature of the study, quantitative research is best suited
for the research design.
4.3.3.5 The time dimension
The time dimension refers to the time period over which data is collected. Cross-
sectional data (or studies) are those collected from different individual units in the
same time period. When data is collected over a period of time to ascertain changes
that may have occurred, it is referred to as time-series data or a longitudinal study
(McEvoy, 2018:5).
The current study is a cross-sectional study, in that the owners/managers of SMMICs
in Cape Town were surveyed at one period in time to determine the impact of the
micro, market and macro environments on their businesses. Data collection took place
in the months of March and April 2018.
4.3.3.6 The topical scope of the study
Regarding the topical scope of the study, a decision has to be made regarding the
selection of the research strategy that will best suit the study. Various research
strategies exist, such as cross-sectional designs (for example, social surveys,
structured observation, content analysis), longitudinal designs, case study designs
and comparative designs (Bryman et al., 2014:100). A distinction is also made

87
between non-experimental research (descriptive, historical, correctional, qualitative)
and experimental research (true experimental, quasi-experimental) (Salkind,
2018:20). There are also other strategies, such as grounded theory (procedures that
develop derived theory from the data), action research (initiation of change process)
and mixed methods (for example, a combination of qualitative, exploratory as well as
experimental methods) (Sekaran & Bougie, 2016:98).
The research strategy that was used in this research was survey research. In survey
research, objectives are clarified, a sample is identified, a method defined and data
collected, coded and scored (Salkind, 2018:163-164). It is also referred to as a
statistical study, as the data is subjected to statistical analysis and inferences about
the population are made, based on the information obtained from the sample
(Blumberg et al., 2011:149).
4.3.3.7 The research environment
The study setting or research environment can be classified as contrived (also called
field experiments) or non-contrived (also called field studies). Most causal research
takes place in contrived settings, while correlational studies take place in non-
contrived settings (Sekaran & Bougie, 2016:100).
The present research involved a field study which took place in a non-contrived setting
and determined the situation of SMMICs in Cape Town as they are affected by factors
in the business environment.
4.3.3.8 The participants’ perceptions of research activity
There are a number of levels in which the participants in a research study can perceive
the way in which the study is conducted. For example, they may detect no change in
their daily routine. Alternately, they may detect some deviations but see no link to the
research. Finally, they may detect deviations and see them as caused by the
researcher. It is important for the researcher to be aware of the perceptions of
participants as it can have an impact on the outcome of the research in various ways
(Blumberg et al., 2011:150).
In terms of this study, it is evident that the participants, the owners/managers of the
SMMICs, did not perceive any deviations from their daily or actual routine as their
participation was limited to filling in a questionnaire.

88
The subsequent steps in the research process will now be discussed, commencing
with Step 4, conducting secondary research.
Step 4: Conduct secondary research
Before commencement of the research, an inspection and assessment of the literature
that has been published on the topic to date, first has to be undertaken. The literature
is scholarly in nature and is found in academic journals, books, dissertations and other
similar works (Faulkner & Faulkner, 2019:52). A literature review also presents the
research design and methods that have been used in a particular study, as well as the
results obtained (Blumberg et al., 2014:90).
The literature review is written after a review of secondary data. Secondary data is
available data that has already been collected in the past. There are various sources
of secondary data, such as data from previous research, online data, government
publications, and case studies (Sekaran & Bougie, 2016:39).
For the purpose of the present study, a literature review was conducted for the purpose
of obtaining pertinent information about SMMICs. As the aim of the research is to
determine the impact of environmental factors on SMMICs in Cape Town, it was
important to determine the positioning of SMMICs in the hospitality industry, and to
determine the impact of the micro, market and macro environments on SMMICs in
general.
The literature review was presented in two chapters. In Chapter 2, the South African
hospitality industry, the food and beverage sector, the catering segment of the food
and beverage sector and various aspects pertaining to SMMICs were investigated as
a background to the study. Chapter 3 analysed the micro, market and macro
environments of SMMICs.
Step 5: Select primary research method
This research study obtained primary data through the use of a survey, specifically,
through the use of self-completion questionnaires. Primary data is directly derived from
the research that has been undertaken (Salkind, 2018:47). Step 5 in the research
design entails the selection of the primary research method. In surveys, data is
collected through structured interviews, observation or self-completion questionnaires
(Bryman et al., 2014:32). These methods are discussed below.
89
4.3.5.1 Interviews
Interviews can be conducted face-to-face, via the telephone (Gliner, Morgan & Leech,
2017:230) or using electronic media and computer-assisted interviews (Sekaran &
Bougie, 2016:120). There are various types of interviews, such as structured
interviews, semi-structured interviews, unstructured interviews, qualitative in-depth
interviews and focused interviews.
In quantitative research, use is made of structured interviews. These consist of asking
the same standardised questions to all the respondents and recording the answers
(Bryman et al., 2014:216-217). Structured questions are clear and logical to both
interviewer and interviewee, and require specific and unambiguous answers (Salkind,
2018:161).
Interviews were not suitable for use in this study. This is primarily due to the SMMICs
being spread out in a wide geographic area, the time and expense involved in doing
face-to-face interviews and also the lack of resources to do so.
4.3.5.2 Observation
Observation can be conducted in various ways. For example, there is direct
observation, where the participants in a study are directly observed by the researcher
and their behaviours recorded, or indirect observation, which takes place through
questionnaires or interviews. Observations can take place in natural or controlled
settings (Gliner et al., 2017:219-220). They can be structured (quantitative and
detailed) or unstructured (associated more with qualitative research) and can also
range from non-participation of the researcher to full participation by the researcher in
the activities of the study participants (Williamson & Johanson, 2018: 407-412).
The observation method is not applicable in this research study and was not used.
4.3.5.3 Questionnaires
A questionnaire is “a pre-formulated written set of questions to which respondents
record their answers, usually within rather closely defined alternatives” (Sekaran &
Bougie, 2016:142). Questionnaires can be self-completed (using the internet, SMS,
postal or delivery and collection methods) or researcher-completed (using telephonic
or face-to-face methods). Internet questionnaires are accessed through a web browser
using a hyperlink (Saunders et al., 2019:506).

90
Internet questionnaires were used in this research and were set up by using the online
survey tool, LimeSurvey.
There are various advantages and disadvantages of self-completion questionnaires.
Some advantages are that they offer convenience and anonymity to participants, avoid
interviewer bias, offer a low-cost alternative, if compared to interviews and allow for
comparative ease of analysis. The disadvantages include low response rates, possible
misunderstanding of questions by respondents, no opportunity for elaboration of
answers, and no control over how and when questionnaires are completed
(Williamson & Johanson, 2018:381-383)
There are various guidelines for questionnaire design. These include the types,
wording, order and flow of questions, the coding of responses, as well as the visual
presentation of the questionnaire (Saunders et al., 2019:519-534). Further important
aspects to be considered when designing questionnaires are depicted in Figure 4.3
below.
Figure 4.3: Important aspects in the design and use of questionnaires
Source: Salkind, 2018:124

91
There are various types and forms of questions. For example, there are open-ended
questions that respondents may answer any way they please. The advantages of
these questions are that unusual responses may result, or new areas or ideas may be
suggested. Some disadvantages are that they necessitate a greater level of effort and
time from respondents. They are also time-consuming to code.
There are also closed questions which present respondents with a choice between set
alternatives. The advantages of closed questions are that respondents are able to
respond quickly, answers are easy to process, and the comparability of answers is
enhanced. Some disadvantages of closed questions are that interesting or
spontaneous answers of respondents may be lost, it is difficult to cover all possibilities,
and there may be differences in the interpretation of a question (Bryman et al.,
2014:199-201).
The questionnaire in this research made use of close-ended, as well as open-ended
questions. There are various rating scales according to which questions can be
structured, for example (Gliner et al., 2017:224):
Dichotomous scales require a yes or no answer.
Category scales have various categories or items from which a choice must be
made.
Semantic differential scales have options at opposite extremes of the scale, for
example, ‘weak’ __ ‘strong’.
Numerical scales have numbers added (five or seven-point scale).
Likert scales are used to measure the attitudes of respondents, for example
whether they strongly agree, agree, are undecided, disagree, or strongly
disagree with a statement.
The present study used dichotomous, category and Likert scales. Further details of
the questionnaire used in this research are discussed below.
The development of the questionnaire
The questionnaire (Appendix C) was custom-designed by the researcher, with the aid
of various academic resources on questionnaires, examples of other questionnaires,
as well as advice and guidance from the supervisor and statistician. The questions
were based on relevant sections in the literature review and were also linked to the
92
various objectives of the study. Likert scales were used as far as possible, in order to
provide more nuanced answers. Various Likert scale options were considered, and
the one that referred to the extent of application (not at all, always) was found to be
the most suitable. Dichotomous scales and category scales were used for factual
options.
The questionnaire was designed for ease of self-completion by the respondents.
Questions were set out clearly in English, were understandable, and examples were
given, where appropriate, for further clarification.
There were five sections in the questionnaire. These covered the firmographics of the
SMMICs, the demographics of the respondents, as well as the factors in the three
environments (micro, market and macro) that have an impact on the SMMICs.
Further information on the questionnaire is shown in Table 4.1 below.
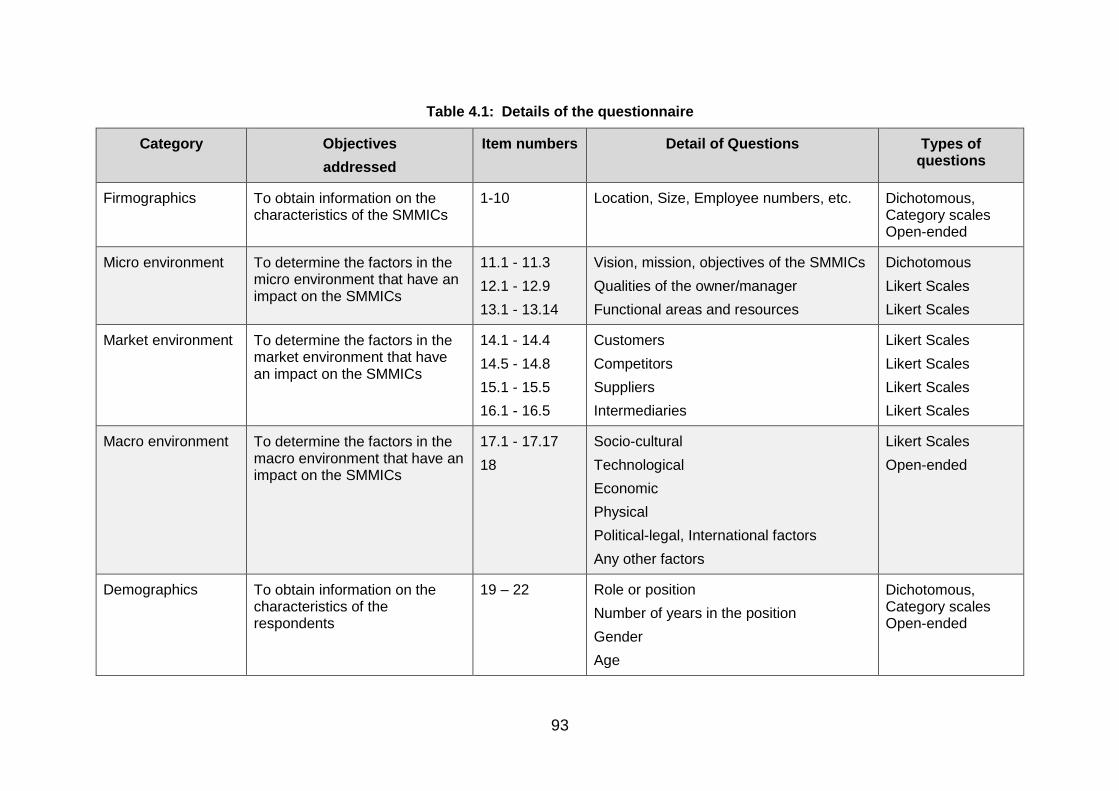
93
Table 4.1: Details of the questionnaire
Category Objectives
addressed
Item numbers Detail of Questions Types of questions
Firmographics To obtain information on the characteristics of the SMMICs
1-10 Location, Size, Employee numbers, etc. Dichotomous, Category scales Open-ended
Micro environment To determine the factors in the micro environment that have an impact on the SMMICs
11.1 - 11.3
12.1 - 12.9
13.1 - 13.14
Vision, mission, objectives of the SMMICs
Qualities of the owner/manager
Functional areas and resources
Dichotomous
Likert Scales
Likert Scales
Market environment To determine the factors in the market environment that have an impact on the SMMICs
14.1 - 14.4
14.5 - 14.8
15.1 - 15.5
16.1 - 16.5
Customers
Competitors
Suppliers
Intermediaries
Likert Scales
Likert Scales
Likert Scales
Likert Scales
Macro environment To determine the factors in the macro environment that have an impact on the SMMICs
17.1 - 17.17
18
Socio-cultural
Technological
Economic
Physical
Political-legal, International factors
Any other factors
Likert Scales
Open-ended
Demographics To obtain information on the characteristics of the respondents
19 – 22 Role or position
Number of years in the position
Gender
Age
Dichotomous, Category scales Open-ended

94
Step 6: Determine sample frame
This section discusses the target population and the sampling design.
4.3.6.1 The target population
The population refers to the entire group of potential participants to which the results
of a study would be generalised (Salkind, 2018:85).
The population in this study were all the SMMICs in the greater Cape Town area. The
delineation of the greater Cape Town area is indicated by key towns on the perimeter.
These include Muizenberg, Simon’s Town, Noordhoek, Hout Bay, City Centre and
surrounds, Bloubergstrand, Durbanville, Paarl, Stellenbosch, Gordons Bay, Strand,
Somerset West and Mitchells Plain.
The keywords for conducting a Google search for caterers were the following:
“caterers Cape Town”, “food caterers Cape Town”, “caterers Cape Town Facebook”,
catering companies Cape Town”, “catering companies Cape Town Facebook”,
“caterers Cape Town Yellow pages”, “catering companies Cape Town Yellow pages”,
“food caterers Cape Town”.
The keywords for conducting a Facebook search for caterers were the following:
“catering services Cape Town”, “food and beverage company Cape Town”, “food
caterers Cape Town.”
Other searches were conducted on Snupit with the keywords “catering services Cape
Town”, and on Instagram, with the keywords “caterers Cape Town.”
These searches yielded the names of 403 catering businesses. The researcher
checked the addresses on the websites and/or telephone numbers to ensure that the
location of all the SMMICs contacted fell within the geographic boundaries specified
above.
4.3.6.2 Sampling design
Sampling is the selection and study of a smaller group, as a representative of the
bigger population of that group (Faulkner & Faulkner, 2019:99). The sample should be
representative of the population as far as possible so that the results obtained from
the research can be applied to the whole population. The two main sampling strategies
are probability sampling and non-probability sampling. With probability sampling, each

95
member of the population has the potential of being selected. With non-probability
sampling, it is not known whether any one of the population has the chance of being
selected (Salkind, 2018:36, 86).
An example of non-probability sampling is convenience sampling. Convenience
sampling is collecting and using data from whichever subjects are conveniently
available (Faulkner & Faulkner, 2019:106). The advantages of convenience sampling
include easy accessibility and measurability of sampling units and being less
expensive and time-consuming than other sampling techniques. However, the
disadvantages are selection bias and not being able to generalise findings to a bigger
population (Malhotra, 2020:363).
Convenience sampling was selected for this research. The reasons were that it would
be relatively easy to find SMMICs online and to contact the owners/managers.
Furthermore, sending them emails with the link to the survey would take minimal effort
at little cost, as would the subsequent retrieval of the data. Convenience sampling
would also suit the time frame for the research.
In total, 403 SMMICs were contacted via telephone or email, with the intent to request
participation in the research. Of these, 253 were active, while 150 appeared inactive,
as there was either no reply to phone calls or emails, or the response was that they
were no longer in operation.
To ensure that there was a clear understanding about what the research entailed,
those who responded positively were subsequently sent an email which included a
participant information sheet and an informed consent form (see Appendix B) as well
as the link to the questionnaire (online survey).
Step 7: Conduct pre-test
The objective of the pre-testing or pilot testing of questionnaires is to make any
necessary changes and improvements so that there will be no difficulties with the
respondents filling in the questionnaire and also when the data is recorded. In pre-
testing, aspects such as the suitability, structure and validity and reliability of questions
and data are reviewed (Saunders et al., 2019:540).
96
In this research, a pilot study was conducted on four SMMICs. Three slight
adjustments were made to the questionnaire after the pilot test. As the changes were
minor, the caterers in the pre-test were included in the sample.
4.3.7.1 Ethical considerations
In order to adhere to the ethical standards as set by UNISA, the questionnaire was
examined by members of the ethics committee comprised of senior academics in the
Department of Business Management at UNISA.
Step 8: Collect data
The collection of the data was done in the following way:
Telephone calls were made to the SMMICs and a request was made to speak to
the owner or manager. In a few instances, contact was via email if the telephone
call went unanswered.
The researcher briefly explained the purpose of the research and made a request
for participation or for a decision to be made once the subsequent email with the
details was received.
If there was agreement, an email was sent with the relevant information, as well
as the link to the online questionnaire. The link led to an online survey
(LimeSurvey, version 3.23.1) which was administered by the Information and
Communications Technology (ICT) department at UNISA on behalf of the
researcher. This included the scripting and setting up of the survey from the
questionnaire.
The instruction to press the ‘Submit’ icon was at the end of the survey. This sent
the surveys to a Structured Query language (SQL) database at the ICT
department that automatically captured the responses.
Data was collected over two months (March and April 2018), which allowed for
a large number of SMMICs to be contacted. Reminder emails and/or follow-up
calls were generally made weekly.
At the end of the survey, the data was exported and SPSS and Excel databases
of the results were compiled by the statistician.
Of the 253 active SMMIC caterers contacted, 122 surveys were submitted. Of
these, 10 were unusable, as five were not filled in and five were completed by

97
someone other than the owner or manager. The total number of valid participants
was thus 112.
Step 9: Process data
In Step 9, the collected information is quantified and transformed into data (Bryman et
al., 2014:32). Before data is entered into a data file or spreadsheet, the researcher
needs to ensure that the data is clear, complete and accurate. Thereafter, the coding
process can commence (Gliner et al., 2017:259).
4.3.9.1 Coding data
Data collection forms can be constructed to collect the raw data before coding is done.
The advantage of these forms is that chances of errors occurring are minimised. These
can be separate forms, or the questionnaires can be constructed in such a way that
the data can be taken directly from there into the program which will do the analysis.
Data is coded when it is transcribed from a collection form into a format suitable for
data analysis. Numbers are used, rather than words as this saves entry time and is
more exact. The most important aspect in coding data is that the codes used must be
as clear and explicit as possible (Salkind, 2018:131). A code book or coding manual
can be constructed which provides clear rules on how the codes should be explained
and defined (Saunders et al., 2019:573).
4.3.9.2 Data entry
Data is entered onto coding sheets or directly into a computer database if collected
via the internet. In the latter case, the data is entered using computer packages such
as EXCEL or SPSS Data Editor (Malhotra 2020:439,443).
In this study, use was made of electronic surveys, where the responses (data) were
entered directly into an Excel spreadsheet in UNISA’s computer database. The
software program, SPSS Data Editor was used to enter the data.
Due to the relatively small sample size (112), the data was placed into sub-groups to
obtain a critical minimum sample size per group. This was done with regard to age
group (18-30, 31-40, 41-50 and 51+), number of years in the position (1-4, 5-10, 11+)
and number of years the business has been in operation (1-4, 5-12, 13+).

98
Question 18 was an open-ended question where respondents were asked to state
factors which currently have a significant impact on their business. The answers were
linked to six different variables in the business environment, and a numerical code was
allocated to each as follows: 1-Government-related 2-Economy/Economic, 3-
Environmental issues (macro environment), 4-Internal factors (micro environment), 5-
Competition-related, and 6-Customer-related (market environment). The coding
allowed for the question to be analysed quantitatively.
4.3.9.3 Editing of data
Care must be taken to check the survey data file before data analysis. Problem data,
such as duplicate and incomplete responses, coding errors and illogical answers, must
be removed (Williamson & Johanson, 2018:189).
In this study, the data was checked for inconsistencies and corrected. For example,
values were excluded where numbers did not add up to 100%. An example is seen
with regards to the percentages derived from ‘contribution to revenue’ that indicated:
budget events (5%), midscale events (10%) and upscale events (50%) with a total
percentage of 65%.
The statistical software program, SPSS version 24 was used to analyse the data and
to construct the original tables in this research study. Thereafter the tables were
exported to MS EXCEL for further analysis using descriptive and inferential statistics.
These, as well as the concepts of reliability and validity, are discussed below.
Step 10: Data analysis
4.3.10.1 Descriptive analysis
Data analysis commences with a description of the data. This is done through
descriptive statistics which provides a description or summary of the basic features of
the scores that have been collected. The distribution of scores is made up of two or
more data points. It is useful to compare various distributions of scores. This is done
through measures of variability and central tendency (Salkind, 2018:134).
With regard to variability, based on the number of variables involved, descriptive
statistics could be univariate, bivariate, or multivariate (Patten & Newhart, 2018:203).
There are three major measures of central tendency, namely, the mean, median and
mode. The means presents the average or the typical score of responses, while the

99
median refers to the central point of a set of numbers. The mode is the response that
occurs the most frequently (Faulkner & Faulker, 2019:153-154).
The measures of central tendency are used in different situations. For example, the
mean is used when data is described that is interval or ratio in nature. The median is
used for ordinal or ranked data, while the mode is suited for nominal levels of
measurement, such as data which is qualitative in nature (Salkind, 2018:135).
Measures of variability or measures of dispersion are also important as they describe
how the data is dispersed around the central tendency. Frequently used methods are
those describing the difference between the middle 50% of values (inter-quartile
range), and those describing how far values differ from the mean (standard deviation),
(Saunders et al., 2019:601). The standard deviation is the square root of the variance,
and establishes the average amount that each score varies from the mean of the set
of scores (Salkind, 2018:138).
Descriptive statistics are also provided by frequencies. Frequencies describe the
number of times that a certain phenomenon or variable occurs. The percentage, as
well as cumulative percentage, of the number of times is also calculated (Sekaran &
Bougie, 2016:279). Frequencies can be displayed by tables, bar charts, pie charts and
histograms, as they are easy to interpret and understand. A frequency table gives
information about the number of times and percentage occurrence of any type of
variable in each of the categories depicted (Bryman et al., 2014:11:318).
This study made use of the mean, median and standard deviation, as well as various
frequency tables and figures in the descriptive analysis of the data. These are
described in detail in Chapter 5.
4.3.10.2 Inferential statistics
Inferential statistics uses data from a sample to determine the characteristics of the
population from which the sample was taken (McEvoy, 2018:55). Thus, inferential
statistics are centred on probability, using a sample to make inferences about a
population (Patten & Newhart, 2018:225).
The tests used for inferential statistics in this study are outlined below:
Exploratory factor analysis and Categorical Principal Component Analysis
(CATPCA) were used to identify the relationships in a large set of variables.

100
The Pearson correlation coefficient test sought to identify relationships existing
between pairs of variables.
The non-parametric Kruskal-Wallis test and the parametric Student T-test for
independent groups were used to test various hypotheses.
These tests are described in detail in Chapter 6.
4.3.10.3 Reliability and validity
Researchers should take care that the correct conclusions are made when doing
research. Reliability and validity are two important assessment tools that help to
ensure that this is the case (Salkind, 2018:100). Reliability refers to how consistent
and stable a measurement is, while validity describes how accurately an instrument
measures what it is intended to measure (Faulkner & Faulkner, 2019:92-93). Reliability
and validity are inextricably linked, since a perfectly valid measure implies that it is
perfectly reliable (Malhotra 2020:305). Both reliability and validity were ensured by the
researcher during the research process of this study.
Reliability can be determined through different instruments, such as the test-retest
reliability, inter-rater reliability, and parallel-form reliability (Patten & Newhart,
2018:141-142). There is also internal consistency that determines how well the items
in a test produce unified results (Salkind, 2018:104). The lower the degree of ‘error’ in
an instrument, the higher the reliability.
In test-retest reliability, respondents are administered the identical test instrument for
a second time at a later stage, however, under identical conditions (Malhotra
2020:303). This measures the stability of a test over time (Salkind, 2018:103). In this
study, a measure of test-retest reliability was undertaken as a pilot test was
administered prior to the main survey.
Inter-rater reliability determines how consistent a measure is between various raters
(Salkind, 2018:103). As there was only one researcher, this instrument was not used.
Another form of reliability is parallel-forms reliability or equivalence. This measure is
used when a group of participants take part in the same test twice within a short period
of time but using alternative or parallel test forms (Gliner et al., 2017:188). As one set
of questions was used in this study, this measure is not applicable.

101
Finally, there is internal consistency which is based on the correlations between the
items constituting a construct. It thus confirms that a single concept or construct is
being measured (Gliner et al., 2017:188). Reliability of the identified constructs in the
study was measured through using the Cronbach Alpha coefficient, a measure of
internal consistency.
With regard to the validity of the measuring instrument itself, several types of validity
tests exist. These include content validity, criterion-related validity and construct
validity (Sekaran & Bougie, 2016:220). Content validity determines the extent to which
the instruments accurately cover the questions or concepts, while criterion validity
determines the ability of the instruments to accurately predict present or future actions
(Saunders et al., 2019:517). In this study, regarding content validity, the questionnaire
was evaluated for this by senior academics in the Department of Management at
UNISA. Criterion validity does not apply to this study.
Construct validity determines how accurately instruments are created that measure
observable behaviours, and thus, the underlying constructs (for example, intelligence,
or anxiety) (Gliner et al., 2017:202 205). This study did not use predefined constructs
that had been used in studies before. The aim was rather to determine, by using
exploratory factor analysis, whether meaningful groupings of items exist that form a
factor. Thus, although exploratory factor analysis can be used to determine construct
validity, if it was previously used instruments, it does not strictly apply to this study.
Finally, external and internal validity need to be considered. External validity of
research findings refers to the extent that the results can be generalised to other
populations, settings and times, while internal validity determines the level of accuracy
of the measuring instrument in measuring what is required. This involves an
assessment of the independent and dependent variables (Malhotra, 2020:241). With
regard to external validity, given the limitation of the sample of SMMICs being located
within the Cape Town area, it is not foreseen that the results of this research can be
spread to other populations. It is hoped, however, that some knowledge pertaining to
all independent caterers in South Africa can be gained, in general. With regard to
internal validity, the pilot study was useful in ascertaining whether the aims of the
research were correctly realised.
102
Step 11: Develop and report findings and conclusions
The findings or results step involves explaining the data. With quantitative data, this
takes place using tables, charts and graphics. Only the most pertinent data is included
(Blumberg et al., 2014:455). Thereafter, the conclusions close off the research study.
The conclusions should ensure that the research questions and research objectives
have been answered, that the main findings of the research are presented, that a
reflection is made on the research process itself, and finally, that suggestions for future
research are made (Saunders et al., 2019:720).
The findings and conclusions should be presented in a well-structured and
understandable manner (Sekaran & Bougie, 2016:361). They should also be
convincing with regard to their importance and validity. Finally, it is noted that, since
these findings and conclusions will be published, they form part of theory, hence, the
feedback loop depicted in the model (Bryman et al., 2014:11:32-33).
The data findings of this research are discussed at the end of Chapter 5 (Descriptive
analysis) and Chapter 6 (Inferential analysis), while the conclusions are discussed in
Chapter 7.
4.4 RESEARCH ETHICS
Ethical practice in research indicates the avoidance of any dishonest behaviour, such
as plagiarism and the falsification or fabrication of results. It also implies ethical
behaviour beyond the ethical approval of the project, continuing throughout the data
collection, analysis and output processes (Brough, 2019:37-38).
A framework for research ethics should include the principle of respecting human
dignity, and should actively maximise the benefits to the research participants, while
minimising any possible harm or risks. It should also ensure that participants are able
to make voluntary decisions about their decisions to participate in the research and to
withdraw at any point without being prejudiced (Nortjé, Visagie & Wessels, 2019:231-
234). Institutions where research is conducted commonly have ethics review
committees which ensure matters such as the rights and privacy of participants, as
well as the safeguarding of data (Patten & Newhart, 2018:34).
In this research study, an endeavour has been made to conduct the research in an
ethical manner. As stated earlier, the research study was conducted subject to the

103
approval of the ethics committee comprised of senior academics in the Department of
Business Management at UNISA (see Appendix A). In this context, the participant
information sheet and informed consent form, and questionnaire were inspected.
These are found in Appendix B and C.
4.5 CONCLUSION
This chapter discussed the research methodology that was used in this study. The
research objectives were stated and the steps in the research process were
discussed. Important aspects deliberated on in this regard were the research design,
data collection and data analysis and interpretation. The chapter concluded with a
short discussion of research ethics.
The next two chapters will focus on descriptive and inferential data analysis and
interpretation.

104
CHAPTER 5:
DESCRIPTIVE DATA ANALYSIS AND INTERPRETATION
5.1 INTRODUCTION
This chapter presents and discusses the results of the quantitative research carried
out on the factors that impact on small, medium and micro independent caterers
(SMMICs) in Cape Town. The purpose of the study is to enhance the understanding
of the factors in the environment that impact on SMMICs in Cape Town.
The objectives of the study are addressed by drawing references to descriptive
statistical analysis. The descriptive statistics aim to describe the demographic and
firmographic composition of the sample, as well as to determine the impact of the
micro, market and macro environments on the sample. In addition, the strengths,
weaknesses, opportunities and threats within these environments are determined. The
analysis commences with a discussion of the descriptive statistics in this chapter, while
the inferential analysis will be discussed in the next chapter, Chapter 6.
5.2 DESCRIPTIVE ANALYSIS OF THE RESEARCH FINDINGS
The descriptive analysis is best summarised by the frequency tables which can be
seen in Appendix D. These tables were constructed to show the numbers and
percentages of the respondents that selected the various options presented to them.
The statistical package IBM SPSS (version 24) was used to construct the original
tables. The tables were then exported to MS EXCEL, after which the relevant graphics
were constructed to illustrate the responses.
The descriptive analysis commences by presenting the ten questions relating to
firmographics and the four questions relating to demographics. Thereafter, an analysis
is done on the main body of the questionnaire. This is comprised of 62 questions which
aim to determine the views and perceptions of the 112 respondents with regard to
various factors in the business environment that have an impact on their businesses.
Firmographics
The respondents were asked to respond to the following ten questions with regard to
firmographics.

105
1. The suburb or town that the business operates in.
2. The premises where the business is located – house or business premises.
3. The number of years that the business has been in operation.
4. The forms of promotion that the business engages in.
5. The category that the business falls in (as per the Catering, Accommodation, and
Other Trade sector by the National Small Business Amendment Act, No 26 of
2003:8).
6. The number of full-time, part-time and seasonal employees.
7. The associations that the business is a part of.
8. The contribution to revenue derived from business, social and other catering.
9. The contribution to revenue derived from on-premise and off-premise catering.
10. The contribution to revenue derived from budget, midscale and upscale events.
Significant findings relating to these questions are discussed below with graphic
representations, where appropriate. The frequency tables are presented in Appendix
D.
5.2.1.1 Location
Only SMMICs located in towns and suburbs within the greater Cape Town area (as
delineated in Chapter 3) were targeted in the survey. As stated, these included towns
such as Bellville, Stellenbosch, and Paarl. The responses, according to the number of
towns or suburbs indicated, are shown in Table 5.1 below.
Table 5.1: Location (n=112)
Name of town/suburb indicated
Only ‘Northern suburb’ indicated
Only ‘Southern suburb’ indicated
No location indicated
101 7 3 1
Most of the respondents (101) identified the specific town or suburb in which they
operate: a total of 55 locations. Ten respondents indicated only that they operate in
the northern suburbs (7) or the southern suburbs (3). One respondent did not specify
any location. Further information on the towns and suburbs is provided in Table 7 in
Appendix D.

106
5.2.1.2 House or business premises
The respondents were asked to indicate whether their SMMICs operate from business
premises or from homes.
Figure 5.1 below depicts the distribution between the two options.
Figure 5.1: House vs business premises (n=112)
As the figure indicates, the majority (57.1%) of the SMMICs operate from homes, while
42.9% operate from business premises.
The higher percentage of home-based caterers could possibly be attributed to catering
being the type of business that can easily be run from home, and that has relatively
low start-up costs.
5.2.1.3 Number of years in operation
The number of years that the SMMICs have been in operation was grouped into three
groups (1-4 years, 5-12 years and 13+ years), and the result is shown in Figure 5.2
below.

107
Figure 5.2: Number of years in operation (n=112)
The figure illustrates that 34.8% of the SMMICs in the sample have been in operation
for 1 to 4 years, 35.7% for 5 to 12 years, while 29.5% have been in operation for 13 or
more years. With fairly similar percentages (plus/minus a third of respondents in each
category), shown in all the categories, it appears that this is an active industry with a
continual stream of new entrants, as well as SMMICs that have been active in the
medium to longer term. The minimum number of years a business has been in
operation is 1 year and the maximum is 39 years. The average number of years in
operation is 9.6 years.
5.2.1.4 Forms of promotion
The respondents were asked to select the forms of promotion their businesses make
use of from the following three options: Facebook, an actively maintained website and
online yellow pages. They could select more than one option, and could also select
‘Other’ in which case they were asked to elaborate further.
Their responses are shown in Figure 5.3 below.

108
Figure 5.3: Forms of promotion (n=112)
As shown, the majority of the SMMICs (85.7%) are active on Facebook. This is
understandably the most popular choice, as it is free and gives caterers a good
platform on which to advertise and display photographs of their food and services
provided. Fewer of the SMMICs (58.0%) have actively maintained websites, and
although they are powerful promotional tools, they perhaps require too much effort
and finance to maintain. A small number of SMMICs (6.3%) reported having a listing
in the online yellow pages, probably due to it being an outdated form of promotion. A
variety of other forms of promotion was indicated by 50% of the respondents. These
included Instagram (13.4%), Word-of-Mouth (12.5%), Google Ads (4.5%), WhatsApp
(3.6%), Gumtree (2.7%), as well as LinkedIn, Email, Newspaper, Twitter and Vehicle
Branding.
5.2.1.5 Category of business according to size
The respondents were asked to indicate whether their SMMICs are small businesses
or very small businesses. As indicated in Chapter 2 (Section 2.5.2), small businesses
have a total annual turnover of less than R6 million and a total gross asset value
(excluding property) of less than R1 million, and very small businesses have a total
annual turnover of less than R5.10 million and a total gross asset value (excluding
property) of less than R1.90 million, as per the criteria outlined by the Catering,
Accommodation and Other Trade sector by the National Small Business Amendment

109
Act, No 26 of 2003 (p8). They were also given the option of ‘Other’ and asked for
details in that case. There were 109 valid responses, as depicted in Figure 5.4 below.
Figure 5.4: Category of business according to size (n=109)
According to the results, 26.6% of the SMMICs in the study are classified as small,
53.2% (just over half) as very small, while 20.2% fall under ‘Other.’ Medium-sized
caterers are identified in this last category (about 10%), as well as micro caterers
(about 10%).
5.2.1.6 Number of employees
The respondents were asked to indicate the numbers of full-time, part-time and
seasonal employees in their businesses. The statistical mean, median and standard
deviation were used to depict the results. These are shown in Table 5.2 below.
Table 5.2: Full-time, part-time and seasonal employees
Full-time Employees
Part-time Employees
Seasonal Employees
Mean 5.3 9.8 9.2
Median 3.0 4.0 5.0
Standard deviation 6.5 21.4 9.9
In the case of full-time employees, missing values (9 across all 3 categories), as well
as respondents who indicated zeros (22, 29 and 46, respectively) were excluded from
the calculation of the averages. Indicating a zero (0) when considering full-time

110
employees could potentially indicate that the owner does not consider him/herself as
an employee. Thus, it is assumed that the number of employees only reflect
employees that are not the owner of the businesses.
The mean, median and standard deviations are indicated in Table 5.2. The mean value
of the data indicated that, on average, the SMMICs have more part-time employees
(mean = 9.8) than seasonal employees and full-time employees. The lower median
values (3.0, 4.0 and 5.0) indicate that the mean value was influenced by a few high
values, also evident in the values of the standard deviation. The standard deviation for
part-time employees, in particular at 21.4, is quite large, indicating that there is a wide
variation in the number of these employees employed by the various SMMICs.
5.2.1.7 Associations
There are no caterers’ associations that exist in Cape Town, or anywhere else in South
Africa. The two associations that caterers can join are the Federated Hospitality
Association of Southern Africa (FEDHASA) and the South African Chefs Association
(SA Chefs). They focus, however, on accommodation and chefs, respectively. Figure
5.5 below illustrates the percentage of the SMMICs that are members of these
associations. The respondents could select one or more than one option.
Figure 5.5: Associations (n=112)
As shown in the figure, the vast majority of SMMICs (89.3%) do not belong to any
organisation. Three respondents (2.7%) are members of FEDHASA, while 5
respondents (4.5%) are members of SA Chefs. There were also 5 respondents (4.5%)

111
who selected ‘Other’. The respondents indicated various supplier, government and
restaurant databases that they belong to.
5.2.1.8 Contribution to revenue from business catering and social catering
The respondents were asked to indicate the approximate contribution to revenue
derived from catering for the business market, social market, and any other market.
Table 5.3 depicts the results through the mean, median and standard deviation. Only
those caterers whose responses (in percentages) add up to 100% have been used.
Table 5.3: Contribution to revenue from business catering and social catering
Business Catering Social catering Other catering
Mean 42.1 52.3 6.1
Median 40.0 50.0 0.0
Standard deviation 30.1 29.9 18.9
From the data in the table, it is apparent that, on average, the SMMICs derive more
revenue from social catering (mean of 52.3%) than business catering (mean of
42.1%). The high standard deviation for both business and social catering indicates
that the SMMICs differ widely with regard to which of the two they focus on and derive
revenue from. Those listed under ‘Other’ catering include the film industry,
government, schools, conference venues, as well as pre-wedding functions and
personal chef work (mean of 6.1%, median of 0%, standard deviation of 18.9%).
5.2.1.9 Contribution to revenue from on-premise catering and off-premise
catering
On-premise catering comprises catering done on the SMMICs’ own premises,
whereas off-premise catering comprises catering done at the location of the client’s
choice.
Table 5.4 below depicts the contribution to revenue from these two categories, as
indicated by the respondents. Only those caterers whose responses (in percentages)
add up to 100% have been used.

112
Table 5.4: Contribution to revenue from on-premise and off-premise catering
On-premise catering Off-premise catering
Mean 47.1 52.9
Median 50.0 50.0
Standard deviation 39.3 39.3
As seen in Table 5.4, the mean (47.1% and 52.9%) and median (both 50%) of the two
categories indicate an almost similar contribution to revenue from both sources.
However, a high standard deviation of 39.29% exists for both on premise and off-
premise caterers, indicating a wide spread of contribution percentages, which
indicates that the range of contribution percentages for the mean ±1 standard
deviation is between 7.8% and 86.4%.
5.2.1.10 Contribution to revenue from various types of events
The respondents were asked to state the contribution to revenue (in percentages) from
budget, mid-scale and upscale events.
The results are depicted in Table 5.5 below and are shown by way of the mean,
median and standard deviation. Only those caterers whose responses (in
percentages) add up to 100% have been used.
Table 5.5: Catering for budget events, mid-scale events and upscale events
Budget events Mid-scale events Up-scale events
Mean 30.2 44.8 26
Median 20.0 40.0 20.0
Standard deviation 28.9 26.9 27.1
The data shows that the majority of revenue is generated from midscale events (mean
of 44.8%), while budget and upscale events are not too dissimilar (mean of 30.2% and
26%, respectively). However, a great degree of variance is evident, as can be seen
from the values of the standard deviation in all three categories, which indicates that
the SMMICs differ substantially in which type of event contributes the most to their
revenue.
The next section deals with the demographical information of the respondents.

113
Demographics
The respondents were asked to respond to the following questions on demographics.
The questions focused on:
1. their role or position in the business;
2. the number of years they have been in this role/position;
3. their gender; and
4. their age group.
The responses to these questions are indicated and discussed in the sections that
follow.
5.2.2.1 Role or position in the business
The respondents were asked to select the role or position that they hold in the
business. They could choose from: Owner, Owner who is also the manager, or
Manager (full-time) with insight into the strategic planning of the business.
The results are shown in Figure 5.6 below.
Figure 5.6: Role or position in the business (n=112)
The figure indicates that 87.5% of the respondents are the owners of the SMMICs and
that 37.5% of these are also full-time managers. It is somewhat surprising that so many
owners appear not to be involved in full-time management, given that these are
SMMEs. Full-time managers who are not owners comprise only 12.5%.

114
5.2.2.2 Number of years in role or position
The participants were asked how long they had been in the positions listed in the
previous question. Their responses are illustrated in Figure 5.7 below.
Figure 5.7: Number of years in role or position (n=112)
Of the 112 respondents, 41 (36.6%) have been in the position for 1 to 4 years, 40
(35.7%) have been in the position for 5-10 years, while 31 (27.7%) have been in the
position for 11 or more years.
These results indicate once again that this is quite an active industry in the broader
Cape Town area (as delineated in Chapter 3), with a steady stream of new entrants,
as well as stable enterprises existing for a number of years. The minimum number of
years a respondent has been in this position is 1 year, while the maximum is 39 years.
The average number of years in their current roles or positions is 8.4 years.
5.2.2.3 Gender
With regard to the gender of the respondents, the breakdown is depicted in Figure 5.8
below.

115
Figure 5.8: Gender (n=112)
As shown, the majority of the respondents (59.8%) are female, while 40.2% are male.
A reason could be that this type of business is a logical progression for females, as
they are traditionally the cooks in society. Another reason could be that a catering
business is a viable option for mothers who are raising families and yet need to
generate income. However, as the figure shows, there are also significant numbers of
males who run catering businesses.
5.2.2.4 Age group
The results for the age groups of the respondents are shown in Figure 5.9 below.
Figure 5.9: Age group (n=112)
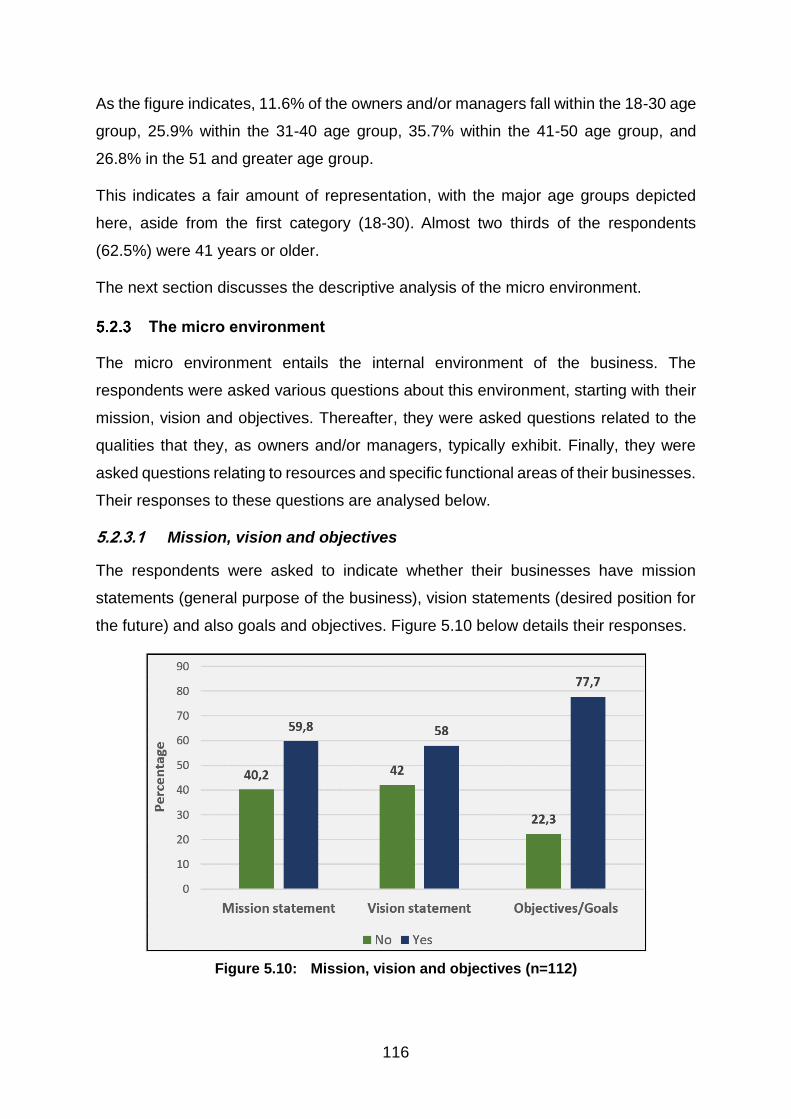
116
As the figure indicates, 11.6% of the owners and/or managers fall within the 18-30 age
group, 25.9% within the 31-40 age group, 35.7% within the 41-50 age group, and
26.8% in the 51 and greater age group.
This indicates a fair amount of representation, with the major age groups depicted
here, aside from the first category (18-30). Almost two thirds of the respondents
(62.5%) were 41 years or older.
The next section discusses the descriptive analysis of the micro environment.
The micro environment
The micro environment entails the internal environment of the business. The
respondents were asked various questions about this environment, starting with their
mission, vision and objectives. Thereafter, they were asked questions related to the
qualities that they, as owners and/or managers, typically exhibit. Finally, they were
asked questions relating to resources and specific functional areas of their businesses.
Their responses to these questions are analysed below.
5.2.3.1 Mission, vision and objectives
The respondents were asked to indicate whether their businesses have mission
statements (general purpose of the business), vision statements (desired position for
the future) and also goals and objectives. Figure 5.10 below details their responses.
Figure 5.10: Mission, vision and objectives (n=112)

117
As seen in Figure 5.10, almost similar percentages of the SMMICs have mission
statements (59.8%) and vision statements (58%). These somewhat lower than
expected figures could be regarded as a weakness of these SMMICs, given the
importance attached to having mission and vision statements (as discussed in Chapter
3). Just more than three quarters of the respondents have goals and objectives
(77.7%), which is a definite strength of these SMMICs.
5.2.3.2 Qualities of the owner or manager
Respondents were asked to indicate the extent to which they perceive themselves to
exhibit the various skills that owners or managers of SMMICs typically have. These
results are shown in Figure 5.11 below.
To assist in clarity for graphical representation, the responses ‘Never’ and ‘Rarely’
have been grouped together, as well as the responses ‘Often’ and ‘Always.’ It is noted
that for statements 6 and 7, the percentages in the table add up to 100.1% due to
rounding.
Figure 5.11: Qualities of the owner/manager (n=112)
It is apparent from the figure that in most of the areas listed, the majority of the
respondents appear to be confident about their skills and abilities. Firstly, the
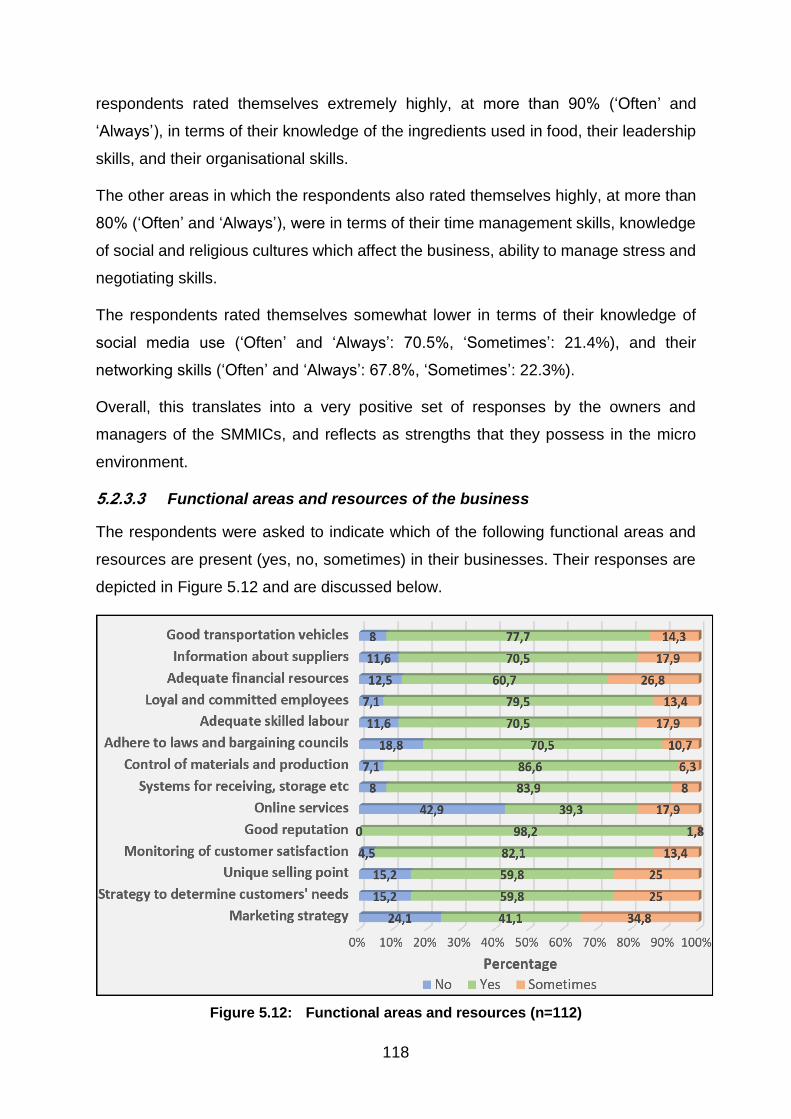
118
respondents rated themselves extremely highly, at more than 90% (‘Often’ and
‘Always’), in terms of their knowledge of the ingredients used in food, their leadership
skills, and their organisational skills.
The other areas in which the respondents also rated themselves highly, at more than
80% (‘Often’ and ‘Always’), were in terms of their time management skills, knowledge
of social and religious cultures which affect the business, ability to manage stress and
negotiating skills.
The respondents rated themselves somewhat lower in terms of their knowledge of
social media use (‘Often’ and ‘Always’: 70.5%, ‘Sometimes’: 21.4%), and their
networking skills (‘Often’ and ‘Always’: 67.8%, ‘Sometimes’: 22.3%).
Overall, this translates into a very positive set of responses by the owners and
managers of the SMMICs, and reflects as strengths that they possess in the micro
environment.
5.2.3.3 Functional areas and resources of the business
The respondents were asked to indicate which of the following functional areas and
resources are present (yes, no, sometimes) in their businesses. Their responses are
depicted in Figure 5.12 and are discussed below.
Figure 5.12: Functional areas and resources (n=112)

119
Based on the responses, the area that the respondents are of the opinion that they
excel in the most, is a good reputation (98.2%). Operational areas are also handled
well, as 86.6% of the respondents indicated that they have control of materials and
production, while 83.9% indicated that they have systems for the receiving, storage,
preparation and assembly of food, and for clearing and cleaning.
With regard to customers, the respondents rated their continual monitoring of
customer satisfaction highly (‘Yes’: 82.1%, ‘Sometimes’: 13.4%). However, a fairly
lower positive response was generated with regard to the respondents having a
strategy to determine customers’ needs (‘Yes’: 59.8%, ‘Sometimes’: 35%, ‘No’:
15.2%), and also having a unique selling point or targeting a specific niche market,
where 59.8% of the respondents selected ‘Yes’, while 25% selected ‘Sometimes’, and
15.2% selected ‘No’. Having a marketing strategy only garnered a mildly positive
response (‘Yes’: 41.1%, ‘Sometimes’: 34.8% and ‘No’: 24.1%).
Since having a marketing strategy is regarded as essential for a business (as
discussed in Chapter 3), the fairly high response rates of ‘Sometimes’ and ‘No’ (a total
of 58,9%), denotes a weakness of these SMMICs in this area. This, along with the
previous two factors (namely, good reputation and monitoring customers), gives the
impression that many respondents feel that having a good reputation and monitoring
customer satisfaction are sufficient for their purposes, and that there is no need to
invest further time and effort in formal marketing.
Regarding adherence to legislation and bargaining councils, the response rates were
fairly positive (‘Yes’: 70.5%, ‘Sometimes’: 10.7%, ‘No’: 18.8%).
The respondents also seemed satisfied with their labour force, as evidenced in their
replies as to whether they have adequate skilled labour (‘Yes’: 70.5%, ‘Sometimes’:
17.9%, ‘No’: 11.6%), and whether they have loyal and committed employees (‘Yes’:
79.5%, ‘Sometimes’: 13.4%, ‘No’: 7.1%).
With regard to suppliers, the respondents generally seemed satisfied with the
information that they have about their suppliers (‘Yes’: 70.5%, ‘Sometimes’: 17.8%,
‘No’: 11.6%).
They were also satisfied with regard to their transportation vehicles (‘Yes’: 77.7%,
‘Sometimes’: 14.3%, ‘No’: 8%).

120
Their lowest ratings were given to the adequacy of their financial resources (‘Yes’:
60.7%, ‘Sometimes’: 26.8%, ‘No’: 12.5%) and to their online services (‘Yes’: 33.9%,
‘Sometimes’: 17.9%, ‘No’: 42.9%).
Based on the analysis above, the strengths of the SMMICs, on the whole, appear to
be the following: a good reputation, operational areas, the continual monitoring of
customer satisfaction, satisfaction with their labour force, loyal and committed
employees, information on suppliers, and good transportation vehicles.
Areas in which the SMMICs do not perform as strongly are: a strategy to determine
customers’ needs, having a unique selling point or targeting a specific niche market,
and financial resources.
Areas in which the SMMICs display a weakness are having a marketing strategy and
possessing online services.
The replies of the respondents relating to factors in the market environment will now
be analysed and discussed.
The market environment
There are four main sectors in the market environment of a business, namely,
customers, competitors, suppliers and intermediaries.
The respondents were asked questions relating to each of these sectors. Their
answers are discussed and analysed below.
5.2.4.1 Customers
The respondents were asked four questions regarding the impact of customers on
their business. Their responses are recorded in Figure 5.13 below.
The responses of ‘Usually’ and ‘Always’ have been combined in the figure.
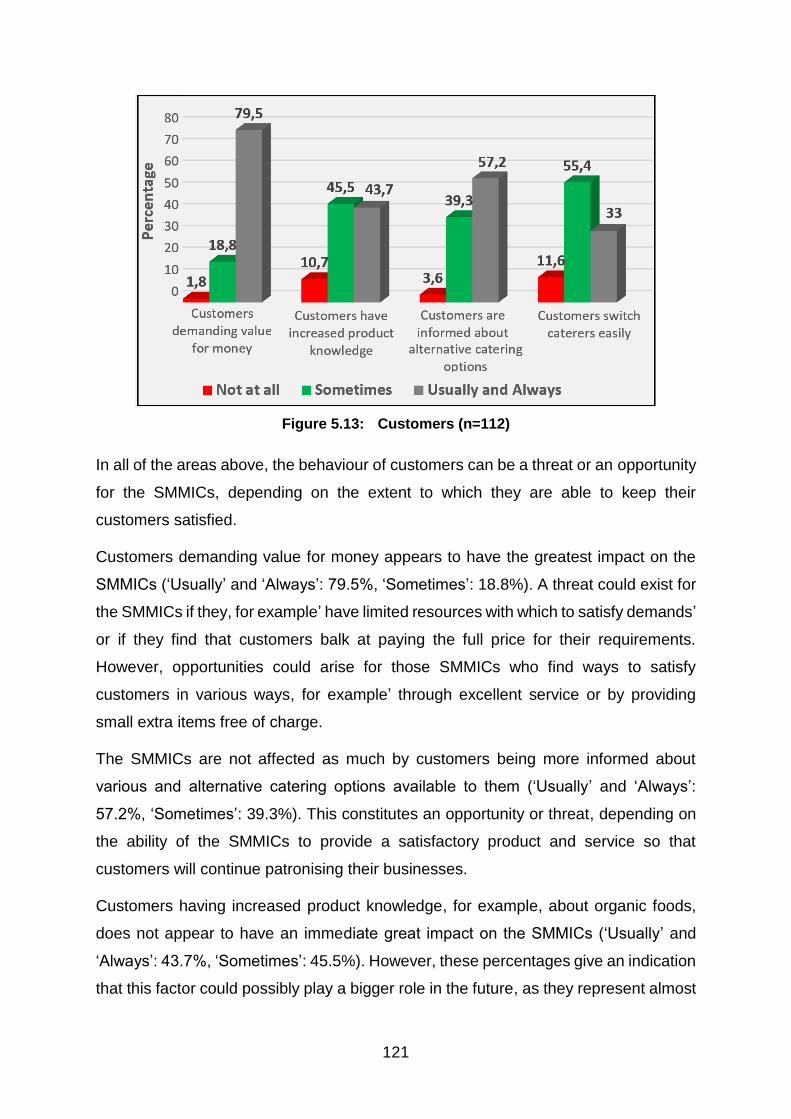
121
Figure 5.13: Customers (n=112)
In all of the areas above, the behaviour of customers can be a threat or an opportunity
for the SMMICs, depending on the extent to which they are able to keep their
customers satisfied.
Customers demanding value for money appears to have the greatest impact on the
SMMICs (‘Usually’ and ‘Always’: 79.5%, ‘Sometimes’: 18.8%). A threat could exist for
the SMMICs if they, for example’ have limited resources with which to satisfy demands’
or if they find that customers balk at paying the full price for their requirements.
However, opportunities could arise for those SMMICs who find ways to satisfy
customers in various ways, for example’ through excellent service or by providing
small extra items free of charge.
The SMMICs are not affected as much by customers being more informed about
various and alternative catering options available to them (‘Usually’ and ‘Always’:
57.2%, ‘Sometimes’: 39.3%). This constitutes an opportunity or threat, depending on
the ability of the SMMICs to provide a satisfactory product and service so that
customers will continue patronising their businesses.
Customers having increased product knowledge, for example, about organic foods,
does not appear to have an immediate great impact on the SMMICs (‘Usually’ and
‘Always’: 43.7%, ‘Sometimes’: 45.5%). However, these percentages give an indication
that this factor could possibly play a bigger role in the future, as they represent almost

122
half of the respondents, and could be a threat or opportunity for the SMMICs,
depending on how well they evolve their offerings to cater for consumers’ demands in
this area.
Regarding whether customers switch caterers easily, it is clear that, although a small
group are confident of their skills in retaining customers, the majority of the
respondents do see that customer loyalty can change (‘Usually, and ,Always’: 33%,
‘Sometimes’: 55.4%, ‘Not at All’: 11.6).
Overall, it appears that the respondents have a healthy respect for their customers.
Although there is some indication of customer loyalty, there is evidence that customers
are becoming more knowledgeable, powerful and demanding.
5.2.4.2 Competitors
Competitors and competition of the SMMICs, as part of the market environment, will
now be discussed. Figure 5.14 provides an analysis of the responses of the
owners/managers to various questions in this regard. The responses of ‘Usually’ and
‘Always’ have been combined in the figure.
Figure 5.14: Competitors (n=112)
Competition appears to have a significant but not extreme effect on the SMMICs.
Based on the responses above, the greatest threat and impact on them appears to be
that of new competitors continually appearing (‘Usually’ and ‘Always’: 68.7%,
‘Sometimes’: 27.7%, ‘Not at All’: 3.6%). Another aspect of competition which appears

123
to have a fairly high impact, concerns whether new types of competition or competitive
substitute products continually arise (‘Usually’ and ‘Always’: 60.7%, ‘Sometimes’:
32.1%)
A fair number of the SMMICs carry out continual monitoring of competitors (‘Usually’
and ‘Always’: 58%, ‘Sometimes’: 31.3%).However, there does not seem to be a great
degree of rivalry among existing competitors (‘Usually’ and ‘Always’: 46.4%,
‘Sometimes’: 33.9%, ‘Not at all’: 19.6%).
Due to the very nature of competition being a threat, it appears that significant numbers
of the SMMICs are generally quite alert to the actions being taken by competitors, and
that many of them are careful to monitor challenges and threats which arise regarding
competitors.
5.2.4.3 Suppliers
The respondents were asked a number of questions regarding their suppliers.
Their responses are represented in Figure 5.15 below. The responses of ‘Usually’ and
‘Always’ have been combined in the figure.
Figure 5.15: Suppliers (n=112)
The respondents appear to be generally satisfied with the performance of their
suppliers. This is indicated by their responses to whether suppliers pay attention to

124
quality (‘Usually’ and ‘Always’: 84.8%), and to whether a good working relationship is
maintained with suppliers (‘Usually’ and ‘Always’: 91.1%).
Good supplier relationships indicate good opportunities for the SMMICs. For example,
they could attempt new product offerings, since they know that their suppliers can be
depended on to deliver what they need.
The last three questions related to whether good levels of supply exist with regard to
catering equipment, food and beverage products, and catering IT systems. The most
positive response was given for food and beverage products (‘Usually’ and ‘Always’:
76.8%, ‘Sometimes’: 19.5%), while a good supply of catering equipment was rated
lower (‘Usually’ and ‘Always’: 64.8%, ‘Sometimes’: 30.4%), and catering IT systems
ranked the lowest (‘Usually’ and ‘Always’: 47.4%, ‘Sometimes’: 32.1%, ‘Not at All’:
20.5%).
Good supplier relationships and good sources of supply indicate advantages for the
SMMICs, since, for example, menus can be confidently drawn up or altered with the
assurance of provision of the required ingredients or raw materials. In other areas,
such as catering equipment and catering IT systems, however, it would perhaps
depend on the size and sophistication of the SMMICs as to whether such systems are
required and whether lack of them causes a threat or not.
5.2.4.4 Intermediaries
The final sector in the marketing environment relates to the impact of various
intermediaries on the SMMICs.
The responses of the owners/managers are represented in Figure 5.16 below. The
responses of ‘Usually’ and ‘Always’ have been combined in the figure.

125
Figure 5.16: Intermediaries (n=112)
The first three intermediaries (wholesalers, bankers/banks and insurance agents)
facilitate the general business of the SMMICs, while the last two (apps which link
caterers and customers, and agents such as wedding and event planners) facilitate
links with the SMMICs and customers.
With regard to the first group, it is evident that the SMMICs are impacted the most by
wholesalers (‘Usually’ and ‘Always’: 49.1%, ‘Sometimes’: 29.5%), lesser so by banks
(‘Usually’ and ‘Always’: 33.9%, ‘Sometimes’: 26.8%), and the least by insurance
agents (Usually’ and ‘Always’: 16.9%, ‘Sometimes’: 28.6%). In addition, significant
numbers of the SMMICs do not interact with these agents at all.
With regard to the second group, intermediaries linking the SMMICs with customers,
there appears to be a greater impact with regard to wedding and event planners
(‘Usually’ and ‘Always’: 37.5%, ‘Sometimes’: 37.5%), than with the technological apps
linking caterers and customers (‘Usually’ and ‘Always’: 18.7%, ‘Sometimes’: 25.0%).
However, depending on the sophistication of their target market, app usage could be
an opportunity for the SMMICs to diversify their exposure to potential customers.
It is apparent that the SMMICs differ substantially with regard to their need for
intermediaries. In addition, it is not clear of the extent to which each intermediary
constitutes an opportunity or threat for the SMMICs, as each SMMIC would have its
own unique situation and reasons for interacting with these intermediaries.

126
The next section analyses and discusses the data collected in terms of the macro-
environment of the SMMICs.
The macro environment
As was discussed in Chapter 3, the macro environment of a business is comprised of
six basic environments, namely, the socio-cultural, technological, economic,
environmental, legal/political and international environments.
In the survey, the respondents were asked questions on the impact of each of these
environments on their businesses. For their responses, they could select between ‘Not
at all’, ‘Sometimes’, ‘Usually’ and ‘Always’.
Each of the six environments will be discussed below.
5.2.5.1 Socio-cultural environment
The respondents were asked whether the following three factors in the socio-cultural
environment affect their business. Their responses are depicted in Figure 5.17 below.
The responses ‘Usually’ and ‘Always’ have been combined for the analysis.
Figure 5.17: Socio-cultural factors (n=112)
Demographical changes, such as the increase in smaller families, or the increase in
double income households, appear to have a limited impact on the SMMICs (‘Usually’
and ‘Always’: 25.9%, ‘Sometimes’: 42%, ‘Not at all’: 32.1%).

127
With the typically slower rate of change in terms of socio-cultural factors such as these,
it is likely that it will take time for many of the SMMICs to be impacted in a significant
and direct way by these factors.
The other two socio-cultural factors both relate to current trends with regard to
consumers and food. The responses were fairly similar for both: less time available for
food preparation (‘Usually’ and ‘Always’: 40.2%, ‘Sometimes’: 38.4%, ‘Not at all’:
21.4%), and more healthful eating (‘Usually’ and ‘Always’: 41%, ‘Sometimes’ 43.8%,
‘Not at all’: 15.2%). The figures indicate that these factors are becoming more
significant for the SMMICs.
All of these socio-cultural changes can cause opportunities or threats for the SMMICs.
For example, demographical changes and less time for food preparation could be
opportunities for SMMICs to branch out into home-delivered meals or meal sets.
Threats could arise if customers are lured away by other SMMICs offering these
options at an early stage or in a better way.
Regarding more healthful eating, opportunities exist for the SMMICs to develop
appropriate foods for this market, while threats could arise if they are unable to, or
choose not to become involved in these kinds of foods.
5.2.5.2 Technological environment
The respondents were asked whether the following three factors in the technological
environment affect their business:
1. Easy access to the internet by consumers
2. Effects of the internet on caterers
3. Technological changes in catering software
Their responses are depicted in Figure 5.18 below. The responses ‘Usually’ and
‘Always’ have been combined for the analysis.

128
Figure 5.18: Technological factors (n=112)
The most significant technological factor is the impact of the internet in helping
respondents to find new ideas, to find new catering opportunities, and to source food
products faster (‘Usually’ and ‘Always’: 71.5%, ‘Sometimes’: 21.4%). Another lesser,
albeit fairly significant, impact is the effect of easy access to the internet, mobile apps
and social media by consumers who may use these to access caterers’ websites,
order meals, and evaluate catering events (‘Usually’ and ‘Always’: 62.5%,
‘Sometimes’: 28.6%).
It is clear that an array of opportunities arise for the SMMICs through the internet.
These include, for example, ideas for various innovations and also for promotional
activities. Threats could exist if these innovations and activities are not taken
advantage of timeously, and the SMMICs lose out to competitors and/or finding
potential customers.
The third factor, which is related to technological changes in catering software, such
as online reservation systems, creation of client accounts, stock figures and recipe
management, appears to have more of an impact on some SMMICs than others
(‘Usually’ and ‘Always’: 39.3%, ‘Sometimes’: 31.3%, ‘Not at all’: 29.5%). It is noted that
these percentages add up to 100.1% due to rounding. It can be assumed that the
larger SMMICs benefit more from investing in these systems, as they would have the
financial ability to do so.

129
5.2.5.3 Physical environment
The respondents were asked whether the following three factors in the physical
environment affect their business:
1. Trends in energy conservation;
2. Trends in waste management and recycling; and
3. Trends in presenting business as ‘caring for the environment’.
The responses of the respondents are depicted in Figure 5.19 below. The responses
‘Usually’ and ‘Always’ have been combined for the analysis.
Figure 5.19: Physical factors (n=112)
The questions focused on the respondents’ opinions of the impact of three trends in
the physical environment on their businesses. The first trend relates to energy
conservation, such as more efficient cooking, refrigeration, dishwasher and ventilation
systems. The second trend relates to waste management and recycling, and the third
trend relates to presenting businesses as ‘caring for the environment.’
Fairly similar responses were elicited for all three trends (‘Usually, and ,Always’:
49.1%, 45.5% and 50.9% respectively, ‘Sometimes’: 33%, 29.5% and 30.4%,
respectively, and ‘Not at all’: 17.9%, 25% and 18.8%, respectively). It is noted that for
the third trend ‘caring for the environment’, the percentages in the table add up to
100.1% due to rounding.

130
Based on these responses, it appears that about half of the SMMICs are directly
impacted by these trends, about 30% occasionally, and about 20%, on average, are
not affected at all.
These trends manifest themselves as opportunities or threats for the SMMICs. For
example, an opportunity would be for SMMICs to invest in more efficient equipment
and waste management systems, and enjoy the benefits of lower electricity bills and
faster food production. Threats could exist where SMMICs may not have funding for
this kind of energy-efficient equipment, and consequently perhaps have higher energy
bills, or use more time-consuming production methods. However, it would not be
feasible, nor affordable, for most small caterers to have this kind of equipment.
It is not certain to what extent the SMMICs have actually adopted any of these
measures, or whether they are just aware of them. It would, of course, be beneficial to
promote themselves as adhering to sustainable environmental practices.
5.2.5.4 Political-legal environment
The respondents were asked whether the three factors, as illustrated in Figure 5.20,
in the political-legal factors environment affect their businesses, and their responses
are depicted in Figure 5.20 below. The responses ‘Usually’ and ‘Always’ have been
combined for the analysis.
Figure 5.20: Political-legal factors (n=112)
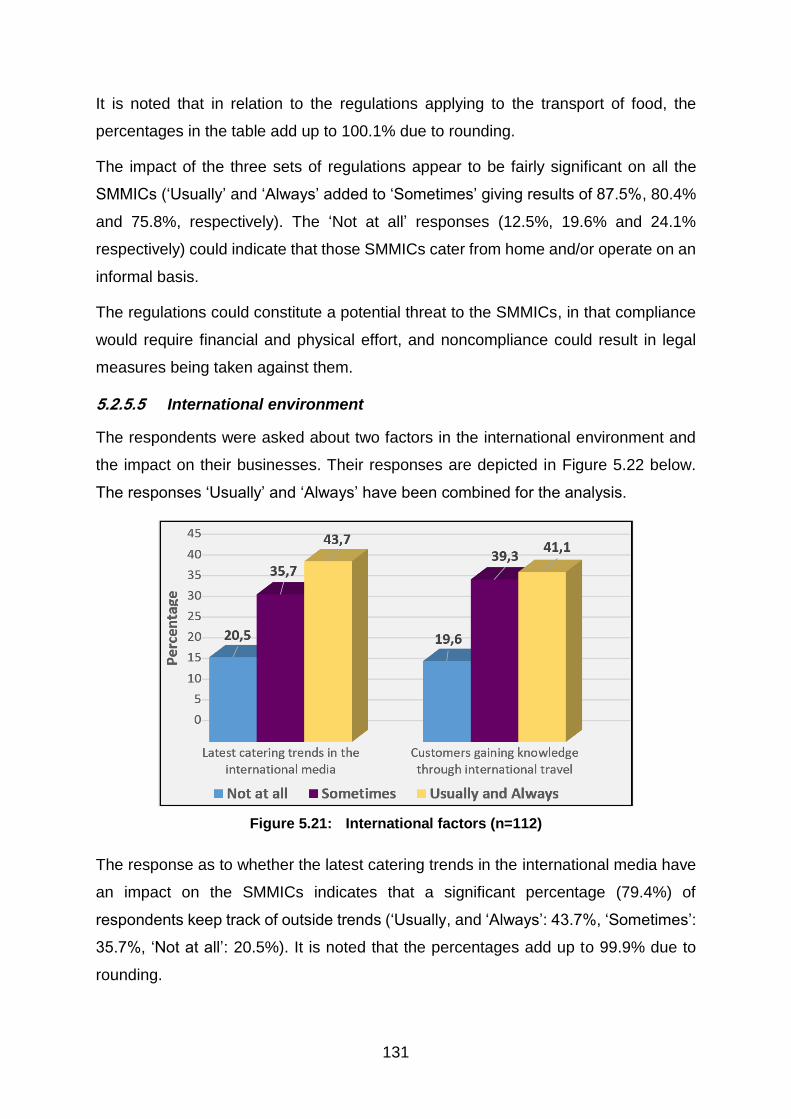
131
It is noted that in relation to the regulations applying to the transport of food, the
percentages in the table add up to 100.1% due to rounding.
The impact of the three sets of regulations appear to be fairly significant on all the
SMMICs (‘Usually’ and ‘Always’ added to ‘Sometimes’ giving results of 87.5%, 80.4%
and 75.8%, respectively). The ‘Not at all’ responses (12.5%, 19.6% and 24.1%
respectively) could indicate that those SMMICs cater from home and/or operate on an
informal basis.
The regulations could constitute a potential threat to the SMMICs, in that compliance
would require financial and physical effort, and noncompliance could result in legal
measures being taken against them.
5.2.5.5 International environment
The respondents were asked about two factors in the international environment and
the impact on their businesses. Their responses are depicted in Figure 5.22 below.
The responses ‘Usually’ and ‘Always’ have been combined for the analysis.
Figure 5.21: International factors (n=112)
The response as to whether the latest catering trends in the international media have
an impact on the SMMICs indicates that a significant percentage (79.4%) of
respondents keep track of outside trends (‘Usually, and ‘Always’: 43.7%, ‘Sometimes’:
35.7%, ‘Not at all’: 20.5%). It is noted that the percentages add up to 99.9% due to
rounding.

132
The SMMICs indicating ‘Not at All’ may not be impacted by this factor due to them
perhaps adequately catering for their customers’ needs at present, or they may cater
for lower income groups that are not impacted by these trends.
Regarding opportunities or threats, it would perhaps be advantageous, and thus an
opportunity for any SMMIC, regardless of size, to be aware of these catering trends
and to incorporate some of them in their businesses, since customers would no doubt
always have an interest when something new and innovative is presented.
Regarding the response to the second question, whether the SMMICs are affected by
customers gaining knowledge through international travel of other countries’ foods and
beverages (‘Usually’ and ‘Always’: 41.1%, ‘Sometimes’: 39.3%, ‘Not at all’: 19.6%), it
is clear that the majority (80.4%) of the respondents think to some degree that
customers do gain knowledge in this way. However, with a fifth of them indicating ‘Not
at all’, it is evident that these may again be SMMICs that cater for lower income groups
that would not be engaged in much, if any, travelling.
Opportunities could arise for SMMICs that take advantage of these international trends
to create appealing products and/or services for customers. Those SMMICs that do
not take advantage of these trends may run the risk of losing out to those that do.
5.2.5.6 Economic environment
The respondents were asked whether the three factors, as illustrated in Figure 5.22,
in the economic environment affect their business.
The respondents’ responses are depicted in Figure 5.22 below. The responses
‘Usually’ and ‘Always’ have been combined for the analysis.

133
Figure 5.22: Economic factors (n=112)
The economic factor that has the greatest impact on the SMMICs is the current state
of the economy (‘Usually’ and ‘Always’: 66.1%; ‘Sometimes’: 28.6%, ‘Not at all’: 5.4%).
It is noted that these percentages add up to 100.1% due to rounding. It can be
assumed that this is a threat to caterers, since the South African economy has not
been performing optimally for many years (as was discussed in Chapter 3).
The economic impact of the water scarcity in Cape Town is also felt by significant
numbers of the SMMICs (‘Usually’ and ‘Always’: 60.7%, ‘Sometimes’: 27.7%), and this
factor can be viewed as a threat to the SMMICs. This is to be expected, as food
preparation requires substantial quantities of water.
The respondents indicated a smaller impact with regard to unemployment levels
and/or diminished disposable income by consumers (‘Usually’ and ‘Always’: 38.4%,
‘Sometimes’: 40.2%, ‘Not at all’: 21.4%). This indicates that on some levels, and for
certain SMMICs, there is a fairly consistent demand for catered events by customers,
notwithstanding the current economic conditions.
5.2.5.7 Summary of responses for the six environments
The composite responses for the six environments are shown in Figure 5.23 below.
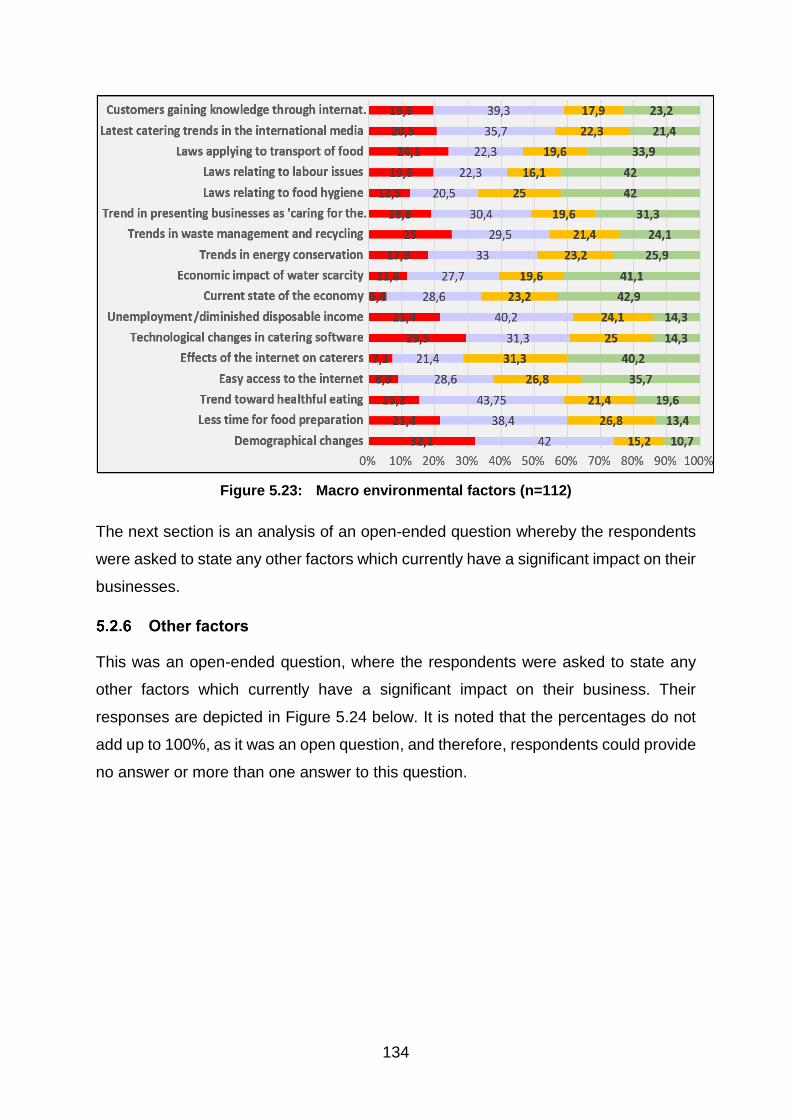
134
Figure 5.23: Macro environmental factors (n=112)
The next section is an analysis of an open-ended question whereby the respondents
were asked to state any other factors which currently have a significant impact on their
businesses.
Other factors
This was an open-ended question, where the respondents were asked to state any
other factors which currently have a significant impact on their business. Their
responses are depicted in Figure 5.24 below. It is noted that the percentages do not
add up to 100%, as it was an open question, and therefore, respondents could provide
no answer or more than one answer to this question.
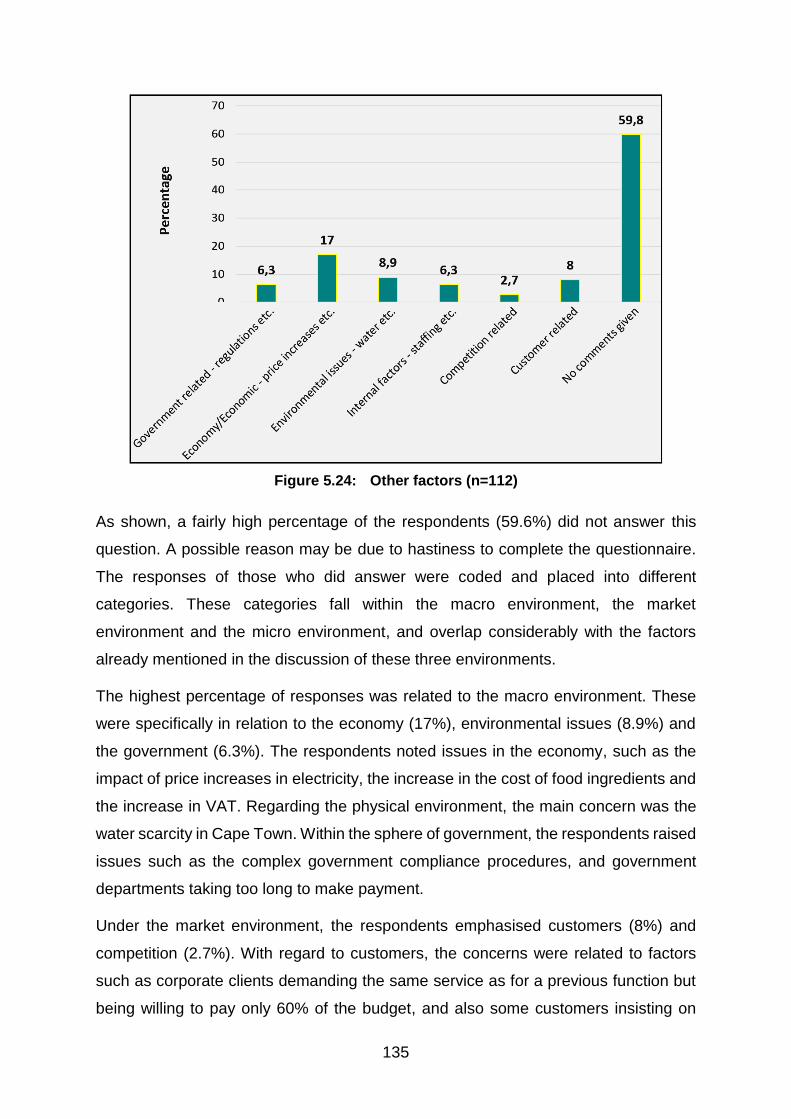
135
Figure 5.24: Other factors (n=112)
As shown, a fairly high percentage of the respondents (59.6%) did not answer this
question. A possible reason may be due to hastiness to complete the questionnaire.
The responses of those who did answer were coded and placed into different
categories. These categories fall within the macro environment, the market
environment and the micro environment, and overlap considerably with the factors
already mentioned in the discussion of these three environments.
The highest percentage of responses was related to the macro environment. These
were specifically in relation to the economy (17%), environmental issues (8.9%) and
the government (6.3%). The respondents noted issues in the economy, such as the
impact of price increases in electricity, the increase in the cost of food ingredients and
the increase in VAT. Regarding the physical environment, the main concern was the
water scarcity in Cape Town. Within the sphere of government, the respondents raised
issues such as the complex government compliance procedures, and government
departments taking too long to make payment.
Under the market environment, the respondents emphasised customers (8%) and
competition (2.7%). With regard to customers, the concerns were related to factors
such as corporate clients demanding the same service as for a previous function but
being willing to pay only 60% of the budget, and also some customers insisting on
136
dealing with Halaal certified caterers only. Issues linked to competition were the rise
of many similar types of catering businesses, and also the phenomenon of restaurants
offering catering services.
Within the micro environment (6.3%), respondents listed problems such as inadequate
equipment, inadequate stock control systems, or a lack of various other resources.
There were also complaints about lazy, unmotivated staff.
It is interesting to note that none of the respondents identified any factors which impact
positively on their businesses but focused instead on challenges. The challenges,
however, are useful in identifying the weaknesses within some of the SMMICs or the
threats that some of them face.
A general observation, based on the overall descriptive analysis above, is that it
appears that many variables can present either opportunities or threats for SMMICs,
depending on how they choose to or are able to respond to them.
5.3 SUMMARY OF THE FINDINGS
The main findings of the survey are summarised in Table 5.6 below.

137
Table 5.6: Summary of the findings
MAIN FINDINGS
FIRMOGRAPHICS
1 Location: the SMMICs are located in a total of approximately 55 different towns or suburbs.
2 Premises: 57.1% operate from homes; 42.9% operate from business premises.
3 Number of years in operation: 34.8% have been in operation for 1 to 4 years; 35.7% for 5 to 12 years; 29.5% for 13 or more years.
4 Forms of promotion: 85.7% are active on Facebook; 58.0% have actively maintained websites; 6.3% have a listing in the online yellow pages. Other forms of promotion are used by 50%, e.g. Instagram, Word-of-Mouth, Google Ads, WhatsApp and Gumtree.
5 Classification: 26.6% are classified as small; 53.2% as very small; 20.2% fall under ‘Other’ (medium-sized caterers: 6% and micro caterers: 14%).
6 Employees: More SMMICs have part-time employees (mean of 9.8) than full-time employees (mean of 5.3) and seasonal employees (mean of 9.2).
7 Members of an organisation: 89.3% do not belong to any organisation; 2.7% are members of FEDHASA, 4.5% are members of SA Chefs, 4.5% are part of various supplier, government and restaurant databases.
8 Contribution to revenue: more revenue is derived from social catering (mean of 52.3%) than business catering (mean of 42.1%).
9 Contribution to revenue from on-premise and off-premise catering: similar for both (mean of 47.1% and 52.9%, respectively, and median of 50% for both). A high standard deviation of 39.29% exists for both.
10 Contribution to revenue from midscale, upscale and budget events: majority is generated from midscale events (mean of 44.8) with similar contributions from budget and upscale events (mean of 30.2 and 26 respectively); a great degree of variance exists in the standard deviation in all three categories.
DEMOGRAPHICS
11 Roles or positions: 87.5% are owners; of these 37.5% are also full-time managers. Full time managers who are not owners comprise 12.5%.

138
MAIN FINDINGS
12 Number of years in the position: 36.6% have been in the position for 1 to 4 years, 35.7% for 5-10 years; 27.7% for 11 or more years.
13 Gender: 59.8% are female; 40.2% are male.
14 Age groups: 11.6% fall within the 18-30 age group, 25.9% in the 31-40 age group, 35.7% in the 41-50 age group, and 26.8% in the 51 and greater age group.
MICRO ENVIRONMENT
15
Mission statements (‘Yes’: 59.8%, ‘No’: 40.2%)
Vision statements (‘Yes’: 58%, ‘No’: 42%)
Goals and objectives (‘Yes’: 77.7%, ‘No’: 22.3).
16
Perceived managerial qualities of respondents:
Qualities rated higher than 90% (‘Often’ and ‘Always’):
Knowledge of ingredients used in food, leadership skills, organisational skills.
Qualities rated higher than 80% (‘Often’ and ‘Always’):
Time management skills, Knowledge of social and religious cultures, Ability to manage stress, Negotiating skills.
Qualities rated lower than 80%:
Knowledge of social media use (‘Often’ and ‘Always’: 70.5%, ‘Sometimes’: 21.4%);
Networking skills (‘Often’ and ‘Always’ 67.8%, ‘Sometimes’ 22.3%).
17
Functional areas and resources of the business:
Skills and resources rated higher than 80% (‘Often’ and ‘Always’):
A good reputation, Control of materials and production processes, Systems for receiving, storage, preparation, assembly of food, clearing and cleaning, Monitoring of customer satisfaction.
Skills and resources rated between 70% and 80% (‘Often’ and ‘Always’):

139
MAIN FINDINGS
Loyal and committed employees, Good transportation vehicles, Adherence to regulations and bargaining councils, Sufficient knowledge of suppliers, Possession of adequate skilled labour.
Skills and resources rated progressively lower than 70% (‘Often’ and ‘Always’):
Adequate financial resources (60.7%)
Strategy to determine customers’ needs (59.8%)
Unique selling point or targeting a specific niche market (59.8%)
Marketing strategy (41.1%)
Online services (39.3%)
MARKET ENVIRONMENT
18
Customers: (factors graded from greatest to least impact)
Customers demanding value for money (‘Usually’ and ‘Always’: 79.5%, ‘Sometimes’: 18.8%).
Customers being more informed about various and alternative catering options available to them (‘Usually’ and ‘Always’: 57.2%, ‘Sometimes’: 39.3%).
Customers having increased product knowledge (‘Usually’ and ‘Always’: 43.7%, Sometimes’: 45.5%).
Customers switching caterers easily (‘Usually and ‘Always’: 33%, ‘Sometimes’: 55.4% and ‘Not at All’: 11.6%).
19
Competitors: (factors graded from greatest to least impact)
New competitors (caterers) continually appearing in the market (‘Usually’ and ‘Always’: 68.7%, ‘Sometimes’: 27.7%, ‘Not at All’: 3.6%).
New types of competition or competitive substitute products continually arising (‘Usually’ and ‘Always’: 60.7%, ‘Sometimes’: 32.1%).
A high degree of rivalry existing among existing competitors (‘Usually’ and ‘Always’: 46.4%, ‘Sometimes’: 33.9%, ‘Not at all’: 19.6%).
Monitoring of competitors (‘Usually’ and ‘Always’: 58%, ‘Sometimes’: 31.3%).
20 Suppliers: (factors graded from greatest to least impact)
Good working relationships with regard to food suppliers (Usually’ and ‘Always’: 91.1%, ‘Sometimes’: 8%).

140
MAIN FINDINGS
Attention that suppliers pay to quality or standards (Usually’ and ‘Always’: 84.8%, ‘Sometimes’: 13.4%).
Good and reasonably priced supply of food and beverage products in Cape Town (‘Usually’ and ‘Always’: 76.8%, Sometimes’: 19.6%).
Good supply of catering equipment in Cape Town (‘Usually’ and ‘Always’: 64.3%, ‘Sometimes’: 30.4).
Good supply of catering IT systems in Cape Town (‘Usually’ and ‘Always’: 47.4%, ‘Sometimes’: 32.1%, ‘Not at All’: 20.5%).
21
Intermediaries: (factors graded from greatest to least impact)
Wholesalers (‘Usually’ and ‘Always’: 49.1%, ‘Sometimes’: 29.5%.
Banks (‘Usually’ and ‘Always’: 33.9%, ‘Sometimes’: 26.8%).
Wedding and event planners products (‘Usually’ and ‘Always’: 37.5%, ‘Sometimes’: 37.5%).
Technological apps linking caterers and customers (‘Usually’ and ‘Always’: 18.7%, ‘Sometimes’: 25.0%).
Insurance agents (Usually’ and ‘Always’: 16.9%, ‘Sometimes’: 28.6%).
MACRO ENVIRONMENT
22
Socio-cultural environment: (factors graded from greatest to least impact)
Trend toward more healthful eating/use of organic products/vegetarianism (‘Usually’ and ‘Always’:41%, ‘Sometimes’: 43.8%, ‘Not at all’: 15.2%).
Less time available for food preparation by consumers (‘Usually’ and ‘Always’: 40.2%, ‘Sometimes’: 38.4%, ‘Not at all’: 21.4%).
Demographical changes, such as the increase in smaller families and increase in double income households (‘Usually’ and ‘Always’: 25.9%, ‘Sometimes’: 42%, ‘Not at all’: 32.1%).
23
Technological environment: (factors graded from greatest to least impact)
Effects of the internet (‘Usually’ and ‘Always’: 71.5%, ‘Sometimes’: 21.4%).
Easy access to the internet, mobile apps and social media by consumers (‘Usually’ and ‘Always’: 62.5%, ‘Sometimes’: 28.6%).
Technological changes in catering software (‘Usually’ and ‘Always’: 39.3%, ‘Sometimes’: 31.3%, ‘Not at all’: 29.5%).
24
Economic environment: (factors graded from greatest to least impact)
Current state of the economy (‘Usually’ and ‘Always’: 66.1%: ‘Sometimes’: 28.6%).
Economic impact of the water scarcity in Cape Town (‘Usually’ and ‘Always’: 60.7%, ‘Sometimes’: 27.7%).

141
MAIN FINDINGS
Unemployment levels and/or diminished disposable income by consumers (‘Usually’ and ‘Always’: 38.4%, ‘Sometimes’: 40.2%, ‘Not at all’: 21.4%).
25
Physical environment: (factors graded from greatest to least impact)
Trend in presenting businesses as ‘caring for the environment’ (‘Usually’ and ‘Always’: 50.9%, ‘Sometimes’: 30.4%, ‘Not at all’: 18.8%).
Trends in energy conservation (‘Usually’ and ‘Always’: 49.1%, ‘Sometimes’: 33%, ‘Not at all’: 17.9%).
Trends in waste management and recycling (‘Usually’ and ‘Always’: 45.5%, ‘Sometimes’: 29.5%, ‘Not at all’: 25%).
26
Political-legal environment: (factors graded from greatest to least impact)
Regulations relating to food hygiene (‘Usually’ and ‘Always’: 67.5%, ‘Sometimes’: 20.5%, ‘Not at all’: 12.5%).
Regulations relating to labour issues (‘Usually’ and ‘Always’: 58.1%, ‘Sometimes’: 22.3%, ‘Not at all’: 19.6%).
Regulations applying to transport of food (‘Usually’ and ‘Always’: 53.5%, ‘Sometimes’: 22.3%, ‘Not at all’: 24.1).
27
International environment: (factors graded from greatest to least impact)
The latest catering trends in the international media (‘Usually’ and ‘Always’:43.7%, ‘Sometimes’: 35.7%, ‘Not at all’: 20.5%).
Customers gaining knowledge through international travel of other countries’ foods and beverages (‘Usually’ and ‘Always’: 41.1%, ‘Sometimes’:39.3%, ‘Not at all’: 19.6%).
28
Other factors: open-ended question
Macro environment: economy (17%), environment (8.9%), government (6.3%).
Market environment: impact of customers (8%) and competition (2.7%).
Micro environment: problems experienced such as inadequate equipment, inadequate stock control systems, staffing problems and a lack of various resources (6.3%).
142
Table 5.6 depicts the main findings of the survey. These findings, as well as those in
Chapter 6 (Inferential Analysis), will be utilised in Chapter 7 as the basis for the findings
and conclusions of the research.
5.4 CONCLUSION
In this chapter, use was made of descriptive analysis to assess the results of the
survey. The descriptive statistics were used to analyse the firmographic and
demographic information of the caterers in the sample, as well as the micro, market
and macro environments of their businesses. The main findings of the study were
summarised in a table at the end of the chapter.
The next chapter focuses on additional analyses in the form of inferential analysis to
determine relationships and differences between the various variables.

143
CHAPTER 6:
INFERENTIAL DATA ANALYSIS AND INTERPRETATION
6.1 INTRODUCTION
The previous chapter used descriptive analysis to statistically report on the results of
the quantitative research regarding the factors in the business environment that impact
on small, medium and micro independent caterers (SMMICs) in Cape Town. The next
stage of the data analysis process is to analyse the results further with the aid of
inferential analysis.
Various tests were utilised where appropriate, namely, exploratory factor analysis,
Categorical Principal Component Analysis (CATPCA), the Pearson correlation
coefficient, and the non-parametric Kruskal-Wallis test.
Through these tests, the primary and secondary objectives of the research are
addressed. The aim of the exploratory factor analysis and CATPCA is to identify the
relationships in a large set of variables, while the Pearson correlation coefficient seeks
to identify relationships existing between pairs of variables. The non-parametric
Kruskal-Wallis one way analysis of variance by ranks test, and the parametric Student
T-test for independent samples were used to test the hypotheses.
6.2 EXPLORATORY FACTOR ANALYSIS
Exploratory factor analyses were conducted on questions 12, 14, 15, 16 and 17 in the
questionnaire with the aim of reducing the data to a smaller set of meaningful factors.
In Question 12, the analysis focused on the micro environment, in particular, the
qualities that managers of SMMICs possess. In Questions 14, 15 and 16 that dealt
with the market environment, the focus was on customers, competitors, suppliers and
intermediaries. In Question 17, which referred to the macro environment, the analysis
considered the socio-cultural, technological, economic, physical, political-legal and
international environments. For all the sections, principal axis factoring as extraction
method, and promax, as rotation method were used.
The various sections are analysed below.

144
Micro-environment (General management)
The Kaiser-Meyer-Olkin Measure of Sampling Adequacy (.801) larger than the
acknowledged threshold of 0.6, and the Bartlett's Test of Sphericity which was
significant (p<0.001), both indicated that a factor analysis was appropriate.
The analysis identified two factors, based on the eigenvalue criterion of eigenvalues
greater than one, which explain 57.8% of the variance. The final factor loadings are
shown below in Table 6.1.
Table 6.1: Factor loadings: General management
Factor 1 Factor 2
Leadership skills .583
Negotiating skills .588
Organisational skills (setting up job categories, allocating authority, responsibility and accountability)
.708
Time-management skills .910
Ability to manage stress .664
Knowledge of ingredients used in food .503
Knowledge of social and religious cultures which affect the business
.345
Knowledge of social media use .868
Networking skills .772
Using Cronbach’s alpha, the internal consistency (reliability) for the two factors was
found to be 0.810 and 0.807, respectively, both above the recommended threshold of
0.7. The reliability of the two factors was thus deemed satisfactory.
The factors were labelled: i) General business skills, and ii) Networking and social
media skills.
Market environment: Customers and competitors
The Kaiser-Meyer-Olkin Measure of Sampling Adequacy (.775) greater than 0.6, and
the Bartlett's Test of Sphericity, which was significant (p<0.001), both indicated that a
factor analysis was appropriate.

145
The analysis identified two factors, based on the eigenvalue criterion of eigenvalues
greater than one, which explains 53.6% of the variance. The final factor loadings are
shown below in Table 6.2.
Table 6.2: Factor loadings: Customers and competitors
Factor 1 Factor 2
Customers are more demanding with regard to wanting value for money
.371
Customers have increased product knowledge (e.g. organic foods)
.639
Customers are more informed about various and alternative catering options available to them
.736
Customers switch caterers easily .380
There is a high degree of rivalry among existing competitors
.469
New competitors (caterers) continually appear in the market
.677
New types of competition, or competitive substitute products continually arise
.887
Competitors are continually monitored (e.g. their pricing, menu items, services offered)
.511
Using Cronbach’s alpha, the internal consistency (reliability) for the two factors was
found to be 0.757 and 0.637, respectively, with only the first factor above the
recommended threshold of 0.7. However, given the exploratory nature of the research,
values above 0.6 were also considered acceptable (Hair, Black, Babin & Anderson,
2010). The reliability of the two constructs was thus deemed to be satisfactory.
The factors were labelled: i) Customer demands and competitor challenges, and ii)
Increased customer knowledge.
Market environment: Suppliers
The Kaiser-Meyer-Olkin Measure of Sampling Adequacy (.609), and the Bartlett's Test
of Sphericity, which was significant (p<0.001), both indicated that a factor analysis was
appropriate.

146
The analysis identified two factors, based on the eigenvalue criterion of eigenvalues
greater than one, which explains 70.0% of the variance. The final factor loadings are
shown below in Table 6.3.
Table 6.3: Factor loadings: Suppliers
Factor 1 Factor 2
Your suppliers pay particular attention to quality or standards
.555
Good working relationships and understanding of each other’s responsibilities exist between you and your food suppliers
.955
A good and reasonably priced supply of catering equipment exists in Cape Town
.834
A good and reasonably priced supply of food and beverage products exists in Cape Town
.816
A good supply of catering IT systems (services ranging from hardware, software, installation and training) exists in Cape Town
.388
Using Cronbach’s alpha, the internal consistency (reliability) for the factors was found
to be 0.704 (factor 1) and 0.713 (factor 2), both above the recommended threshold of
0.7. The reliability of the construct was thus deemed satisfactory.
Factor 2 was labelled as Supplier quality and relationships, and factor 1 as Satisfactory
sources of supply.
Market environment: Intermediaries
The Kaiser-Meyer-Olkin Measure of Sampling Adequacy (.727) and the Bartlett's Test
of Sphericity, which was significant (p<0.001), both indicated that a factor analysis was
appropriate.
The analysis identified one factor, based on the eigenvalue criterion of eigenvalues
greater than one, which explains 46.8% of the variance.
The factor loadings are shown below in Table 6.4.

147
Table 6.4: Factor loadings: Intermediaries
Factor
Wholesalers .575
Bankers/banks .834
Insurance agents .670
Apps which link caterers and customers .459
Agents such as wedding and event planners (facilitating business between the business and customers)
.322
Using Cronbach’s alpha, the internal consistency (reliability) for the factor was found
to be 0.706, above the recommended threshold of 0.7. The reliability of the construct
was thus deemed satisfactory.
The factor was labelled as Intermediary impact.
Macro environment: Various factors
The Kaiser-Meyer-Olkin Measure of Sampling Adequacy (.873) and the Bartlett's Test
of Sphericity, which was significant (p<0.001), both indicated that a factor analysis was
appropriate.
The analysis identified four factors, based on the eigenvalue criterion of eigenvalues
greater than one, which explains 66.8% of the variance.
The final factor loadings are shown below in Table 6.5. The third item in the table had
a factor loading of less than 0.3 and was not considered in further analyses.

148
Table 6.5: Factor loadings: Macro environmental factors
Factor 1
Factor 2
Factor 3
Factor 4
Demographical changes, such as the increase in smaller families/increase in double income households
.306
Consumers have less time available for food preparation
.503
The trend toward more healthful eating/use of organic products/vegetarianism
Easy access to the internet, mobile apps and social media by consumers (e.g. accessing caterers’ websites, ordering meals, evaluating catering events)
.801
Effects of the internet on caterers (e.g. new ideas and catering opportunities, faster speed in sourcing food products)
.792
Technological changes in catering software (e.g. online reservation systems, creation of client accounts, stock figures, recipe management)
.553
Unemployment levels/diminished disposable income of consumers
.544
Current state of the economy .833
Economic impact of water scarcity .720
Trends in energy conservation (more efficient cooking, refrigeration, dishwasher and ventilation systems)
.681
Trends in waste management and recycling .962
Trend in presenting businesses as ‘caring for the environment’
.843
Regulations relating to food hygiene (e.g. licencing and certification of all food preparation facilities)
.882
Regulations relating to labour issues (e.g. health and safety at work)
.850
Regulations applying to transport of food .913
Latest catering trends in the international media .308
Customers gaining knowledge through international travel of other countries’ foods and beverages
.437
Using Cronbach’s alpha, the internal consistency (reliability) for the four factors was
found to be 0.931, 0.810, 0.751 and 0.889, respectively, all above the recommended

149
threshold of 0.7. The reliability of the four constructs was thus deemed satisfactory.
The factors were labelled as i) Legal, ii) Socio-economic, iii) Technological, and iv)
Environmental.
As shown above, the analysis of questions 12, 14, 15, 16 and 17 with exploratory
factor analysis produced a total of 11 underlying factors. Factor-based variables were
subsequently calculated. Further analyses were confined to these factors or variables.
The next section commences with determining the nature of the variables through
factor descriptives.
6.3 FACTOR DESCRIPTIVES
Table 6.6 provides the descriptive information for the 11 factors identified. The
descriptive information consists of the mean, median, standard deviation, skewness
and kurtosis for each factor.
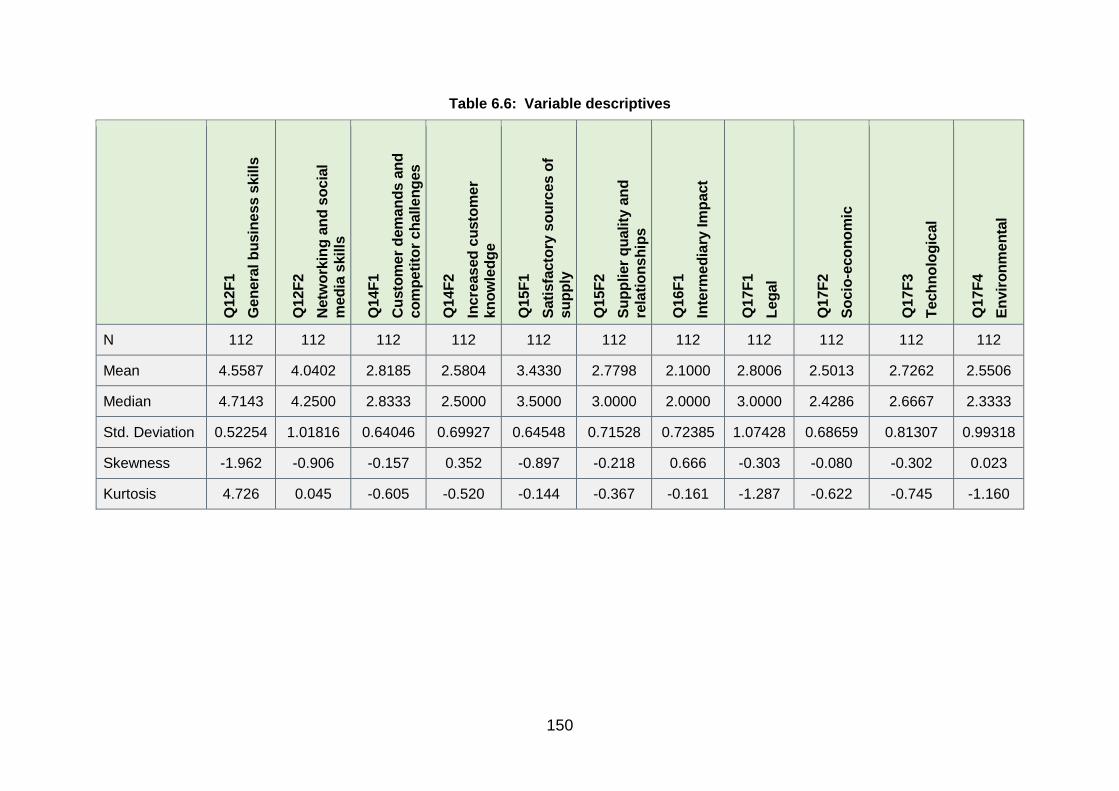
150
Table 6.6: Variable descriptives
Q1
2F
1
Ge
nera
l b
usin
ess s
kills
Q1
2F
2
Netw
ork
ing
an
d s
ocia
l
med
ia s
kills
Q1
4F
1
Cu
sto
me
r d
em
an
ds a
nd
c
om
pe
tito
r c
halle
ng
es
Q1
4F
2
Incre
as
ed
cu
sto
me
r k
no
wle
dg
e
Q1
5F
1
Sati
sfa
cto
ry s
ou
rces o
f s
up
ply
Q1
5F
2
Su
pp
lier
qu
ality
an
d
rela
tio
ns
hip
s
Q1
6F
1
Inte
rme
dia
ry Im
pact
Q1
7F
1
Leg
al
Q1
7F
2
So
cio
-eco
no
mic
Q1
7F
3
Tech
no
log
ical
Q1
7F
4
En
vir
on
me
nta
l
N 112 112 112 112 112 112 112 112 112 112 112
Mean 4.5587 4.0402 2.8185 2.5804 3.4330 2.7798 2.1000 2.8006 2.5013 2.7262 2.5506
Median 4.7143 4.2500 2.8333 2.5000 3.5000 3.0000 2.0000 3.0000 2.4286 2.6667 2.3333
Std. Deviation 0.52254 1.01816 0.64046 0.69927 0.64548 0.71528 0.72385 1.07428 0.68659 0.81307 0.99318
Skewness -1.962 -0.906 -0.157 0.352 -0.897 -0.218 0.666 -0.303 -0.080 -0.302 0.023
Kurtosis 4.726 0.045 -0.605 -0.520 -0.144 -0.367 -0.161 -1.287 -0.622 -0.745 -1.160

151
From Table 6.6, it can be seen that the factor Q16F1 has the lowest mean value (Me
= 2.10). This indicates that, on average, intermediaries tend to sometimes impact
caterers. The highest mean value is observed for the factor Q12F1 (Me = 4.56),
indicating that the owners/managers tend to often or always possess general business
skills.
For this study, the skewness values are between - 2 and + 2, while the kurtosis values
for 10 of the 11 factors are between - 2 and + 2, indicating that a normal distribution
can be assumed. The one factor with kurtosis values above + 2, indicates a slight
deviation from normality. It is important to note that these deviations do not represent
a major violation of the normal distribution assumption. In addition, where the
assumption of normality is required, the reason why the variable can be used in the
analysis will be provided, for example, tests can be robust to deviations from normality.
The median (or 50th percentile) indicates the middle value of the ratings when
arranged in rank order (Saunders et al., 2019:796). For 6 of the 11 factors, the median
values are higher than the mean values, indicating that the mean values for the factors
were potentially influenced by a few respondents who provided a low rating.
6.4 RELATIONSHIP ANALYSIS
Inferential statistics is done to determine the relationship between various factors or
variables.
A correlation analysis was undertaken to provide an understanding of the strength and
direction of the relationships between the 11 business environment factors that were
previously identified. Pearson correlation coefficient tests enabled an understanding
of the interrelationships between each pair of factors.
The results are summarised in Table 6.7.

152
Table 6.7: Pearson Correlation Coefficients
Q12F1 Q12F2 Q14F1 Q14F2 Q15F1 Q15F2 Q16F1 Q17F1 Q17F2 Q17F3 Q17F4
Q12F1 Pearson Correlation 1
Sig. (2-tailed)
Q12F2 Pearson Correlation .378** 1
Sig. (2-tailed) 0,000
Q14F1 Pearson Correlation 0,114 0,147 1
Sig. (2-tailed) 0,233 0,122
Q14F2 Pearson Correlation .191* 0,176 .408** 1
Sig. (2-tailed) 0,043 0,064 0,000
Q15F1 Pearson Correlation .295** 0,035 0,105 0,162 1
Sig. (2-tailed) 0,002 0,714 0,272 0,088
Q15F2 Pearson Correlation 0,132 0,124 0,145 .195* .293** 1
Sig. (2-tailed) 0,164 0,194 0,128 0,040 0,002
Q16F1 Pearson Correlation 0,089 0,042 .236* 0,068 0,155 0,053 1
Sig. (2-tailed) 0,350 0,659 0,012 0,479 0,102 0,576
Q17F1 Pearson Correlation 0,149 0,167 .314** .195* .232* 0,090 .446** 1
Sig. (2-tailed) 0,117 0,079 0,001 0,039 0,014 0,348 0,000
Q17F2 Pearson Correlation .186* .265** .389** .461** 0,084 -0,084 .364** .497** 1
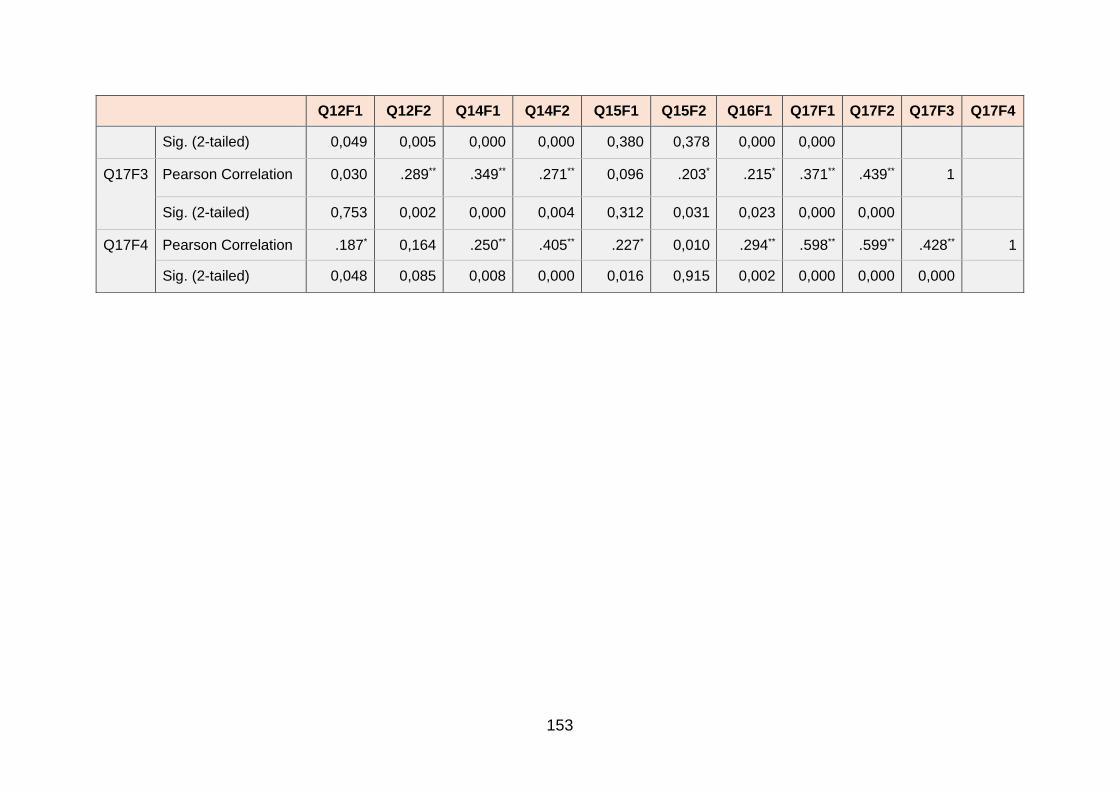
153
Q12F1 Q12F2 Q14F1 Q14F2 Q15F1 Q15F2 Q16F1 Q17F1 Q17F2 Q17F3 Q17F4
Sig. (2-tailed) 0,049 0,005 0,000 0,000 0,380 0,378 0,000 0,000
Q17F3 Pearson Correlation 0,030 .289** .349** .271** 0,096 .203* .215* .371** .439** 1
Sig. (2-tailed) 0,753 0,002 0,000 0,004 0,312 0,031 0,023 0,000 0,000
Q17F4 Pearson Correlation .187* 0,164 .250** .405** .227* 0,010 .294** .598** .599** .428** 1
Sig. (2-tailed) 0,048 0,085 0,008 0,000 0,016 0,915 0,002 0,000 0,000 0,000

154
These are interpreted according to the thresholds of, below 0.3 as small, between 0.3
and 0.5 as moderate, and 0.5 and above as large (direction of relationship can be
positive or negative). Positive strong and moderate relationships are listed below:
Between General business skills, and Networking and social media skills
(Q12F1 and Q12F2). – r = .378
Between Customer demands, competitor challenges and Increased customer
knowledge (Q14F1 and Q14F2). – r = .408
Between Customer demands and competitor challenges and Legal
(Q14F1 and Q17F1). - r = .314
Between Customer demands and competitor challenges and Socio-economic
(Q14F1 and Q17F2). – r = .389
Between Customer demands and competitor challenges and Technological
(Q14F1 and Q17F3). – r = .349
Between Increased Customer knowledge and Socio-economic
(Q14F2 and Q17F2). – r = .461
Between Increased Customer knowledge and Environmental
(Q14F2 and Q17F4). – r = .405
Between Intermediary impact and Legal
(Q16F1 and Q17F1). – r = .446
Between Intermediary impact and Socio-economic
(Q16F1 and Q17F2). – r = .364
Between Legal and Socio-economic
(Q17F1 and Q17F2). – r = .497
Between Legal and Technological
(Q17F1 and Q17F3). - r = .371
Between Legal and Environmental
(Q17F1 and Q17F4). - r = .598 (strong relationship)
Between Socio-economic and Technological
(Q17F2 and Q17F3). – r = .439
155
Between Socio-economic and Environmental
(Q17F2 and Q17F4). – r = .599 (strong relationship)
Between Technological and Environmental
(Q17F3 and Q17F4) - r = .428
6.5 DIFFERENCE TESTING
The next set of inferential analyses was conducted firstly, to determine if statistically
significant differences exist with regard to the business environment factors between
the different age groups, and also between the different roles or positions of the
owners/managers.
Differences between the age groups and roles/positions of the
owners/managers regarding impact of business environment factors
The hypotheses that were tested are:
H1:1: Differences exist concerning the business environment factors
H1A.1 between the age groups of the owners/managers
H1B.1 between the role/position groups
H1:0: Differences do not exist concerning the business environment factors
H1A.0 between the age groups of the owners/managers
H1B.0 between the role/position groups
The non-parametric Kruskal-Wallis one-way analysis of variance by ranks was used
to test the above hypotheses. Non-parametric statistics is suitable when the variable
being analysed does not conform to any known or continuous distribution (Zikmund,
Babin, Carr, & Griffin, 2013:516). The Kruskal-Wallis test can be used when three or
more independent groups need to be compared based on a single variable, and is
applied when the sample groups are small, the distribution of the data is not a normal
distribution or if the data type is ordinal.
Tables 6.8 and 6.9 (on the next page) show the results of the first and second
hypotheses, regarding the age groups of the owners/managers, and the business
environment factors and the role or position of the owners/managers, respectively.

156
Table 6.8: Kruskal-Wallis test for Age
Q12F1 Q12F2 Q14F1 Q14F2 Q15F1 Q15F2 Q16F1 Q17F1 Q17F2 Q17F3 Q17F4
Kruskal-Wallis H 0.938 8.680 2.060 1.545 2.951 5.052 1.647 10.595 2.341 6.184 5.805
Df 3 3 3 3 3 3 3 3 3 3 3
Asymp. Sig. 0.816 0.034 0.560 0.672 0.399 0.168 0.649 0.014 0.505 0.103 0.122
a. Kruskal Wallis Test
b. Grouping Variable: age_4g
Table 6.9: Kruskal-Wallis test for Role/Position
Q12F1 Q12F2 Q14F1 Q14F2 Q15F1 Q15F2 Q16F1 Q17F1 Q17F2 Q17F3 Q17F4
Kruskal-Wallis H 1.730 2.228 3.671 4.772 2.351 0.751 0.416 4.105 4.496 4.499 2.451
Df 2 2 2 2 2 2 2 2 2 2 2
Asymp. Sig. 0.421 0.328 0.160 0.092 0.309 0.687 0.812 0.128 0.106 0.105 0.294
a. Kruskal Wallis Test
b. Grouping Variable: owner_3g

157
The results listed in Table 6.8 indicate that there is a statistically significant difference,
at the 5% level of significance between the age groups with regard to General business
skills (Q12F2) and the macro environmental factor, Legal (Q17F1), (p = 0.034 and p =
0.014 respectively). None of the other factors show statistically significant differences
(all the p values are above 0.1). Furthermore, the mean ranks indicate that the younger
age groups (18 to 40 years) tend to possess Networking and social media skills more
than the older (41 years and older) groups (mean ranks of 75.73 and 62.71 vs 50.6
and 50.03). See Table 103 in Appendix E.
Regarding the Legal factor (Q17F1), the mean ranks indicate that two age groups (18
to 30 years, and 41 to 50 years) tend to experience the impact of regulations more
often (mean ranks of 77.85 and 61.48, respectively) than the other two age groups (31
to 40 and 51 plus) (mean ranks of 48.66 and 48.20, respectively). See Table 103 in
Appendix E.
Thus the null hypothesis for the age groups of the owners/managers can be rejected
for the General business skills and the Legal macro environmental factor.
The second hypothesis, regarding the business environment factors and the role or
position of the owners/managers, was tested and the results are shown in Table 6.9
above.
The results indicate that there is a statistically significant difference, at the 10% level
of significance, between the role or position of the owners/managers with regard to
Increased customer knowledge (Q14F2), (p = 0.092). None of the other factors show
statistically significant differences (all the p values are above 0.1).
The mean ranks indicate that the owners who are also full-time managers (mean rank
of 63.92) tend to experience increased customer knowledge more often than the
owners (mean rank of 59.75) and managers (full-time) (mean rank of 50.13). See
Table 104 in Appendix E.
Thus the null hypothesis for the roles or positions of the owners/managers can be
rejected for the Increased customer knowledge factor.
Inferential analyses were conducted, secondly, to determine if statistically significant
differences exist with regard to the business environment factors between the groups
as defined by the categories of gender, business location, size, and website variables.

158
The Student t-test for independent groups was used to determine the statistical
significance of the differences between these groups, with a 5% level of significance.
Differences between males and females regarding impact of business
environment factors
The first test was conducted to determine whether statistically significant differences
exist between males and females concerning the impact of the business environment
factors.
The hypotheses that were tested are:
H1: There is a statistically significant difference between the males and females
with regard to the impact of each of the business environment factors.
H0: There is no statistically significant difference between the males and females
with regard to the impact of each of the business environment factors.
The mean and standard deviation of the business environment impact per group were
as shown in Table 6.10 below.
Table 6.10: Mean and standard deviation for business environment impact factors per gender group
Gender N Mean Std. Deviation
Q12F1 Male 45 4.5746 .47915
Female 67 4.5480 .55306
Q12F2 1.00 45 4.1111 .91632
2.00 67 3.9925 1.08534
Q14F1 1.00 45 2.8037 .64578
2.00 67 2.8284 .64155
Q14F2 1.00 45 2.7111 .66134
2.00 67 2.4925 .71506
Q15F1 1.00 45 3.3111 .69322
2.00 67 3.5149 .60284
Q15F2 1.00 45 2.6741 .61336
2.00 67 2.8507 .77260
Q16F1 1.00 45 2.1689 .69407

159
Gender N Mean Std. Deviation
2.00 67 2.0537 .74474
Q17F1 1.00 45 2.7704 1.12999
2.00 67 2.8209 1.04338
Q17F2 1.00 45 2.4952 .63567
2.00 67 2.5053 .72346
Q17F3 1.00 45 2.6963 .79716
2.00 67 2.7463 .82896
Q17F4 1.00 45 2.5852 1.00543
2.00 67 2.5274 .99180
The results of the Student t-test for independent groups with regards to the differences
between males and females, with regard to the impact of each of the business
environment factors are tabled below in Table 6.11.
Table 6.11: Student t-test: differences between males and females with regard to the impact of each of the business environment factors
Independent samples test
Levene's test for equality of variances
t-test for equality
of means
F Sig. t df Sig.(2-tailed)
Q12F1 Equal variances assumed
0,550 0,460 0,263 110 0,793
Equal variances not assumed
0,271 102,996 0,787
Q12F2 Equal variances assumed
1,549 0,216 0,602 110 0,548
Equal variances not assumed
0,623 104,268 0,535
Q14F1 Equal variances assumed
0,424 0,516 -0,199 110 0,843
Equal variances not assumed
-0,199 94,101 0,843

160
Independent samples test
Levene's test for equality of variances
t-test for equality
of means
F Sig. t df Sig.(2-tailed)
Q14F2 Equal variances assumed
0,305 0,582 1,634 110 0,105
Equal variances not assumed
1,659 99,377 0,100
Q15F1 Equal variances assumed
1,330 0,251 -1,651 110 0,102
Equal variances not assumed
-1,606 85,366 0,112
Q15F2 Equal variances assumed
3,925 0,050 -1,285 110 0,201
Equal variances not assumed
-1,344 106,851 0,182
Q16F1 Equal variances assumed
0,328 0,568 0,824 110 0,412
Equal variances not assumed
0,836 98,924 0,405
Q17F1 Equal variances assumed
0,911 0,342 -0,243 110 0,808
Equal variances not assumed
-0,239 89,298 0,812
Q17F2 Equal variances assumed
1,392 0,241 -0,076 110 0,940
Equal variances not assumed
-0,078 102,261 0,938
Q17F3 Equal variances assumed
0,130 0,719 -0,318 110 0,751
Equal variances not assumed
-0,320 97,009 0,750
Q17F4 Equal variances assumed
0,011 0,917 0,301 110 0,764
Equal variances not assumed
0,300 93,642 0,765

161
The null hypothesis of equal variances cannot be rejected (p-values all above 0.05)
for 10 of the 11 factors. Therefore, the associated t-value and significance values for
equal variances assumed will be used. In the case of Q15F2 (Supplier quality and
relationships), the p-value is equal to 0.05, and we reject the null hypothesis of equal
variances for this factor. In this case, the associated t-value and significance values
for equal variances not assumed were used.
No statistically significant differences were found between males and females, as all
p-values are above 0.05.
Therefore, the null hypothesis of no difference between males and females with regard
to the business environment factors cannot be rejected.
Although the differences are not statistically significant, it is evident that males have
higher scores for factors Q12F1 (General business skills), Q12F2 (Networking and
social media skills), Q14F2 (Increased customer knowledge), Q16F1 (Intermediary
Impact) and Q17F4 (Environmental).
Females have higher scores for factors Q14F1 (Customer demands and competitor
challenges), Q15F1 (Satisfactory sources of supply), Q15F2 (Supplier quality and
relationships), Q17F1 (Legal), Q17F2 (Socio-economic) and Q17F3 (Technological).
Differences between businesses located in houses versus business
premises regarding impact of business environment factors
The second test was conducted to determine whether statistically significant
differences exist between businesses located in houses versus business premises,
concerning the impact of the business environment factors.
The hypotheses that were tested are:
H1: There is a statistically significant difference between businesses located in houses
versus business premises with regard to the impact of each of the business
environment factors.
H0: There is no statistically significant difference between the businesses located in
houses versus business premises with regard to the impact of each of the
business environment factors.

162
The mean and standard deviation of the business environment impact per group are
as shown in Table 6.12 below.
Table 6.12: Mean and standard deviation for business environment impact on location
Location N Mean Std. Deviation
Q12F1 House 64 4.5692 0.50234
Business Premises 48 4.5446 0.55341
Q12F2 1.00 64 4.0938 1.07598
2.00 48 3.9688 0.94197
Q14F1 1.00 64 2.8932 0.64198
2.00 48 2.7188 0.63129
Q14F2 1.00 64 2.6016 0.67952
2.00 48 2.5521 0.73107
Q15F1 1.00 64 3.4453 0.62435
2.00 48 3.4167 0.67896
Q15F2 1.00 64 2.7031 0.73970
2.00 48 2.8819 0.67544
Q16F1 1.00 64 2.0875 0.76001
2.00 48 2.1167 0.68022
Q17F1 1.00 64 2.7240 1.11040
2.00 48 2.9028 1.02673
Q17F2 1.00 64 2.5670 0.71586
2.00 48 2.4137 0.64243
Q17F3 1.00 64 2.7135 0.85422
2.00 48 2.7431 0.76334
Q17F4 1.00 64 2.6771 1.04057
2.00 48 2.3819 0.90960

163
The results of the Student t-test for independent groups with regards to the differences
between location in houses versus business premises, with regard to the impact of
each of the business environment factors are tabled in Table 6.13 below.
Table 6.13: Student t-test: differences between location in houses versus business premises
Independent Samples Test
Levene's test for equality of variances
t-test for equality of
means
F Sig. t df Sig. (2-tailed)
Q12F1 Equal variances assumed
2.132 0.147 0.245 110 0.807
Equal variances not assumed
0.242 95.757 0.810
Q12F2 Equal variances assumed
0.153 0.697 0.641 110 0.523
Equal variances not assumed
0.654 107.322 0.515
Q14F1 Equal variances assumed
0.009 0.925 1.434 110 0.155
Equal variances not assumed
1.437 102.279 0.154
Q14F2 Equal variances assumed
0.007 0.934 0.369 110 0.713
Equal variances not assumed
0.365 97.197 0.716
Q15F1 Equal variances assumed
0.318 0.574 0.231 110 0.817
Equal variances not assumed
0.229 96.549 0.820
Q15F2 Equal variances assumed
0.680 0.411 -1.314 110 0.192
Equal variances not assumed
-1.331 105.749 0.186
Q16F1 Equal variances assumed
0.511 0.476 -0.210 110 0.834

164
Independent Samples Test
Levene's test for equality of variances
t-test for equality of
means
F Sig. t df Sig. (2-tailed)
Equal variances not assumed
-0.213 106.538 0.831
Q17F1 Equal variances assumed
1.355 0.247 -0.871 110 0.386
Equal variances not assumed
-0.881 105.221 0.380
Q17F2 Equal variances assumed
1.130 0.290 1.171 110 0.244
Equal variances not assumed
1.189 106.436 0.237
Q17F3 Equal variances assumed
1.393 0.240 -0.189 110 0.850
Equal variances not assumed
-0.192 106.596 0.848
Q17F4 Equal variances assumed
4.630 0.034 1.566 110 0.120
Equal variances not assumed
1.597 107.372 0.113
The null hypothesis of equal variances cannot be rejected (p-values all above 0.05)
for 10 of the 11 factors. Therefore, the associated t-value and significance values for
equal variances assumed were used. In the case of Q17F4 (Environmental), the p-
value is equal to 0.034 (less than 0.050) and we rejected the null hypothesis of equal
variances for this factor. In this case, the associated t-value and significance values
for equal variances not assumed were used.
No statistically significant differences were found between location in houses versus
business premises, as all p-values are above 0.05.
Therefore, the null hypotheses of no difference between location in houses versus
business premises with regard to the business environment factors cannot be rejected.

165
Although the differences are not statistically significant, it is evident that location in
houses has higher scores for factors Q12F1 (General business skills), Q12F2
(Networking and social media skills), Q14F1 (Customer demands and competitor
challenges), Q14F2 (Increased customer knowledge), Q15F1 (Satisfactory sources of
supply), Q17F2 (Socio-economic) and Q17F4 (Environmental).
Location in businesses premises has higher scores for factors Q15F2 (Supplier quality
and relationships), Q16F1 (Intermediary Impact), Q17F1 (Legal), and Q17F3
(Technological).
Differences between small and very small businesses regarding impact
of business environment factors
The third test was conducted to determine whether statistically significant differences
exist between small versus very small businesses, concerning the impact of the
business environment factors.
The hypotheses that were tested are:
H1: There is a statistically significant difference between small versus very small
businesses with regard to the impact of each of the business environment
factors.
H0: There is no statistically significant difference between small versus very small
businesses with regard to the impact of each of the business environment
factors.
The mean and standard deviation of the business environment impact per group were
as shown in Table 6.14 below.
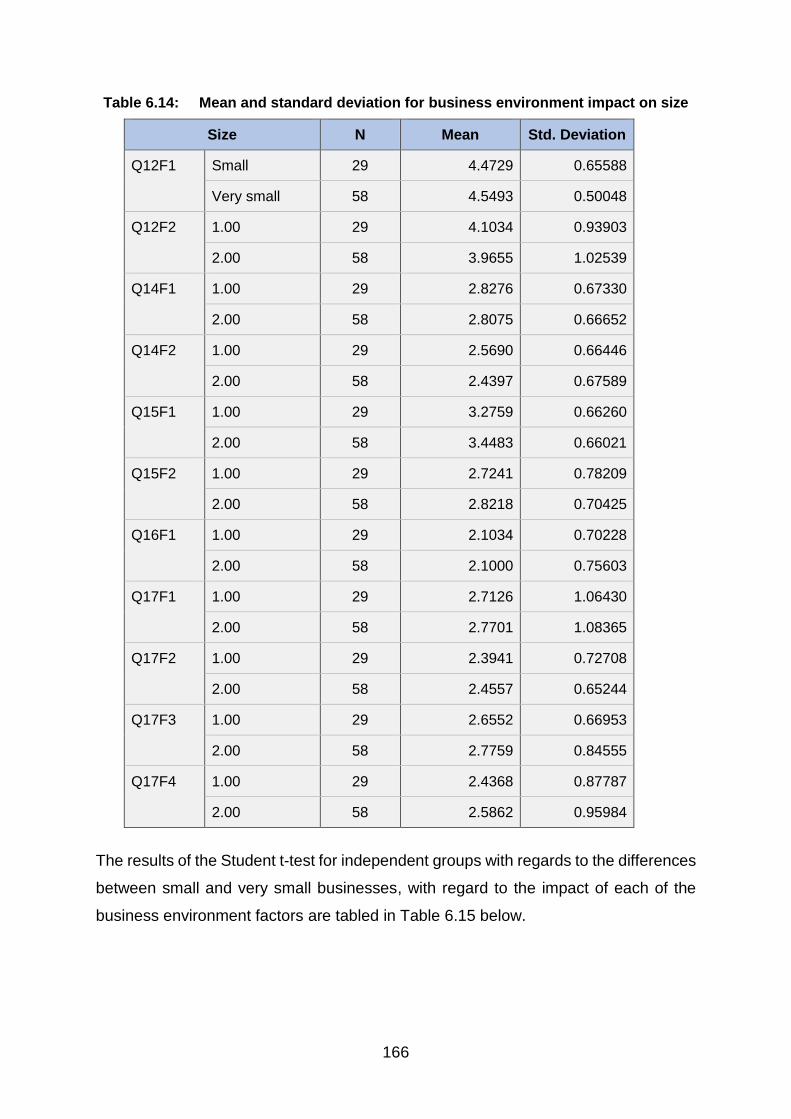
166
Table 6.14: Mean and standard deviation for business environment impact on size
Size N Mean Std. Deviation
Q12F1 Small 29 4.4729 0.65588
Very small 58 4.5493 0.50048
Q12F2 1.00 29 4.1034 0.93903
2.00 58 3.9655 1.02539
Q14F1 1.00 29 2.8276 0.67330
2.00 58 2.8075 0.66652
Q14F2 1.00 29 2.5690 0.66446
2.00 58 2.4397 0.67589
Q15F1 1.00 29 3.2759 0.66260
2.00 58 3.4483 0.66021
Q15F2 1.00 29 2.7241 0.78209
2.00 58 2.8218 0.70425
Q16F1 1.00 29 2.1034 0.70228
2.00 58 2.1000 0.75603
Q17F1 1.00 29 2.7126 1.06430
2.00 58 2.7701 1.08365
Q17F2 1.00 29 2.3941 0.72708
2.00 58 2.4557 0.65244
Q17F3 1.00 29 2.6552 0.66953
2.00 58 2.7759 0.84555
Q17F4 1.00 29 2.4368 0.87787
2.00 58 2.5862 0.95984
The results of the Student t-test for independent groups with regards to the differences
between small and very small businesses, with regard to the impact of each of the
business environment factors are tabled in Table 6.15 below.

167
Table 6.15: Student t-test: differences between small and very small businesses with regard to the impact of each of the business environment factors
Independent Samples Test
Levene's Test for Equality of
Variances
t-test for Equality of
Means
F Sig. t df Sig. (2-tailed)
Q12F1 Equal variances assumed
2.049 0.156 -0.603 85 0.548
Equal variances not assumed
-0.552 44.811 0.584
Q12F2 Equal variances assumed
0.352 0.554 0.608 85 0.545
Equal variances not assumed
0.626 60.735 0.534
Q14F1 Equal variances assumed
0.010 0.921 0.132 85 0.895
Equal variances not assumed
0.132 55.603 0.896
Q14F2 Equal variances assumed
0.047 0.829 0.846 85 0.400
Equal variances not assumed
0.851 56.975 0.398
Q15F1 Equal variances assumed
0.004 0.950 -1.147 85 0.255
Equal variances not assumed
-1.146 55.928 0.257
Q15F2 Equal variances assumed
0.094 0.761 -0.588 85 0.558
Equal variances not assumed
-0.567 51.174 0.573
Q16F1 Equal variances assumed
0.077 0.783 0.021 85 0.984
Equal variances not assumed
0.021 59.961 0.983
Q17F1 Equal variances assumed
0.228 0.634 -0.235 85 0.815
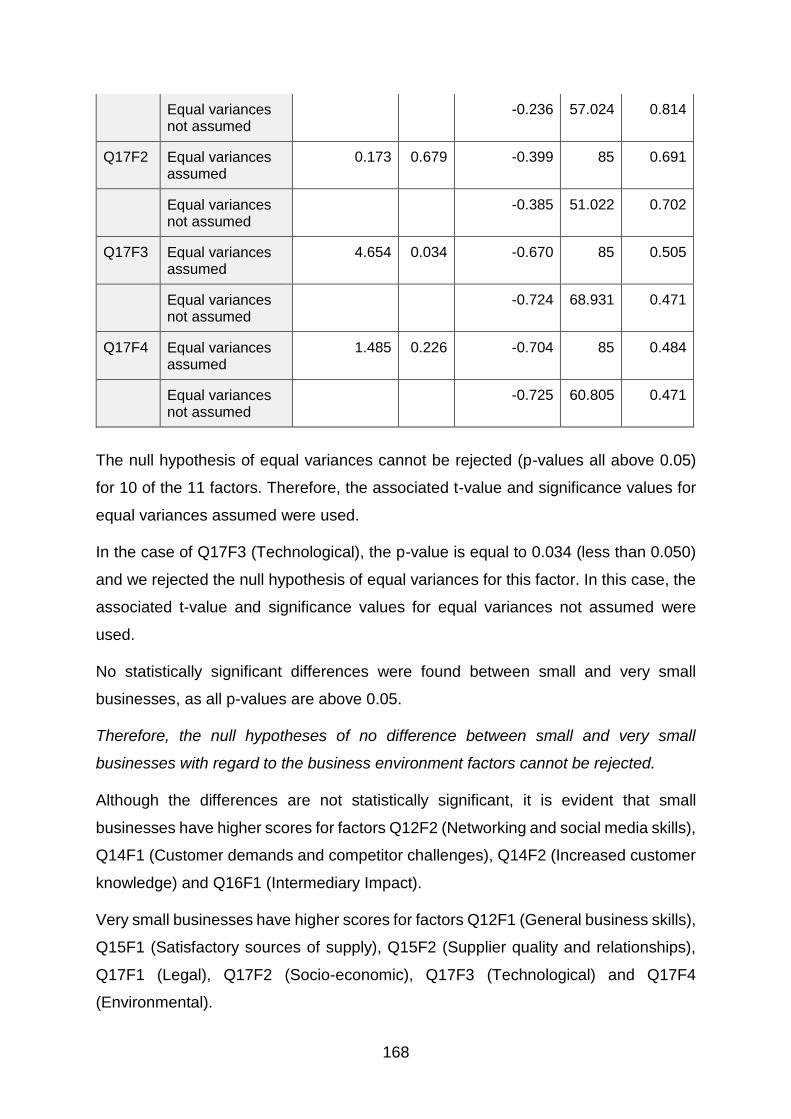
168
Equal variances not assumed
-0.236 57.024 0.814
Q17F2 Equal variances assumed
0.173 0.679 -0.399 85 0.691
Equal variances not assumed
-0.385 51.022 0.702
Q17F3 Equal variances assumed
4.654 0.034 -0.670 85 0.505
Equal variances not assumed
-0.724 68.931 0.471
Q17F4 Equal variances assumed
1.485 0.226 -0.704 85 0.484
Equal variances not assumed
-0.725 60.805 0.471
The null hypothesis of equal variances cannot be rejected (p-values all above 0.05)
for 10 of the 11 factors. Therefore, the associated t-value and significance values for
equal variances assumed were used.
In the case of Q17F3 (Technological), the p-value is equal to 0.034 (less than 0.050)
and we rejected the null hypothesis of equal variances for this factor. In this case, the
associated t-value and significance values for equal variances not assumed were
used.
No statistically significant differences were found between small and very small
businesses, as all p-values are above 0.05.
Therefore, the null hypotheses of no difference between small and very small
businesses with regard to the business environment factors cannot be rejected.
Although the differences are not statistically significant, it is evident that small
businesses have higher scores for factors Q12F2 (Networking and social media skills),
Q14F1 (Customer demands and competitor challenges), Q14F2 (Increased customer
knowledge) and Q16F1 (Intermediary Impact).
Very small businesses have higher scores for factors Q12F1 (General business skills),
Q15F1 (Satisfactory sources of supply), Q15F2 (Supplier quality and relationships),
Q17F1 (Legal), Q17F2 (Socio-economic), Q17F3 (Technological) and Q17F4
(Environmental).

169
Differences between businesses that have actively maintained websites
versus businesses that do not regarding impact of business environment
factors
The fourth test was conducted to determine whether statistically significant differences
exist between businesses that have actively maintained websites versus businesses
that do not, concerning the impact of the business environment factors.
The hypotheses that were tested are:
H1: There is a statistically significant difference between businesses that have actively
maintained websites versus businesses that do not with regard to the impact of
each of the business environment factors.
H0: There is no statistically significant difference between businesses that have
actively maintained websites versus businesses that do not with regard to the
impact of each of the business environment factors.
The mean and standard deviation of the business environment impact per group were
as shown in Table 6.16 below.
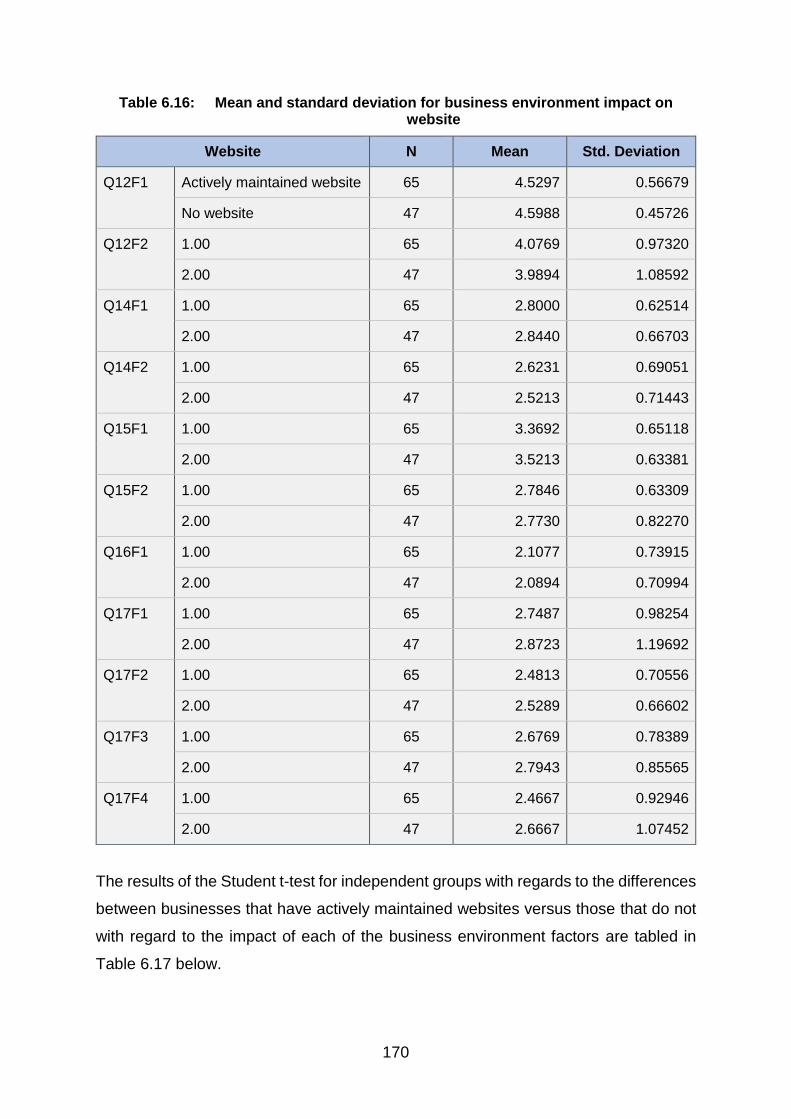
170
Table 6.16: Mean and standard deviation for business environment impact on website
Website N Mean Std. Deviation
Q12F1 Actively maintained website 65 4.5297 0.56679
No website 47 4.5988 0.45726
Q12F2 1.00 65 4.0769 0.97320
2.00 47 3.9894 1.08592
Q14F1 1.00 65 2.8000 0.62514
2.00 47 2.8440 0.66703
Q14F2 1.00 65 2.6231 0.69051
2.00 47 2.5213 0.71443
Q15F1 1.00 65 3.3692 0.65118
2.00 47 3.5213 0.63381
Q15F2 1.00 65 2.7846 0.63309
2.00 47 2.7730 0.82270
Q16F1 1.00 65 2.1077 0.73915
2.00 47 2.0894 0.70994
Q17F1 1.00 65 2.7487 0.98254
2.00 47 2.8723 1.19692
Q17F2 1.00 65 2.4813 0.70556
2.00 47 2.5289 0.66602
Q17F3 1.00 65 2.6769 0.78389
2.00 47 2.7943 0.85565
Q17F4 1.00 65 2.4667 0.92946
2.00 47 2.6667 1.07452
The results of the Student t-test for independent groups with regards to the differences
between businesses that have actively maintained websites versus those that do not
with regard to the impact of each of the business environment factors are tabled in
Table 6.17 below.

171
Table 6.17: Student t-test: differences between businesses that have actively maintained websites versus those that do not with regard to the impact of
each of the business environment factors
Independent Samples Test
Levene's test for equality of variances
t-test for Equality of
Means
F Sig. t df Sig.(2-tailed)
Q12F1 Equal variances assumed
2.054 0.155 -0.689 110 0.492
Equal variances not assumed
-0.713 108.623 0.477
Q12F2 Equal variances assumed
0.212 0.646 0.448 110 0.655
Equal variances not assumed
0.440 92.516 0.661
Q14F1 Equal variances assumed
0.051 0.821 -0.357 110 0.722
Equal variances not assumed
-0.353 95.343 0.725
Q14F2 Equal variances assumed
0.007 0.932 0.759 110 0.450
Equal variances not assumed
0.755 97.242 0.452
Q15F1 Equal variances assumed
0.340 0.561 -1.233 110 0.220
Equal variances not assumed
-1.239 100.808 0.218
Q15F2 Equal variances assumed
3.042 0.084 0.084 110 0.933
Equal variances not assumed
0.081 82.902 0.936
Q16F1 Equal variances assumed
0.118 0.731 0.132 110 0.895
Equal variances not assumed
0.133 101.536 0.895
Q17F1 Equal variances assumed
6.037 0.016 -0.599 110 0.550

172
Equal variances not assumed
-0.581 86.917 0.563
Q17F2 Equal variances assumed
0.115 0.735 -0.360 110 0.719
Equal variances not assumed
-0.364 102.455 0.717
Q17F3 Equal variances assumed
0.958 0.330 -0.753 110 0.453
Equal variances not assumed
-0.742 93.914 0.460
Q17F4 Equal variances assumed
3.526 0.063 -1.052 110 0.295
Equal variances not assumed
-1.028 90.251 0.307
The null hypothesis of equal variances cannot be rejected (p-values all above 0.05)
for 10 of the 11 factors. Therefore, the associated t-value and significance values for
equal variances assumed were used. In the case of Q17F1 (Legal), the p-value is
equal to 0.016 (less than 0.050) and we rejected the null hypothesis of equal variances
for this factor. In this case, the associated t-value and significance values for equal
variances not assumed were used.
No statistically significant differences were found between businesses with an actively
maintained website versus those who do not, as all p-values are above 0.05.
Therefore, the null hypotheses of no difference between businesses with an actively
maintained website versus those which do not, with regard to the business
environment factors cannot be rejected.
Although the differences are not statistically significant, it is evident that businesses
with active websites have higher scores for factors Q12F2 (Networking and social
media skills), Q14F2 (Increased customer knowledge), Q15F2 (Supplier quality and
relationships), and Q16F1 (Intermediary Impact).
Businesses with no active websites have higher scores for factors Q12F1 (General
business skills), Q14F1 (Customer demands and competitor challenges), Q15F1
(Satisfactory sources of supply), Q17F1 (Legal), Q17F2 (Socio-economic) and Q17F3
(Technological) and Q17F4 (Environmental).

173
In summary, the impact of the business environment factors are thus very similar for
both gender groups, whether a business is located in a house or business premises,
whether they are small or very small businesses, and whether they have an actively
maintained website or not.
6.6 CATEGORICAL PRINCIPAL COMPONENT ANALYSIS OF
QUESTION 13
The Categorical Principal Component Analysis (CATPCA) was used to analyse the
items of Question 13 that are related to the specific functional areas in the business.
The data collected from this question was analysed separately due to the different
format of the responses (namely, yes, no and sometimes) if compared to questions
12, 14, 15, 16 and 17 in the questionnaire. Question 13 focuses on the absence or
presence of various functional areas and resources in the micro environment of the
caterers, such as marketing, operations and human resources.
The analysis identified three dimensions which explain 48.26% of the variance. These
are depicted in Table 6.18 below. Only the highest component loading for each item
in the relevant dimension is shown.

174
Table 6.18: Component loadings: Functional areas and resources
Component 1 Component 2 Component 3
A marketing strategy .577
A strategy to determine customers’ needs (e.g. assessing various trends in society which influence customers’ needs)
.537
A unique selling point/targets a specific niche market (specific group of customers) .565
Continual monitoring of customer satisfaction (feedback, sales figures, etc.) .341
A good reputation .383
Online services .397
Systems for receiving, storage, preparation and assembly of food, and for clearing and cleaning
.677
Control of materials and production processes .756
Adherences to regulations and bargaining councils (labour rates) relating to SMMICs in Cape Town
.628
Adequate skilled labour .536
Loyal and committed employees .563
Adequate financial resources, such as strong cash flow, low debt levels and good credit-rating
.516
Collection of information about suppliers, such as their reputation, knowledge of their products, their stock lists and their pricing policies
.630.
Good transportation vehicles .605

175
The components are labelled Operational areas and Labour matters (C1), Customer-
focused strategies (C2), and Financial and Transportation resources (C3), due to the
items loaded highest on that dimension.
Component variables, based on the transformed variables created through the
CATPCA, were subsequently calculated. Further analyses were confined to these
three variables. This commences with determining the nature of the variables below.
Component descriptives
Table 6.19 provides the descriptive information for the three component variables. The
descriptive information consists of the mean, median, standard deviation, skewness
and kurtosis for each variable.
Table 6.19: Variable descriptives
C1 C2 C3
N Valid 112 112 112
Missing 0 0 0
Mean 0,0000 0,0000 0,0000
Median 0,2927 -0,0280 0,4027
Std. Deviation 0,65758 0,57185 0,81063
Skewness -2,072 -1,079 -2,371
Kurtosis 4,171 2,584 5,092
Minimum -2,71 -2,45 -2,99
Maximum 0,47 0,77 0,40
Although the variables display levels of skewness and kurtosis that are above the
acknowledged thresholds to assume normality, it is not an assumption needed for the
Student t-test or the non-parametric Kruskal-Wallis test.
Relationship analysis
Inferential statistics were done to determine the relationship between the three micro
environmental components. A correlation analysis was undertaken to provide an
understanding of the strength and direction of the relationships between the three
components that were previously identified. Pearson correlation coefficient tests

176
enabled an understanding of the interrelationships between each pair of factors. The
results are summarised in Table 6.20.
Table 6.20: Pearson Correlation Coefficients
C1 C2 C3
C1 Pearson Correlation 1 .252** .285**
Sig. (2-tailed) .007 .002
N 112 112 112
C2 Pearson Correlation .252** 1 .086
Sig. (2-tailed) .007 .369
N 112 112 112
C3 Pearson Correlation .285** .086 1
Sig. (2-tailed) .002 .369
N 112 112 112
**. Correlation is significant at the 0.01 level (2-tailed).
These are interpreted according to the thresholds of below 0.3 as small, between 0.3
and 0.5 as moderate, and 0.5 and above as large (direction of relationship can be
positive or negative).
None of the components displayed moderate or large relationships, as all the Pearson
correlation coefficients are below 0.3.
Difference testing
The next set of inferential analysis was conducted to firstly, determine if statistically
significant differences exist with regard to the three functional dimensions and the
different age groups, and also between the different roles or positions of the owners/
managers.
6.6.3.1 Differences between the age groups and roles/positions of the
owners/managers regarding existence of three functional dimensions
The hypotheses that were tested are:
H1:1: Differences exist concerning the functional dimensions
H1A.1 between the age groups of the owners/managers

177
H1B.1 between the role/position groups
H1:0: Differences do not exist concerning the functional dimensions
H1A.0 between the age groups of the owners/managers
H1B.0 between the role/position groups
The first hypothesis regarding the age groups of the owners/managers was tested,
and the results are shown in Table 6.21 below.
Table 6.21: Kruskal-Wallis test for age
C1 C2 C3
Kruskal-Wallis H 5.734 4.397 8.708
Df 3 3 3
Asymp. Sig. .125 .222 .033
a. Kruskal Wallis Test
b. Grouping Variable: age_4g
The results indicate that there is no statistically significant difference, at the 5% level
of significance, between the age groups, as the p-values are above 0.1 for the first
component, Operational areas and Labour matters (C1), as well as for the second
component, Customer-focused strategies (C2). For the third component, Financial and
Transportation resources (C3), there is a statistically significant difference at the 5%
level of significance (p=0.033) between the age groups. From the mean ranks it is
evident that the oldest age group (51 years and older), tends to have more of these
resources in place than the younger groups (mean rank = 69.67 vs a mean rank range
of between 48.86 and 57.54). See Table 105 in Appendix E.
Thus the null hypothesis for the age groups of the owners/managers, regarding the
Financial and Transportation resources, can be rejected.
The second hypothesis, regarding the functional dimensions and the role or position
of the owners/managers, was tested and the results are shown in Table 6.22 below.

178
Table 6.22: Kruskal-Wallis test for role/position
C1 C2 C3
Kruskal-Wallis H 7.515 3.531 9.346
df 2 2 2
Asymp. Sig. .023 .171 .009
a. Kruskal Wallis Test
b. Grouping Variable: owner_3g
The results indicate that there are statistically significant differences at the 5% and 1%
level of significance, respectively, regarding Operational areas and Labour matters
(C1) and Financial and Transportation resources (C3) between the role or position of
the owners/managers (p-values of .023 and .009).
Regarding Operational areas and Labour matters (C1), it is evident that the full-time
managers with insight into the strategic planning of the business tend to have more of
these resources in place than the owners, or the owners who are full-time managers
(mean rank = 77.21 vs mean rank range of 50.90 and 57.06 respectively). See Table
106 in Appendix E.
Regarding Financial and Transportation resources (C3), it is evident that the full-time
managers with insight into the strategic planning of the business tend to have more of
these resources in place than the owners, or the owners who are full-time managers
(mean rank = 69.71 vs mean rank of 61.13 and 45.92, respectively). See Table 106 in
Appendix E.
For the second component, Customer-focused strategies (C2), there was no
statistically significant difference at the 5% level of significance (p-value above .01)
between the role or position of the owners/managers.
Thus, the null hypothesis for the roles or positions of the owners/managers can be
rejected regarding Operational areas and Labour matters (C1) and Financial and
Transportation resources (C3).
Inferential analysis was conducted, secondly, to determine if statistically significant
differences exist in terms of the functional dimensions between the groups with regard
to website, gender, business location and size. The Student t-test for independent
groups was used.
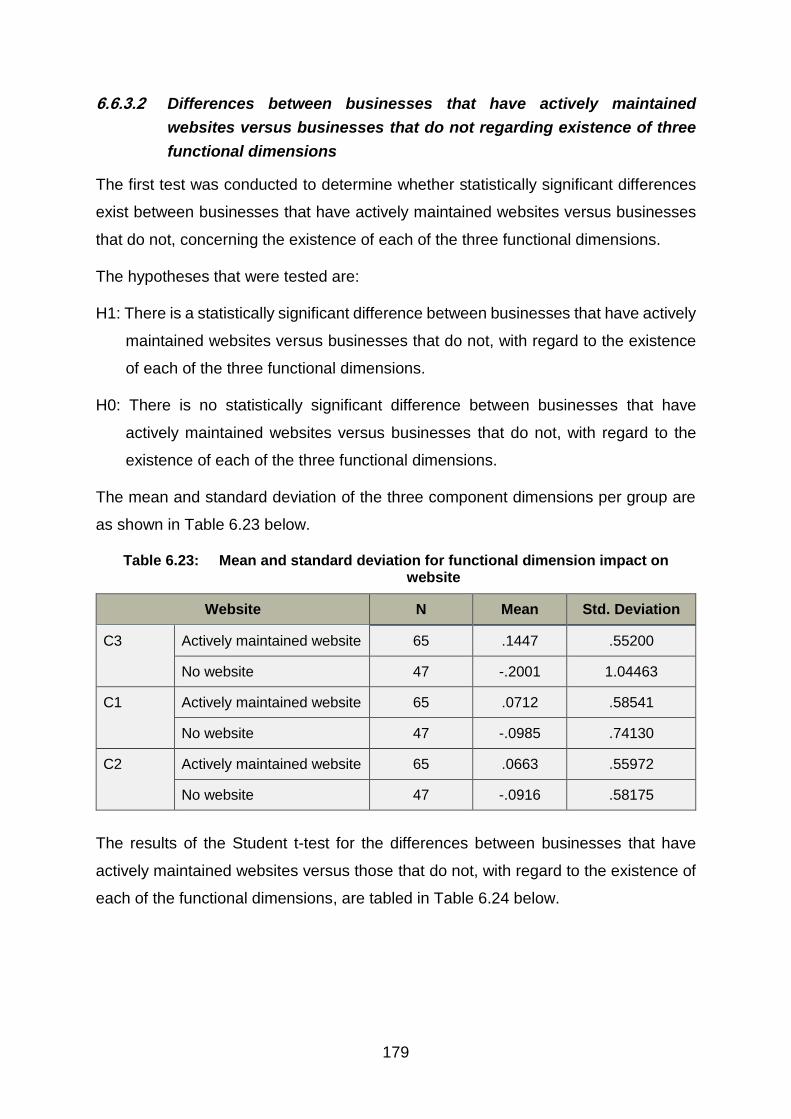
179
6.6.3.2 Differences between businesses that have actively maintained
websites versus businesses that do not regarding existence of three
functional dimensions
The first test was conducted to determine whether statistically significant differences
exist between businesses that have actively maintained websites versus businesses
that do not, concerning the existence of each of the three functional dimensions.
The hypotheses that were tested are:
H1: There is a statistically significant difference between businesses that have actively
maintained websites versus businesses that do not, with regard to the existence
of each of the three functional dimensions.
H0: There is no statistically significant difference between businesses that have
actively maintained websites versus businesses that do not, with regard to the
existence of each of the three functional dimensions.
The mean and standard deviation of the three component dimensions per group are
as shown in Table 6.23 below.
Table 6.23: Mean and standard deviation for functional dimension impact on website
Website N Mean Std. Deviation
C3 Actively maintained website 65 .1447 .55200
No website 47 -.2001 1.04463
C1 Actively maintained website 65 .0712 .58541
No website 47 -.0985 .74130
C2 Actively maintained website 65 .0663 .55972
No website 47 -.0916 .58175
The results of the Student t-test for the differences between businesses that have
actively maintained websites versus those that do not, with regard to the existence of
each of the functional dimensions, are tabled in Table 6.24 below.

180
Table 6.24: Student t-test: differences between businesses that have actively maintained websites versus those that do not with regard to the existence
of each of the functional dimensions
Independent Samples Test
Levene's test for equality of variances
t-test for Equality of
Means
F Sig. t df Sig. (2-tailed)
C3 Equal variances assumed
19.281 .000 2.262 110 .026
Equal variances not assumed
2.063 64.558 .043
C1 Equal variances assumed
1.006 .318 1.353 110 .179
Equal variances not assumed
1.303 84.491 .196
C2 Equal variances assumed
.211 .647 1.449 110 .150
Equal variances not assumed
1.440 96.965 .153
The null hypothesis of equal variances cannot be rejected (p-values all above 0.05)
for two of the three dimensions. Therefore, the associated t-value and significance
values for equal variances assumed were used. In the case of Financial and
Transportation resources (C3), the p-value was equal to 0.000 (less than 0.050), and
we rejected the null hypothesis of equal variances for this functional dimension. In this
case, the associated t-value and significance values for equal variances not assumed
were used.
Statistically significant differences, at the 5% level of significance, were found between
businesses that have actively maintained websites versus those that do not, with
regard to Financial and Transportation resources (C3), (p-value < 0.05).
Therefore, the null hypotheses of no difference between businesses that have an
actively maintained website versus those that do not, with regard to Financial and
Transportation resources (C3) can be rejected.

181
6.6.3.3 Differences between males and females regarding existence of three
functional dimensions
The second test was conducted to determine whether statistically significant
differences exist between males and females concerning the existence of each of the
three functional dimensions.
The hypotheses that were tested are:
H1: There is a statistically significant difference between the males and females with
regard to the existence of each of the three functional dimensions.
H0: There is no statistically significant difference between the males and females with
regard to the existence of each of the three functional dimensions.
The mean and standard deviation of the three component dimensions per group are
as shown in Table 6.25 below.
Table 6.25: Mean and standard deviation for functional dimension impact per gender group
Gender N Mean Std. Deviation
C3 Male 45 .0365 .74205
Female 67 -.0245 .85821
C1 Male 45 .1434 .43274
Female 67 -.0963 .76089
C2 Male 45 -.0017 .57554
Female 67 .0012 .57370
The results of the Student t-test for the differences between males and females with
regard to the existence of each of the three functional dimensions are tabled in Table
6.26 below.

182
Table 6.26: Student t-test: differences between males and females with regard to the existence of each of the three functional dimensions
Independent Samples Test
Levene's test for equality of variances
t-test for equality of
means
F Sig. t df Sig. (2-tailed)
C3 Equal variances assumed
.863 .355 .389 110 .698
Equal variances not assumed
.401 103.097 .689
C1 Equal variances assumed
9.087 .003 1.914 110 .058
Equal variances not assumed
2.118 107.484 .036
C2 Equal variances assumed
.005 .944 -.026 110 .979
Equal variances not assumed
.979
The null hypothesis of equal variances cannot be rejected (p-values all above 0.05)
for two of the three functional dimensions. Therefore, the associated t-value and
significance values for equal variances assumed were used. In the case of Operational
areas and Labour matters (C1), the p-value was equal to 0.003 (less than 0.050), and
we rejected the null hypothesis of equal variances for this functional dimension. In this
case, the associated t-value and significance values for equal variances not assumed
were used.
Statistically significant differences, at the 5% level of significance, were found between
males versus females with regard to Operational areas and Labour matters (C1), (p-
value < 0.05).
Therefore, the null hypotheses of no difference between the males and females with
regard to Operational areas and Labour matters (C1) can be rejected.

183
6.6.3.4 Differences between businesses located in houses versus business
premises regarding existence of three functional dimensions
The third test was conducted to determine whether statistically significant differences
exist between businesses located in houses versus business premises concerning the
existence of each of the three functional dimensions.
The hypotheses that were tested are:
H1: There is a statistically significant difference between businesses located in houses
versus business premises concerning the existence of each of the three functional
dimensions.
H0: There is no statistically significant difference between businesses located in
houses versus business premises concerning the existence of each of the three
functional dimensions.
The mean and standard deviation of the three component dimensions per group are
as shown in Table 6.27 below.
Table 6.27: Mean and standard deviation for functional dimension impact on location
LOCATION N Mean Std. Deviation
C3 Houses 64 -.1191 .90455
Business Premises 48 .1588 .64040
C1 Houses 64 -.0985 .70834
Business Premises 48 .1314 .56376
C2 Houses 64 -.0263 .58501
Business Premises 48 .0350 .55800
The results of the Student t-test for the differences between businesses located in
houses versus business premises concerning the existence of each of the three
functional dimensions are tabled in Table 6.28 below.

184
Table 6.28: Student t-test: differences between businesses located in houses versus business premises concerning the existence of each of the three
functional dimensions.
Independent Samples Test
Levene's test for equality of variances
t-test for equality of
means
F Sig. t df Sig.(2-tailed)
C3 Equal variances assumed
12.004 .001 -1.813 110 .072
Equal variances not assumed
-1.902 109.681 .060
C1 Equal variances assumed
2.417 .123 -1.851 110 .067
Equal variances not assumed
-1.912 109.581 .059
C2 Equal variances assumed
.008 .927 -.560 110 .577
Equal variances not assumed
-.564 103.803 .574
The null hypothesis of equal variances cannot be rejected (p-values all above 0.05)
for two of the three functional dimensions. Therefore, the associated t-value and
significance values for equal variances assumed were used. In the case of Financial
and Transportation resources (C3), the p-value was equal to 0.001 (less than 0.050),
and we rejected the null hypothesis of equal variances for this functional dimension.
In this case, the associated t-value and significance values for equal variances not
assumed were used.
Statistically significant differences, at the 10% level of significance, were found
between businesses located in houses versus those located in business premises with
regard to Financial and Transportation resources (C3), (p value < 0.10).
Therefore, the null hypotheses of no difference between businesses located in houses
versus business premises with regard to Financial and Transportation resources (C3)
can be rejected.

185
Statistically significant differences were also found, at the 10% level of significance,
between businesses located in houses versus those located in business premises with
regard to Operational areas and Labour matters (C1), (p value < 0.10).
Therefore, the null hypotheses of no difference between businesses located in houses
versus business premises with regard to Operational areas and Labour matters (C1)
can be rejected.
6.6.3.5 Differences between small and very small businesses regarding
existence of three functional dimensions
The fourth test was conducted to determine whether statistically significant differences
exist between small versus very small businesses concerning the existence of each
of the three functional dimensions.
The hypotheses that were tested are:
H1: There is a statistically significant difference between small versus very small
businesses concerning the existence of each of the three functional dimensions.
H0: There is no statistically significant difference between small versus very small
businesses concerning the existence of each of the three functional dimensions.
The mean and standard deviation of the three component dimensions per group are
as shown in Table 6.29 below.
Table 6.29: Mean and standard deviation for functional dimension impact on size
SIZE N Mean Std. Deviation
C3 Small 29 .0668 .82811
Very small 58 .0143 .77544
C1 Small 29 .1514 .53986
Very small 58 -.0833 .73409
C2 Small 29 .1732 .46533
Very small 58 -.0525 .65892
The results of the Student t-test for the differences between small and very small
businesses with regard to the existence of each of the three functional dimensions are
tabled in Table 6.30 below.

186
Table 6.30: Student t-test: differences between small and very small businesses with regard to the existence of each of the three functional dimensions
Independent Samples Test
Levene's test for
equality of variances
t-test for equality of
means
F Sig. t df Sig. (2-tailed)
C3 Equal variances assumed
.023 .880 .291 85 .772
Equal variances not assumed
.285 52.935 .777
C1 Equal variances assumed
2.660 .107 1.526 85 .131
Equal variances not assumed
1.688 73.039 .096
C2 Equal variances assumed
1.254 .266 1.648 85 .103
Equal variances not assumed
1.846 75.171 .069
The null hypothesis of equal variances cannot be rejected (p-values all above 0.05)
for all of the three functional dimensions, as in all three cases the p-values are greater
than 0.050.
No statistically significant differences were found between small and very small
businesses with regard to all three functional dimensions (p-value < 0.05).
Therefore, the null hypothesis that there is no statistically significant difference
between small versus very small businesses concerning the existence of each of the
three functional dimensions cannot be rejected.
6.7 SUMMARY OF THE FINDINGS
The findings in the survey regarding the inferential analyses are summarised in Table
6.31 below.

187
Table 6.31: Summary of the findings
MAIN FINDINGS
Questions 12, 14, 15, 16, 17
RELATIONSHIP ANALYSIS
Moderate relationships (between 0.3 and 0.5) exist between:
General business skills, and Networking and social media skills Q12F1 and Q12F2
Between Customer demands and competitor challenges and Increased customer knowledge
Q14F1 and Q14F2
Customer demands and competitor challenges and Legal Q14F1 and Q17F1
Between Customer demands and competitor challenges and Socio-economic
Q14F1 and Q17F2
Customer demands and competitor challenges and Technological Q14F1 and Q17F3
Increased Customer knowledge and Socio-economic Q14F2 and Q17F2
Increased Customer knowledge and Environmental Q14F2 and Q17F4
Intermediary impact and Legal Q16F1 and Q17F1
Intermediary impact and Socio-economic Q16F1 and Q17F2
Legal and Socio-economic Q17F1 and Q17F2
Legal and Technological Q17F1 and Q17F3
Socio-economic and Technological Q17F2 and Q17F3
Technological and Environmental Q17F3 and Q17F4
Positive strong relationships (0.5 and above) exist between:
Legal and Environmental Q17F1 and Q17F4
Socio-economic and Environmental Q17F2 and Q17F4
DIFFERENCE TESTING
The objective was to determine if statistically significant differences exist between the different age groups and also between the different roles or positions of the owners/ managers with regard to the business environment factors. The non-parametric Kruskal-Wallis one-way analysis of variance by ranks was used to test the hypotheses.
Hypotheses:
H1:1: Differences exist concerning the business environment factors
H1A.1 between the age groups of the owners/managers
H1:0: Differences do not exist concerning the business environment factors
H1A.0 between the age groups of the owners/managers

188
The results indicate that there is a statistically significant difference, at the 5% level of significance, between the age groups with regard to General business skills (Q12F1) and the macro environmental factor, Legal (Q17F1).
None of the other factors show statistically significant differences.
Furthermore, the mean ranks indicate that the younger age groups (18 to 40 years) tend to possess Networking and social media skills more than the older (41 years and older) groups.
Regarding the Legal factor (Q17F1), the mean ranks indicate that two age groups (18 to 30 years and 41 to 50 years) tend to experience the impact of regulations more often than the other two age groups (31 to 40 and 51 plus).
Thus the null hypothesis for the age groups of the owners/managers can be rejected for the General business skills and the Legal macro environmental factor.
Hypothesis:
H1:1: Differences exist concerning the business environment factors
H1B.1 between the role/position groups
H1:0: Differences do not exist concerning the business environment factors
H1B.0 between the role/position groups
The results indicate that there is a statistically significant difference, at the 10% level of significance, between the role or position of the owners/managers with regard to Increased customer knowledge (Q14F2).
None of the other factors show statistically significant differences.
The mean ranks indicate that the owners who are also full-time managers tend to experience increased customer knowledge more often than the owners.
Thus the null hypothesis for the roles or positions of the owners/managers can be rejected for the Increased customer knowledge factor.
Inferential analysis was also conducted to determine if statistically significant differences exist with regard to the business environment factors between the groups as defined by the categories of gender, business location, size, and website variables.
The Student t-test for independent groups was used to determine the statistical significance of the differences between these groups. A 5% level of significance was used.
Hypotheses:
H1: There is a statistically significant difference between the males and females with regard to the impact of each of the business environment factors.
H0: There is no statistically significant difference between the males and females with regard to the impact of each of the business environment factors.
No statistically significant differences were found between males and females.
Although the differences are not statistically significant, it is evident that males have higher scores for the following factors:
Q12F1 (General business skills),
Q12F2 (Networking and social media skills),
Q14F2 (Increased customer knowledge),
Q16F1 (Intermediary impact), and
Q17F4 (Environmental).

189
While females have higher scores for the following factors:
Q14F1 (Customer demands and competitor challenges),
Q15F1 (Satisfactory sources of supply),
Q15F2 (Supplier quality and relationships),
Q17F1 (Legal), Q17F2 (Socio-economic), and
Q17F3 (Technological).
Hypotheses:
H1: There is a statistically significant difference between businesses located in houses versus business premises with regard to the impact of each of the business environment factors.
H0: There is no statistically significant difference between the businesses located in houses versus business premises with regard to the impact of each of the business environment factors.
No statistically significant differences were found between locations in houses versus business premises. Although the differences are not statistically significant, it is evident that location in houses has higher scores for the following factors:
Q12F1 (General business skills),
Q12F2 (Networking and social media skills),
Q14F1 (Customer demands and competitor challenges),
Q14F2 (Increased customer knowledge),
Q15F1 (Satisfactory sources of supply),
Q17F2 (Socio-economic) and
Q17F4 (Environmental).
While location in businesses premises has higher scores for factors:
Q15F2 (Supplier quality and relationships),
Q16F1 (Intermediary impact),
Q17F1 (Legal) and
Q17F3 (Technological).
Hypotheses:
H1: There is a statistically significant difference between small versus very small businesses with regard to the impact of each of the business environment factors.
H0: There is no statistically significant difference between small versus very small businesses with regard to the impact of each of the business environment factors.
No statistical significant differences were found between small and very small businesses. Although the differences are not statistically significant, it is evident that small businesses have higher scores for the following factors:
Q12F2 (Networking and social media skills),
Q14F1 (Customer demands and competitor challenges),
Q14F2 (Increased customer knowledge), and
Q16F1 (Intermediary impact).
While very small businesses have higher scores for the following factors:
Q12F1 (General business skills),
Q15F1 (Satisfactory sources of supply),

190
Q15F2 (Supplier quality and relationships),
Q17F1 (Legal),
Q17F2 (Socio-economic),
Q17F3 (Technological), and
Q17F4 (Environmental).
Hypotheses:
H1: There is a statistically significant difference between businesses that have actively maintained websites versus businesses that do not with regard to the impact of each of the business environment factors.
H0: There is no statistically significant difference between businesses that have actively maintained websites versus businesses that do not with regard to the impact of each of the business environment factors.
No statistically significant differences were found between businesses that have an actively maintained website versus those that do not. Although the differences are not statistically significant, it is evident that businesses with active websites have higher scores for the following factors:
Q12F2 (Networking and social media skills),
Q14F2 (Increased customer knowledge),
Q15F2 (Supplier quality and relationships), and
Q16F1 (Intermediary impact).
While businesses with no active websites have higher scores for the following factors:
Q12F1 (General business skills),
Q14F1 (Customer demands and competitor challenges),
Q15F1 (Satisfactory sources of supply),
Q17F1 (Legal), Q17F2 (Socio-economic),
Q17F3 (Technological), and
Q17F4 (Environmental).
In summary, the impact of the business environment factors are very similar for both gender groups, whether the business is located in a house or business premises, whether they are small or very small businesses, and whether they have an actively maintained website or not.
Question 13: CATPCA (Categorical Principal Component Analysis)
Question 13 focused on the presence or absence of various functional areas and resources in the micro environment of the caterers, such as marketing, operations and human resources. The components identified are Operational areas and Labour matters (C1), Customer-focused strategies (C2), and Financial and Transportation resources (C3), due to the items loaded highest on that dimension.
RELATIONSHIP ANALYSIS
None of the components displayed moderate or large relationships, as all the Pearson correlation coefficients are below 0.3.
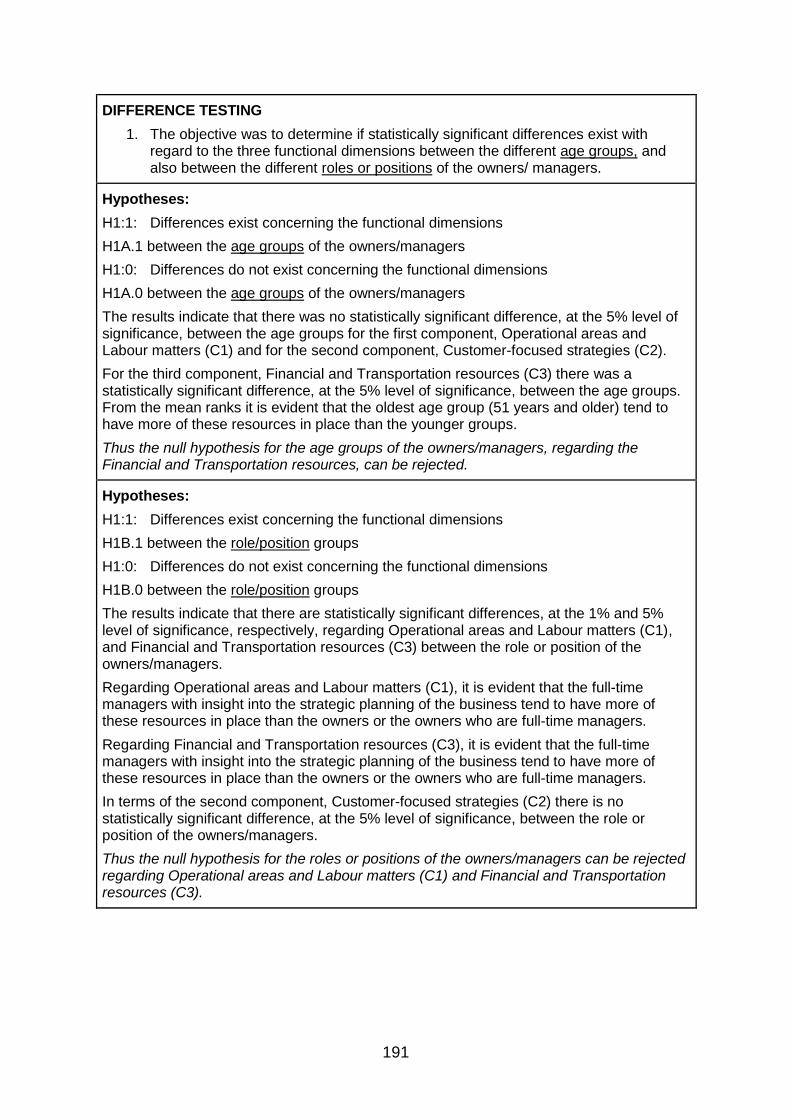
191
DIFFERENCE TESTING
1. The objective was to determine if statistically significant differences exist with regard to the three functional dimensions between the different age groups, and also between the different roles or positions of the owners/ managers.
Hypotheses:
H1:1: Differences exist concerning the functional dimensions
H1A.1 between the age groups of the owners/managers
H1:0: Differences do not exist concerning the functional dimensions
H1A.0 between the age groups of the owners/managers
The results indicate that there was no statistically significant difference, at the 5% level of significance, between the age groups for the first component, Operational areas and Labour matters (C1) and for the second component, Customer-focused strategies (C2).
For the third component, Financial and Transportation resources (C3) there was a statistically significant difference, at the 5% level of significance, between the age groups. From the mean ranks it is evident that the oldest age group (51 years and older) tend to have more of these resources in place than the younger groups.
Thus the null hypothesis for the age groups of the owners/managers, regarding the Financial and Transportation resources, can be rejected.
Hypotheses:
H1:1: Differences exist concerning the functional dimensions
H1B.1 between the role/position groups
H1:0: Differences do not exist concerning the functional dimensions
H1B.0 between the role/position groups
The results indicate that there are statistically significant differences, at the 1% and 5% level of significance, respectively, regarding Operational areas and Labour matters (C1), and Financial and Transportation resources (C3) between the role or position of the owners/managers.
Regarding Operational areas and Labour matters (C1), it is evident that the full-time managers with insight into the strategic planning of the business tend to have more of these resources in place than the owners or the owners who are full-time managers.
Regarding Financial and Transportation resources (C3), it is evident that the full-time managers with insight into the strategic planning of the business tend to have more of these resources in place than the owners or the owners who are full-time managers.
In terms of the second component, Customer-focused strategies (C2) there is no statistically significant difference, at the 5% level of significance, between the role or position of the owners/managers.
Thus the null hypothesis for the roles or positions of the owners/managers can be rejected regarding Operational areas and Labour matters (C1) and Financial and Transportation resources (C3).
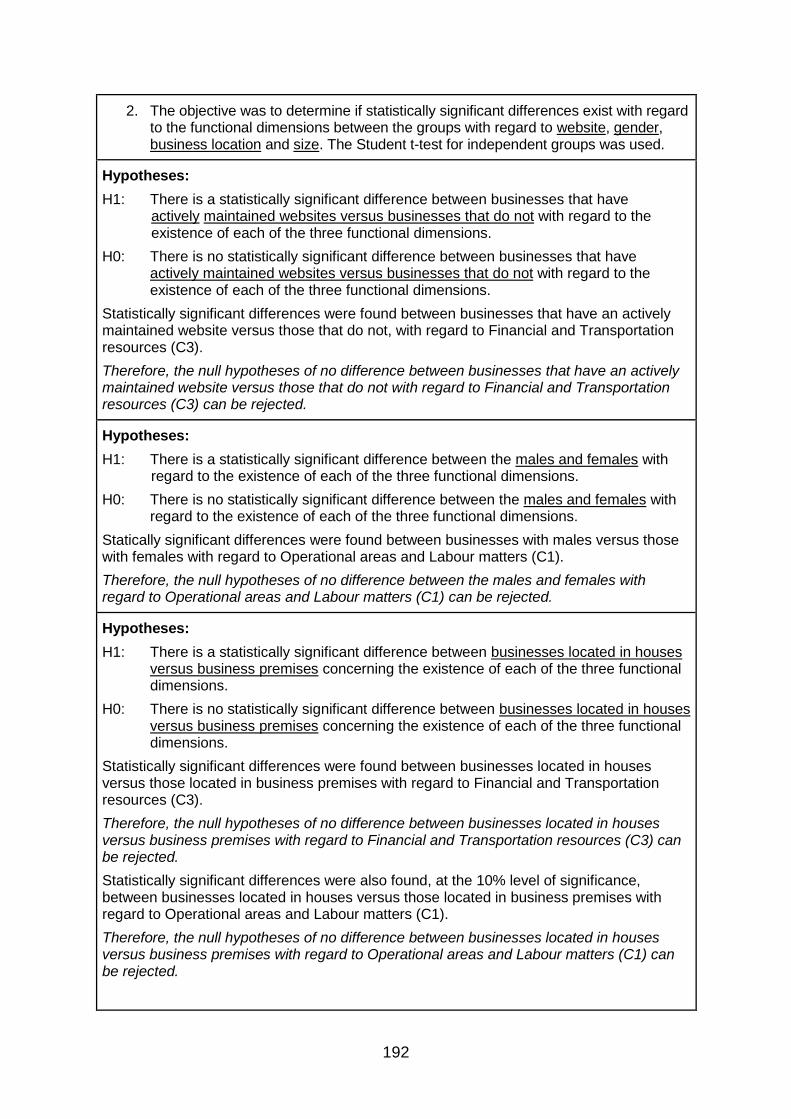
192
2. The objective was to determine if statistically significant differences exist with regard to the functional dimensions between the groups with regard to website, gender, business location and size. The Student t-test for independent groups was used.
Hypotheses:
H1: There is a statistically significant difference between businesses that have actively maintained websites versus businesses that do not with regard to the existence of each of the three functional dimensions.
H0: There is no statistically significant difference between businesses that have actively maintained websites versus businesses that do not with regard to the existence of each of the three functional dimensions.
Statistically significant differences were found between businesses that have an actively maintained website versus those that do not, with regard to Financial and Transportation resources (C3).
Therefore, the null hypotheses of no difference between businesses that have an actively maintained website versus those that do not with regard to Financial and Transportation resources (C3) can be rejected.
Hypotheses:
H1: There is a statistically significant difference between the males and females with regard to the existence of each of the three functional dimensions.
H0: There is no statistically significant difference between the males and females with regard to the existence of each of the three functional dimensions.
Statically significant differences were found between businesses with males versus those with females with regard to Operational areas and Labour matters (C1).
Therefore, the null hypotheses of no difference between the males and females with regard to Operational areas and Labour matters (C1) can be rejected.
Hypotheses:
H1: There is a statistically significant difference between businesses located in houses versus business premises concerning the existence of each of the three functional dimensions.
H0: There is no statistically significant difference between businesses located in houses versus business premises concerning the existence of each of the three functional dimensions.
Statistically significant differences were found between businesses located in houses versus those located in business premises with regard to Financial and Transportation resources (C3).
Therefore, the null hypotheses of no difference between businesses located in houses versus business premises with regard to Financial and Transportation resources (C3) can be rejected.
Statistically significant differences were also found, at the 10% level of significance, between businesses located in houses versus those located in business premises with regard to Operational areas and Labour matters (C1).
Therefore, the null hypotheses of no difference between businesses located in houses versus business premises with regard to Operational areas and Labour matters (C1) can be rejected.

193
Hypotheses:
H1: There is a statistically significant difference between small versus very small businesses concerning the existence of each of the three functional dimensions.
H0: There is no statistically significant difference between small versus very small businesses concerning the existence of each of the three functional dimensions.
No statistically significant differences were found between small and very small businesses with regard to all three functional dimensions.
Therefore, the null hypothesis that there is no statistically significant difference between small versus very small businesses concerning the existence of each of the three functional dimensions cannot be rejected.
The table above depicts the main findings of the survey with regard to the inferential
analysis. These findings, along with the findings in relation to the descriptive analysis,
will be utilised in the next chapter as a basis for the findings and conclusions of the
research.
6.8 CONCLUSION
In this chapter, use was made of inferential analysis to assess the results of the survey
by determining relationships and differences between various variables. The main
findings of the inferential analysis were summarised in a table at the end of the chapter.
The next chapter, Chapter 7, focuses on the final conclusions that will address the
main aims and objectives of the research. Various recommendations are also made
based on these conclusions.

194
CHAPTER 7:
CONCLUSIONS AND RECOMMENDATIONS
7.1 INTRODUCTION
In Chapters 5 and 6 the results and analysis of the research regarding the business
environment of small, medium and micro independent caterers (SMMICs) in Cape
Town were discussed. In Chapter 7, the research project is concluded. It commences
with a review of the research aim and objectives, after which the main findings are
outlined, conclusions are drawn, and recommendations are made. The limitations of
the study are also addressed and suggestions for further research are offered. A final
conclusion is then presented.
7.2 ADDRESSING THE RESEARCH AIM AND OBJECTIVES
The primary objective of this research study is to determine the impact of the business
environment on SMMICs in Cape Town. Based on the three components which make
up the business environment, the secondary objectives of the research are the
following:
To analyse the micro environment of SMMICs in Cape Town.
To analyse the market environment of SMMICs in Cape Town.
To analyse the macro environment of SMMICs in Cape Town.
To identify the strengths, weaknesses, opportunities and threats (SWOT) in the
business environment of SMMICs in Cape Town.
To determine the relationships between the micro, macro and market business
environment factors and functional dimensions, respectively
To determine if differences exist between the categories of different demographic
and company variables with regard to the business environment factors and
functional dimensions.
Chapters 2 and 3 analysed the micro, market and macro components. The analysis of
the micro environment focused on the vision, mission and objectives of the business,
the managerial qualities of the manager or owner, the functional areas in the business

195
(for example, marketing, operations, staffing and finance), and on the resources of the
business.
The analysis of the market environment focused on the customers, competitors,
suppliers and intermediaries of the business, while the macro environment focused on
socio-cultural, technological, economic, political-legal, physical, and international
factors. In addition, based on the replies of the respondents, the strengths and
weaknesses in the micro environment, and the opportunities and threats in the market
and macro environments of the SMMICs were determined.
A descriptive study was selected as the research process to investigate the primary
and secondary objectives. A questionnaire was designed and administered via an
online survey. The questions were related to firmographic details of the SMMICs,
demographic information of the respondents, and the micro, market and macro
environments of the SMMICs. Further details of the research methodology were
provided in Chapter 4.
The collected data was analysed using descriptive statistics (Chapter 5) and inferential
statistics (Chapter 6). The main findings were also summarised in those chapters. In
Chapter 7, the focus is on the conclusions that can be drawn and recommendations
that can be made, based on the findings of the study.
7.3 FINDINGS, CONCLUSIONS AND RECOMMENDATIONS BASED
ON THE ANALYSIS OF THE RESEARCH
The main findings with regard to the firmographic profile of the SMMICs and the
demographic profile of the respondents are outlined below. The key findings in respect
of the micro, market and macro environments of the SMMICs are subsequently
discussed, and relevant conclusions drawn and recommendations made, based on
the findings.
Firmographic profile of the SMMICs
The main findings with regard to the firmographic profile of the SMMICs are presented
in Table 7.1 below. The information in the majority category is emphasised, while the
secondary category is included for extra information.

196
Table 7.1: Firmographic profile of the SMMICs
Variable Majority category
Main Trend
Secondary Category
Secondary Trend
Locations 55 ____ ____ ____
Premises Homes 57.1% Business premises 42.9%
Number of years in operation
5 - 12 years 35.7% 1 – 4 years 34.8%
Forms of promotion Facebook 85.7% Actively maintained websites
58.%
Size Very small 53.2% Small 26.6%
Number of Employees Part-time employees
7.1 (mean) Seasonal employees
5.1 (mean)
Members of an association
None 89.3% SA Chefs
Other
4.5%
4.5%
Contribution (%) to revenue (type of catering)
Social catering 52.3% (mean)
Business catering 48.2% (mean)
Contribution (%) to revenue (venue)
Off-premise 52.9% (mean)
On premise 47.1% (mean)
Contribution (%) to revenue (type of event)
Midscale events
44.8% (mean)
Budget events 30.2% (mean)
As can be seen from the table, the SMMICs are located in 55 locations (towns or
suburbs). The majority have their business located in their homes (57.1%) and have
been in operation for between five to twelve years (35.7%). Most use Facebook as a
form of promotion (85.7%). Most are very small (53.2%), have more part-time
employees than full-time or seasonal employees (mean of 7.1), and do not belong to
any organisation (89.3%). The biggest contributions to revenue come from social
catering (mean of 52.3%), from off-premise catering (mean of 52.9%), and from
midscale events (mean of 44.8%).
Demographic profile of the respondents
The demographic profile of the respondents is presented in Table 7.2 below. The
information in the majority category is emphasised, while the secondary category is
included for extra information.
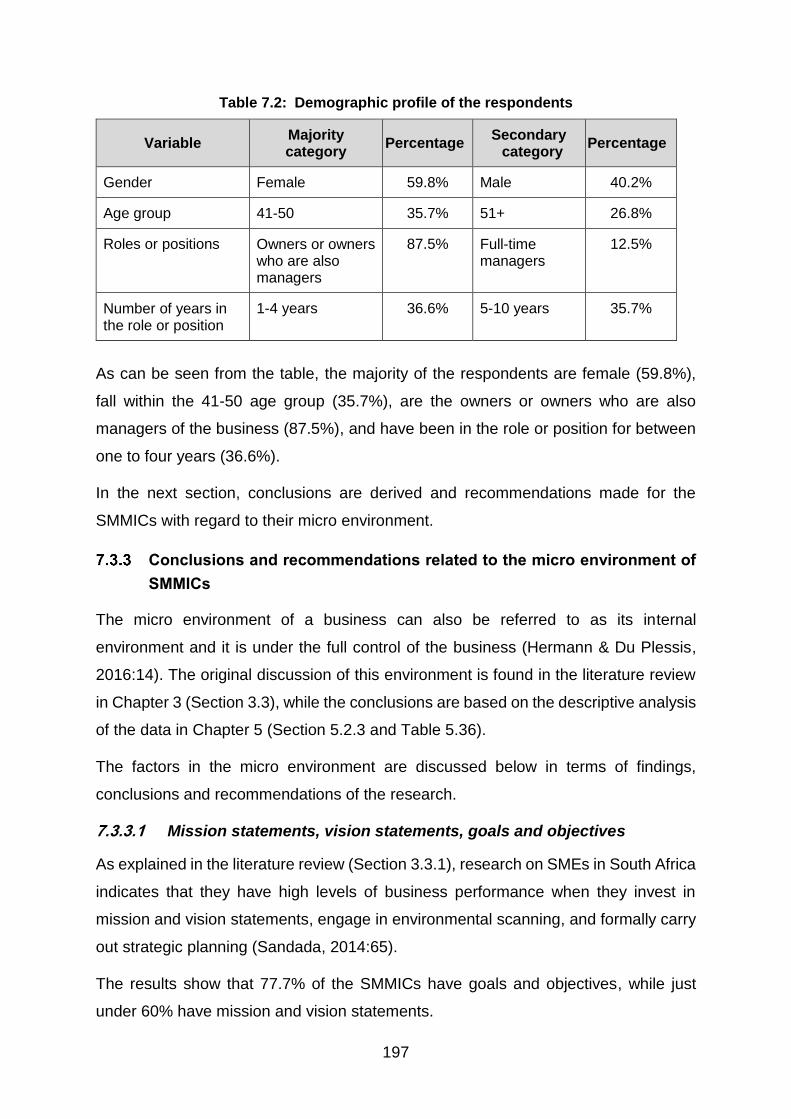
197
Table 7.2: Demographic profile of the respondents
Variable Majority category
Percentage Secondary
category Percentage
Gender Female 59.8% Male 40.2%
Age group 41-50 35.7% 51+ 26.8%
Roles or positions Owners or owners who are also managers
87.5% Full-time managers
12.5%
Number of years in the role or position
1-4 years 36.6% 5-10 years 35.7%
As can be seen from the table, the majority of the respondents are female (59.8%),
fall within the 41-50 age group (35.7%), are the owners or owners who are also
managers of the business (87.5%), and have been in the role or position for between
one to four years (36.6%).
In the next section, conclusions are derived and recommendations made for the
SMMICs with regard to their micro environment.
Conclusions and recommendations related to the micro environment of
SMMICs
The micro environment of a business can also be referred to as its internal
environment and it is under the full control of the business (Hermann & Du Plessis,
2016:14). The original discussion of this environment is found in the literature review
in Chapter 3 (Section 3.3), while the conclusions are based on the descriptive analysis
of the data in Chapter 5 (Section 5.2.3 and Table 5.36).
The factors in the micro environment are discussed below in terms of findings,
conclusions and recommendations of the research.
7.3.3.1 Mission statements, vision statements, goals and objectives
As explained in the literature review (Section 3.3.1), research on SMEs in South Africa
indicates that they have high levels of business performance when they invest in
mission and vision statements, engage in environmental scanning, and formally carry
out strategic planning (Sandada, 2014:65).
The results show that 77.7% of the SMMICs have goals and objectives, while just
under 60% have mission and vision statements.

198
Conclusions and recommendations:
These somewhat lower than expected figures, especially regarding mission and
vision statements, indicate that a fair number of SMMICs may not be operating at
optimum performance, since they would not display the needed focus and direction
that mission and vision statements and also goals and objectives provide.
It is recommended that all owners/managers of SMMICs devote time to draw up
goals and objectives and mission and vision statements. These should be revisited
annually to take into account changes which occur in the business environment.
7.3.3.2 Qualities of the owner or manager
The respondents were asked to indicate the extent to which they exhibit the various
skills that owners/managers of SMMICs typically have, according to Mattel (2016:5),
as indicated in Section 3.3.2.1.
The main findings are:
The following skills were rated quite highly (80% and more of respondents
answered ‘often’ and ‘always’):
– Knowledge of ingredients used in food,
– Leadership skills,
– Organisational skills,
– Time-management skills,
– Ability to manage stress, and
– Negotiating skills.
Two skills rated comparatively lower were:
– Knowledge of social media use (70.5%), and
– Networking skills (67.8%).
As noted in Section 3.3.2.1, networking is listed as one of the qualities of a successful
caterer (Mattel, 2016:5).

199
Conclusions and recommendations:
Regarding social media, it appears that, although 85.7% of the SMMICs are
represented on Facebook, some owners/managers may have knowledge, financial
or time constraints in utilising additional forms of social media in promoting to, and
interacting with customers. The same could apply to networking.
It is recommended that more owners/managers investigate and implement, if
applicable, various other forms of social media (for example, Instagram, Pinterest
and Twitter) in interacting and networking with customers.
Local networking can be improved by, for example, linking up with other service
providers in the area, by giving donations in the community, and by actively seeking
referrals locally.
7.3.3.3 Functional areas and resources of the business
The respondents were asked whether various functional areas and resources are
present in their businesses.
The main findings are:
The following areas received high ratings (80% and more of respondents
answered ‘yes’ or ‘sometimes’):
– A good reputation,
– Control of materials and production processes,
– Systems for receiving, storage, preparation, assembly of food, clearing,
cleaning, and
– Monitoring of customer satisfaction.
Responses of between 70% and 80% were indicated for:
– Loyal and committed employees,
– Good transportation vehicles,
– Adherence to regulations and bargaining councils (labour rates) relating to
SMMICs in Cape Town,
– Sufficient knowledge of suppliers, and

200
– Possession of adequate skilled labour.
Rated progressively lower (60% and less) were:
– Adequate financial resources,
– Strategy to determine customers’ needs,
– Unique selling point or targeting a specific niche market,
– Marketing strategy, and
– Online services.
Conclusions and recommendations:
While many of the ratings can be considered satisfactory, it appears that some of
the SMMICs have challenges (and thus weaknesses), particularly in the areas of
finance, marketing and online services.
Recommendations for these latter areas are:
It is recommended that all areas pertaining to finances be examined, especially
with regard to budgeting, costs, invoicing, cash flow and accounting practices.
Recommendations with regard to marketing initiatives include conducting
surveys to determine customers’ wants and needs, and investigating ways in
which to satisfy them.
Attempts could be made to create a unique selling point or niche market, for
example, innovating traditional dishes, creating special desserts, targeting
children with special menus, or fulfilling special dietary requests with
appetising dishes.
Formal marketing strategies could be developed by doing market research,
identifying target markets, developing relevant products and services and
distribution methods, and setting up promotional campaigns.
Since business transactions and services are moving progressively online,
more attention could be paid to ways of utilising online services, such as
increasing the use of social media, by setting up or regularly updating websites
and blogs, and by having customers order or make reservations online.
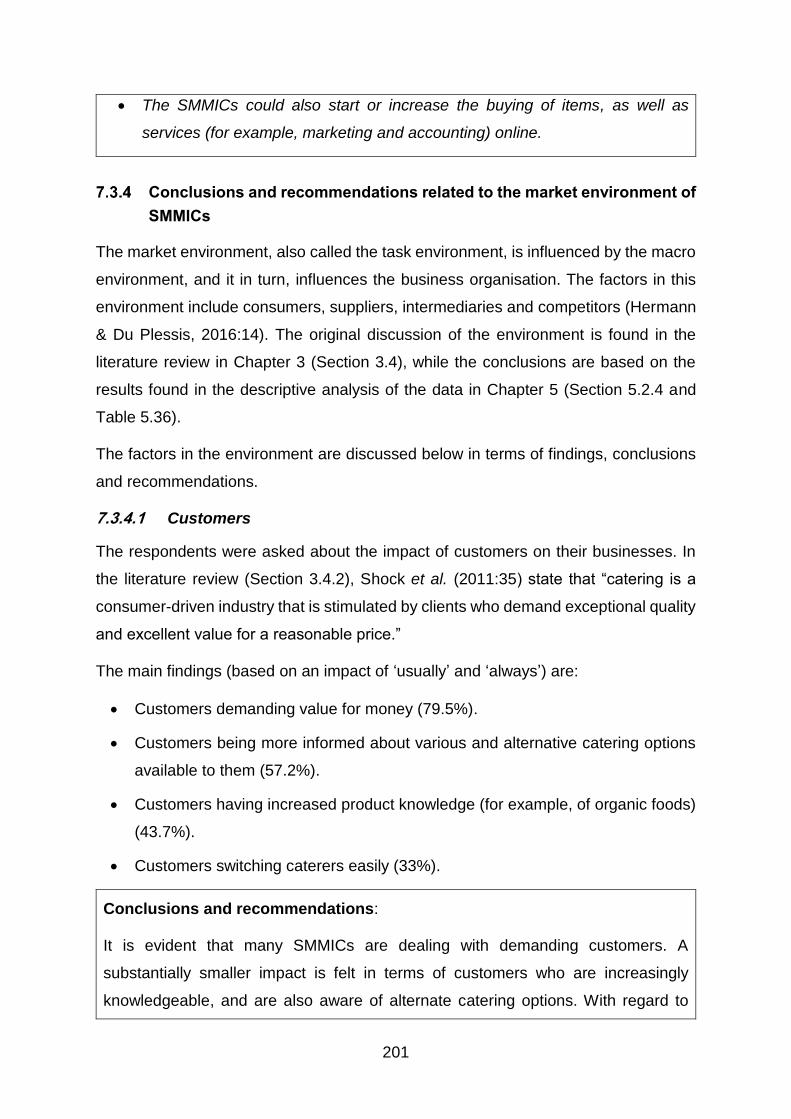
201
The SMMICs could also start or increase the buying of items, as well as
services (for example, marketing and accounting) online.
Conclusions and recommendations related to the market environment of
SMMICs
The market environment, also called the task environment, is influenced by the macro
environment, and it in turn, influences the business organisation. The factors in this
environment include consumers, suppliers, intermediaries and competitors (Hermann
& Du Plessis, 2016:14). The original discussion of the environment is found in the
literature review in Chapter 3 (Section 3.4), while the conclusions are based on the
results found in the descriptive analysis of the data in Chapter 5 (Section 5.2.4 and
Table 5.36).
The factors in the environment are discussed below in terms of findings, conclusions
and recommendations.
7.3.4.1 Customers
The respondents were asked about the impact of customers on their businesses. In
the literature review (Section 3.4.2), Shock et al. (2011:35) state that “catering is a
consumer-driven industry that is stimulated by clients who demand exceptional quality
and excellent value for a reasonable price.”
The main findings (based on an impact of ‘usually’ and ‘always’) are:
Customers demanding value for money (79.5%).
Customers being more informed about various and alternative catering options
available to them (57.2%).
Customers having increased product knowledge (for example, of organic foods)
(43.7%).
Customers switching caterers easily (33%).
Conclusions and recommendations:
It is evident that many SMMICs are dealing with demanding customers. A
substantially smaller impact is felt in terms of customers who are increasingly
knowledgeable, and are also aware of alternate catering options. With regard to

202
customers switching caterers, it appears that although some SMMICs are confident
of their skills in retaining customers, the majority recognise that customer loyalty can
change.
It is recommended that an effort be made to understand exactly what customers’
wants, needs and demands are, and how best they can be satisfied. While the
simplest approach is friendly service and well-prepared food, other areas of focus
could be those regarding pricing, convenience, speed, quality, customisation, and
healthier menu options incorporating organic foods, natural ingredients, food quality
and food sourcing.
Further considerations could be innovative menus, superior customer service, novel
food presentation and unusual marketing and promotional activities.
7.3.4.2 Competition
The respondents were asked about the impact of competitors on their businesses. The
questions are largely based on Michael Porter’s Five Forces model (Burns, 2011:146),
as explained in the literature review (Section 3.4.3). The weaker the forces, the better
the chance for the business to survive and perform well.
The main findings (based on an impact of ‘usually’ and ‘always’) are:
New competitors (caterers) continually appearing in the market (68.75%).
New types of competition or competitive substitute products continually arising
(60.7%).
A high degree of rivalry existing among existing competitors (46.4%).
The extent to which SMMICs monitor their competitors, such as their pricing,
menu items and services offered (58%).
Conclusions and recommendations:
It appears that the majority of the SMMICs experience competition to some degree
and in various ways. It is also evident that many of them monitor their competitors
to some extent.

203
Recommendations with regard to responding to competition, include developing
innovative menus, investing in superior customer relations and service, offering
lower pricing, offering extras, providing quality food, and using various promotional
and networking strategies.
Suggestions for monitoring competitors include inspecting their websites, blogs and
social media for their menus, prices, products, services, photographs, interactions
with customers, and feedback and comments received.
7.3.4.3 Suppliers
The respondents were asked about the impact of suppliers on their businesses. It is
noted in the literature review (Section 3.4.4), that caterers and food suppliers need to
develop good working relationships and understanding of each other’s responsibilities,
with particular attention paid to price, delivery and quality or standards (Foskett et al.,
2016:247; Mattel, 2016:34).
The main findings (based on an impact of ‘usually’ and ‘always’) are:
Good working relationships and understanding of each other’s responsibilities
with regard to their food suppliers (91.1%).
Attention that their suppliers pay to quality or standards (84.8%).
A good and reasonably priced supply in Cape Town of food and beverage
products (76.8%), catering equipment (64.3%) and catering IT systems (47.4%).
Conclusions and recommendations:
It is evident that the performance of suppliers is seen as satisfactory. With regard to
a good and reasonably priced supply in Cape Town, satisfaction levels appear to be
the highest for food and beverage products, and less so regarding catering
equipment and catering IT systems.
It is recommended that further improvement in supplier relations be pursued by
maintaining good communication channels, making payments timeously, being
clear about requirements, giving timely feedback, and by showing appreciation.
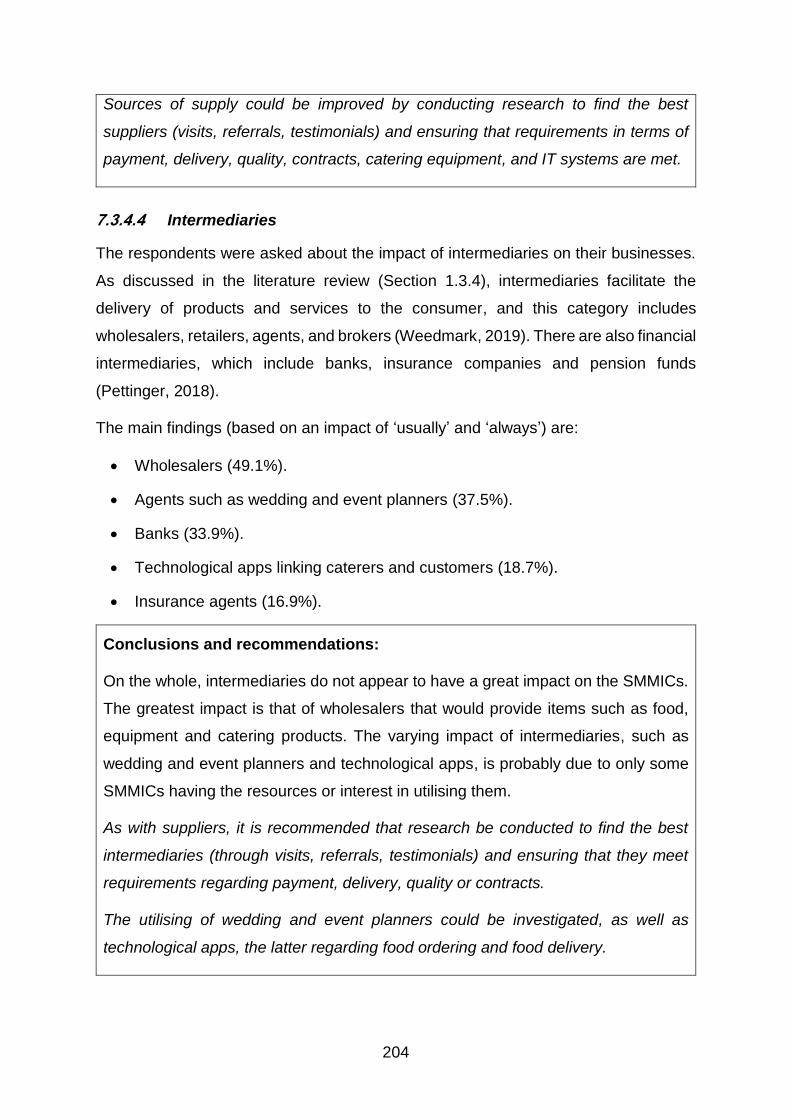
204
Sources of supply could be improved by conducting research to find the best
suppliers (visits, referrals, testimonials) and ensuring that requirements in terms of
payment, delivery, quality, contracts, catering equipment, and IT systems are met.
7.3.4.4 Intermediaries
The respondents were asked about the impact of intermediaries on their businesses.
As discussed in the literature review (Section 1.3.4), intermediaries facilitate the
delivery of products and services to the consumer, and this category includes
wholesalers, retailers, agents, and brokers (Weedmark, 2019). There are also financial
intermediaries, which include banks, insurance companies and pension funds
(Pettinger, 2018).
The main findings (based on an impact of ‘usually’ and ‘always’) are:
Wholesalers (49.1%).
Agents such as wedding and event planners (37.5%).
Banks (33.9%).
Technological apps linking caterers and customers (18.7%).
Insurance agents (16.9%).
Conclusions and recommendations:
On the whole, intermediaries do not appear to have a great impact on the SMMICs.
The greatest impact is that of wholesalers that would provide items such as food,
equipment and catering products. The varying impact of intermediaries, such as
wedding and event planners and technological apps, is probably due to only some
SMMICs having the resources or interest in utilising them.
As with suppliers, it is recommended that research be conducted to find the best
intermediaries (through visits, referrals, testimonials) and ensuring that they meet
requirements regarding payment, delivery, quality or contracts.
The utilising of wedding and event planners could be investigated, as well as
technological apps, the latter regarding food ordering and food delivery.

205
In the next section, conclusions are derived and recommendations made for the
SMMICs with regard to their macro environment.
Conclusions and recommendations related to the macro environment of
SMMICs
The pertinent forces in the macro environment are socio-cultural forces, technological
forces, economic forces, political forces, statutory forces, environmental forces and
international forces (Botha, 2018:38). The original discussion of this environment is
found in the literature review in Chapter 3 (Section 3.5), while the conclusions are
based on the descriptive analysis of the data in Chapter 5 (Section 5.2.5 and Table
5.36).
The factors in the macro environment of SMMICs are discussed below with regard to
findings, conclusions and recommendations.
7.3.5.1 Socio-cultural factors
The impacts of the socio-cultural factors on the SMMICs are shown below. As
explained in the literature review (Section 3.5.2), the socio-cultural environment refers
to various trends in society which affect the needs of consumers, as well as their
buying decisions. Examples of these trends are lifestyles, demographics and values
and behaviours (Cant & Van Heerden, 2018:50).
The main findings (based on an impact of ‘usually’ and ‘always’) are:
The trend toward more healthful eating/use of organic products/vegetarianism
(41%).
Less time available for food preparation by consumers (40.2%).
Demographical changes, such as the increase in smaller families and increase
in double income households (25.9%).
Conclusions and recommendations:
Although less than half of the respondents indicated this, it could be that the trends
of healthful eating and less time available for food preparation by consumers are
gaining momentum and will increase in future. Demographical changes appear to
have lesser impact currently but show signs of having some effect on the SMMICs.

206
It is recommended that preparation be made for greater demand for healthful foods
(less fat, sugar, oil and salt) and also the inclusion of more menu items which are
plant-based, vegetarian, vegan, organic or gluten-free. Regarding the two other
trends, various options such as home-cooked, frozen, ready-made or pre-packaged
meals could be explored.
7.3.5.2 Technological factors
The impacts of the technological factors on the SMMICs are shown below. As
indicated in the literature review (Section 3.5.3), technological progress has had a
great impact on organisations with regard to their products and services, their
customers, suppliers, competitors and marketing and manufacturing practices (David
& David, 2015:236).
The main findings (based on an impact of ‘usually’ and ‘always’) are:
The effects of the internet (e.g. new ideas and catering opportunities, faster
speed in sourcing food products) (71.5%).
Easy access to the internet, mobile apps and social media by consumers
(62.5%).
Technological changes in catering software (39.3%).
Conclusions and recommendations:
With the focus of technological change being the internet and social media, it is
evident that these have a substantial influence on the majority of the SMMICs.
Catering software does not seem to have as great an impact, indicating that not as
many SMMICs may be making use of this option.
It is recommended that ways of gaining the maximum benefit of the internet be
explored. This could include, for example, setting up promotional and
interactive activities on various social media, such as Facebook, Twitter,
YouTube, Instagram and Pinterest.
The internet can also be used for websites, food blogs, catering blogs, cooking
videos, nutritional videos, and for gathering information on catering and food
trends.

207
In addition, it can be used for doing business online, such as taking bookings
or orders, receiving and making payments, and for purchasing various goods
and services.
7.3.5.3 Economic factors
The impacts of the economic factors on the SMMICs are shown below. As indicated
in the literature review (Section 3.5.4), various variables such as inflation, interest
rates, and the state of the economy affect the disposable income of consumers, as
well as their buying behaviour (Botha, 2018:39).
The main findings (based on an impact of ‘usually’ and ‘always’) are:
The current state of the economy (66.1%).
The economic impact of the water scarcity in Cape Town (60.7%).
Consumers’ unemployment levels and/or diminished disposable income
(38.4%).
Conclusions and recommendations:
It is evident that about two thirds of the SMMICs are affected strongly by the
economy and water scarcity (at the time of the study), while close to a third feel
some impact. The lower figures regarding the impact of unemployment levels and/or
diminished disposable income by consumers could indicate that consumers are
willing to pay for a catered function, regardless of cost, or that they look for lower
price options within the various offerings of SMMICs for the function.
Economic fluctuations can be fairly severe, such as those experienced due to
loadshedding, and especially, the current situation due to COVID-19 (although
this was not present during the period when data was collected for the study).
Various options can be explored, such as diversifying offerings (for example,
pre-packaged or frozen meals) and searching for new or different markets (for
example, pre-event celebratory functions for matriculants at their homes).
Good finance strategies should also be in place, for example, sales goals
budgets, expense budgets and cash flow plans.

208
7.3.5.4 Physical factors
The impacts of physical factors on the SMMICs are shown below. The physical
environment includes the natural resources found in nature (Hermann & Du Plessis,
2016:14), as well as issues relating to sustainability (Davis et al., 2018:101). From the
literature review (Section 3.5.5) it can be seen that all caterers need to be aware of
changes taking place in the physical environment on a macro scale, as well as on a
micro level.
The main findings (based on an impact of ‘usually’ and ‘always’) are:
The trend in presenting businesses as ‘caring for the environment’ (50.9%).
The trends in energy conservation (49.1%).
The trends in waste management and recycling (45.5%).
Conclusions and recommendations:
In terms of all three trends, it appears that about only half of the SMMICs are directly
affected by these trends. The results also show that under a third of the respondents
(30%) are only occasionally affected, and about a fifth (20%) not at all. For the latter,
this could be due to a lack of interest or knowledge on their part.
It is recommended that all the SMMICs commit to the environmental sustainability
of natural resources. This could include limiting the use of plastic and throwaway
packaging for foods, using water sparingly, preparing food more efficiently, reducing
food wastage, and investing in energy-efficient equipment, where possible.
They could also actively communicate their concern for the environment and
advertise that they have put or are putting in place some of the measures above.
7.3.5.5 Political-legal factors
The impact of political-legal factors, as depicted by certain legislation and regulations,
on the SMMICs is shown below. As can be seen from the literature review (Section
3.5.6) there are a number of regulations applicable to food-based businesses. These
include regulations governing food safety, general hygiene requirements for food
premises, the transport of food, and legislation regarding employment contracts,
licencing and taxation laws (Neves, 2014; City of Cape Town, 2019c).

209
The main findings (based on an impact of ‘usually’ and ‘always’) are:
Regulations relating to food hygiene (for example, licencing and certification of
all food preparation facilities) (67%).
Legislation relating to labour issues (for example, health and safety at work)
(58.1%).
Regulations applying to transport of food (53.5%).
Conclusions and recommendations:
It appears that substantial numbers of the SMMICs do not feel the impact of the
regulations, while some do only occasionally. This could be due to lack of knowledge
or lack of interest in the financial implications of compliance.
It is recommended that all the SMMICs ensure that they are informed about the
relevant regulations and legislation affecting their industry and operations and that
they comply with them.
7.3.5.6 International factors
The impact of international factors on the SMMICs is shown below. International
factors, as explained in the literature review (Section 3.5.7), especially globalisation
have resulted in new products and opportunities for businesses (Erixon, 2019).
Customers also learn about the foods and beverages of other countries through their
travels, which could have an influence on their demands (Bowe & Buttle, 2013:21).
The main findings (based on an impact of ‘usually’ and ‘always’) are:
The latest catering trends in the international media (43.7%).
Customers gaining knowledge through international travel of other countries’
foods and beverages (41.1%).
Conclusions and recommendations:
These trends appear to have a limited impact on the SMMICs.
However, it is recommended that international trends be checked regularly and
incorporated, where feasible. These include new ideas on plant-based meals,

210
cuisine from other countries, alternative ingredients, food presentation, service,
sustainable food packaging, and catering equipment and software.
In the next section, the findings, conclusions and recommendations based on the
open-ended question are discussed.
Conclusions and recommendations related to the open-ended question
The respondents were asked to write down any other factors that currently have a
significant impact on their businesses. It is noted that 59.6% of the respondents did
not answer this question. The findings are:
The majority of the responses were related to the macro environment,
specifically economic (17%), physical (8.9%), and political-legal (6.3%) factors.
Answers included the impact of price increases in electricity, the increases in the
cost of food ingredients, the water scarcity in Cape Town, and meeting complex
government procedures for compliance.
The next highest group of responses related to the market environment,
specifically the impact of customers (8%) and competition (2.7%). The answers
included some customers insisting on dealing with Halaal certified caterers only,
the rise of many similar types of catering businesses, and some restaurants
offering catering services.
Within the micro environment (6.3%), the respondents noted various problems,
such as inadequate equipment, inadequate stock control systems, staffing
problems and a lack of resources.
Conclusions and recommendations:
It is evident that SMMICs face a variety of challenges in the business environment,
some of which may be experienced by all (for example, price increases in electricity),
while others may be unique to a particular SMMIC.
As a considerable number of the responses above overlap with responses given in
the closed questions regarding the three environments, many of the
recommendations given earlier could be applied here.

211
Conclusions and recommendations for questions 12, 13, 14, 15, 16, 17
By factor-analysing the responses to questions 12 relating to the micro environment,
questions 14, 15, and 16 relating to the market environment, and question 17 relating
to the macro environment (44 items in total, for the purpose of data reduction), 11
business environment factors were identified. These 11 factors were used in
subsequent inferential analysis, and conclusions were reached and recommendations
made.
Question 13 was analysed separately due to the different format of the responses
(namely, ‘yes’, ‘no’ and ‘sometimes’). The question focused on the presence or
absence of various functional areas and resources in the micro environment of the
caterers (for example, marketing, operations and human resources). By analysing the
responses to question 13 through utilising firstly, the Categorical Principal Component
Analysis (CATPCA), three functional dimensions or components were identified.
These three dimensions, labelled as Operational areas and Labour matters,
Customer-focused strategies, and Financial and Transportation resources, were used
in subsequent inferential analysis, and conclusions were reached and
recommendations made.
7.3.7.1 Relationship analysis: Pearson correlation coefficients
The direction and strength of the relationships between the micro, macro and market
business environment factors, as well as the three areas and resources dimension,
were determined by means of correlation analysis, and provide insight into the extent
to which these factors and dimensions, respectively, have an impact on each other.
With regard to the business environment factors, the findings were:
Positive (an increase in one variable is associated with an increase in another
variable) strong and moderate relationships, as indicated by the value of the
correlation coefficient were seen to exist.
With regard to positive strong relationships (0.5 and above), the Legal,
Environmental and Socio-economic variables were relevant, and show how
strongly these three areas have an impact on each other.
With regard to positive moderate relationships, (between 0.3 and 0.5), the
following four variables were the most prevalent, namely, the Customer demands

212
and competitor challenges, Legal, Technological and Socio-economic variables.
These variables all impact on each other, and also on some of the other
variables.
The details of these and the other relationships are shown in Chapter 6 (Section 6.4).
Conclusions and recommendations:
Regarding the positive strong relationships, this could indicate, for example, that
there may be potential legislation and regulations that could cause SMMICs to have
a higher regard for environmental issues. The same may apply to socio-economic
variables, such as potential legislation and regulations regarding water scarcity or
electricity. Environmental concerns, in turn, may impact on socio-cultural issues,
such as satisfying customer demands, while obtaining food sources in a sustainable
manner.
Regarding the moderate relationships, it is evident that these variables form part of
the most challenging aspects related to operating as SMMICs. For example,
satisfying the demands of customers and dealing with the challenges of competitors
would imply confronting potential legal challenges, technological advancements and
social and economic trends.
It is recommended that special attention be paid to all the variables above, and it be
determined how they relate to or could influence each other.
With regard to the functional dimensions, none of them displayed moderate or large
relationships, as all the Pearson correlation coefficients were below 0.3.
Inferential analysis was subsequently conducted to determine if statistically significant
differences exist between the categories of different demographic and company
variables, with regard to the business environment factors and dimensions.
The aim is to determine the extent to which these variables play a role in the perceived
level of each business environment factor and dimension. If statistical differences
exist, these variables are important to consider in business planning and
implementation.

213
7.3.7.2 Conclusions regarding differences between age groups with regard to
the business environment factors and functional dimensions
There is a statistically significant difference between the age groups with regard to
general business skills, legal and networking and social media skills.
Conclusions and recommendations:
It appears that the younger age groups may tend to have higher networking and
social media skills than the other age groups, while their legal skills may be
somewhat less.
It is recommended that the owners/managers of all age groups, keep up with current
legislation affecting catering. Regarding social media, with its increasing
importance, it is recommended that all the owners/managers improve their skills in
social media applications. They should also focus more on networking.
With regard to the functional dimensions, there is a statistically significant difference
between the age groups for Financial and Transportation resources (C3). From the
mean ranks it is evident that the oldest age group (51 years and older) tends to have
more of these resources in place than the younger groups.
Conclusions and recommendations:
It may be that the oldest age group have been able to build up their resources
through years of generating income through business.
It is recommended that all the owners/managers, irrespective of age, devote time to
gaining further insights and knowledge about the different functional dimensions.
7.3.7.3 Conclusions regarding differences between roles or positions with
regard to the business environment factors and functional dimensions
There is a statistically significant difference between the role or position of the
owner/manager with regard to Increased customer knowledge. The owners who are
also full-time managers tend to experience increased customer knowledge more often
than the owners alone.

214
Conclusions and recommendations:
It is possible that those who have ownership, as well as direct involvement in running
the business, may be more motivated to have a deeper knowledge of their
customers.
It is recommended that all the owners/managers devote time to gaining further
insights and knowledge about their customers.
With regard to the functional dimensions, there are statistically significant differences
regarding Operational areas and Labour matters (C1) and Financial and
Transportation resources (C3) between the role or position of the owners/managers.
Conclusions and recommendations:
It is evident that full-time managers with insight into the strategic planning of the
business tend to have more of these resources in place than the owners or the
owners who are full-time managers.
It is recommended that all the owners/managers, irrespective of role or position,
devote time to gaining further insights and knowledge of the different functional
dimensions.
7.3.7.4 Conclusions regarding differences between the groups as defined by
four further categories, namely gender, business location, size, and
website variables with regard to the business environment factors and
functional dimensions
No statistically significant differences were found for gender, business location, size
of business and having a website or not.
Conclusions:
It appears that gender, the location and size of the business, as well as having a
website or not, do not impact the perceived level of each of the business environment
factors. A possible explanation could be that these are all fairly small businesses, and
thus, experience a similar impact with regard to the business environment factors.

215
With regard to the functional dimensions, statistically significant differences were
found, for all three dimensions, between businesses that have an actively maintained
website versus those that do not.
Conclusions:
It can be speculated that the SMMICs that have actively maintained websites are
bigger and more established, and therefore, would have larger reserves of resources
related to finance and transportation.
Statistically significant differences were further found between businesses located in
houses versus those located in business premises with regard to Financial and
Transportation resources (C3). Statistically significant differences were also found
between businesses located in houses versus those located in business premises with
regard to Operational areas and Labour matters (C1).
Conclusions:
It could be that business located in business premises are bigger and more
sophisticated than those located in houses, and that therefore, they are impacted
differently by the functional dimensions above.
Statistically significant differences were also found between businesses with males
versus those with females with regard to Operational areas and Labour matters (C1).
No statistically significant differences were found for the category of size with regard
to all three of the functional dimensions.
From the inferential analysis above (Section 7.3.7.4), although some statistical
differences were observed in various areas, relevant conclusions and subsequently
useful recommendations were not possible.
7.4 SYNCHRONISATION OF THE RESEARCH OBJECTIVES WITH
THE FINDINGS AND RECOMMENDATIONS OF THE STUDY
The research objectives of the study project, as well as the main findings and
recommendations, are presented in Table 7.3 below.

216
Table 7.3: Summary of the research objectives, main findings and recommendations
Primary objective:
To determine the impact of the business environment on small, medium and micro independent caterers (SMMICs) in Cape Town.
MAIN FINDINGS MAIN RECOMMENDATIONS
Micro environment
Greatest positive impact:
The perceived good managerial skills and abilities of the owners/managers as reported by the respondents.
Other positive areas:
Control of materials and production, Systems for receiving, storage, preparation and assembly of food, and Loyal and committed employees.
Challenges:
Setting up mission and vision statements, Networking, Financial resources, Marketing strategies, and Online services.
Owners/managers of the SMMICs could:
Devote more time to setting up mission and vision statements.
Utilise networking more.
Utilise the internet, social media and online services to a greater extent.
Find ways to improve financial resources.
Develop strategies to determine customers’ needs and also develop a general marketing strategy.
Market environment
Greatest impact:
Customers demanding value for money.
Competition has a significant, though not extreme effect.
Good relationships exist with suppliers.
Intermediaries have a limited impact: the biggest one being that of wholesalers.
Owners/managers of the SMMICs could:
Devote time to understanding exactly what customers want, need and demand, and determine how to best to satisfy them.
Continually monitor new competition and competitors’ actions, and respond to competition in creative ways.
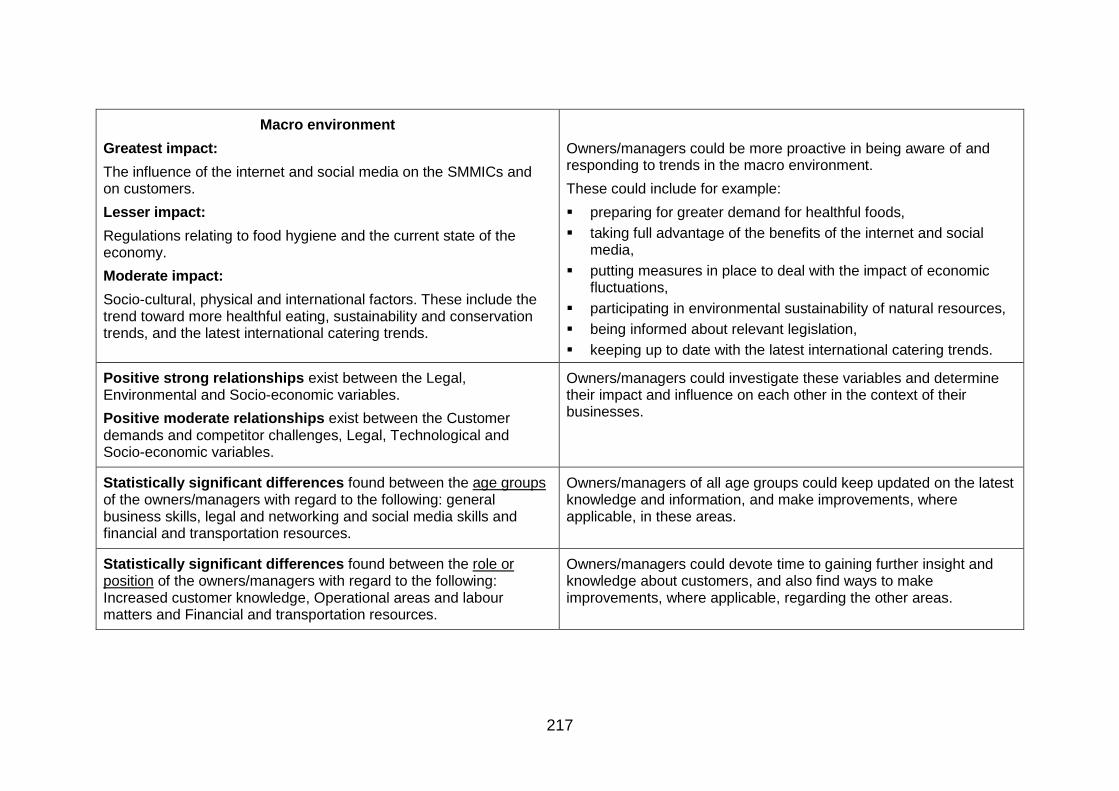
217
Macro environment
Greatest impact:
The influence of the internet and social media on the SMMICs and on customers.
Lesser impact:
Regulations relating to food hygiene and the current state of the economy.
Moderate impact:
Socio-cultural, physical and international factors. These include the trend toward more healthful eating, sustainability and conservation trends, and the latest international catering trends.
Owners/managers could be more proactive in being aware of and responding to trends in the macro environment.
These could include for example:
preparing for greater demand for healthful foods,
taking full advantage of the benefits of the internet and social media,
putting measures in place to deal with the impact of economic fluctuations,
participating in environmental sustainability of natural resources,
being informed about relevant legislation,
keeping up to date with the latest international catering trends.
Positive strong relationships exist between the Legal, Environmental and Socio-economic variables.
Positive moderate relationships exist between the Customer demands and competitor challenges, Legal, Technological and Socio-economic variables.
Owners/managers could investigate these variables and determine their impact and influence on each other in the context of their businesses.
Statistically significant differences found between the age groups of the owners/managers with regard to the following: general business skills, legal and networking and social media skills and financial and transportation resources.
Owners/managers of all age groups could keep updated on the latest knowledge and information, and make improvements, where applicable, in these areas.
Statistically significant differences found between the role or position of the owners/managers with regard to the following: Increased customer knowledge, Operational areas and labour matters and Financial and transportation resources.
Owners/managers could devote time to gaining further insight and knowledge about customers, and also find ways to make improvements, where applicable, regarding the other areas.
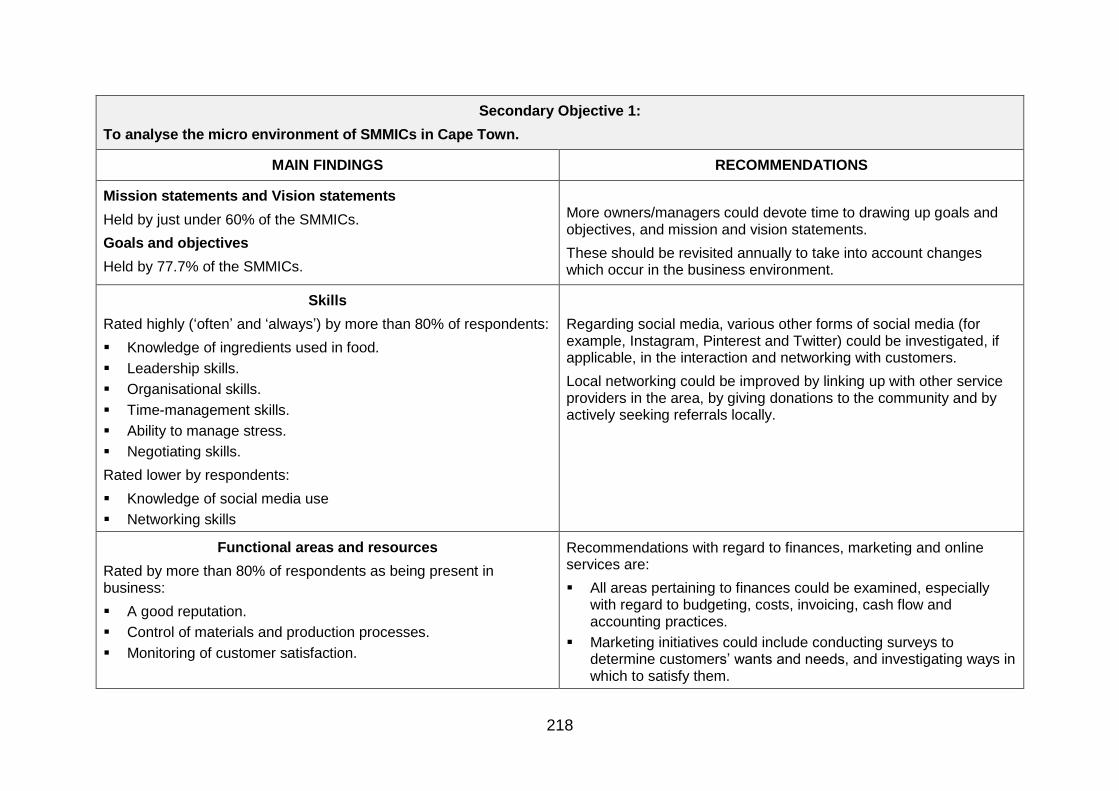
218
Secondary Objective 1:
To analyse the micro environment of SMMICs in Cape Town.
MAIN FINDINGS RECOMMENDATIONS
Mission statements and Vision statements
Held by just under 60% of the SMMICs.
Goals and objectives
Held by 77.7% of the SMMICs.
More owners/managers could devote time to drawing up goals and objectives, and mission and vision statements.
These should be revisited annually to take into account changes which occur in the business environment.
Skills
Rated highly (‘often’ and ‘always’) by more than 80% of respondents:
Knowledge of ingredients used in food.
Leadership skills.
Organisational skills.
Time-management skills.
Ability to manage stress.
Negotiating skills.
Rated lower by respondents:
Knowledge of social media use
Networking skills
Regarding social media, various other forms of social media (for example, Instagram, Pinterest and Twitter) could be investigated, if applicable, in the interaction and networking with customers.
Local networking could be improved by linking up with other service providers in the area, by giving donations to the community and by actively seeking referrals locally.
Functional areas and resources
Rated by more than 80% of respondents as being present in business:
A good reputation.
Control of materials and production processes.
Monitoring of customer satisfaction.
Recommendations with regard to finances, marketing and online services are:
All areas pertaining to finances could be examined, especially with regard to budgeting, costs, invoicing, cash flow and accounting practices.
Marketing initiatives could include conducting surveys to determine customers’ wants and needs, and investigating ways in which to satisfy them.

219
Secondary Objective 1:
To analyse the micro environment of SMMICs in Cape Town.
MAIN FINDINGS RECOMMENDATIONS
Systems for receiving, storage, preparation, assembly of food, clearing and cleaning.
Rated by 70% - 80% of respondents as being present in business:
Loyal and committed employees.
Good transportation vehicles.
Adherence to regulations and bargaining councils.
Sufficient knowledge of suppliers.
Possession of adequate skilled labour.
Rated by 60% and under (progressively less) as being present in business:
Adequate financial resources.
Strategy to determine customers’ needs.
Unique selling point or targeting a specific niche market.
Marketing strategy.
Online services.
Unique selling points or niche markets could be created by, for example, innovating traditional dishes.
Formal marketing strategies could be developed by doing market research, identifying target markets, developing relevant products and services and distribution methods, and setting up promotional campaigns.
Various forms of online services could be investigated, such as increasing the use of social media, by setting up or regularly updating websites and blogs, and by having customers order or make reservations online.

220
Secondary Objective 2:
To analyse the market environment of SMMICs in Cape Town.
MAIN FINDINGS RECOMMENDATIONS
Customers
Greatest impact:
Customers demanding value for money.
Progressively lesser impact:
Customers being more informed about various and alternative catering options.
Customers having increased product knowledge.
Customers switching caterers easily.
It is recommended that effort be made to understand exactly what the customers’ wants, needs and demands are, and how best they can be satisfied. While the simplest approach is friendly service and well-prepared food, other areas of focus could be those regarding pricing, convenience, speed, quality, customisation and healthier menu options, incorporating organic foods, natural ingredients, food quality and food sourcing. Further considerations could be innovative menus, superior customer service, novel food presentation and unusual marketing and promotional activities.
Competitors
Greatest impact:
New competitors continually appearing.
Progressively lesser impact:
New types of competition or competitive substitute products.
High degree of rivalry among existing competitors.
In addition, a fair amount of monitoring of competitors takes place.
Recommendations with regard to responding to competition, include developing innovative menus, investing in superior customer relations and service, offering lower pricing, offering extras, providing quality food, and using various promotional and networking strategies.
Monitoring competitors could include inspecting their websites, blogs and social media for their menus, prices, products, services, photographs, interactions with customers, and feedback and comments received.
Suppliers
Greatest impact:
Good working relationships with food suppliers.
Satisfaction with attention that suppliers pay to quality or standards.
Availability in Cape Town (rated highest to lowest) for:
It is recommended that further improvement in supplier relations be pursued by maintaining good communication channels, making payments timeously, being clear about requirements, giving timely feedback, and by showing appreciation.
Sources of supply could be improved by conducting research to find the best suppliers (visits, referrals, testimonials), and ensuring that

221
Secondary Objective 2:
To analyse the market environment of SMMICs in Cape Town.
MAIN FINDINGS RECOMMENDATIONS
Food and beverage products.
Catering equipment.
Catering IT systems.
requirements in terms of payment, delivery, quality, contracts, catering equipment, and IT systems are met.
Intermediaries
Greatest to least impact:
Wholesalers
Banks
Insurance agents
Wedding and event planners’ products
Technological apps linking caterers and customers
It is recommended that research be conducted to find the best intermediaries (through visits, referrals, testimonials) and ensuring that they meet requirements regarding payment, delivery, quality or contracts.
The utilising of wedding and event planners could be investigated, as well as technological apps, the latter regarding food ordering and food delivery.
SECONDARY OBJECTIVE 3:
To analyse the macro environment of SMMICs in Cape Town.
MAIN FINDINGS RECOMMENDATIONS
Socio-cultural factors
Greatest to least impact:
Trend toward more healthful eating/use of organic products/vegetarianism.
Less time available for food preparation by consumers.
Demographical changes.
It is recommended that SMMICs prepare for a greater demand for healthful foods (less fat, sugar, oil and salt) and also the including of more menu items that are plant-based, vegetarian, vegan, organic or gluten-free.
Regarding the two other trends, various options, such as home-cooked, frozen, ready-made or pre-packaged meals could be explored.

222
SECONDARY OBJECTIVE 3:
To analyse the macro environment of SMMICs in Cape Town.
MAIN FINDINGS RECOMMENDATIONS
Technological factors
Greatest to least impact:
Effect of the internet.
Ease of access to the internet, mobile apps and social media by consumers.
Technological changes in catering software.
Ways of gaining the maximum benefit of the internet could be explored by, for example, setting up promotional and interactive activities on various social media platforms, such as Facebook, Twitter, YouTube, Instagram and Pinterest.
The internet can also be used for websites, food blogs, catering blogs, cooking videos, nutritional videos, and for gathering information on catering and food trends.
It can also be used for doing business online, such as taking bookings or orders, receiving and making payments, and for purchasing various goods and services.
Economic factors
Greatest to least impact:
Current state of the economy.
Economic impact of water scarcity in Cape Town.
Unemployment levels and/or diminished disposable income by consumers.
Owners/managers could prepare for economic fluctuations by, for example, diversifying their offerings and expanding their customer bases.
Good finance strategies should also be in place, for example, sales goals budgets, expense budgets and cash flow plans.
Physical factors
Greatest to least impact:
Trend of presenting businesses as ‘caring for the environment’.
Trends in energy conservation.
Trends in waste management and recycling.
It is recommended that the owners/managers commit to the environmental sustainability of natural resources. This could include limiting the use of plastic and throwaway packaging for foods, using water sparingly, preparing food more efficiently, reducing food wastage, and investing in energy-efficient equipment, where possible.
They could also actively communicate their concern for the environment and advertise that they have put or are putting in place some of the measures above.

223
SECONDARY OBJECTIVE 3:
To analyse the macro environment of SMMICs in Cape Town.
MAIN FINDINGS RECOMMENDATIONS
Political-legal factors
Greatest to least impact:
Impact of regulations relating to food hygiene.
Impact of regulations relating to labour issues.
Impact of regulations relating to transport of food.
The owners/managers should ensure that they are informed about all the relevant regulations and legislation affecting their industry and operations and that they comply with them.
International factors
Greatest to least impact:
Latest catering trends in international media.
Customers gaining knowledge through international travel of other countries’ foods and beverages.
It is recommended that international trends be checked regularly and incorporated, where feasible. These include new ideas on plant-based meals, cuisine from other countries, alternative ingredients, food presentation, service, sustainable food packaging, and catering equipment and software.

224
SECONDARY OBJECTIVE 4:
To identify the strengths, weaknesses, opportunities and threats in the business environment of SMMICs in Cape Town.
Strengths
A good reputation.
Knowledge of ingredients used in food.
Leadership skills.
Weaknesses
Lack of a marketing strategy.
Limited use of online services.
Opportunities
The trend toward more healthful eating/use of organic products/vegetarianism.
Less time available for consumers for food preparation.
Effects of the internet on caterers (for example, new ideas and catering opportunities).
Easy access to the internet, mobile apps and social media by consumers.
Threats
Customers demanding value for money.
New competitors continually appearing.
New types of competition or competitive substitute products continually arising.
Current state of the economy.

225
With regard to Secondary Objective 4 above, only the most relevant strengths,
weaknesses, opportunities and threats of the SMMICs are listed, since the discussion
on the topic or objective has been intertwined in the rest of the results.
The research objectives, along with the findings of the study and relevant
recommendations have been presented in the table above. The limitations of the
research study are discussed next.
7.5 LIMITATIONS OF THE STUDY
This study is subject to a number of limitations as outlined below.
The study is limited to SMMICs in the greater Cape Town area, and the findings
cannot be applied and generalised to all SMMICs in South Africa.
As the SMMICs range in size from micro to medium, the business environment
in some areas may affect them very differently. Research on, for example, very
small caterers only or on medium-sized caterers only, may provide a more
accurate picture.
These are the respondents’ subjective views only, and may reflect their personal
bias in certain areas (for example, with regard to their managerial abilities).
7.6 SUGGESTIONS FOR FURTHER RESEARCH
Given the research scope of this study, the results obtained and the conclusions
reached, a number of suggestions for further research are provided below:
The study could possibly be duplicated in other areas or provinces of South
Africa.
A study on only one size (micro, very small, small or medium) independent
caterer could possibly give a more accurate reflection of the impact of the
business environment on that category of caterers.
More in-depth research could be conducted on the impact on SMMICs of one
component of the business environment only, for example, the micro, market or
macro environment.
226
A research study could focus only on the impact of technology on small
independent caterers, given that there are so many areas that could affect their
operations (for example, the internet, social media, apps, catering IT systems).
The next section presents the final conclusion of the research project.
7.7 CONCLUSION
The primary objective of this research was to analyse the business environment of
micro, small and medium independent caterers (SMMICs) in Cape Town. As David
and David (2015:41) state (Section 3.2), all environments change sooner or later,
which means that all businesses must adapt and change, as well. They add that
change involves new resources, new strategies, new visions and missions, new
strategies and goals, and new strengths and weaknesses. In this context, an
investigation into the business environment of the SMMICs provides more insight into
the challenges and opportunities that they currently face.
The study commenced with a literature review of the South African hospitality industry,
the food and beverage sector, and the catering sector as part of the food and beverage
sector. In addition, the nature of the SMMICs was determined.
Thereafter, the factors in the business environment which impact on the SMMICs were
considered. These formed part of the secondary research objectives, which were to
assess the impact of the micro, market and macro environments on the SMMICs.
Another research objective was to conduct an assessment of the internal strengths
and weaknesses of the SMMICs, along with the external opportunities and threats that
they face.
With regard to the research methodology, a questionnaire was developed, an online
survey distributed to participants, and primary data collected and analysed using
descriptive and inferential analysis.
The subsequent findings provided a range of information on a wide range of factors
within the micro, market and macro environments that impact on the SMMICs. The
main findings indicate that the abilities of the owners/managers, the control of
materials, and production processes and systems, and loyal and committed
employees have the greatest positive internal impact, while challenges appear to exist
with regard to financial resources, marketing strategies and online services.
227
In the market environment, the greatest positive impact on the SMMICs is their
relationship with their suppliers, while threats are indicated regarding the demands of
customers and the actions of competitors. In the macro environment, technological
change, particularly the internet, appears to have the greatest positive impact on the
SMMICs, while the greatest negative impacts are indicated by the current state of the
economy and also legal regulations. It was also established that the Legal,
Environmental and Socio-economic variables have the greatest impact on each other
with regard to positive strong relationships.
Regarding the problem statement that SMEs/SMMEs in South Africa suffer major
hardships and that this would apply to SMMICs as well, this appears to be borne out
as the research revealed that almost 40% of the SMMICs in Cape Town listed on
google search engines and on Facebook and other social media, no longer exist (as
noted in Chapter 1, Section 1.6.4).
Some important recommendations emanating of the research are for the
owners/managers of the SMMICs to upgrade their internet skills and to improve their
strategies relating to marketing, customers and competitors. They should also be more
proactive with regard to economic and environmental challenges.
It is hoped that this study and the recommendations made could be of some benefit to
SMMICs in Cape Town or elsewhere in South Africa, as the information could be used
to improve their competitive advantage and profitability.

228
LIST OF REFERENCES
Abers, D. 2019. Available at: https://www.itagroup.com/insights/event-catering-trends
[Accessed on 2019, December 04].
Abor, J. & Quartey, P. 2010. Issues in SME development in Ghana and South Africa.
International Research Journal of Finance and Economics, 39(6): 215-228.
Afoodable. 2019. Afoodable [image]. Available at: http://www.afoodable.co.za/ [Accessed on
2019, December 04].
African Development Bank Group. 2020. Available at: https://www.afdb.org/en/countries/
southern-africa/south-africa/south-africa-economic-outlook/ [Accessed on 2020, March
05].
Akhtar, N., Azeem, S.M. & Mir, G.M. 2014. Strategic Role of Internet in SMEs Growth
Strategies. International Journal of Business Management & Economic Research, 5(2):
20-24.
Amason, A. 2011. Strategic management: From theory to practice. New York: Routledge.
Appetite Catering. 2019. Appetite Catering [online]. Available at:
http://www.appetitecatering.co.za/ [Accessed on 2019, December 04].
Artnetw0rk, n.d. History of Banquet and Catering. Available at: https://www.scribd.com/doc/
104099945/History-of-Banquet-and-Catering [Accessed on 2019, December 03].
Asah, F., Fatoki, O., Rungani, E. 2015. The impact of motivations, personal values and
management skills on the performance of SMEs in South Africa. African Journal of
Economic and Management Studies, 6(3): 308-322.
Banham, C. 2010. External Environmental Analysis for Small and Medium Enterprises
(SMEs). Journal of Business & Economics Research, 8(10): 1.
Best Choice Caterers. 2019. Best Choice Caterers [online]. Available at:
http://www.bestchoicecaterers.co.za/ [Accessed on 2019, December 04].
Best of Joburg. 2019. Readers’ Choice Awards 2019. Available at:
https://bestofjoburg.co.za/2019/11513/best-caterer-word-of-mouth/ [Accessed on 2019,
December 03].
Bhorat, H., Asmal, Z., Lilenstein, K. & van der Zee, K. 2018. SMMEs in South Africa:
Understanding the Constraints on Growth and Performance. Development Policy
Research Unit, WORKING PAPER 201802.
229
Blue Plate Catering. 2016. Catering Large Scale Events [image]. Available at:
http://blueplatechicago.com/category/catering/ [Accessed on 2019, December 12].
Blumberg, B., Cooper, D. & Schindler, P. 2011. Business Research Methods. 3rd European
ed. UK: McGraw-Hill.
Blumberg, B., Cooper, D. & Schindler, P. 2014. Business Research Methods. 4th European
ed. UK: McGraw-Hill.
Botha, T. 2018. Entrepreneurship and how to grow your own business. 6th ed. Johannesburg:
Juta.
Bowie, D. & Buttle, F. 2013. Hospitality Marketing: Principles and Practice 2nd ed. UK: Taylor
& Francis.
Brammer, S. Hoejmose, S. & Marchant, K. 2012. Environmental Management in SMEs in the
UK: Practices, Pressures and Perceived benefits. Business Strategy and the
Environment: 423-434.
Brough, P. (ed.). 2019. Advanced Research Methods for Applied Psychology Design, Analysis
and Reporting. New York: Routledge.
Bryman, A., Bell, E., Hirschsohn, P., Dos Santos, A., du Toit, J., Masenge, A., van Aardt, I. &
Wagner, C. 2014. Research Methodology: Business and Management Context, Cape
Town: Oxford University Press Southern Africa.
Budget Catering. 2019. Budget Catering. [online]. Available at:
http://www.budgetcatering.co.za/wmenu.php [Accessed on 2019, December 04].
Budņiks, L. & Didenko, K. 2012. SME Management Decision-Making Problems in Changing
Market Conditions, Latvian Experience. Economics and management, 17(3): 1171-1177.
Burns, P. 2011. Entrepreneurship and Small Business: Start-up. Growth and Maturity, 3rd ed.
London: Palgrave Macmillan.
Cant, M. 2012. Challenges Faced by SMEs In South Africa: Are Marketing Skills Needed?
International Business & Economics Research Journal, 11(10): 1107-1116.
Cant, M.C. & van Heerden, N. 2018. Marketing Management: A South African Perspective.
3rd ed. [ebook]. Johannesburg: Juta.
Cant, M.C. & Wiid, J.A. 2013. Establishing the Challenges Affecting South African SMEs.
International Business & Economics Research Journal, 12(6): 707-716.

230
Cant, M.C., Wiid, J.A. & Kallier S.F. 2015. Product Strategy: Factors that influence product
strategy decisions of SMEs in South Africa. The Journal of Applied Business Research,
31(2): 621-630.
Cape Catering Equipment. 2019. Cape Catering Equipment [Image]. Available at:
http://www.capecatering.co.za/ [Accessed on 2019, December 04].
Cathkin Caterers. 2019. Cathkin Caterers [Image]. Available at:
http://www.cathkincaterers.co.za [Accessed on 2019, December 04].
CATHSSETA. 2019. Available at: https://cathsseta.org.za/wp-content/uploads/2018/10/
CATHSSETA-Sector-Skills-Plan-201819.pdf [Accessed on 2019, December 04].
Chan, B. & Mackenzie, M. 2013. Tourism and Hospitality Studies: Introduction to Hospitality.
Available at: https://www.scribd.com/document/406465897/Murray-Mackenzie-Benny-
Chan-Introduction-to-Hospitality-pdf [Accessed on 2019, December 03].
City of Cape Town. 2018a. Integrated Annual Report 2017/2018. Available at:
http://resource.capetown.gov.za/documentcentre/Documents/City%20research%20repo
rts%20and%20review/CCT%20Integrated%20Annual%20Report%202017_18.pdf
City of Cape Town. 2018b. Economic Performance Indicators for Cape Town 2018: Quarter 4
(October-December). Available at https://www.investcapetown.com/wp-content/uploads/
2019/04/ EPIC -2018Q3-FINAL.pdf\
City of Cape Town. 2019a. Events By-law. Available at: http://resource.capetown.gov.za/
documentcentre/Documents/Bylaws%20and%20policies/Events%20By-law.pdf
City of Cape Town. 2019b. Food safety and hygiene requirements. Available at:
http://www.capetown.gov.za/work%20and%20business/commercial-health-and-
safety/environmental-health/food-safety-and-hygiene-requirements [Accessed on 2019,
December 02].
City of Cape Town. 2019c. Environmental health. Available at: https://www.capetown.
gov.za/Work%20and%20business/Commercial-health-and-safety/Environmental-
health/Regulations-for-food-businesses [Accessed on 2019, December 02].
Claire's Catering. 2019. Corporate Event Catering [image]. Available at:
http://www.clairescatering.org.uk/what-we-do/corporate-events [Accessed on 2019,
December 04].
Core Catering Supplies. 2019. Core Catering Supplies [image]. Available at:
http://www.corecatering.co.za/ [Accessed on 2019, December 04].

231
Cousins, J., Foskett, D. & Pennington, A. 2011. Food and Beverage Management: For the
Hospitality, Tourism and Event Industries. 3rd ed. Oxford, UK: Elsevier Butterworth-
Heinemann,
Cousins, J., Lillicrap, D. & Weekes, S. 2014. Food and Beverage Service. 9th ed. UK: Hachette.
David, F.R. & David, F.R. 2015. Strategic management: Concepts. Global Edition, 15th ed.
New Jersey: Pearson Education.
Davis, B., Lockwood, A., Pantelidis, I. & Alcott, P. 2018. Food and Beverage Management. 6th
ed. New York: Routledge.
De Wet, P. 2019. The definitions of micro, small, and medium businesses have just been
radically overhauled – here’s how. Available at: https://www.businessinsider.co.za/micro-
small-and-medium-business-definition-update-by-sector-2019-3 [Accessed on 2019,
December 02].
Denley, P. 2019. The 5 Key Challenges Facing the Catering Industry. Available at:
https://www.caterquip.co.uk/the-5-key-challenges-facing-the-catering-industry/
[Accessed on 2020, April 08]
Erasmus, B., Strydom, J. & Rudansky-Kloppers, S. (Eds). 2019. Introduction to Business
Management. 11th ed. Cape Town: Oxford University Press.
Erixon, F. 2019. The Economic Benefits of Globalization for Business and Consumers. ECIPE.
Available at: file:///C:/Users/Admin/Documents/1%20MASTERS/1%20CURRENT/1%20
Final%20chapters/Resources/Globalization-paper-final.pdf. [Accessed on 2019,
December 03].
Essential Chefs Catering. 2015. Catering and Food Trends of 2015. Available at:
http://www.essentialchefs.com/catering-and-food-trends-of-2015/ [Accessed on 2016,
August 15].
Evans, N. 2015. Strategic Management for Tourism, Hospitality and Events. New York:
Routledge.
Faulkner, S.S., & Faulkner, C.A. 2019. Research Methods for Social Workers : A Practice-
Based Approach. 3rd ed. New York: Oxford University Press.
FEDHASA. 2019. Available at: http://fedhasa.co.za/about/ [Accessed on 2019, December 04].
Fedics. 2019. Company overview. Available at: https://www.fedics.co.za/company-
overview/fedics-pedigree-milestones/ [Accessed on 2019, December 02].
Feedem. 2019. About us. Available at: https://feedem.co.za/about-us/ [Accessed on 2019,
December 02].

232
Felix, M. & Mutalemwa, D. 2015. Does globalisation impact SME development in Africa?
African Journal of Economic and Management Studies, 6(2): 164-182. DOI: https://doi-
org.ezproxy.uwc.ac.za/10.1108/AJEMS-01-2015-0012
Foskett, D. & Ceserani, V. 2007. The Theory of Catering. 11th ed. UK: Hodder Education.
Foskett, D, Paskin, P. & Pennington, A. 2016. The Theory of Hospitality and Catering. 13th ed.
UK: Hodder Education.
Fourie, W. & Conradie, W. 2017. Basic Financial Management. (ebook) Johannesburg: Juta.
Gliner, J.A., Morgan, G.A. & Leech, N.L. 2017. Research Methods in Applied Settings: An
Integrated Approach to Design and Analysis. 3rd ed. New York: Routledge.
Gourmet Food Distributors. 2019. Gourmet Food Distributors. Available at:
http://gourmetfoods.co.za/ products.php [Accessed on 2019, December 09].
Government Gazette. 2018. Regulations relating to the HACCP system: amendment. No
41707. Available at: http://www.health.gov.za/phocadownload/haccp%20
amendment.pdf [Accessed on 2019, December 02].
Hair, J.F., Black, W.C., Babin, B.J. & Anderson, R.E. 2010. Multivariate Data Analysis. 7th ed.
New York: Pearson.
Hermann, U. & du Plessis, L. (Eds.). 2016. An Introduction to Tourism & Hospitality
Management: A Services Approach. Pretoria: Van Schaik.
Hiduke, G. & Ryan, J.D. 2013. Small Business: An Entrepreneur's Business Plan. 9th ed.
Boston, MA: Cengage Learning.
Infiniti Research. n.d. Food and Beverage Industry Market Research Solutions. Available at
https://www.infinitiresearch.com/industry/food-and-beverage [Accessed on 2016, May
23].
International Labour Organization. 2019. Hotels, catering and tourism sector. [Online].
Available at: http://www.ilo.org/global/industries-and-sectors/hotels-catering-tourism/
lang--en/index.htm [Accessed on 2019, December 04].
Invest Cape Town. 2019. Cape Town’s food & beverage manufacturing industry. Available at:
https://www.investcapetown.com/opportunities/food-beverage-manufacture/ [Accessed
on 2019, December 02].
Jackson, L. 2017. How do I get a Certificate of Acceptability - COA? Available at:
https://www.foodfocus.co.za/home/Industry-Topics/food-safety/How-do-I-get-a-
Certificate-of-Acceptability---COA [Accessed on 2019, December 03].

233
Jackson, L. 2018. Starting a food business in South Africa - Part 1. Available at:
https://www.foodfocus.co.za/home/Industry-Topics/food-safety/Starting-a-food-
business-in-South-Africa---Part-1 [Accessed on 2019, December 03].
Khan, A. 2019. How An App Can Improve Your Catering Business? Available at:
https://www.appypie.com/app-can-improve-catering-business. [Accessed on 2019,
December 20].
Lamb, C., Hair, J., McDaniel, C., Boshoff, C., Terblanche, N., Elliot, R. & Klopper, H. 2015.
Marketing. 5th ed. South Africa: Oxford University Press.
Local Event Caterers. 2019. Catering Staff [image]. Available at: https://remotesitesolutions.
com/slideshow/catering/attachment/catering-staff/ [Accessed on 2019, December 04].
Lopez, J. 2014. The Influence of Media on our Food Choices. Available at:
https://www.yourhealthjournal.com/the-influence-of-media-on-our-food-choices/.
[Accessed on 2019, December 08].
Makhitha, K.M. 2019. Supplier relationship marketing practices and small retailer performance
in South Africa. Cogent Business & Management, 6(1): 1-17.
Malhotra, N.K. 2020. Marketing Research: An Applied Orientation. New York: Pearson.
Maness, P. 2016. Common Challenges and Solutions for Your Catering Business. Available
at:https://www.trimarkusa.com/news-room/trimark-blog/2016/june-2016/common-
challenges-and-solutions-for-your-catering. [Accessed on 2020, April 07].
Martin, N. 2019. How Technology Is Transforming The Food Industry. Available at:
https://www.forbes.com/sites/nicolemartin1/2019/04/29/how-technology-is-transforming-
the-food-industry/#2bd568f020a3. [Accessed on 2019, December 08].
Masocha, R. 2018. “Does Environmental Sustainability Impact Innovation, Ecological and
Social Measures of Firm Performance of SMEs?” Evidence from South Africa.
Mattel, B. 2016. Catering: A Guide to Managing a Successful Business Operation. 2nd ed. New
Jersey: John Wiley & Sons.
McDaniel, B. 2018. Challenges and Solutions of the Catering Industry. Available at:
https://www.caterease.com/challenges-solutions-catering-industry/. [Accessed on 2020,
April 15].
McEvoy, D.M. 2018. A Guide to Business Statistics. Hoboken, NJ: Wiley.
Messe & Event Caterer. 2019. Fingerfood-Catering [image]. Available at: Messe & Event
Caterer https://www.messe-event-caterer.de/en/fingerfood-catering/ [Accessed on 2019,
December 11].

234
Meyer, D.F & Meyer, N. 2017. Management of small and medium enterprise (SME)
development: an analysis of stumbling blocks in a developing region. Polish Journal of
Management Studies, 16(1): 127-141.
Moore, C., Petty, J., Palich, L. & Longenecker, J. 2010. Managing Small Business: An
Entrepreneurial Emphasis. 15th ed. Boston, MA: Cengage.
Mothibi, G. 2015. The effects of entrepreneurial and firm characteristics on performance of
small and medium enterprises in Pretoria. International Journal of Economics, Commerce
and Management, 3(3): 1-8.
Moulton, P.C. & Leow, S. 2015. Earnings Announcements and Investor Focus in the
Hospitality Industry. Cornell Hospitality Quarterly, 56(1): 5-16.
Murugi, F. 2014. Introduction to food and beverage theory. Available at:
https://fredamurugi.wordpress.com/author/fredamurugi/ [Accessed on 2019, March 20].
Mutezo, A.T. 2015. Small and medium enterprise financing and credit rationing: the role of
banks in South Africa. Doctoral thesis. University of South Africa, Pretoria.
Nardi, P. 2016. Doing Survey Research. 3rd ed. New York: Routledge.
Neneh, N. & van Zyl, J. 2012. Achieving optimal business performance through business
practices: evidence from SMEs in selected areas in South Africa. Southern African
Business Review, 16(3): 118-144.
Neves, M.F. 2014. The Future of Food Business: The Facts, the Impacts and the Acts. 2nd ed.
Singapore: World Scientific.
Nortjé, N., Visagie,R. & Wessels, J.S. (Eds.). 2019. Social Science Research Ethics in Africa.
New York: Springer International Publishing.
Olawale, F. & Garwe, D. 2010. Obstacles to the growth of new SMEs in South Africa: A
principal component analysis approach. African Journal of Business Management, 4(5):
729-738.
Orlando Caribbean Catering. n.d. Caribbean Meal [image]. Available at:
http://www.orlandocaribbeancatering.com/products-services/ [Accessed on 2019,
December 03].
Overberg Food Distributors. 2019. Overberg Food Distributors [image]. Available at:
http://www.overbergfoods.co.za/products/ [Accessed on 2019, December 04].
Patten, M. & Newhart, M. 2018. Understanding Research Methods: An Overview of the
Essentials. 10th ed. (ebook). New York: Routledge.

235
Pettinger, T. 2018. Functions and Examples of Financial Intermediaries. Available at from:
https://www.economicshelp.org/blog/6318/economics/functions-and-examples-of-
financial-intermediaries/
Picinu, A. 2019. How to Get Customers for a Small Catering Business. Available at:
https://bizfluent.com/how-2045210-get-customers-small-catering-business.html.
[Accessed on 2019, December 08].
Premium Kitchens. 2019. Premium Kitchens. Available at: http://www.premiumkitchens.co.za/
[Accessed on 2019, December 11].
PricewaterhouseCoopers (PwC). 2018. Cape Town: African city of opportunity. Available at:
https://www.pwc.co.za/en/assets/pdf/cape-town-african-city-of-opportunity.pdf
[Accessed on 2019, December 10]
Profitable Venture. 2016. Starting a Catering Business in South Africa;
https://www.profitableventure.com/start-catering-business-south-africa/
Rajan, N. 2018. How 3D Food Printing Technology Is “Shaping” the Food Industry. Available
at: https://xtalks.com/how-3d-food-printing-technology-is-shaping-the-food-industry/.
[Accessed on 2019, December 08].
Riley, S. 2013. A Brief History of Catering. Available at: http://www.tgiscatering.com/
2013/11/a-brief-history-of-catering/ [Accessed on 2019, December 03].
Sacks, C. 2018. Technology Evolution and the Catering Industry. Available at:
https://certifiedcateringconsultants.com/technology-evolution/ [Accessed on 2019,
December 07].
Sage Catering. 2019. Introduction [image]. Available at: http://sage-catering.co.za/. [Accessed
on 2019, December 11].
Salkind, N.J. 2018. Exploring Research. 9th ed. Global edition. New York: Pearson Higher Ed.
Sandada, M. 2014. Mission And Vision, Environmental Scanning And Formality Of Strategic
Planning As Predictors Of The Performance Of Small And Medium Enterprises (SMEs)
In The Gauteng Province Of South Africa. Ecoforum Journal, 3(2): 7.
SARS (South African Revenue Service). 2019. Annual Report 2018/19. Available at:
https://www.sars.gov.za/ AllDocs/SARSEntDoclib/AnnualReports/SARS-AR-24%20-
%20Annual%20Report% 202018-2019.pdf [Accessed on 2019, December 02].
Saunders, M.N.K., Thornhill, A. & Lewis, P. 2019. Research Methods for Business Students.
8th ed. New York: Pearson Education Limited.

236
SBIBaseline. 2020. Small Business Institute Baseline Study. 2020. Available at:
https://www.smallbusinessinstitute.co.za/wp-content/uploads/2019/01/SBIbaselineStudy
Alertfinal.pdf [Accessed on 2020, January 05].
Scanlon, N.L. 2013. Catering Management. 4th ed. New Jersey: John Wiley & Sons.
SEDA. 2016. http://www.seda.org.za/Publications/Publications/The%20Small,%20Medium
%20and%20Micro%20Enterprise%20Sector%20of%20South%20Africa%20Commissio
ned%20by%20Seda.pdf [Accessed on 2019, December 07].
Sekaran, U. & Bougie, R. 2016. Research Methods for Business: A Skill Building Approach.
7th ed. UK: John Wiley & Sons.
Sekulovska, M. 2016. Electronic services in hospitality. Belgrade, Serbia. Available at:
http://eprints.uklo.edu.mk/1081/ [Accessed on 2019, December 12].
Shiring, S.B. 2014. Professional Catering. Boston MA: Cengage Learning.
Shock, P.J. & Stefanelli, J.M. 2001. On-premise catering: hotels, conference centers and
clubs. John Wiley & Sons, Inc., USA.
Shock, P.J., Sgovio, C. & Stefanelli, J.M. 2011. On-Premise Catering: Hotels, Convention
Centers, Arenas, Clubs, and More. 2nd ed. New Jersey: John Wiley & Sons.
Simple Crafty Fun. 2016. Appetizers [image]. Available at: http://valeventgal.com/2016/
11/creative-ways-to-serve-appetizers/ [Accessed on 2019, December 04].
Sitharam, S. & Hoque, M. 2016. Factors affecting the performance of small and medium
enterprises. Available from: businessperspectives.org.
SME South Africa. 2018. Report: An Assessment of South Africa’s SME Landscape:
Challenges, Opportunities, Risks & Next Steps. [Accessed on 2019, December 04].
SME Toolkit South Africa. 2016. Compliance in the Hospitality Industry. Available at:
https://smetoolkit.businesspartners.co.za/en/content/compliance-hospitality-industry
[Accessed on 2019, December 08].
South African Chefs Association. 2019. Available at: https://sachefs.co.za/ [Accessed on
2019, December 03].
South African Market Insights. 2019. Available at: https://www.southafricanmi.com/south-
africas-gdp.html [Accessed on 2019, December 05].
StatsSA. 2018. Gross Domestic Product, 4th Quarter 2018; Statistical release P0441.
Available at: http://www.statssa.gov.za/publications/P0441/P04414thQuarter2018.pdf
[Accessed on 2019, December 03].

237
StatsSA. 2019a. Gross Domestic Product, 4th Quarter 2019; Statistical release P0441.
Available at: http://www.statssa.gov.za/publications/P0441/P04414thQuarter2019.pdf
[Accessed on 2019, December 03].
StatsSA. 2019b. Statistical release P0141. Available at: http://www.statssa.gov.za/
publications/P0141/P0141November2019.pdf [Accessed on 2020, March 05]
StatsSA. 2019c. Statistical release P0441. Available at http://www.statssa.gov.za/
publications/P0441/P04414thQuarter2019.pdf. [Accessed on 2020, March 05]
StatsSA. 2019d. STATSSA, December 2019 Food and Beverages Preliminary, P6420.
Available at: http://www.statssa.gov.za/publications/P6420/P6420December2019.pdf
[Accessed on 2019, December 03].
StatsSA. 2019e. Inflation continues to edge lower. Available at: http://www.statssa.gov.za/
?p=12835 [Accessed on 2020, March 05].
StatsSA. 2020a. Economy slips into recession. Available at: http://www.statssa.gov.za/
?p=13049. [Accessed on 2020, March 05].
StatsSA. 2020b. Statistical release P0441. Available at: http://www.statssa.gov.za/
publications/P0441/P04414thQuarter2019.pdf [Accessed on 2020, March 05].
Stoehr, K. 2020. State of the Industry: Food Trends for 2020. Available at
https://www.catersource.com/food-beverage/state-industry-food-trends-2020. [Accessed
on 2020, February 05].
Taylor, A. & Mariton, J. 2017. Our Favourite Business Strategy Frameworks. Available at:
https://www.smestrategy.net/blog/business-strategy-frameworks-for-strategic-planning
[Accessed on 2019, December 10].
The Artisan Kitchen. 2019. Commercial kitchen [image]. Available at:
http://www.artisankitchenandcafe.com/kitchen.html [Accessed on 2019, December 04].
The Banking Association of South Africa. 2019. Available at: http://www.banking.org.za/what-
we-do/sme/sme-definition [Accessed on 2019, December 04].
The Heights Catering. 2019. Off-premise catering locations [images]. Available at:
http://www.theheightsithaca.com/catering.cfm [Accessed on 2019, December 04].
Thomas, C. & Hansen, B. 2012. Off-premise Catering Management. 3rd ed. New Jersey: Wiley.
Thompson, J.L. & Martin, F. 2017. Strategic management: Awareness & Change. Boston, MA:
Cengage Learning.
238
Trading Economics. 2020a. South Africa Inflation Rate. Available at: http://www.trading
economics.com/south-africa/inflation-cpi [Accessed on 2020, March 01].
Trading Economics. 2020b. South Africa - Economic Forecasts - 2020-2022 Outlook.
Available at: https://tradingeconomics.com/south-africa/forecast [Accessed on 2020,
March 05].
Vacations Dream. 2019. Cape Town Map [image]. Available at: http://vacationsdream.com/
cape-town-map.html [Accessed on 2019, December 04].
Van Aardt, I. & Bezuidenhout, S. 2014. Entrepreneurship and New Venture Management. 5th
ed. Oxford: University Press, Southern Africa.
Van Scheers, L. & van Scheers, J. 2015. Determine small and medium enterprise social media
activities: a community engagement project in the Tshwane community. Journal of
Governance and Regulation, 4(4): 79-91.
Van Scheers, L. 2016. Determine Small and Medium Enterprise (SME) Internet Marketing
Usage in the Tshwane Area, South Africa, 12(1): 39-63.
Van Scheers, L. 2016. Is there a link between economic growth and SMEs success in South
Africa? Investment Management and Financial Innovations, 13(2): 249-353.
Van Tilburg, L. 2019. ‘Dark kitchens’ – a new force to be reckoned with in SA take-away
delivery market. Available at https://www.biznews.com/good-hope-project/2019/
12/05/dark-darth-kitchens-sa-take-away-delivery. [Accessed on 2019, December 07]
Veitch, C. 2016. The Restaurant, Fast Food And Catering Industry [Homepage of Who Owns
Whom]. [Online]. Available at: https://www.whoownswhom.co.za/store/info/4409?
segment=Hospitality%2C+Gaming+%26+Entertainment. [Accessed on 2019, December
02].
Veitch, C. 2019. The Restaurant, Fast Food And Catering Industry [Homepage of Who Owns
Whom]. [Online]. Available at: https://www.whoownswhom.co.za/store/info/4738?
segment=Hospitality%2C+Gaming+%26+Entertainment . [Accessed on 2019, December
02].
Voila Catering. n.d. Beverages [image]. Available at: http://www.voila-catering.com/drinks/
[Accessed on 2019, December 03].
Waller, K. 2009. Improving Food and Beverage Performance. UK: Taylor & Francis.
Weddbook. 2019. Wedding Catering Service [image]. Available at: http://fr.weddbook.com/
entry/1984789/photo [Accessed on 2019, December 04].

239
Weedmark, D. 2019. 4 Types of Marketing Intermediaries. Available from:
https://smallbusiness.chron.com/4-types-marketing-intermediaries-24330.html
[Accessed on 2020, April 30].
Weinberg, J. 2007. The Everything Guide to Starting and Running a Catering Business, USA:
F+W Publications.
Whiteman, M. 2019. Robots, cannabis, sour, meal kits: restaurant trends of 2019. Available
at: https://www.ramw.org/blog/robots-cannabis-sour-meal-kits-restaurant-trends-2019
[Accessed on 2019, December 06].
Wiid, J. & Cant, M. 2018. Major Training Challenges for Small Businesses in the Tshwane
Area: Is there Hope? ŒCONOMICA, 14(7): 207-226.
Wiid, J.A., Cant, M.C. & Holtzhausen, L. 2015. Swot analysis in the small business sector of
South Africa: friend or foe? Corporate Ownership & Control, 13(1): 446-453.
Wilkes Group. 2019. Catering supplies [images]. Available at: http://www.wilkesgroup.co.uk/
our-services/catering/ [Accessed on 2019, December 04].
Williamson, K. & Johanson, G. (Eds). 2018. Research methods: information, systems, and
contexts. 2nd ed. Cambridge, MA: Elsevier.
Wood, R.C. 2015. Hospitality Management: A Brief Introduction. Thousand Oaks, CA: Sage.
WRSeta. 2014. Informal small medium and micro enterprises (SMME) retailers in South Africa,
ILDP 2014. Available at: https://www.wrseta.org.za/ILDPHome/Syndicate%201-
%20Ratoon.pdf. [Accessed on 2020, April 15].
Zavedenia, S. n.d. Ancient Feasting in China [image]. Available at: http://sofia.zavedenia.com/
uk/ 3395/news/10380/A.few.words.about.catering/ [Accessed on 2019, December 03].
Zikmund, W.G., Babin, B., Carr, J.C. & Griffin, M. 2013. Business Research Methods. Boston,
MA: Cengage Learning.

240
APPENDICES

241
APPENDIX A:
ETHICAL CLEARANCE CERTIFICATE
242

243
APPENDIX B:
PARTICIPANT INFORMATION AND CONSENT FORM
PARTICIPANT INFORMATION SHEET
23 February 2018
Title: AN ENVIRONMENTAL ANALYSIS OF SMALL INDEPENDENT CATERERS IN
CAPE TOWN
Dear Prospective Participant
My name is Jocelyn Lawrence and I am doing research with Professor Sharon Rudansky-
Kloppers, a professor in the Department of Business Management, towards an M.Com at the
University of South Africa. We are inviting you to participate in a study entitled AN
ENVIRONMENTAL ANALYSIS OF SMALL INDEPENDENT CATERERS IN CAPE TOWN.
WHAT IS THE AIM/PURPOSE OF THE STUDY?
The aim of this study is to do an analysis of the business environment in which small
independent caterers operate. I am conducting research to find out which factors in the
business environment have an impact on small independent caterers (SICs) in Cape Town.
WHY AM I BEING INVITED TO PARTICIPATE?
The participants in this study are small independent caterers in the greater Cape Town area
which are registered businesses and which have an online presence (website or Facebook
page or a listing in the online yellow pages). The researcher wishes to focus on small
independent caterers since library and other searches reveal that to date no real academic
research has been carried out on the catering industry and on small and very small
independent caterers in South Africa. The researcher also has a personal interest in caterers.
These particular caterers have been chosen since they are easily contactable via their
websites, Facebook pages or online yellow pages. The delineation of the greater Cape Town
area is indicated by key towns on the perimeters. These are Muizenberg, Simons Town,
Noordhoek, Hout Bay, City Centre and surrounds, Bloubergstrand, Durbanville, Paarl,
Stellenbosch, Gordons Bay, Strand, Somerset West and Mitchells Plain. The potential
participants have been found via a google search. The keywords for conducting the search
are “caterers Cape Town, “catering companies Cape Town”, caterers Cape Town Facebook”,
“catering companies Cape Town Facebook” as well as “caterers Cape Town yellow pages”
and “catering companies Cape Town yellow pages.” A google search conducted with these
criteria reveals a total of about 300 small independent caterers.
244
WHAT IS THE NATURE OF MY PARTICIPATION IN THIS STUDY / WHAT DOES THE
RESEARCH INVOLVE?
The study involves questionnaires. As a participant you will be requested to fill in the
questionnaire via LimeSurvey, an online survey tool. Most of the questions require you to click
the appropriate block of your choice. The expected duration of participation and the time
needed to complete the questionnaire is about 20 minutes.
CAN I WITHDRAW FROM THIS STUDY?
Being in this study is voluntary and you are under no obligation to consent to participation. If
you do decide to take part, you will be given this information sheet to keep. You are free to
withdraw at any time and without giving a reason. However please note that once you have
submitted the questionnaire it will not be possible to withdraw.
WHAT ARE THE POTENTIAL BENEFITS OF TAKING PART IN THIS STUDY?
As there are very few academic resources available on the subject, it is envisaged that
knowledge gained from the research will assist small independent caterers in their awareness
and understanding of the strengths, weaknesses, opportunities and threats that exist in their
business environment. It is further hoped that recommendations can be made that will assist
them in improving their competitive advantage. Another motivation for the study is that it could
contribute toward the academic literature of SMEs in South Africa and in particular literature
related to catering.
WHAT IS THE ANTICIPATED INCONVENIENCE OF TAKING PART IN THIS STUDY?
Please note that there is no risk of harm or any side-effects as a result of taking part in this
study. Nor will it be possible for you to be identified by any third party. A minor convenience
could be that as a participant, you are requested to spend a short time filling in the online
survey.
WILL WHAT I SAY OR WRITE BE KEPT CONFIDENTIAL?
Note that confidentially will be maintained. Your name will not be recorded anywhere and no
one will be able to connect you to the answers you give. Your answers will be given a fictitious
code number and you will be referred to in this way in the data, any publications, or other
research reporting methods such as conference proceedings.
Your answers may be reviewed by people responsible for making sure that research is done
properly, including members of the Research Ethics Committee. Otherwise, records that
identify you will be available only to people working on the study, unless you give permission
for other people to see the records. Please note that your anonymous data may be used for

245
other purposes, e.g. research report, journal articles, conference presentation, etc. Privacy
will be protected in any publication of the information. A report of the study may be submitted
for publication, but individual participants will not be identifiable in such a report.
HOW WILL INFORMATION BE STORED AND ULTIMATELY DESTROYED?
Hard copies of answers will be stored by the researcher for a period of five years in a locked
cupboard at her home for future research or academic purposes. Electronic information will
be stored on a password protected computer. Future use of the stored data will be subject to
further Research Ethics Review and approval if applicable. Ultimately information will be
destroyed by deletion off the researcher’s computer and backup hard drive.
WILL I RECEIVE PAYMENT OR ANY INCENTIVES FOR PARTICIPATING IN THIS
STUDY?
No payment or any reward is offered for participating in the study. The researcher expresses
deep appreciation for your participation.
HAS THE STUDY RECEIVED ETHICAL APPROVAL?
The study fulfils all the requirements as set out in the UNISA Policy on Research Ethics and
has received written approval from the Research Ethics Committee of the College of Economic
and Management Sciences, UNISA. A copy of the approval letter can be obtained from the
researcher if you so wish.
HOW WILL I BE INFORMED OF THE FINDINGS/RESULTS?
If you would like to be informed of the final research findings, please contact the researcher,
Jocelyn Lawrence on 082-7144562 / 021-8507561 or Email:[email protected] or
[email protected]. Note that the findings are accessible for five years. Should you require
any further information about any aspect of this study, please also contact her using the
contact details above.
Should you have concerns about the way in which the research has been conducted, you may
contact Professor Sharon Rudansky-Kloppers at Phone (Office):+27 12 429 4689; Fax-to-
email: 086 686 1733; Email: [email protected].
Thank you for taking time to read this information sheet and for participating in this study.
Mrs Jocelyn Lawrence

246
INFORMED CONSENT FORM
COVER LETTER TO AN ONLINE ANONYMOUS WEB-BASED SURVEY
Dear Prospective participant,
You are invited to participate in a survey conducted by Jocelyn Lawrence under the
supervision of Professor Sharon Rudansky-Kloppers, a professor in the Department of
Business Management towards an M.Com at the University of South Africa.
The survey you have received has been designed to study the business environment in which
small independent caterers in Cape Town operate. You were selected to participate in this
survey because you are a small independent caterer in the greater Cape Town area with a
registered business as well as an online presence (website or Facebook page or a listing in
the online yellow pages). Please note that you will not be eligible to complete the survey if you
are younger than 18 years. By completing this survey, you agree that the information you
provide may be used for research purposes, including dissemination through peer-reviewed
publications and conference proceedings.
It is anticipated that the information we gain from this survey will help us to determine the key
factors in the business environment that impact on small independent caterers in Cape Town.
You are, however, under no obligation to complete the survey and you can withdraw from the
study prior to submitting the survey. The survey is developed to be anonymous, meaning that
we will have no way of connecting the information that you provide to you personally.
Consequently, you will not be able to withdraw from the study once you have clicked the send
button based on the anonymous nature of the survey.
If you choose to participate in this survey it will take up no more than 20 minutes of your time.
You will not benefit from your participation as an individual, however, it is envisioned that the
findings of this study will assist you as a small independent caterer in your awareness and
understanding of the strengths, weaknesses, opportunities and threats that exist in your
business environment and assist you in improving your competitive advantage. We do not
foresee that you will experience any negative consequences by completing the survey. The
researcher(s) undertake to keep any information provided herein confidential, not to let it out
of our possession and to report on the findings from the perspective of the participating group
and not from the perspective of an individual.
The records will be kept for five years for audit purposes where after it will be permanently
destroyed (electronic copies will be permanently deleted from the hard drive of the computer).
You will not be reimbursed or receive any incentives for your participation in the survey.
247
The research was reviewed and approved according to the UNISA Policy on Research Ethics
by the Research Ethics Committee of the College of Economic and Management Sciences,
UNISA. The primary researcher, Jocelyn Lawrence, can be contacted at 082-7144562 or 021-
8507561, Email: [email protected] or [email protected]. The study leader,
Professor Sharon Rudansky-Kloppers, can be contacted during office hours at: +27-12429-
4689; Fax-to-email: 086 686 1733; Email: [email protected]. Should you have any
questions regarding the ethical aspects of the study, you can contact the chairperson of the
Research Ethics Committee of the College of Economic and Management Sciences, UNISA
at 012 4298104. Alternatively, you can report any serious unethical behaviour at the
University’s Toll Free Hotline 0800 86 96 93.You are making a decision whether or not to
participate by continuing to the next page. You are free to withdraw from the study at any time
prior to clicking the send button.

248
APPENDIX C:
QUESTIONNAIRE
Questionnaire
SECTION 1: FIRMOGRAPHICS
Q1. Please state the suburb in which the business is situated.
Q2. Please indicate whether the business is located in your house or at business premises.
House 1 Business premises 2
Q3. Please state the number of years the business has been in operation.
Q4. Please indicate all the categories which apply to your business.
Actively maintained website 1
Listing in online yellow pages
2
Facebook page 3
Other (please specify)
4
Q5. Please indicate the category into which your business falls (as per the Catering, Accommodation, and Other Trade sector by the National Small Business Amendment Act, No 26 of 2003:8).
Small business - Total annual turnover of less than R6 million and total gross asset value (excluding property) of less than R1 million.
1
Very small business - Total annual turnover of less than R5.10 million and total gross asset value (excluding property) of less than R0.90 million.
2
Other (please specify)
3

249
Q6. Please state the number of employees in your business.
Full-time 1
Part-time 2
Seasonal 3
Q7. Please indicate which of the following associations your business may be a member
of. (Please indicate all the options that apply)
Federated Hospitality Association of Southern Africa (FEDHASA) 1
South African Chefs Association (SACA) 2
Other (Please specify) 3
None
Q8. Please indicate the approximate contribution to revenue (percentages) in your
business, derived from the following categories. (Please write the number only and not the percentage sign %)
Business catering (catering for the business market)
Social catering (catering for the social/general market)
Other (please specify)
Q9. Please indicate the approximate contribution to revenue (percentages) in your
business, derived from the following categories. (Please write the number only and not the percentage sign %)
On-premise catering (catering done on your own premises)
Off-premise catering (catering done at location of client’s choice)
Q10. Please indicate the approximate contribution to revenue (percentages) in your
business, derived from the following categories. (Please write the number only and not the percentage sign %)
Budget events (low-priced, low level of service, basic food items)
Midscale events (modestly priced, higher level of service)
Upscale events (high priced, highest level of service)

250
SECTION 2: THE MICRO-ENVIRONMENT
The micro environment entails the internal environment of the business. The factors in this environment are mission, vision, goals, general management (qualities), resources and the various functional areas of the business such as marketing and operations.
Q11. Please indicate whether you have the following in your business.
No
Ye
s
11.1 A mission statement (general purpose of the business) 1 2
11.2 A vision statement (desired position for the future) 1 2
11.3 Objectives/goals for the business 1 2
Q12. Please indicate the extent to which you as the owner/manager in your business possess the following qualities.
Ne
ve
r
Ra
rely
So
me
time
s
Ofte
n
Alw
ays
12.1 Leadership skills 1 2 3 4 5
12.2 Negotiating skills 1 2 3 4 5
12.3 Organisational skills (setting up job categories, allocating authority, responsibility and accountability)
1 2 3 4 5
12.4 Time-management skills 1 2 3 4 5
12.5 Ability to manage stress 1 2 3 4 5
12.6 Knowledge of ingredients used in food 1 2 3 4 5
12.7 Knowledge of social and religious cultures which affect the business
1 2 3 4 5
12.8 Knowledge of social media use 1 2 3 4 5
12.9 Networking skills 1 2 3 4 5
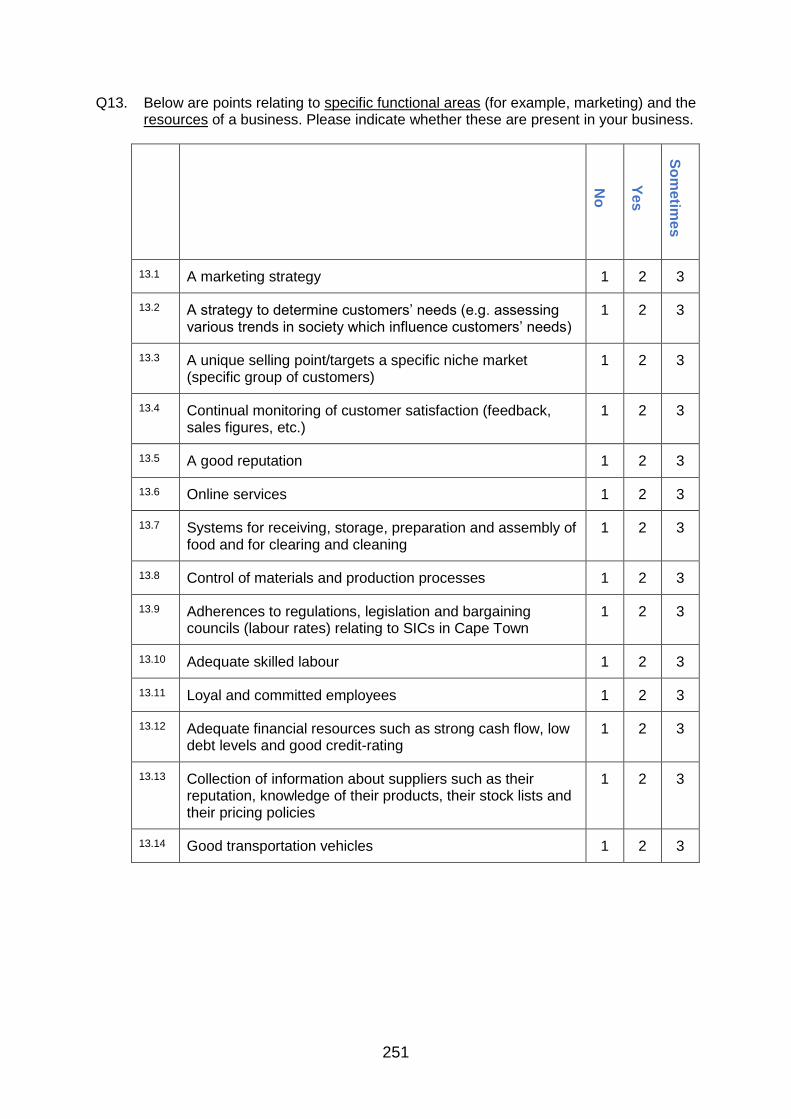
251
Q13. Below are points relating to specific functional areas (for example, marketing) and the resources of a business. Please indicate whether these are present in your business.
No
Ye
s
So
me
time
s
13.1 A marketing strategy 1 2 3
13.2 A strategy to determine customers’ needs (e.g. assessing various trends in society which influence customers’ needs)
1 2 3
13.3 A unique selling point/targets a specific niche market (specific group of customers)
1 2 3
13.4 Continual monitoring of customer satisfaction (feedback, sales figures, etc.)
1 2 3
13.5 A good reputation 1 2 3
13.6 Online services 1 2 3
13.7 Systems for receiving, storage, preparation and assembly of food and for clearing and cleaning
1 2 3
13.8 Control of materials and production processes 1 2 3
13.9 Adherences to regulations, legislation and bargaining councils (labour rates) relating to SICs in Cape Town
1 2 3
13.10 Adequate skilled labour 1 2 3
13.11 Loyal and committed employees 1 2 3
13.12 Adequate financial resources such as strong cash flow, low debt levels and good credit-rating
1 2 3
13.13 Collection of information about suppliers such as their reputation, knowledge of their products, their stock lists and their pricing policies
1 2 3
13.14 Good transportation vehicles 1 2 3

252
SECTION 3: FACTORS IN THE MARKET ENVIRONMENT
The market environment is the part of the external environment found directly outside the business. The sectors in this environment are the market (customers), competitors, suppliers and intermediaries.
Q14. Please indicate whether the factors below, pertaining to customers and competitors, impact your business.
N
ot a
t all
So
me
time
s
Us
ua
lly
Alw
ays
14.1 Customers are more demanding with regard to wanting value for money
1 2 3 4
14.2 Customers have increased product knowledge (e.g. organic foods)
1 2 3 4
14.3 Customers are more informed about various and alternative catering options available to them
1 2 3 4
14.4 Customers switch caterers easily 1 2 3 4
14.5 There is a high degree of rivalry among existing competitors
1 2 3 4
14.6 New competitors (caterers) continually appear in the market
1 2 3 4
14.7 New types of competition or competitive substitute products continually arise
1 2 3 4
14.8 Competitors are continually monitored (e.g. their pricing, menu items, services offered)
1 2 3 4

253
Q15. Please indicate whether the factors below are applicable to your suppliers.
No
t at a
ll
So
me
time
s
Us
ua
lly
Alw
ays
15.1 Your suppliers pay particular attention to quality or standards
1 2 3 4
15.2 Good working relationships and understanding of each other’s responsibilities exist between you and your food suppliers
1 2 3 4
15.3 A good and reasonably priced supply of catering equipment exists in Cape Town
1 2 3 4
15.4 A good and reasonably priced supply of food and beverage products exists in Cape Town
1 2 3 4
15.5 A good supply of catering IT systems (services ranging from hardware, software, installation and training) exists in Cape Town
1 2 3 4
Q16. Please indicate whether the following intermediaries impact your business.
No
t at a
ll
So
me
time
s
Us
ua
lly
Alw
ays
16.1 Wholesalers 1 2 3 4
16.2 Bankers/banks 1 2 3 4
16.3 Insurance agents 1 2 3 4
16.4 Apps which link caterers and customers 1 2 3 4
16.5 Agents such as wedding and event planners (facilitating business between the business and customers)
1 2 3 4

254
SECTION 4: FACTORS IN THE MACRO ENVIRONMENT
The macro environment contains various variables which influence the business indirectly. The sectors in the macro environment are the following: socio-cultural, technological, economic, physical, political-legal and international.
Q17. Please indicate whether the following factors in these sectors impact your business.
N
ot a
t all
So
me
time
s
Us
ua
lly
Alw
ays
17.1 Demographical changes such as the increase in smaller families/increase in double income households
1 2 3 4
17.2 Less time available for consumers for food preparation
1 2 3 4
17.3 The trend toward more healthful eating/use of organic products/vegetarianism
1 2 3 4
17.4 Easy access to the internet, mobile apps and social media by consumers (e.g. accessing caterers’ websites, ordering meals, evaluating catering events)
1 2 3 4
17.5 Effects of the internet on caterers (e.g. new ideas and catering opportunities, faster speed in sourcing food products)
1 2 3 4
17.6 Technological changes in catering software (e.g. online reservation systems, creation of client accounts, stock figures, recipe management)
1 2 3 4
17.7 Unemployment levels/diminished disposable income by consumers
1 2 3 4
17.8 Current state of the economy 1 2 3 4
17.9 Economic impact of water scarcity 1 2 3 4
17.10 Trends in energy conservation (more efficient cooking, refrigeration, dishwasher and ventilation systems)
1 2 3 4
17.11 Trends in waste management and recycling 1 2 3 4
17.12 Trend in presenting businesses as ‘caring for the environment’
1 2 3 4

255
17.13 Regulations relating to food hygiene (e.g. licencing and certification of all food preparation facilities)
1 2 3 4
17.14 Regulations relating to labour issues (e.g. health and safety at work)
1 2 3 4
17.15 Regulations applying to transport of food 1 2 3 4
17.16 Latest catering trends in the international media 1 2 3 4
17.17 Customers gaining knowledge through international travel, of other countries’ foods and beverages
1 2 3 4
Q18. Please state any other factors which currently have a significant impact on your business.
18.1
18.2

256
SECTION 5: DEMOGRAPHICS
Q19. Please indicate your role or position in the business:
Owner 1
Manager (full-time) with insight into the strategic planning of the business
2
Owner who is also the manager (full-time) 3
Other (please specify)
4
Q20. Please state the number of years you have been in this role/position:
Q21. Please indicate your gender:
Male 1 Female 2
Q22. Please indicate your age group:
18 - 30 1
31 - 40 2
41 - 50 3
51 – 60 4
Over 60 5
Thank you very much for your participation.

257
APPENDIX D:
FREQUENCY TABLES OF DESCRIPTIVE STATISTICS
Table 1: Age of Respondents (categories)
Frequency Percent Valid Percent Cumulative
Percent
Valid 18 - 30 13 11.6 11.6 11.6
31 - 40 29 25.9 25.9 37.5
41 - 50 40 35.7 35.7 73.2
51+ yrs 30 26.8 26.8 100.0
Total 112 100.0 100.0
Table 2: Number of Years in Role/Position (categories)
Frequency Percent Valid Percent Cumulative
Percent
Valid 1 - 4 yrs 41 36.6 36.6 36.6
11+ yrs 31 27.7 27.7 64.3
5 - 10 yrs 40 35.7 35.7 100.0
Total 112 100.0 100.0
Table 3: Number of Years Business Has Been In Operation (categories)
Frequency Percent Valid Percent Cumulative
Percent
Valid 1 - 4 yrs 39 34.8 34.8 34.8
13+ yrs 33 29.5 29.5 64.3
5 - 12 yrs 40 35.7 35.7 100.0
Total 112 100.0 100.0
Table 4: Located in Business Premises or House
Frequency Percent Valid Percent Cumulative
Percent
Valid Business premises 48 42.9 42.9 42.9
House 64 57.1 57.1 100.0
Total 112 100.0 100.0

258
Table 5: Number of Employees
Frequency Percent Valid Percent Cumulative
Percent
Valid 0 4 3.6 4.7 4.7
1 20 17.9 23.3 27.9
2 16 14.3 18.6 46.5
3 8 7.1 9.3 55.8
4 9 8.0 10.5 66.3
5 5 4.5 5.8 72.1
6 4 3.6 4.7 76.7
7 3 2.7 3.5 80.2
8 3 2.7 3.5 83.7
9 1 .9 1.2 84.9
10 4 3.6 4.7 89.5
12 2 1.8 2.3 91.9
13 1 .9 1.2 93.0
14 1 .9 1.2 94.2
15 1 .9 1.2 95.3
20 1 .9 1.2 96.5
28 1 .9 1.2 97.7
32 1 .9 1.2 98.8
35 1 .9 1.2 100.0
Total 86 76.8 100.0
Missing System 26 23.2
Total 112 100.0
Table 6: Actively Maintained Website
Frequency Percent Valid Percent Cumulative
Percent
Valid No 47 42.0 42.0 42.0
Yes 65 58.0 58.0 100.0
Total 112 100.0 100.0

259
Table 7: Name of Suburb Where Business is Situated (A1)
Frequency Percent Valid Percent Cumulative
Percent
Valid 1 .9 .9 .9
AIRPORT CITY 1 .9 .9 1.8
ATHLONE 1 .9 .9 2.7
BELLVILLE 1 .9 .9 3.6
BISHOP LAVIS 1 .9 .9 4.5
BONTEHEUWEL CAPE TOWN
1 .9 .9 5.4
BONTEHEUWEL IN CAPE TOWN
1 .9 .9 6.3
BRACKENFELL & MILNERTON
1 .9 .9 7.1
BRAKENFELL 1 .9 .9 8.0
BROOKLYN - CAPE TOWN 1 .9 .9 8.9
CAMPS BAY 1 .9 .9 9.8
CAPE FLATS 1 .9 .9 10.7
CAPE TOWN 1 .9 .9 11.6
CAPE TOWN CBD 1 .9 .9 12.5
CITY BOWL - CBD 1 .9 .9 13.4
CLAREMONT CAPE TOWN 1 .9 .9 14.3
CRAWFORD 1 .9 .9 15.2
CRAWFORD, SOUTHERN SUBURBS
1 .9 .9 16.1
DIEP RIVER 1 .9 .9 17.0
DIEPRIVER, CAPE TOWN 1 .9 .9 17.9
DURBANVILLE 1 .9 .9 18.8
EDGEMEAD 2 1.8 1.8 20.5
FAIRWAYS 1 .9 .9 21.4
FERNESS ESTATE OTTERY 1 .9 .9 22.3
GOODWOOD 4 3.6 3.6 25.9
GORDON'S BAY INDUSTRIAL AREA.
1 .9 .9 26.8
HARFIELD VILLAGE 1 .9 .9 27.7
HELDERBERG 1 .9 .9 28.6
HOUT BAY, CAPE TOWN 1 .9 .9 29.5
KENSINGTON 2 1.8 1.8 31.3

260
KOMMETJIE 1 .9 .9 32.1
KRAAIFONTEIN 1 .9 .9 33.0
KUILS RIVER 1 .9 .9 33.9
LAKESIDE / MUIZENBERG 1 .9 .9 34.8
LANSDOWNE 2 1.8 1.8 36.6
MAITLAND 1 .9 .9 37.5
MANDALAY 1 .9 .9 38.4
MILNERTON 2 1.8 1.8 40.2
MILNERTON, CAPE TOWN 1 .9 .9 41.1
MOWBRAY 2 1.8 1.8 42.9
MUIZENBERG 1 .9 .9 43.8
NORTHERN SUBURB 1 .9 .9 44.6
NORTHERN 2 1.8 1.8 46.4
NORTHERN SUBURB 1 .9 .9 47.3
NORTHERN SUBURB CAPE TOWN
1 .9 .9 48.2
NORTHERN SUBURBS 2 1.8 1.8 50.0
OBSERVATORY 2 1.8 1.8 51.8
OTTERY 1 .9 .9 52.7
OTTERY, CAPE TOWN 1 .9 .9 53.6
PAARDEN EILAND 2 1.8 1.8 55.4
PAARL 2 1.8 1.8 57.1
PANORAMA 1 .9 .9 58.0
PAROW 2 1.8 1.8 59.8
PAROW INDUSTRIA 3 2.7 2.7 62.5
PAROW INDUSTRIAL AREA 1 .9 .9 63.4
PAROW VALLEY 1 .9 .9 64.3
PELICAN PARK 1 .9 .9 65.2
PINELANDS 1 .9 .9 66.1
PLUMSTEAD 5 4.5 4.5 70.5
RAVENSMEAD 1 .9 .9 71.4
RETREAT 3 2.7 2.7 74.1
RONDEBOSCH 1 .9 .9 75.0
ROSEBANK 1 .9 .9 75.9
RYLANDS, CAPE TOWN 1 .9 .9 76.8
SALT RIVER 1 .9 .9 77.7

261
SOMERSET WEST 2 1.8 1.8 79.5
SOMERSET WEST, WESTERN CAPE
1 .9 .9 80.4
SOUTHERN / NORTHERN ( PINELANDS)
1 .9 .9 81.3
SOUTHERN SUBURBS 2 1.8 1.8 83.0
SOUTHERN SUBURBS, CLAREMONT, CAPE TOWN
1 .9 .9 83.9
STELLENBOSCH 4 3.6 3.6 87.5
STELLENBOSCH, WESTERN CAPE
1 .9 .9 88.4
STRAND 1 .9 .9 89.3
STRANDFONTEIN, MITCHELL'S PLAIN SUBURB
1 .9 .9 90.2
TABLE VIEW 1 .9 .9 91.1
TABLEVIEW 1 .9 .9 92.0
WELLINGTON 1 .9 .9 92.9
WELLINGTON WESTERN CAPE
1 .9 .9 93.8
WESTERN CAPE, CAPE TOWN
1 .9 .9 94.6
WETTON 2 1.8 1.8 96.4
WOODSTOCK, CAPE TOWN 2 1.8 1.8 98.2
WOODSTOCK, CAPE TOWN 7925
1 .9 .9 99.1
WYNBERG 1 .9 .9 100.0
Total 112 100.0 100.0
Table 8: Located in Business Premises or House (A2)
Frequency Percent Valid Percent Cumulative
Percent
Valid Business premises 48 42.9 42.9 42.9
House 64 57.1 57.1 100.0
Total 112 100.0 100.0

262
Table 9: Number of Years Business has Been In Operation (A3)
Frequency Percent Valid Percent Cumulative
Percent
Valid 1 9 8.0 8.0 8.0
2 11 9.8 9.8 17.9
3 9 8.0 8.0 25.9
4 10 8.9 8.9 34.8
5 9 8.0 8.0 42.9
6 5 4.5 4.5 47.3
8 2 1.8 1.8 49.1
9 6 5.4 5.4 54.5
10 11 9.8 9.8 64.3
11 3 2.7 2.7 67.0
12 4 3.6 3.6 70.5
13 1 .9 .9 71.4
14 4 3.6 3.6 75.0
15 5 4.5 4.5 79.5
16 2 1.8 1.8 81.3
17 2 1.8 1.8 83.0
18 4 3.6 3.6 86.6
19 1 .9 .9 87.5
20 5 4.5 4.5 92.0
21 1 .9 .9 92.9
22 2 1.8 1.8 94.6
23 1 .9 .9 95.5
25 1 .9 .9 96.4
27 2 1.8 1.8 98.2
33 1 .9 .9 99.1
39 1 .9 .9 100.0
Total 112 100.0 100.0

263
Table 10: Actively Maintained Website (A4.1)
Frequency Percent Valid Percent Cumulative
Percent
Valid No 47 42.0 42.0 42.0
Yes 65 58.0 58.0 100.0
Total 112 100.0 100.0
Table 11: Listing in Online Yellow Pages (A4.2)
Frequency Percent Valid Percent Cumulative
Percent
Valid No 105 93.8 93.8 93.8
Yes 7 6.3 6.3 100.0
Total 112 100.0 100.0
Table 12: Facebook Page (A4.3)
Frequency Percent Valid Percent Cumulative
Percent
Valid No 16 14.3 14.3 14.3
Yes 96 85.7 85.7 100.0
Total 112 100.0 100.0
Table 13: Other Forms of Promotion (A4.other)
Frequency Percent Valid Percent Cumulative
Percent
Valid 56 50.0 50.0 50.0
ADWORDS 2 1.8 1.8 51.8
BUSY SETTING UP A NEW WEBSITE ALSO ON INSTAGRAM
1 .9 .9 52.7
DATABASE AND WHATSAPP
1 .9 .9 53.6
EMAIL AND WHATSAPP 1 .9 .9 54.5
EMAIL CORRESPONDENCE 1 .9 .9 55.4
GOOGLE ADS 1 .9 .9 56.3

264
GOOGLE PAGES 1 .9 .9 57.1
GUMTREE 2 1.8 1.8 58.9
GUMTREE, HOMESTAY, AIRBNB, OLX, WORD OF MOUTH
1 .9 .9 59.8
I'M IN THE PROCESS OF GETTING A NEW WEBSITE THIS WEEK
1 .9 .9 60.7
INSTAGRAM 11 9.8 9.8 70.5
INSTAGRAM, EMAIL, TELEPHONE AND FACE TO FACE MEETINGS
1 .9 .9 71.4
INSTAGRAM 1 .9 .9 72.3
INSTAGRAM 1 .9 .9 73.2
LINKEDIN 2 1.8 1.8 75.0
LISTEN IN NORMAL DIRECTORY
1 .9 .9 75.9
LOCAL PUBLICATIONS 1 .9 .9 76.8
NEWSPAPER 1 .9 .9 77.7
ON THE VENUES WHERE I WORK
1 .9 .9 78.6
RECIPE BOOKS, LOW LEVEL SOCIAL MEDIA, WORD OF MOUTH
1 .9 .9 79.5
REFERRAL 1 .9 .9 80.4
REFERRALS ONLY 1 .9 .9 81.3
REFERRALS AND RETURN BUSINESS
1 .9 .9 82.1
THROUGH MY CATERING JOB AT A SCHOOL
1 .9 .9 83.0
TWITTER 2 1.8 1.8 84.8
VARIOUS SOCIAL MEDIA, GOOGLE ADS, ETC.
1 .9 .9 85.7
VARIOUS WEBSITES 1 .9 .9 86.6
VEHICLE BRANDING 1 .9 .9 87.5
WATSAPP GROUP 1 .9 .9 88.4
WHATSAPP BROADCAST LIST
1 .9 .9 89.3
WORD OF MOUTH 12 10.7 10.7 100.0
Total 112 100.0 100.0

265
Table 14: Size of Business (A5)
Frequency Percent Valid Percent Cumulative
Percent
Valid 3 2.7 2.7 2.7
Other 22 19.6 19.6 22.3
Small business 29 25.9 25.9 48.2
Very small business 58 51.8 51.8 100.0
Total 112 100.0 100.0
Table 15: Size of Business (A5.other)
Frequency Percent Valid Percent Cumulative
Percent
Valid 88 78.6 78.6 78.6
#NAME? 1 .9 .9 79.5
12 MIL TURNOVER ASSETS R6MIL
1 .9 .9 80.4
15MIL+ 1 .9 .9 81.3
ANNUAL TURNOVER IS R130K
1 .9 .9 82.1
LESS R8M ASSETS MORE THAN R2M
1 .9 .9 83.0
LESS THAN A MILLION TURNOVER
1 .9 .9 83.9
LESS THAN R 20 000 ANNUAL
1 .9 .9 84.8
LESS THAN R10 MILLION 1 .9 .9 85.7
LESS THAN R100 000.00 PER ANNUAL
1 .9 .9 86.6
LESS THAN R500 000.00 1 .9 .9 87.5
LESS THAN THAT! I PREDOMINANTLY DO PERSONAL CHEF WORK, WITH SOME CATERING WORK BETWEEN
1 .9 .9 88.4
LESS THEN R1000 1 .9 .9 89.3
MAYBE 15000 TO 30000 1 .9 .9 90.2
MEDIUM 1 .9 .9 91.1
MEDIUM ENTERPRISE 1 .9 .9 92.0
MUCH SMALLER 1 .9 .9 92.9

266
N/A 1 .9 .9 93.8
PART-TIME BUSINESS 1 .9 .9 94.6
R10,000 PER ANNUM 1 .9 .9 95.5
SMALLER 1 .9 .9 96.4
TINY BUSINESS LESS THAN 1 MILLION TURN OVER
1 .9 .9 97.3
TOTAL ANNUAL TURNOVER LESS THAN 1 MILLION
1 .9 .9 98.2
TURNOVER OF ABOUT R300 000 TO 400 000
1 .9 .9 99.1
VERY SMALL BUSINESS- TOTAL ANNUAL TURNOVER LESS THAN R 150.000 AND TOTAL GROSS ASSETS VALUE OF LESS THAN R50.000
1 .9 .9 100.0
Total 112 100.0 100.0
Table 16: Number of Fulltime Employees (A6.1)
Frequency Percent Valid Percent Cumulative
Percent
Valid 0 22 19.6 21.4 21.4
1 20 17.9 19.4 40.8
2 16 14.3 15.5 56.3
3 8 7.1 7.8 64.1
4 8 7.1 7.8 71.8
5 5 4.5 4.9 76.7
6 4 3.6 3.9 80.6
7 3 2.7 2.9 83.5
8 3 2.7 2.9 86.4
9 1 .9 1.0 87.4
10 4 3.6 3.9 91.3
12 2 1.8 1.9 93.2
13 1 .9 1.0 94.2
14 1 .9 1.0 95.1
15 1 .9 1.0 96.1
20 1 .9 1.0 97.1
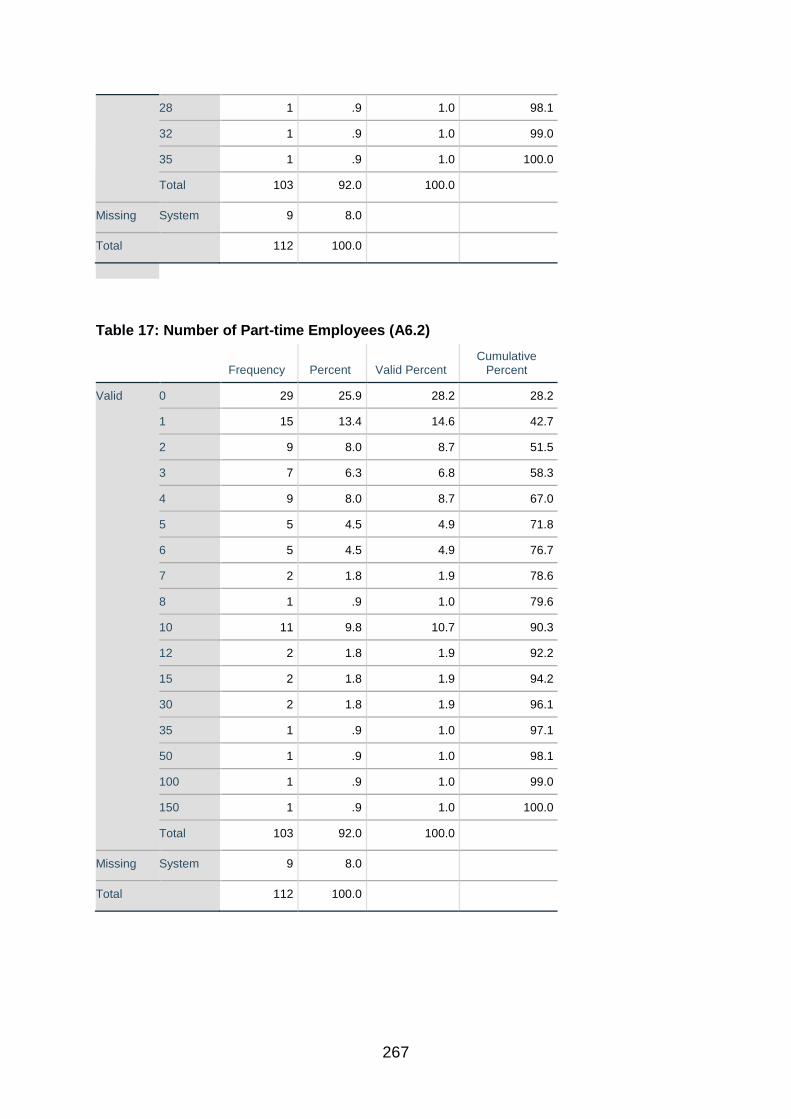
267
28 1 .9 1.0 98.1
32 1 .9 1.0 99.0
35 1 .9 1.0 100.0
Total 103 92.0 100.0
Missing System 9 8.0
Total 112 100.0
Table 17: Number of Part-time Employees (A6.2)
Frequency Percent Valid Percent Cumulative
Percent
Valid 0 29 25.9 28.2 28.2
1 15 13.4 14.6 42.7
2 9 8.0 8.7 51.5
3 7 6.3 6.8 58.3
4 9 8.0 8.7 67.0
5 5 4.5 4.9 71.8
6 5 4.5 4.9 76.7
7 2 1.8 1.9 78.6
8 1 .9 1.0 79.6
10 11 9.8 10.7 90.3
12 2 1.8 1.9 92.2
15 2 1.8 1.9 94.2
30 2 1.8 1.9 96.1
35 1 .9 1.0 97.1
50 1 .9 1.0 98.1
100 1 .9 1.0 99.0
150 1 .9 1.0 100.0
Total 103 92.0 100.0
Missing System 9 8.0
Total 112 100.0

268
Table 18: Number of Seasonal Employees (A6.3)
Frequency Percent Valid Percent Cumulative
Percent
Valid 0 46 41.1 44.7 44.7
1 2 1.8 1.9 46.6
2 7 6.3 6.8 53.4
3 7 6.3 6.8 60.2
4 12 10.7 11.7 71.8
5 5 4.5 4.9 76.7
6 1 .9 1.0 77.7
7 1 .9 1.0 78.6
8 1 .9 1.0 79.6
10 6 5.4 5.8 85.4
11 1 .9 1.0 86.4
12 3 2.7 2.9 89.3
15 2 1.8 1.9 91.3
17 1 .9 1.0 92.2
20 2 1.8 1.9 94.2
24 1 .9 1.0 95.1
25 1 .9 1.0 96.1
30 2 1.8 1.9 98.1
40 1 .9 1.0 99.0
50 1 .9 1.0 100.0
Total 103 92.0 100.0
Missing System 9 8.0
Total 112 100.0
Table 19: Member of FEDHASA or Not (A7.1)
Frequency Percent Valid Percent Cumulative
Percent
Valid No 109 97.3 97.3 97.3
Yes 3 2.7 2.7 100.0
Total 112 100.0 100.0

269
Table 20: Member of SA CHEFS or Not (A7.2)
Frequency Percent Valid Percent Cumulative
Percent
Valid No 107 95.5 95.5 95.5
Yes 5 4.5 4.5 100.0
Total 112 100.0 100.0
Table 21: Not a Member of any Association (A7.3)
Frequency Percent Valid Percent Cumulative
Percent
Valid No 12 10.7 10.7 10.7
Yes 100 89.3 89.3 100.0
Total 112 100.0 100.0
Table 22: Names of other Associations a Member of (A7.other)
Frequency Percent Valid Percent Cumulative
Percent
Valid 108 96.4 96.4 96.4
I'VE BEEN A MEMBER OF SACA, BUT AM NOT AT THE MOMENT
1 .9 .9 97.3
ICSA, SEESA, 1 .9 .9 98.2
RASA, SCASA 1 .9 .9 99.1
WESTERN CAPE SUPPLIER DATABASE
1 .9 .9 100.0
Total 112 100.0 100.0
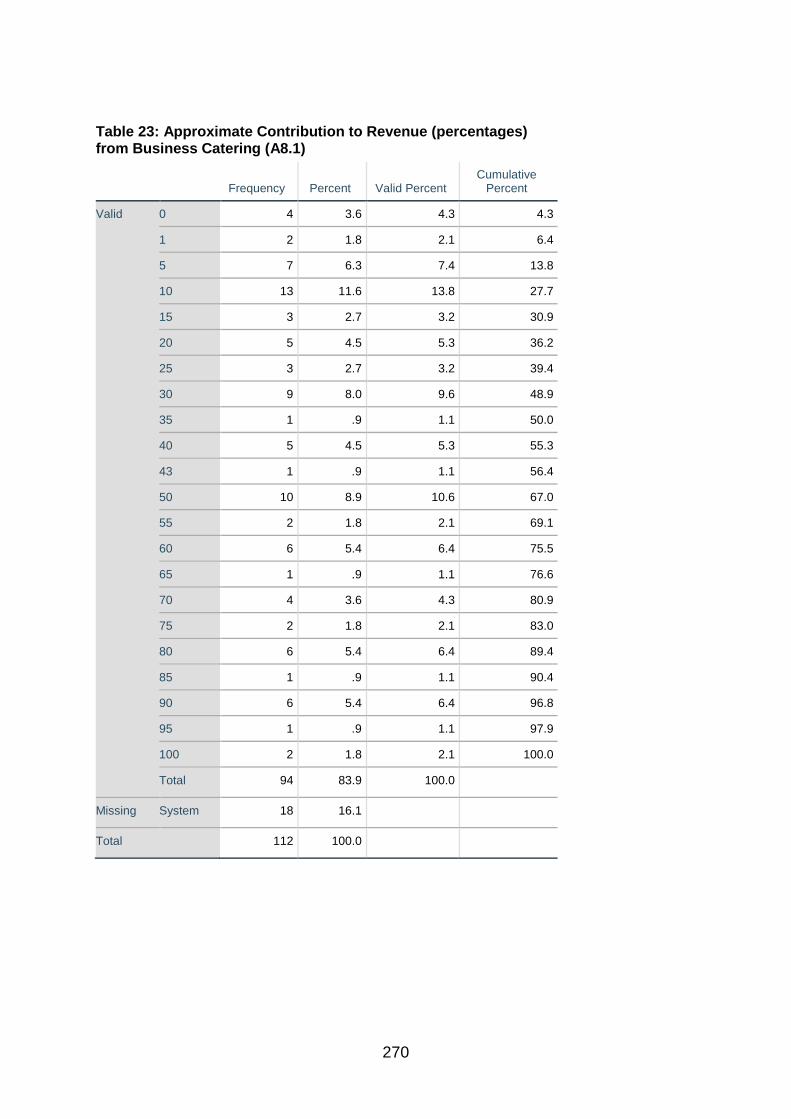
270
Table 23: Approximate Contribution to Revenue (percentages) from Business Catering (A8.1)
Frequency Percent Valid Percent Cumulative
Percent
Valid 0 4 3.6 4.3 4.3
1 2 1.8 2.1 6.4
5 7 6.3 7.4 13.8
10 13 11.6 13.8 27.7
15 3 2.7 3.2 30.9
20 5 4.5 5.3 36.2
25 3 2.7 3.2 39.4
30 9 8.0 9.6 48.9
35 1 .9 1.1 50.0
40 5 4.5 5.3 55.3
43 1 .9 1.1 56.4
50 10 8.9 10.6 67.0
55 2 1.8 2.1 69.1
60 6 5.4 6.4 75.5
65 1 .9 1.1 76.6
70 4 3.6 4.3 80.9
75 2 1.8 2.1 83.0
80 6 5.4 6.4 89.4
85 1 .9 1.1 90.4
90 6 5.4 6.4 96.8
95 1 .9 1.1 97.9
100 2 1.8 2.1 100.0
Total 94 83.9 100.0
Missing System 18 16.1
Total 112 100.0

271
Table 24: Approximate Contribution to Revenue (percentages) from Social Catering (A8.2)
Frequency Percent Valid Percent Cumulative
Percent
Valid 0 2 1.8 2.0 2.0
1 1 .9 1.0 3.1
5 4 3.6 4.1 7.1
10 10 8.9 10.2 17.3
15 3 2.7 3.1 20.4
20 7 6.3 7.1 27.6
25 1 .9 1.0 28.6
30 6 5.4 6.1 34.7
35 2 1.8 2.0 36.7
40 9 8.0 9.2 45.9
45 1 .9 1.0 46.9
50 11 9.8 11.2 58.2
57 1 .9 1.0 59.2
60 6 5.4 6.1 65.3
65 1 .9 1.0 66.3
70 7 6.3 7.1 73.5
75 2 1.8 2.0 75.5
80 4 3.6 4.1 79.6
85 3 2.7 3.1 82.7
90 11 9.8 11.2 93.9
95 2 1.8 2.0 95.9
100 4 3.6 4.1 100.0
Total 98 87.5 100.0
Missing System 14 12.5
Total 112 100.0

272
Table 25: Approximate Contribution to Revenue (percentages) from Other Catering (A8.3)
Frequency Percent Valid Percent Cumulative
Percent
Valid 0 74 66.1 82.2 82.2
5 1 .9 1.1 83.3
10 1 .9 1.1 84.4
15 1 .9 1.1 85.6
20 3 2.7 3.3 88.9
25 1 .9 1.1 90.0
50 4 3.6 4.4 94.4
60 1 .9 1.1 95.6
80 3 2.7 3.3 98.9
90 1 .9 1.1 100.0
Total 90 80.4 100.0
Missing System 22 19.6
Total 112 100.0
Table 26: Total Percentage from all forms of Catering (A8_Total)
Frequency Percent Valid Percent Cumulative
Percent
Valid 1 1 .9 1.0 1.0
6 1 .9 1.0 2.0
10 2 1.8 2.0 4.0
30 1 .9 1.0 5.1
35 1 .9 1.0 6.1
40 1 .9 1.0 7.1
60 1 .9 1.0 8.1
70 2 1.8 2.0 10.1
80 1 .9 1.0 11.1
91 1 .9 1.0 12.1
100 84 75.0 84.8 97.0
105 1 .9 1.0 98.0
110 1 .9 1.0 99.0
200 1 .9 1.0 100.0

273
Total 99 88.4 100.0
Missing System 13 11.6
Total 112 100.0
Table 27: Other Forms of Catering (A8.specify)
Frequency Percent Valid
Percent Cumulative
Percent
Valid 98 87.5 87.5 87.5
B2BPROVIDING HALAL FOOD TO THE HOSPITALITY INDUSTRY. E.G. HOTELS, RESTAURANTS, TOUR OPERATORS, CONFERENCING VENUES ETC
1 .9 .9 88.4
COOKING CLASES 1 .9 .9 89.3
FILM CATERING 1 .9 .9 90.2
FILM INDUSTRY 1 .9 .9 91.1
GOVERNMENT 1 .9 .9 92.0
IT'S A SECRET 1 .9 .9 92.9
MOSTLY CATERING FOR GOVERNMENT DEPARTMENTS
1 .9 .9 93.8
PERSONAL CHEF CLIENTS... ON SITE AND COOKING FROM MY OWN HOME
1 .9 .9 94.6
PRE WEDDING FUNCTIONS 1 .9 .9 95.5
SCHOOL CATERING 1 .9 .9 96.4
SCHOOL FUNCTIONS 1 .9 .9 97.3
TAKEAWAY OUTLET. 1 .9 .9 98.2
TRADE UNIONS AND NGO'S & NPO'S 1 .9 .9 99.1
WE HAVE A BUSY DELI RESTAURANT. AMOUNTS FROM SOCIAL CATERING VARY QUITE DRASTICALLY IN SUMMER, NOVEMBER AND FEBRUARY BEING OUR BUSIEST MONTHS. INCOME FROM CATERED PARTIES (PRIVATE) ACCOUNTED FOR 28% OF INCOME, BUSINESS CATERING 21% AND OUR SHOP THE BALANCE OF THE INCOME.
1 .9 .9 100.0
Total 112 100.0 100.0

274
Table 28: Approximate Contribution to Revenue (percentages) from On-Premise Catering (A9.1)
Frequency Percent Valid Percent Cumulative
Percent
Valid 0 22 19.6 23.2 23.2
1 3 2.7 3.2 26.3
5 2 1.8 2.1 28.4
10 6 5.4 6.3 34.7
15 2 1.8 2.1 36.8
16 1 .9 1.1 37.9
20 4 3.6 4.2 42.1
25 1 .9 1.1 43.2
30 2 1.8 2.1 45.3
40 1 .9 1.1 46.3
50 11 9.8 11.6 57.9
60 2 1.8 2.1 60.0
70 6 5.4 6.3 66.3
75 2 1.8 2.1 68.4
80 2 1.8 2.1 70.5
85 4 3.6 4.2 74.7
90 10 8.9 10.5 85.3
95 4 3.6 4.2 89.5
98 1 .9 1.1 90.5
99 1 .9 1.1 91.6
100 8 7.1 8.4 100.0
Total 95 84.8 100.0
Missing System 17 15.2
Total 112 100.0

275
Table 29: Approximate Contribution to Revenue (percentages) from Off-Premise Catering (A9.2)
Frequency Percent Valid Percent Cumulative
Percent
Valid 0 8 7.1 8.6 8.6
1 1 .9 1.1 9.7
2 1 .9 1.1 10.8
4 1 .9 1.1 11.8
5 4 3.6 4.3 16.1
10 11 9.8 11.8 28.0
15 4 3.6 4.3 32.3
20 4 3.6 4.3 36.6
25 2 1.8 2.2 38.7
30 5 4.5 5.4 44.1
40 2 1.8 2.2 46.2
50 11 9.8 11.8 58.1
70 1 .9 1.1 59.1
75 1 .9 1.1 60.2
80 4 3.6 4.3 64.5
84 1 .9 1.1 65.6
85 2 1.8 2.2 67.7
90 5 4.5 5.4 73.1
95 2 1.8 2.2 75.3
99 1 .9 1.1 76.3
100 22 19.6 23.7 100.0
Total 93 83.0 100.0
Missing System 19 17.0
Total 112 100.0
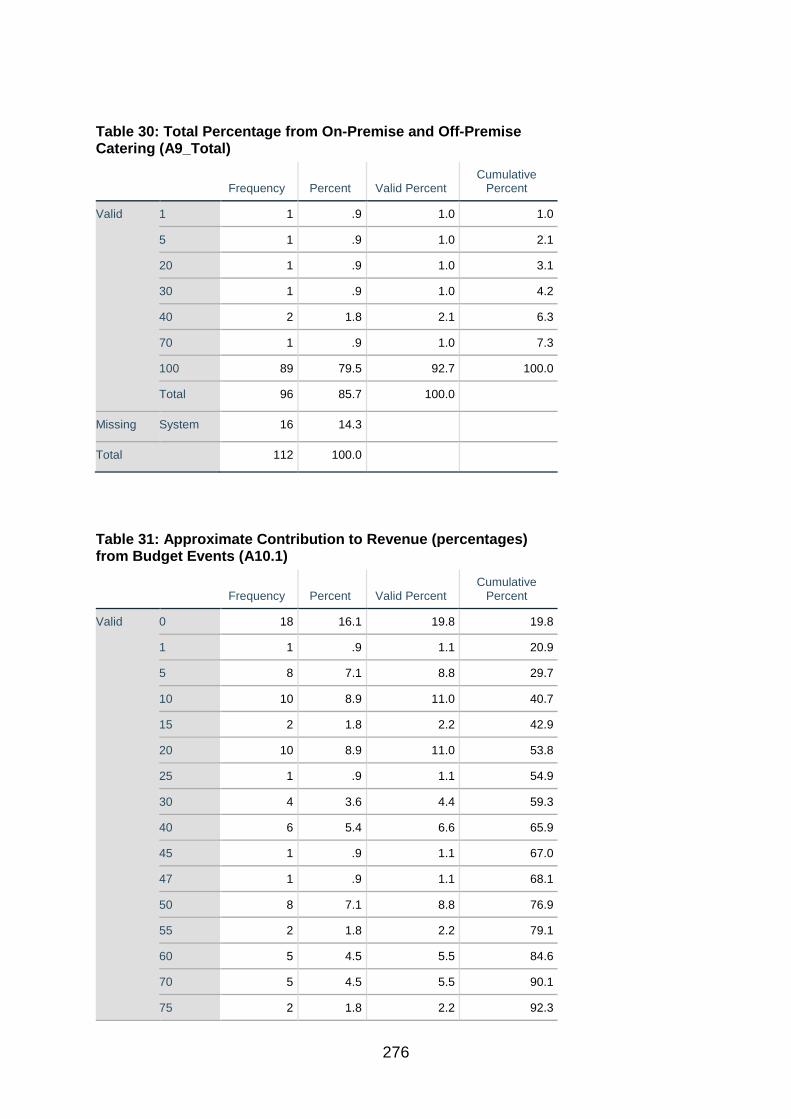
276
Table 30: Total Percentage from On-Premise and Off-Premise Catering (A9_Total)
Frequency Percent Valid Percent Cumulative
Percent
Valid 1 1 .9 1.0 1.0
5 1 .9 1.0 2.1
20 1 .9 1.0 3.1
30 1 .9 1.0 4.2
40 2 1.8 2.1 6.3
70 1 .9 1.0 7.3
100 89 79.5 92.7 100.0
Total 96 85.7 100.0
Missing System 16 14.3
Total 112 100.0
Table 31: Approximate Contribution to Revenue (percentages) from Budget Events (A10.1)
Frequency Percent Valid Percent Cumulative
Percent
Valid 0 18 16.1 19.8 19.8
1 1 .9 1.1 20.9
5 8 7.1 8.8 29.7
10 10 8.9 11.0 40.7
15 2 1.8 2.2 42.9
20 10 8.9 11.0 53.8
25 1 .9 1.1 54.9
30 4 3.6 4.4 59.3
40 6 5.4 6.6 65.9
45 1 .9 1.1 67.0
47 1 .9 1.1 68.1
50 8 7.1 8.8 76.9
55 2 1.8 2.2 79.1
60 5 4.5 5.5 84.6
70 5 4.5 5.5 90.1
75 2 1.8 2.2 92.3

277
80 3 2.7 3.3 95.6
90 1 .9 1.1 96.7
95 1 .9 1.1 97.8
100 2 1.8 2.2 100.0
Total 91 81.3 100.0
Missing System 21 18.8
Total 112 100.0
Table 32: A Approximate Contribution to Revenue (percentages) from Midscale Events (A10.2)
Frequency Percent Valid Percent Cumulative
Percent
Valid 0 4 3.6 4.3 4.3
5 1 .9 1.1 5.4
10 8 7.1 8.6 14.0
15 1 .9 1.1 15.1
20 11 9.8 11.8 26.9
25 6 5.4 6.5 33.3
30 5 4.5 5.4 38.7
35 3 2.7 3.2 41.9
40 10 8.9 10.8 52.7
41 1 .9 1.1 53.8
45 2 1.8 2.2 55.9
50 10 8.9 10.8 66.7
55 1 .9 1.1 67.7
60 9 8.0 9.7 77.4
70 6 5.4 6.5 83.9
75 2 1.8 2.2 86.0
80 4 3.6 4.3 90.3
90 3 2.7 3.2 93.5
100 6 5.4 6.5 100.0
Total 93 83.0 100.0
Missing System 19 17.0
Total 112 100.0
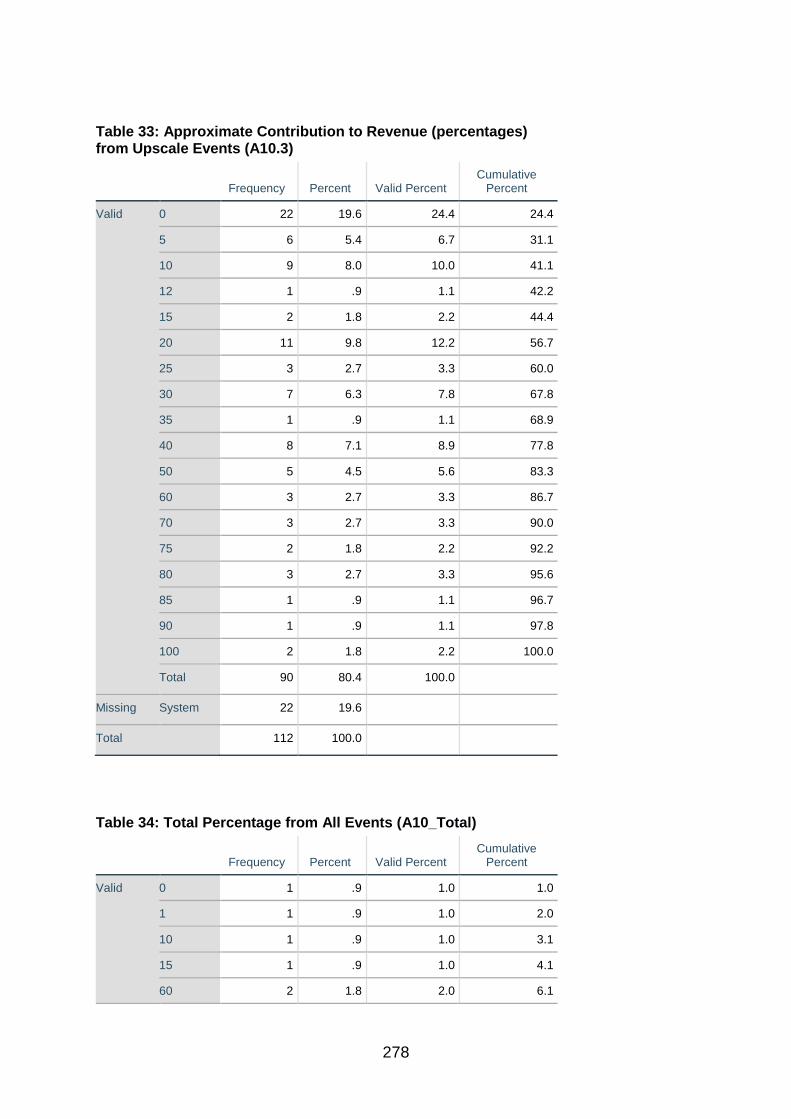
278
Table 33: Approximate Contribution to Revenue (percentages) from Upscale Events (A10.3)
Frequency Percent Valid Percent Cumulative
Percent
Valid 0 22 19.6 24.4 24.4
5 6 5.4 6.7 31.1
10 9 8.0 10.0 41.1
12 1 .9 1.1 42.2
15 2 1.8 2.2 44.4
20 11 9.8 12.2 56.7
25 3 2.7 3.3 60.0
30 7 6.3 7.8 67.8
35 1 .9 1.1 68.9
40 8 7.1 8.9 77.8
50 5 4.5 5.6 83.3
60 3 2.7 3.3 86.7
70 3 2.7 3.3 90.0
75 2 1.8 2.2 92.2
80 3 2.7 3.3 95.6
85 1 .9 1.1 96.7
90 1 .9 1.1 97.8
100 2 1.8 2.2 100.0
Total 90 80.4 100.0
Missing System 22 19.6
Total 112 100.0
Table 34: Total Percentage from All Events (A10_Total)
Frequency Percent Valid Percent Cumulative
Percent
Valid 0 1 .9 1.0 1.0
1 1 .9 1.0 2.0
10 1 .9 1.0 3.1
15 1 .9 1.0 4.1
60 2 1.8 2.0 6.1

279
65 1 .9 1.0 7.1
70 1 .9 1.0 8.2
80 1 .9 1.0 9.2
90 1 .9 1.0 10.2
95 1 .9 1.0 11.2
100 85 75.9 86.7 98.0
105 1 .9 1.0 99.0
170 1 .9 1.0 100.0
Total 98 87.5 100.0
Missing System 14 12.5
Total 112 100.0
Table 35: Business has Mission Statement (B11.1)
Frequency Percent Valid Percent Cumulative
Percent
Valid No 45 40.2 40.2 40.2
Yes 67 59.8 59.8 100.0
Total 112 100.0 100.0
Table 36: Business has Vision Statement (B11.2)
Frequency Percent Valid Percent Cumulative
Percent
Valid No 47 42.0 42.0 42.0
Yes 65 58.0 58.0 100.0
Total 112 100.0 100.0
Table 37: Business has Objectives/Goals (B11.3)
Frequency Percent Valid Percent Cumulative
Percent
Valid No 25 22.3 22.3 22.3
Yes 87 77.7 77.7 100.0
Total 112 100.0 100.0

280
Table 38: Extent to which Owner/Manager Possesses Leadership Skills (B12.1)
Frequency Percent Valid Percent Cumulative Percent
Valid 2 2 1.8 1.8 1.8
3 5 4.5 4.5 6.3
4 22 19.6 19.6 25.9
5 83 74.1 74.1 100.0
Total 112 100.0 100.0
Table 39: Extent to which Owner/Manager Possesses Negotiating Skills (B12.2)
Frequency Percent Valid Percent Cumulative Percent
Valid 2 2 1.8 1.8 1.8
3 17 15.2 15.2 17.0
4 27 24.1 24.1 41.1
5 66 58.9 58.9 100.0
Total 112 100.0 100.0
Table 40: Extent to which Owner/Manager Possesses Organisational Skills (B12.3)
Frequency Percent Valid Percent Cumulative Percent
Valid 2 2 1.8 1.8 1.8
3 9 8.0 8.0 9.8
4 15 13.4 13.4 23.2
5 86 76.8 76.8 100.0
Total 112 100.0 100.0
Table 41: Extent to which Owner/Manager Possesses Time-management Skills (B12.4)
Frequency Percent Valid Percent Cumulative Percent
Valid 2 5 4.5 4.5 4.5
3 8 7.1 7.1 11.6
4 22 19.6 19.6 31.3
5 77 68.8 68.8 100.0
Total 112 100.0 100.0

281
Table 42: Extent to which Owner/Manager Possesses Ability to Manage Stress (B12.5)
Frequency Percent Valid Percent Cumulative
Percent
Valid 1 1 .9 .9 .9
2 2 1.8 1.8 2.7
3 14 12.5 12.5 15.2
4 29 25.9 25.9 41.1
5 66 58.9 58.9 100.0
Total 112 100.0 100.0
Table 43: Extent to which Owner/Manager Possesses Knowledge of Ingredients Used in Food (B12.6)
Frequency Percent Valid Percent Cumulative
Percent
Valid 3 4 3.6 3.6 3.6
4 17 15.2 15.2 18.8
5 91 81.3 81.3 100.0
Total 112 100.0 100.0
Table 44: Extent to which Owner/Manager Possesses Knowledge of Social And Religious Cultures Which Affect The Business (B12.7)
Frequency Percent Valid Percent Cumulative
Percent
Valid 1 2 1.8 1.8 1.8
2 6 5.4 5.4 7.1
3 5 4.5 4.5 11.6
4 21 18.8 18.8 30.4
5 78 69.6 69.6 100.0
Total 112 100.0 100.0

282
Table 45: Extent to which Owner/Manager Possesses Knowledge of Social Media Use (B12.8)
Frequency Percent Valid Percent Cumulative
Percent
Valid 1 4 3.6 3.6 3.6
2 5 4.5 4.5 8.0
3 24 21.4 21.4 29.5
4 27 24.1 24.1 53.6
5 52 46.4 46.4 100.0
Total 112 100.0 100.0
Table 46: Extent to which Owner/Manager Possesses Networking Skills (B12.9)
Frequency Percent Valid Percent Cumulative
Percent
Valid 1 4 3.6 3.6 3.6
2 7 6.3 6.3 9.8
3 25 22.3 22.3 32.1
4 22 19.6 19.6 51.8
5 54 48.2 48.2 100.0
Total 112 100.0 100.0
Table 47: Business has a Marketing Strategy (B13.1)
Frequency Percent Valid Percent Cumulative
Percent
Valid No 27 24.1 24.1 24.1
Sometimes 39 34.8 34.8 58.9
Yes 46 41.1 41.1 100.0
Total 112 100.0 100.0

283
Table 48: Business has a Strategy to Determine Customers’ Needs (B13.2)
Frequency Percent Valid Percent Cumulative
Percent
Valid No 17 15.2 15.2 15.2
Sometimes 28 25.0 25.0 40.2
Yes 67 59.8 59.8 100.0
Total 112 100.0 100.0
Table 49: Business has a Unique Selling Point/Targets a Specific Niche Market (B13.3)
Frequency Percent Valid Percent Cumulative
Percent
Valid No 17 15.2 15.2 15.2
Sometimes 28 25.0 25.0 40.2
Yes 67 59.8 59.8 100.0
Total 112 100.0 100.0
Table 50: Business Continually Monitors Customer Satisfaction (B13.4)
Frequency Percent Valid Percent Cumulative
Percent
Valid No 5 4.5 4.5 4.5
Sometimes 15 13.4 13.4 17.9
Yes 92 82.1 82.1 100.0
Total 112 100.0 100.0
Table 51: Business has a Good Reputation (B13.5)
Frequency Percent Valid Percent Cumulative
Percent
Valid Sometimes 2 1.8 1.8 1.8
Yes 110 98.2 98.2 100.0
Total 112 100.0 100.0

284
Table 52: Business has Online Services (B13.6)
Frequency Percent Valid Percent Cumulative
Percent
Valid No 48 42.9 42.9 42.9
Sometimes 20 17.9 17.9 60.7
Yes 44 39.3 39.3 100.0
Total 112 100.0 100.0
Table 53: Business has Systems For Receiving, Storage, Preparation and Assembly of Food and for Clearing and Cleaning (B13.7)
Frequency Percent Valid Percent Cumulative
Percent
Valid No 9 8.0 8.0 8.0
Sometimes 9 8.0 8.0 16.1
Yes 94 83.9 83.9 100.0
Total 112 100.0 100.0
Table 54: Business has Control of Materials and Production Processes (B13.8)
Frequency Percent Valid Percent Cumulative
Percent
Valid No 8 7.1 7.1 7.1
Sometimes 7 6.3 6.3 13.4
Yes 97 86.6 86.6 100.0
Total 112 100.0 100.0
Table 55: Business Adheres to Laws and Bargaining Councils (Labour Rates) Relating to SICs in Cape Town (B13.9)
Frequency Percent Valid Percent Cumulative
Percent
Valid No 21 18.8 18.8 18.8
Sometimes 12 10.7 10.7 29.5
Yes 79 70.5 70.5 100.0
Total 112 100.0 100.0

285
Table 56: Business has Adequate Skilled Labour (B13.10)
Frequency Percent Valid Percent Cumulative
Percent
Valid No 13 11.6 11.6 11.6
Sometimes 20 17.9 17.9 29.5
Yes 79 70.5 70.5 100.0
Total 112 100.0 100.0
Table 57: Business has Loyal and Committed Employees (B13.11)
Frequency Percent Valid Percent Cumulative
Percent
Valid No 8 7.1 7.1 7.1
Sometimes 15 13.4 13.4 20.5
Yes 89 79.5 79.5 100.0
Total 112 100.0 100.0
Table 58: Business has Adequate Financial Resources (B13.12)
Frequency Percent Valid Percent Cumulative
Percent
Valid No 14 12.5 12.5 12.5
Sometimes 30 26.8 26.8 39.3
Yes 68 60.7 60.7 100.0
Total 112 100.0 100.0
Table 59: Business Collects Information About Suppliers (B13.13)
Frequency Percent Valid Percent Cumulative
Percent
Valid No 13 11.6 11.6 11.6
Sometimes 20 17.9 17.9 29.5
Yes 79 70.5 70.5 100.0
Total 112 100.0 100.0
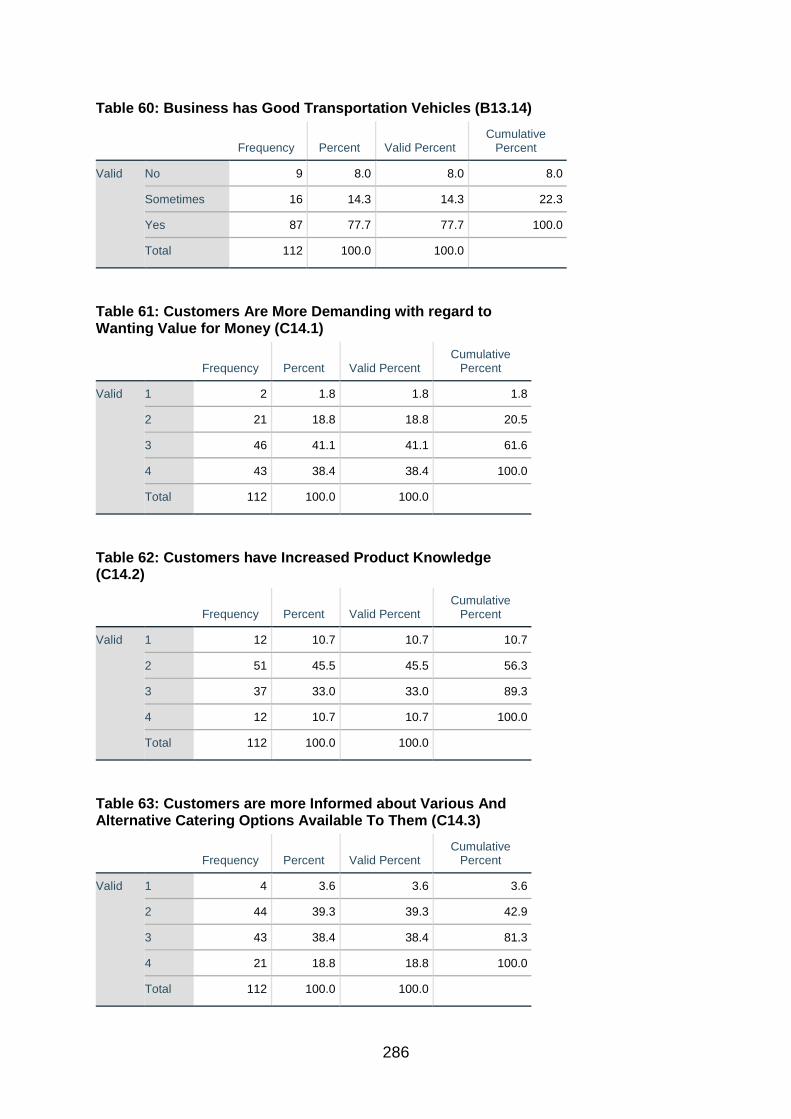
286
Table 60: Business has Good Transportation Vehicles (B13.14)
Frequency Percent Valid Percent Cumulative
Percent
Valid No 9 8.0 8.0 8.0
Sometimes 16 14.3 14.3 22.3
Yes 87 77.7 77.7 100.0
Total 112 100.0 100.0
Table 61: Customers Are More Demanding with regard to Wanting Value for Money (C14.1)
Frequency Percent Valid Percent Cumulative
Percent
Valid 1 2 1.8 1.8 1.8
2 21 18.8 18.8 20.5
3 46 41.1 41.1 61.6
4 43 38.4 38.4 100.0
Total 112 100.0 100.0
Table 62: Customers have Increased Product Knowledge (C14.2)
Frequency Percent Valid Percent Cumulative
Percent
Valid 1 12 10.7 10.7 10.7
2 51 45.5 45.5 56.3
3 37 33.0 33.0 89.3
4 12 10.7 10.7 100.0
Total 112 100.0 100.0
Table 63: Customers are more Informed about Various And Alternative Catering Options Available To Them (C14.3)
Frequency Percent Valid Percent Cumulative
Percent
Valid 1 4 3.6 3.6 3.6
2 44 39.3 39.3 42.9
3 43 38.4 38.4 81.3
4 21 18.8 18.8 100.0
Total 112 100.0 100.0

287
Table 64: Customers Switch Caterers Easily (C14.4)
Frequency Percent Valid Percent Cumulative
Percent
Valid 1 13 11.6 11.6 11.6
2 62 55.4 55.4 67.0
3 24 21.4 21.4 88.4
4 13 11.6 11.6 100.0
Total 112 100.0 100.0
Table 65: There is a High Degree of Rivalry Among Existing Competitors (C14.5)
Frequency Percent Valid Percent Cumulative
Percent
Valid 1 22 19.6 19.6 19.6
2 38 33.9 33.9 53.6
3 23 20.5 20.5 74.1
4 29 25.9 25.9 100.0
Total 112 100.0 100.0
Table 66: New Competitors (Caterers) Continually Appear in the Market (C14.6)
Frequency Percent Valid Percent Cumulative
Percent
Valid 1 4 3.6 3.6 3.6
2 31 27.7 27.7 31.3
3 23 20.5 20.5 51.8
4 54 48.2 48.2 100.0
Total 112 100.0 100.0

288
Table 67: New Types Of Competition or Competitive Substitute Products Continually Arise (C14.7)
Frequency Percent Valid Percent Cumulative
Percent
Valid 1 8 7.1 7.1 7.1
2 36 32.1 32.1 39.3
3 23 20.5 20.5 59.8
4 45 40.2 40.2 100.0
Total 112 100.0 100.0
Table 68: Competitors are Continually Monitored (C14.8)
Frequency Percent Valid Percent Cumulative
Percent
Valid 1 12 10.7 10.7 10.7
2 35 31.3 31.3 42.0
3 26 23.2 23.2 65.2
4 39 34.8 34.8 100.0
Total 112 100.0 100.0
Table 69: Suppliers Pay Particular Attention to Quality or Standards (C15.1)
Frequency Percent Valid Percent Cumulative
Percent
Valid 1 2 1.8 1.8 1.8
2 15 13.4 13.4 15.2
3 38 33.9 33.9 49.1
4 57 50.9 50.9 100.0
Total 112 100.0 100.0

289
Table 70: Good Working Relationships Exist With Food Suppliers (C15.2)
Frequency Percent Valid Percent Cumulative
Percent
Valid 1 1 .9 .9 .9
2 9 8.0 8.0 8.9
3 32 28.6 28.6 37.5
4 70 62.5 62.5 100.0
Total 112 100.0 100.0
Table 71: Good and Reasonably Priced Supply of Catering Equipment Exists in Cape Town (C15.3)
Frequency Percent Valid Percent Cumulative
Percent
Valid 1 6 5.4 5.4 5.4
2 34 30.4 30.4 35.7
3 42 37.5 37.5 73.2
4 30 26.8 26.8 100.0
Total 112 100.0 100.0
Table 72: Good and Reasonably Priced Supply of Food and Beverage Products Exists in Cape Town (C15.4)
Frequency Percent Valid Percent Cumulative
Percent
Valid 1 4 3.6 3.6 3.6
2 22 19.6 19.6 23.2
3 52 46.4 46.4 69.6
4 34 30.4 30.4 100.0
Total 112 100.0 100.0

290
Table 73: Good Supply Of Catering IT Systems Exists in Cape Town (C15.5)
Frequency Percent Valid Percent Cumulative
Percent
Valid 1 23 20.5 20.5 20.5
2 36 32.1 32.1 52.7
3 33 29.5 29.5 82.1
4 20 17.9 17.9 100.0
Total 112 100.0 100.0
Table 74: Extent to which Wholesalers Impact the Business (C16.1)
Frequency Percent Valid Percent Cumulative
Percent
Valid 1 24 21.4 21.4 21.4
2 33 29.5 29.5 50.9
3 22 19.6 19.6 70.5
4 33 29.5 29.5 100.0
Total 112 100.0 100.0
Table 75: Extent to which Bankers/Banks Impact the Business (C16.2)
Frequency Percent Valid Percent Cumulative
Percent
Valid 1 44 39.3 39.3 39.3
2 30 26.8 26.8 66.1
3 13 11.6 11.6 77.7
4 25 22.3 22.3 100.0
Total 112 100.0 100.0

291
Table 76: Extent to which Insurance Agents Impact the Business (C16.3)
Frequency Percent Valid Percent Cumulative
Percent
Valid 1 61 54.5 54.5 54.5
2 32 28.6 28.6 83.0
3 8 7.1 7.1 90.2
4 11 9.8 9.8 100.0
Total 112 100.0 100.0
Table 77: Extent to which Apps which link Caterers and Customers Impact the Business (C16.4)
Frequency Percent Valid Percent Cumulative
Percent
Valid 1 63 56.3 56.3 56.3
2 28 25.0 25.0 81.3
3 8 7.1 7.1 88.4
4 13 11.6 11.6 100.0
Total 112 100.0 100.0
Table 78: Extent to which Agents such as Wedding and Event Planners Impact the Business (C16.5)
Frequency Percent Valid Percent Cumulative
Percent
Valid 1 28 25.0 25.0 25.0
2 42 37.5 37.5 62.5
3 23 20.5 20.5 83.0
4 19 17.0 17.0 100.0
Total 112 100.0 100.0

292
Table 79: Impact of Demographical Changes such as the Increase in Smaller Families/Increase in Double Income Households (D17.1)
Frequency Percent Valid Percent Cumulative
Percent
Valid 1 36 32.1 32.1 32.1
2 47 42.0 42.0 74.1
3 17 15.2 15.2 89.3
4 12 10.7 10.7 100.0
Total 112 100.0 100.0
Table 80: Impact of Less Time Available for Consumers for Food Preparation (D17.2)
Frequency Percent Valid Percent Cumulative
Percent
Valid 1 24 21.4 21.4 21.4
2 43 38.4 38.4 59.8
3 30 26.8 26.8 86.6
4 15 13.4 13.4 100.0
Total 112 100.0 100.0
Table 81: Impact of the Trend Toward More Healthful Eating/Use of Organic Products/Vegetarianism (D17.3)
Frequency Percent Valid Percent Cumulative
Percent
Valid 1 17 15.2 15.2 15.2
2 49 43.8 43.8 58.9
3 24 21.4 21.4 80.4
4 22 19.6 19.6 100.0
Total 112 100.0 100.0
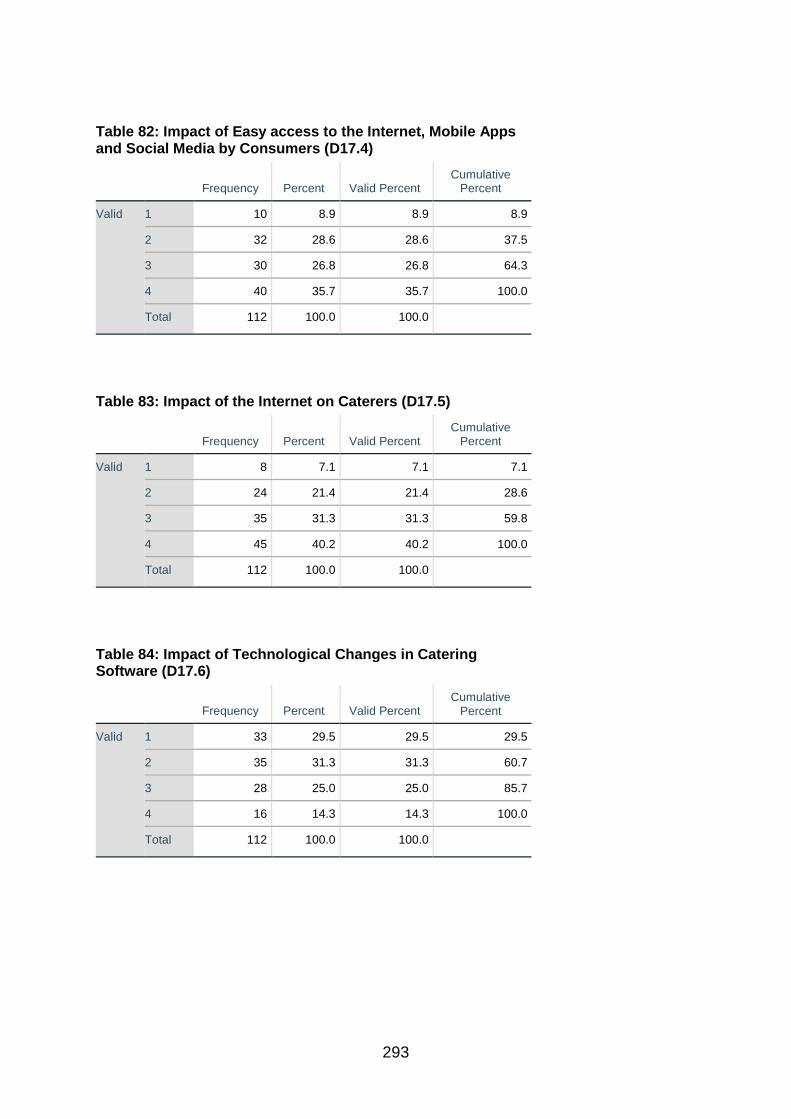
293
Table 82: Impact of Easy access to the Internet, Mobile Apps and Social Media by Consumers (D17.4)
Frequency Percent Valid Percent Cumulative
Percent
Valid 1 10 8.9 8.9 8.9
2 32 28.6 28.6 37.5
3 30 26.8 26.8 64.3
4 40 35.7 35.7 100.0
Total 112 100.0 100.0
Table 83: Impact of the Internet on Caterers (D17.5)
Frequency Percent Valid Percent Cumulative
Percent
Valid 1 8 7.1 7.1 7.1
2 24 21.4 21.4 28.6
3 35 31.3 31.3 59.8
4 45 40.2 40.2 100.0
Total 112 100.0 100.0
Table 84: Impact of Technological Changes in Catering Software (D17.6)
Frequency Percent Valid Percent Cumulative
Percent
Valid 1 33 29.5 29.5 29.5
2 35 31.3 31.3 60.7
3 28 25.0 25.0 85.7
4 16 14.3 14.3 100.0
Total 112 100.0 100.0

294
Table 85: Impact of Unemployment Levels/Diminished Disposable Income by Consumers (D17.7)
Frequency Percent Valid Percent Cumulative
Percent
Valid 1 24 21.4 21.4 21.4
2 45 40.2 40.2 61.6
3 27 24.1 24.1 85.7
4 16 14.3 14.3 100.0
Total 112 100.0 100.0
Table 86: Impact of Current state of the Economy (D17.8)
Frequency Percent Valid Percent Cumulative
Percent
Valid 1 6 5.4 5.4 5.4
2 32 28.6 28.6 33.9
3 26 23.2 23.2 57.1
4 48 42.9 42.9 100.0
Total 112 100.0 100.0
Table 87: Economic Impact of Water Scarcity (D17.9)
Frequency Percent Valid Percent Cumulative
Percent
Valid 1 13 11.6 11.6 11.6
2 31 27.7 27.7 39.3
3 22 19.6 19.6 58.9
4 46 41.1 41.1 100.0
Total 112 100.0 100.0

295
Table 88: Impact of Trends in Energy Conservation (D17.10)
Frequency Percent Valid Percent Cumulative
Percent
Valid 1 20 17.9 17.9 17.9
2 37 33.0 33.0 50.9
3 26 23.2 23.2 74.1
4 29 25.9 25.9 100.0
Total 112 100.0 100.0
Table 89: Impact of Trends in Waste Management and Recycling (D17.11)
Frequency Percent Valid Percent Cumulative
Percent
Valid 1 28 25.0 25.0 25.0
2 33 29.5 29.5 54.5
3 24 21.4 21.4 75.9
4 27 24.1 24.1 100.0
Total 112 100.0 100.0
Table 90: Impact of Trend in Presenting Businesses as ‘Caring For the Environment’ (D17.12)
Frequency Percent Valid Percent Cumulative
Percent
Valid 1 21 18.8 18.8 18.8
2 34 30.4 30.4 49.1
3 22 19.6 19.6 68.8
4 35 31.3 31.3 100.0
Total 112 100.0 100.0

296
Table 91: Impact of Laws Relating to Food Hygiene (D17.13)
Frequency Percent Valid Percent Cumulative
Percent
Valid 1 14 12.5 12.5 12.5
2 23 20.5 20.5 33.0
3 28 25.0 25.0 58.0
4 47 42.0 42.0 100.0
Total 112 100.0 100.0
Table 92: Impact of Laws Relating to Labour Issues (D17.14)
Frequency Percent Valid Percent Cumulative
Percent
Valid 1 22 19.6 19.6 19.6
2 25 22.3 22.3 42.0
3 18 16.1 16.1 58.0
4 47 42.0 42.0 100.0
Total 112 100.0 100.0
Table 93: Impact of Laws Applying to Transport Of Food (D17.15)
Frequency Percent Valid Percent Cumulative
Percent
Valid 1 27 24.1 24.1 24.1
2 25 22.3 22.3 46.4
3 22 19.6 19.6 66.1
4 38 33.9 33.9 100.0
Total 112 100.0 100.0

297
Table 94: Impact of Latest Catering Trends in the International Media (D17.16)
Frequency Percent Valid Percent Cumulative
Percent
Valid 1 23 20.5 20.5 20.5
2 40 35.7 35.7 56.3
3 25 22.3 22.3 78.6
4 24 21.4 21.4 100.0
Total 112 100.0 100.0
Table 95: Impact of Customers Gaining Knowledge Through International Travel, of Other Countries’ Foods and Beverages (D17.17)
Frequency Percent Valid Percent Cumulative
Percent
Valid 1 22 19.6 19.6 19.6
2 44 39.3 39.3 58.9
3 20 17.9 17.9 76.8
4 26 23.2 23.2 100.0
Total 112 100.0 100.0
Table 96: Impact of any Other Factors which Currently have a Significant Impact on the Business (D18.1)
Frequency Percent Valid Percent Cumulative
Percent
Valid Competition related 2 1.8 1.8 1.8
Customer related 6 5.4 5.4 7.1
Economy/Economic - price increases etc.
17 15.2 15.2 22.3
Environmental issues - water etc.
8 7.1 7.1 29.5
Government related - regulations etc.
5 4.5 4.5 33.9
Internal factors - staffing etc. 7 6.3 6.3 40.2
No comments given 67 59.8 59.8 100.0
Total 112 100.0 100.0
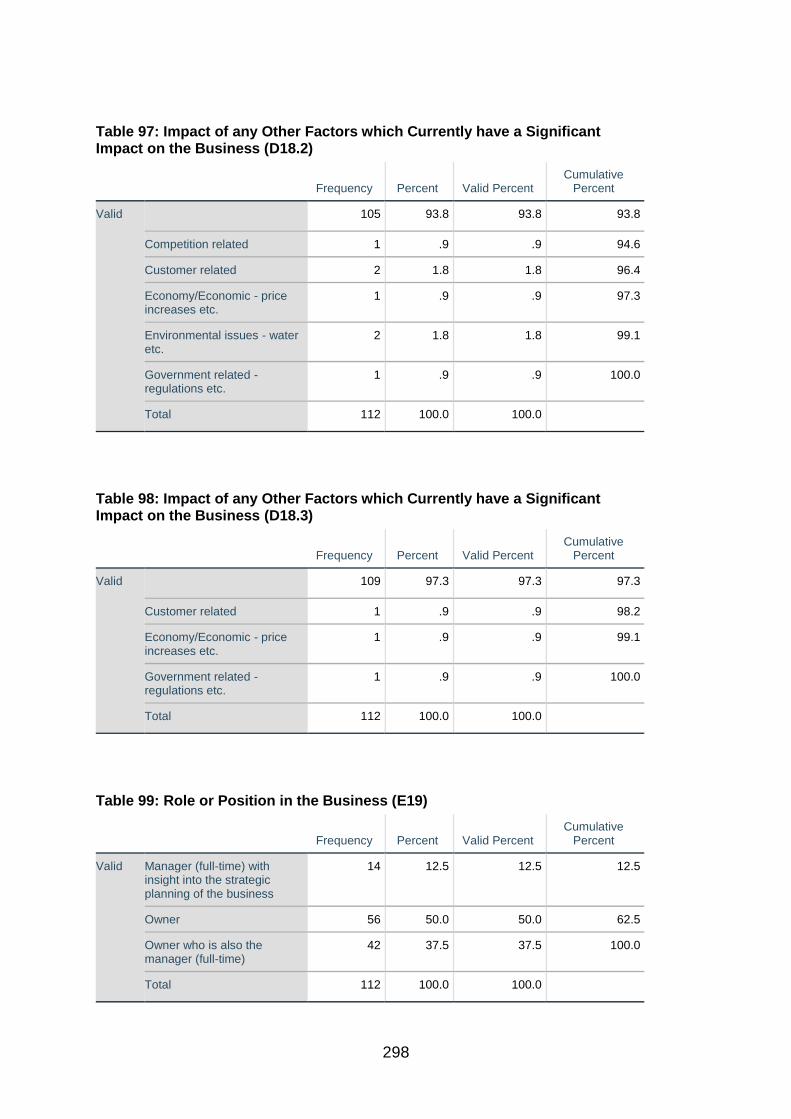
298
Table 97: Impact of any Other Factors which Currently have a Significant Impact on the Business (D18.2)
Frequency Percent Valid Percent Cumulative
Percent
Valid 105 93.8 93.8 93.8
Competition related 1 .9 .9 94.6
Customer related 2 1.8 1.8 96.4
Economy/Economic - price increases etc.
1 .9 .9 97.3
Environmental issues - water etc.
2 1.8 1.8 99.1
Government related - regulations etc.
1 .9 .9 100.0
Total 112 100.0 100.0
Table 98: Impact of any Other Factors which Currently have a Significant Impact on the Business (D18.3)
Frequency Percent Valid Percent Cumulative
Percent
Valid 109 97.3 97.3 97.3
Customer related 1 .9 .9 98.2
Economy/Economic - price increases etc.
1 .9 .9 99.1
Government related - regulations etc.
1 .9 .9 100.0
Total 112 100.0 100.0
Table 99: Role or Position in the Business (E19)
Frequency Percent Valid Percent Cumulative
Percent
Valid Manager (full-time) with insight into the strategic planning of the business
14 12.5 12.5 12.5
Owner 56 50.0 50.0 62.5
Owner who is also the manager (full-time)
42 37.5 37.5 100.0
Total 112 100.0 100.0

299
Table 100: Number of Years in Role/Position (E20)
Frequency Percent Valid Percent Cumulative
Percent
Valid 1.0 9 8.0 8.0 8.0
1.5 1 .9 .9 8.9
2.0 10 8.9 8.9 17.9
3.0 9 8.0 8.0 25.9
3.5 1 .9 .9 26.8
4.0 11 9.8 9.8 36.6
5.0 10 8.9 8.9 45.5
6.0 6 5.4 5.4 50.9
8.0 4 3.6 3.6 54.5
9.0 6 5.4 5.4 59.8
10.0 14 12.5 12.5 72.3
11.0 5 4.5 4.5 76.8
12.0 2 1.8 1.8 78.6
13.0 1 .9 .9 79.5
14.0 3 2.7 2.7 82.1
15.0 3 2.7 2.7 84.8
16.0 3 2.7 2.7 87.5
17.0 2 1.8 1.8 89.3
18.0 2 1.8 1.8 91.1
19.0 1 .9 .9 92.0
20.0 5 4.5 4.5 96.4
22.0 2 1.8 1.8 98.2
25.0 1 .9 .9 99.1
39.0 1 .9 .9 100.0
Total 112 100.0 100.0

300
Table 101: Gender (E21)
Frequency Percent Valid Percent Cumulative
Percent
Valid Female 67 59.8 59.8 59.8
Male 45 40.2 40.2 100.0
Total 112 100.0 100.0
Table 102: Age Group (E22)
Frequency Percent Valid Percent Cumulative
Percent
Valid 18 - 30 13 11.6 11.6 11.6
31 - 40 29 25.9 25.9 37.5
41 - 50 40 35.7 35.7 73.2
51 – 60 27 24.1 24.1 97.3
Over 60 3 2.7 2.7 100.0
Total 112 100.0 100.0

301
APPENDIX E:
MEAN RANKS TABLES
Table 103: Mean Ranks - Testing for Differences between Age Groups Regarding Impact of Business Environment Factors
Ranks
age_4g N Mean Rank
Q12F1 1.00 13 52.04
2.00 29 53.86
3.00 40 60.03
4.00 30 56.28
Total 112
Q12F2 1.00 13 75.73
2.00 29 62.71
3.00 40 50.60
4.00 30 50.03
Total 112
Q14F1 1.00 13 67.65
2.00 29 55.60
3.00 40 52.96
4.00 30 57.25
Total 112
Q14F2 1.00 13 65.00
2.00 29 53.78
3.00 40 58.03
4.00 30 53.42
Total 112
Q15F1 1.00 13 65.65
2.00 29 49.24
3.00 40 58.41
4.00 30 57.00
Total 112
Q15F2 1.00 13 75.04
2.00 29 53.48
3.00 40 55.19
4.00 30 53.13
Total 112

302
Q16F1 1.00 13 64.15
2.00 29 52.07
3.00 40 58.93
4.00 30 54.23
Total 112
Q17F1 1.00 13 77.85
2.00 29 48.66
3.00 40 61.48
4.00 30 48.20
Total 112
Q17F2 1.00 13 67.96
2.00 29 55.78
3.00 40 56.99
4.00 30 51.58
Total 112
Q17F3 1.00 13 73.12
2.00 29 54.67
3.00 40 59.20
4.00 30 47.47
Total 112
Q17F4 1.00 13 76.12
2.00 29 51.00
3.00 40 55.38
4.00 30 54.82
Total 112
Table 104: Mean Ranks - Testing for Differences between Role/Position (Owner) Regarding Impact of Business Environment Factors
Ranks
owner_3g N Mean Rank
Q12F1 1.00 56 56.25
2.00 14 47.04
3.00 42 59.99
Total 112
Q12F2 1.00 56 53.15
2.00 14 66.96
3.00 42 57.48

303
Total 112
Q14F1 1.00 56 53.22
2.00 14 71.68
3.00 42 55.81
Total 112
Q14F2 1.00 56 50.13
2.00 14 59.75
3.00 42 63.92
Total 112
Q15F1 1.00 56 54.02
2.00 14 68.00
3.00 42 55.98
Total 112
Q15F2 1.00 56 53.95
2.00 14 60.39
3.00 42 58.61
Total 112
Q16F1 1.00 56 55.56
2.00 14 61.68
3.00 42 56.02
Total 112
Q17F1 1.00 56 50.71
2.00 14 67.04
3.00 42 60.70
Total 112
Q17F2 1.00 56 50.04
2.00 14 61.50
3.00 42 63.45
Total 112
Q17F3 1.00 56 50.76
2.00 14 69.50
3.00 42 59.82
Total 112
Q17F4 1.00 56 52.33
2.00 14 55.04
3.00 42 62.55
Total 112

304
Table 105: Mean Ranks - Testing for Differences between Age Groups Regarding Existence of Three Functional Dimensions
Ranks
age_4g N Mean Rank
f1test 1.00 13 73.65
2.00 29 55.34
3.00 40 57.88
4.00 30 48.35
Total 112
f2test 1.00 13 71.69
2.00 29 54.16
3.00 40 58.23
4.00 30 49.88
Total 112
f3test 1.00 13 57.54
2.00 29 48.86
3.00 40 51.83
4.00 30 69.67
Total 112
Table 106: Mean Ranks - Testing for Differences between Role/Position (Owner) Regarding Existence of Three Functional Dimensions
Ranks
owner_3g N Mean Rank
f1test 1.00 56 50.90
2.00 14 77.21
3.00 42 57.06
Total 112
f2test 1.00 56 53.34
2.00 14 71.39
3.00 42 55.75
Total 112
f3test 1.00 56 61.13
2.00 14 69.71
3.00 42 45.92
Total 112

305
APPENDIX F:
DECLARATION OF PROFESSIONAL EDIT


![Executive in Master International Business [fr] | …...5 EMIB Executive Master in International Business DESIGNING TOMORROW La 1RE école de commerce au monde (créée en 1819) 55.000](https://img.pdfslide.us/doc/110x75/5fd3ca611ed4ba158b2b90bf/executive-in-master-international-business-fr-5-emib-executive-master-in.jpg)