Embed Size (px)
Citation preview
CoAJf^ioaiQ-S
Paper presented at the 22nd Water Reactor Safety Information Meeting
October 24-26, 1994 Bethesda, Maryland
DETECTION OF PUMP DEGRADATION
DON CASADA OAK RIDGE NATIONAL LABORATORY
OAK RIDGE, TENNESSEE 37831
DISCLAIMER
This report was prepared as an account of work sponsored by an agency of the United States Government. Neither the United States Government nor any agency thereof, nor any of their employees, makes any warranty, express or implied, or assumes any legal liability or responsibility for the accuracy, completeness, or usefulness of any information, apparatus, product, or process disclosed, or represents that its use would not infringe privately owned rights. Reference herein to any specific commercial product, process, or service by trade name, trademark, manufacturer, or otherwise does not necessarily constitute or imply its endorsement, recommendation, or favoring by the United States Government or any agency thereof. The views and opinions of authors expressed herein do not necessarily state or reflect those of the United States Government or any agency thereof.
T h * aubmrttad manuacript hM baan authored by • contraaui of tha U.S. Govarnmant unoar contract No. DE-AC06-84OR214O0. Accordngty. th . U.S. Gowmnnflt ratana a nonaxduaiva. royarty-fraa tcanaa to pubaah or raproduca tha pubfahad form of traa conutiuiim. or * * othara to do so. for U.S. Govammant purpoaaa."
•Research sponsored by the Office of Nuclear Regulatory Research, U. S. Nuclear Regulatory Commission under Interagency Agreement DOE 1886-8082-8B with the U. S. Department of Energy under contract No. DE-AC05-840R21400 with the Martin Marietta Energy Systems, Inc.
MASTER OiSTRiBUTIGN OF TKi-S DOCL'HEKT IS UNI IrWTEJL^
J0\

DISCLAIMER
Portions of this document may be illegible in electronic image products. Images are produced from the best available original document.
Detection of Pump Degradation
Don Casada
Oak Ridse National Laboratory Oak Rfdge, TN 37831-8038"
ABSTRACT
There are a variety of stressors that can affect the operation of centrifugal pumps. Although these general stressors are active in essentially all centrifugal pumps, the stressor level and the extent of wear and degradation can vary greatly. Parameters that affect the extent of stressor activity are manifold. In order to assure the long-term operational readiness of a pump, it is important to both understand the nature and magnitude of the specific degradation mechanisms and to monitor the performance of the pump.
The most commonly applied method of monitoring the condition of not only pumps, but rotating machinery in general, is vibration analysis. Periodic or continuous spectral vibration analysis is a cornerstone of most pump monitoring programs. In the nuclear industry, non-spectral vibration monitoring of safety-related pumps is performed in accordance with the ASME code. Pump head and flow rate are also monitored, per code requirements.
Although vibration analysis has dominated the condition monitoring field for many years, mere are other measures that have been historically used to help understand pump condition: advances in historically applied technologies and developing technologies offer improved monitoring capabilities. The capabilities of several technologies (including vibration analysis, dynamic pressure analysis, and motor power analysis) to detect the presence and magnitude of both stressors and resultant degradation are discussed.
1. Pump Stressors
In a study performed for the NRC on the aging and service wear of auxiliary feedwater (AFW) pumps1 (hereinafter referred to as the "pump study"), pump stressors were classified as belonging to the following categories:
• Mechanical * Tribological • Hydraulic * Low-relevance factors • Chemical
The studv was based iargeiy on experience with similar pumps used in boiler teed service in fossil applications. It should also be noted that at the time the study was conducted, there was minimal available failure data.
The scope of the pump study did not include the pump driver. A subsequent study of the AFW system2 < hereinafter referred to as the "svstem study"), indicated that pump driver-related failures were a principal source of system degraaauon. For purposes of this paper, me principal pump unciuding onverj stressor categories are slightly modified from the original pump study:
Mechanical * Tribological Hydraulic * Chemical Other (including those associated with the pump driver)
The pump study indicated mat the principal relevant chemical stressors for AFW pumps, oxidation of 400 series stainless steeis througn chemical reacuon witn stagnant water, was in effect a tnbologicai factor since its relevance was primarily related to abrasive oxides. As a result, the pump study dealt with the effects of the first three stressor categories (mechanical, hydraulic, and tribological) on the various parts of the pump.
Some specific stressors within these three categories are identified in Table 1.
Table 1. Principal Stressors of Influence for AFW pumps
Mechanical torque transmitted loads rotor-dynamic loads piping forces seismic loads vibration (all sources)
Hydraulic hydraulic loads fluid impingement internal pressure cavitation
Tribological rubbing between rotating and nonrotating members bearing lubricant breakdown surface fatigue lubricant contamination and degradation starts and stops fretting surface oxide formation
The specific pump components that are affected by such stressors were identified in the pump study to include the items listed in Table 2.*
Table 2. Primary Components Influenced by Identified Stressors
Rotating elements Nonrotating internals Mechanical subsystems shaft diffusers/voiutes thrust beannes impellers return channels radial bearings thrust runners wear surfaces shaft seals fasteners fasteners thrust balancer miscellaneous spacers coupling
fasteners
Hydraulic and tribological factors, primarily associated with dynamic loads from hydraulic forces and cavitation, were identified as the principal stressors of significance for both rotating elements and nonrotating internals components. Tribologically-related factors, which are more diverse in nature, were identified as being the primary influence for the mechanical subsystem components. The tribological factors associated with the mechanical subsystem components identified in me pump study ranged from axial and radial hydraulic loads (both static and dynamic) to breakdown or loss of lubricant in gear couplings. Mechanical factors, such as overtightening of packing, and rotor dynamic loads were also indicated as principal stressors of influence.
The pump study also identified that the operation of AFW pumps at low flow rates was a particularly important factor in accelerated aging. This factor, as well as the inability to gain useful hydraulic data on the operating condition of the pump when tested at low flow, has led to changes in ASME code requirements.3 , 4-5
The system study, which by its nature investigated historical system failure data (as opposed to focussing on individual component stressors), found that problems with turbine drives were the largest contributor to overall system degradation. Over 80% of the turbine drive problems were associated with either the turbine's control subsystem, the trip and throttle valve, or the governor valve. Likewise, over 80% of pump motor drive problems were related to either the instrumentation and control subsystem or the motor breaker. Thus, the bulk of the pump drive problems were neither related to the drive itself (that is, either the turbine or the motor specifically) nor indirectly induced by the coupling to the pump.
A study of the dynamic loading of pumps6 that are similar to AFW pumps indicated that for pumps that are balanced according to American Petroleum Institute Standard API 610, 7 the hydraulic unbalance force is "clearly the biggest dynamic load acting on a pump rotor during normal operating conditions." The study did note that the tight mechanical unbalance limits obtained originally (in accordance with API 610) may be difficult to maintain. The study also noted that at low flow rates, "broad band vibrations can become predominant, and can be higher than any otiier vibrations."
While these stressors were identified in studies on AFW pumps and systems specifically (or on pumps similar to AFW pumps in the case of Ref. 6), they are generally applicable to the broader spectrum of pumps. There are certainly other factors involved in certain applications, and the principal stressors of influence may vary with the specific design and use, but the generai observations remain valid.
* Other components identified were the pressure-containment casing and the pump support. Because the stressors identified were not judged to be high-importance factors for these components, they are not included in Table 2.
2. Historically Applied Monitoring Practices
Probably the most commonly applied method for monitoring rotating equipment condition in general, and pumps in particular, has been vibration analysis. The measurement of vibration has been employed for many years. It has evolved from strictly analog devices such as vibrating reeds to digitally-based expert systems. Current expert systems compare the vibration spectra to pre-established limits and previously acquired data to: (1) indicate whether the machine is operating within the desired range, (2) indicate potential sources of problems if not. and (3) project remaining life before repair is necessary. Other commonly monitored pump parameters include head and flow, bearing temperatures, and lube oil condition.
The ASME code8 ,t requires that pump head, flow, and vibration be monitored periodically. The frequency and exact requirements depend upon the type of pump and the specific test being conducted. The vibration monitoring requirement is for a broad band, unfiltered (i.e., non-spectral) amplitude, and the required frequency response range is from one-third of pump shaft rotating speed to 1000 hz.
The current version of the code requires that all pumps be tested within ± 20% of the pump design flow, if practicable, on a biennial basis. This test is referred to as the Comprehensive Test. The Comprehensive Test, like the other tests under the current and previous code, does not require spectral vibration monitoring or trending.
Another parameter that is seldom used for routine field monitoring, but is often used in troubleshooting and in special test programs (particularly when addressing low-flow conditions or other problem pump conditions such as cavitation), is pressure pulsation. 9 , 1 0 , 1 1 Pump discharge and suction, as well as various points in the pump casing have been monitored for pressure pulsation analysis.
3. The Detection of Hydrauiicaily-Induced Vibration The original AFW pump study indicated that effects of low-flow-related forces could be a principal contributor to pump degradation. Subsequent failure of multiple AFW pumps12 as well as independent studies on similar pumps6
support the validity of this observation. Utility personnel involved in reviewing the Ref. 12 pump failures indicated that neither the ASME code monitored vibration nor spectral vibration monitoring indicated that a problem existed.
Many vibration guides are available that typically address mechanically-induced vibration components, such as unbalance, misalignment, defective bearings, worn gears, etc. Unfortunately, it is most often the case that such guides or tables fail to address pump-related components. This could well account for the failure to observe indications of degradation or sources of degradation. The literature suggests that the effects of vibration resulting from undesired pump operational conditions may be manifested at various frequency regimes. Table 3 lists several frequency regions that have been found widi field experience.
Table 3. Some Hydrauiically-induced Vibration Components
Item Frequency Source of vibration References A 0-10 Hz (broadband Sucuon recirculation (Ref. 14 relates
diis to Gap "A", which is the gap between impeller and diffuser/volute sidewalls)
13. 14. 15
B <i5 Hz (broadband) Unsteady flows due to recirculation or turbulence (similar to item A)
6
C 0 to 1.5 * running speed, broad band Recirculation 6 D 0.5 to 0.95 * running speed Rotating stall 6 E 0.6 to 0.9 * running speed Hydraulic instability 14. 15 F 1* running speed Hydraulic unbalance 6. 13. 14, 15 G 0.5 kHz to 10 kHz (broadband) Cavitation 6 H Vane pass frequency Impeller vane to diffuser vane sap
(Gap "B") 6. 13. 14. 15
I Relatively distinct peak. 1 to 15 Hz Surge or svstem instability 6
It should be noted mat the NRC has not yet, as of mis writing, endorsed the 1990 version of the ASME code.
It should be noted that Table 3 is not intended to be a comprehensive listing of all vibration frequencies that may be found; specifically, there are no mechanically-related frequencies.
4. A Comparison of Monitoring and Analysis Methods
The frequency regimes identified in Table 3 are primarily based on vibration monitoring experience. Vibration monitoring is certainly the most commonly applied field diagnostic, so it is a natural result that hydraulic, as well as mechanical, stressors and degradations would be most often identified in that context. However, it is important to recognize that bearing or pump casing vibration will not necessarily represent all sources of unstable conditions. For example, significant torsional loading variations can exist without being manifested at normally monitored vibration locations.
Test data was acquired on two pumps to compare the results of vibration, motor input power, and pressure pulsations (the latter for only one pump) with each other as well as the spectral components identified in Table 3. It is important to note that the pumps tested are relatively low energy pumps. This is an important factor, since low energy pumps are less significantly affected by hydraulic forces than are high energy pumps.6
Nominal pump parameters for the tested pumps are provided in Table 4. Both pumps are horizontal, overhung, single suction, single stage, double volute pumps. Pump A would be generally expected to be more subject to low flow-related instabilities^han Pump B because of its relatively high suction specific speed as well as larger size. It should be recognized that there are a number of nuclear pump applications that wouid be expected to be more sensitive to low-flow operation than either of the tested pumps.
Table 4. Nominal pump parameters for test pumps
Parameter Best Efficiency Flow Rate (gpm) Nominal speed (rpm) Best Efficiency Head (ft) Specific speed Suction specific speed Motor power rating (hp) Number of impeller vanes
Industrial pump Small check valve (Pump A) test loop pump (Pump B)
2000 200-1780 3500 137 100 1990 1570 12750 10700 75 7.5 6 5
4. A. Pump A Vibration Data Analysis
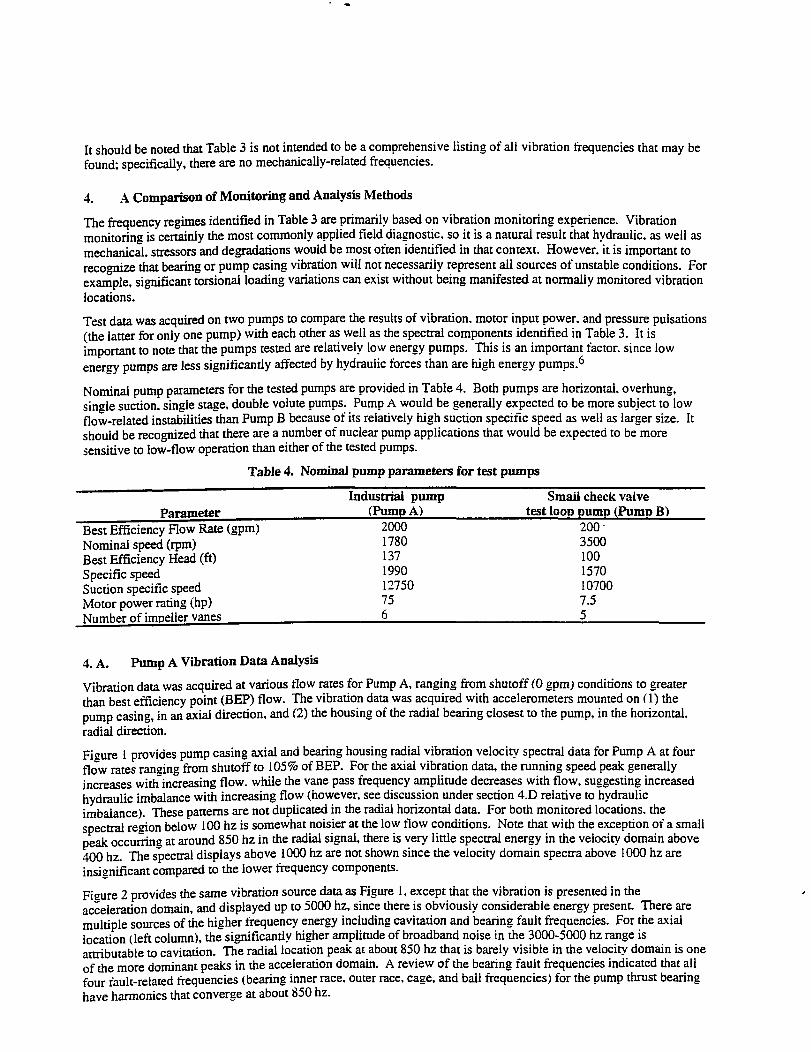
Vibration data was acquired at various flow rates for Pump A, ranging from shutoff (0 gpm; conditions to greater than best efficiency point (BEP) flow. The vibration data was acquired with accelerometers mounted on (1) the pump casing, in an axial direction, and (2) the housing of the radial bearing closest to the pump, in the horizontal, radial direction. Figure 1 provides pump casing axial and bearing housing radial vibration velocity spectral data for Pump A at four flow rates ranging from shutoff to 105% of BEP. For the axial vibration data, the running speed peak generally increases with increasing flow, while the vane pass frequency amplitude decreases with flow, suggesting increased hydraulic imbalance with increasing flow (however, see discussion under section 4.D relative to hydraulic imbalance). These patterns are not duplicated in the radial horizontal data. For both monitored locations, the spectral region below 100 hz is somewhat noisier at the low flow conditions. Note that with the exception of a small peak occurring at around 850 hz in the radial signal, there is very little spectral energy in the velocity domain above 400 hz. The spectral displays above 1000 hz are not shown since the velocity domain spectra above 1000 hz are insignificant compared to the lower frequency components.
Fieure 2 provides the same vibration source data as Figure 1, except that the vibration is presented in the acceleration domain, and displayed up to 5000 hz, since there is obviously considerable energy present. There are multiple sources of the higher frequency energy including cavitation and bearing fault frequencies. For the axial location (left column), the significantly higher amplitude of broadband noise in the 3000-5000 hz range is attributable to cavitation. The radial location peak at about 850 hz that is barely visible in the velocity domain is one of the more dominant peaks in the acceleration domain. A review of the bearing fault frequencies indicated that all four fault-related frequencies (bearing inner race, outer race, cage, and ball frequencies) for the pump thrust bearing have harmonics that converge at about 850 hz.
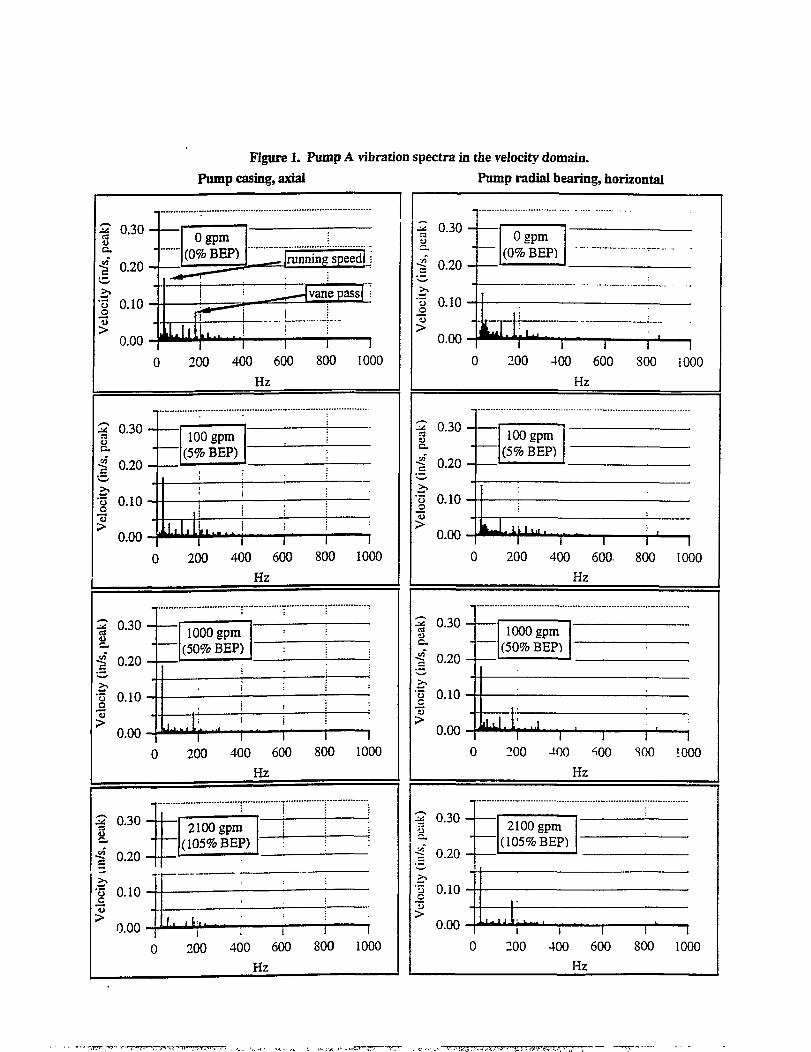
Figure 1. Pump A vibration spectra in the velocity domain. Pump casing, axial Pump radial bearing, horizontal
Vel
ocity
(in/
s, p
eak)
p
p o
o o
U-
io
OJ
o o
o o
,-
,1
.1
.1
,1
,
Vel
ocity
(in/
s, p
eak)
p
p o
o o
U-
io
OJ
o o
o o
,-
,1
.1
.1
,1
,
— Ogpm (0% BEP)
Vel
ocity
(in/
s, p
eak)
p
p o
o o
U-
io
OJ
o o
o o
,-
,1
.1
.1
,1
,
— Ogpm (0% BEP) running speedl ;
Vel
ocity
(in/
s, p
eak)
p
p o
o o
U-
io
OJ
o o
o o
,-
,1
.1
.1
,1
,
Vel
ocity
(in/
s, p
eak)
p
p o
o o
U-
io
OJ
o o
o o
,-
,1
.1
.1
,1
,
! ! — • vane pass) ;
Vel
ocity
(in/
s, p
eak)
p
p o
o o
U-
io
OJ
o o
o o
,-
,1
.1
.1
,1
,
i f r i -| 1
1000
Vel
ocity
(in/
s, p
eak)
p
p o
o o
U-
io
OJ
o o
o o
,-
,1
.1
.1
,1
,
>Ui LL... . 1 ! -|
1 1000
Vel
ocity
(in/
s, p
eak)
p
p o
o o
U-
io
OJ
o o
o o
,-
,1
.1
.1
,1
,
1 1 1 200 400 600
Hz
1 800
1 1000
| 0 . 2 0 -
100 gpm (5% BEP) "
| 0 . 2 0 -
100 gpm (5% BEP) "
| 0 . 2 0 - ; | 0 . 2 0 -
'• 1 o U.1U — 1
0.00-0
ii i i o U.1U — 1 0.00-
0
o U.1U — 1 0.00-
0 200 400 600
Hz
1 800
1 1000
I 0 - 3 0 : -§ 0.20 -
i ; : •:
I 0 - 3 0 : -§ 0.20 -
1000 gpm (50% BEP) I 0 - 3 0 :
-§ 0.20 -
1000 gpm (50% BEP) I 0 - 3 0 :
-§ 0.20 -I 0 - 3 0 : -§ 0.20 -
i ;
Vel
oc
3 C
i t
Vel
oc
3 C
i ! ;
U.UU —J-
0 JfchhU,-., j .. (
200 400 600 Hz
1 800
1 1000
i |
•£ 0 .20-
2100 gpm (105% BEP)
|
•£ 0 .20-
2100 gpm (105% BEP)
•£ 0 .20-•£ 0 .20-
Vel
oc
3 U
3
C
Vel
oc
3 U
3
C
'J.UU — •
0 i ; i
200 400 600 Hz
1 800
1
1000
¥ ° - 3 0
h
4 0.20 >. •3 0.10 o >
0.00
Ogpm &BEP)
. U i..
200 400 600 800 iOOO Hz
? 0.30 2 c >" 0.20 >> •3 0.10
0.00
100 gpm (5% BEP)
Jul Ifli 1
0 200 400 600. 800 1000 Hz
£ 0.30 4
I 0.20
3 0.10
0.00
1000 gpm (50% BEP)
* * * " • • ] • - • • ' •
0 200 -100 -S00 S00 1000 Hz
I-I °-20
•3 0.10
0.00
2100 gpm (105% BEP)
*JL*JuLLiUba>_l__t_k. i 1
0 200 400 600 800 1000 Hz
Acc
eler
atio
n (g
, mis
) A
ccel
erat
ion
(g, r
ms)
o
o 8
S to
o C
O
o
X N
8
1 1
i
•-
•-
Ogpm (0% BEP)
•-
Acc
eler
atio
n (g
, rm
s)
o o
o o
b I—
to
u>
o
o o
o ,—
1 1
i i
1 j
Acc
el
o c
b '>
-o
c <—
1 1
1
erat
ion
3 C
F
(g, r
nis)
3
O
j L
) 3
O
| 1
Acc
el
o c
b '»
o
c /
_'
In m
i
erat
ion
(g, r
nis)
D
O
O
to
Lo
3
O
O
1 '
1
Acc
eler
atio
n (g
, rm
s)
p p
p o
b K
- to
u>
o
o o
o <->
j_
_ 1
• I
1 1 1 1 1 1 ) 1000 2000 3000 4000 5000
Hz
1 1 1 1 1 1 1000 2000 3000 4000 5000
Hz
1
\
| I
1 1 1 1 1 1 ) 1000 2000 3000 4000 5000
Hz
•
1 1 1 1 1 1 1000 2000 3000 4000 5000
Hz
e r- - '•
I ! 1
\
1 |
1 1 1 1 1 1 ) 1000 2000 3000 4000 5000
Hz
•
2100 gpm (105% BEP)
1 1 1 1 1 1 1000 2000 3000 4000 5000
Hz
e r- - '•
1000 gpm (50% BEP)
100 gpm (5% BEP)
\
o SR
°
^3
1 1 1 1 1 1 ) 1000 2000 3000 4000 5000
Hz
•
2100 gpm (105% BEP)
1 1 1 1 1 1 1000 2000 3000 4000 5000
Hz
e r- - '•
1000 gpm (50% BEP)
300 2000 3000- 4000 5000 Hz
100 gpm (5% BEP)
300 2000 3000 4000 5000 Hz
\ \
o SR
°
^3
1 1 1 1 1 1 ) 1000 2000 3000 4000 5000
Hz
t
2100 gpm (105% BEP)
1 1 1 1 1 1 1000 2000 3000 4000 5000
Hz
e r- - '•
1000 gpm (50% BEP)
300 2000 3000- 4000 5000 Hz
•
300 2000 3000 4000 5000 Hz
\ \
\i
1 1 1 1 1 1 ) 1000 2000 3000 4000 5000
Hz
2100 gpm (105% BEP)
1 1 1 1 1 1 1000 2000 3000 4000 5000
Hz
e r- - '•
i i i
300 2000 3000- 4000 5000 Hz
•
300 2000 3000 4000 5000 Hz
\ \
\i
1 1 1 1 1 1 ) 1000 2000 3000 4000 5000
Hz
•
•
1 1 1 1 1 1 1000 2000 3000 4000 5000
Hz
e r- - '•
i i i
300 2000 3000- 4000 5000 Hz
•
300 2000 3000 4000 5000 Hz
\ \
\i
1 1 1 1 1 1 ) 1000 2000 3000 4000 5000
Hz
•
•
1 1 1 1 1 1 1000 2000 3000 4000 5000
Hz
i i i
300 2000 3000- 4000 5000 Hz
•
300 2000 3000 4000 5000 Hz
\ \
beanng-related peak
1 1 1 1 1 1 ) 1000 2000 3000 4000 5000
Hz
•
•
1 1 1 1 1 1 1000 2000 3000 4000 5000
Hz
i i i
300 2000 3000- 4000 5000 Hz
•
300 2000 3000 4000 5000 Hz
\ \
•
Figure 3 is the same data as shown in Figure 1, but zoomed to show more clearly the spectra from 0-200 Hz. For Figure 3, the graph tick mark labels are at harmonics of running speed. The non-harmonic peak that occurs at about 140 Hz in the radial data (right column) appears to be related to the inner race frequency of the thrust bearing. Figure 3 more clearly shows the higher level of broadband noise that exists at reduced flow conditions from^bout half of running speed to arouna four times running speea. Note mat me principal areas of higher noise are somewhat different at the two locations. For the axial location (left column), most of the noise appears as sidebands of runnina speed, while at the radially monitored location, the noise bandwidth is somewhat broader, extending up to four times running speed.
By comparing the data observed in Figures 1-3 wim the components reported in Table 3. it can be concluded that the pump shows some evidence of cavitation (broadband noise over a fairly wide band) that is stronger at low flow conditions, as well as indication of recirculation at low flow (although the range of the broadband noise extends beyond the 1.5 times rotating speed suggested in Table 3). Independently, there was audible cavitation noise when the pump was being operated at low flow conditions.
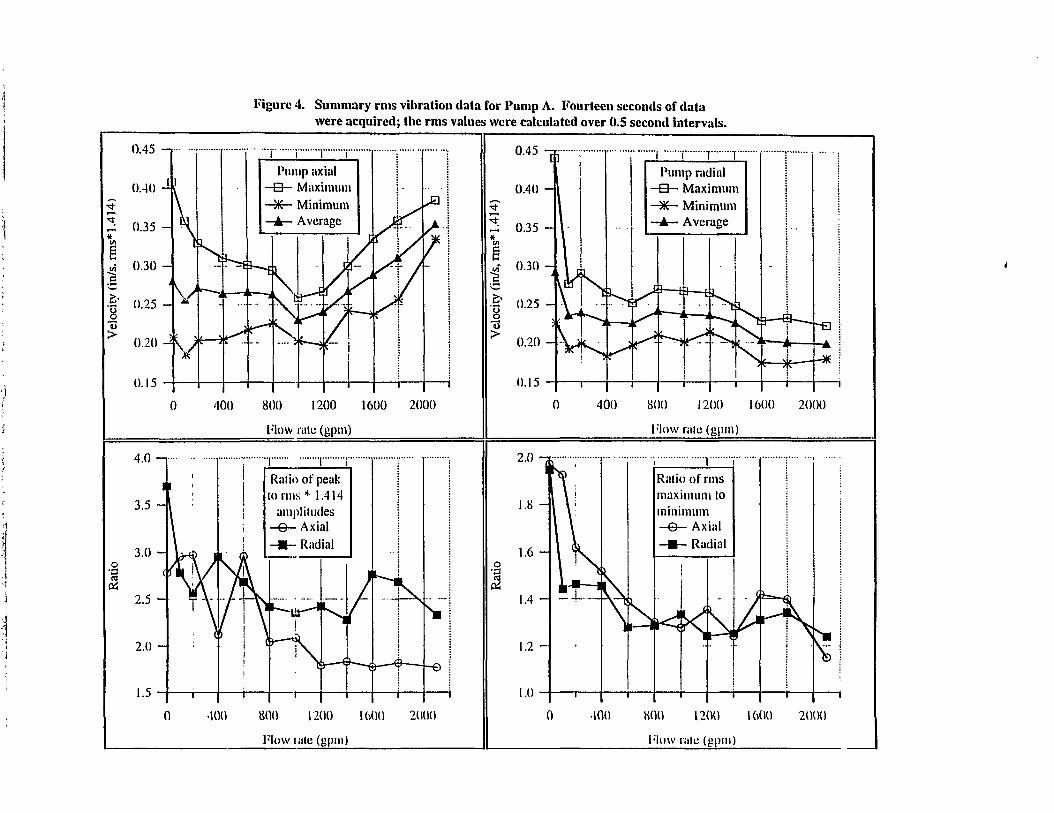
Since the ASME Code does not require spectral monitoring of vibration, the vibration waveforms were also converted to the velocity domain and analyzed. The analysis of the data went well beyond ASME requirements by not only evaluating the overall amplitude, but also determining fluctuations in the overall amplitude during the approximately fourteen seconds over which data was acquired.
Figure 4 provides the results of me analysis. Note that the two upper plots present me non-spectral, or overall amplitude as rms amplitude times 1.414. The reason for providing rms * 1.414 rather than true peak is that historical data that has been labeled "peak" has, in most cases, been actually rms * 1.414. The average pump axial amplitude slightly increases at the upper end of the flow rates monitored, while the radial vibration slightly decreases at the higher flow rates. Both locations are somewhat higher at the shutoff condition than at the intermediate flow conditions. There is little useful information that can otherwise be distilled from the average values. The presentation of the data as rms * 1.414 rather than true peak is an important distinction, since the true peak is often several times rms * 1.414. The lower left plot of Figure 4 shows the ratio of true peak to rms * 1.414 for both monitored locations as a function of flow rate.
The maximum and minimum values shown in the two upper plots are based on the calculation of rms values for one-half second snapshots of the vibration data over a total sample time of fourteen seconds. When the flucmations in measured amplitude are considered, as opposed to simply the average rms * 1.414, a somewhat more revealing pattern emerges man the simple average rms. The lower right hand plot of Figure 4 shows the ratio of maximum to minimum values of the one-half second sets. At the lowest flow rates, there were more flucmations in short-duration measurements, which indicate less stable overall conditions. This is qualitatively consistent wim the generally noisier spectra observed at me low flow conditions.
The effect of changes in the bearing-related flaws component noted above was also explored. Using the 0 gpm radial vibration data as a source, the signal was modified in two ways. First, the accelerometer signal was digiially filtered to remove the principal frequencies diat appear to be bearing-related, as well as the broadband noise above 850 Hz. Second, the bearing flaw-related energy around 850 Hz was digitally amplified by a factor of 10. Figure 5 shows the unmoaified velocity domain spectrum, the spectrum with the oeanng tauit rrequencies removed, and the spectrum with the 850 Hz component increased. While the differences are clearly evident in the spectral domain, there is minimal effect on the overall, non-spectral value. For me case where the 850 Hz bearing flaw component is increased by a factor of 10, the overall amplitude increased by less than 20%.
A real degradation in bearing condition would certainly manifest itself differently tiian the simple digital model used above. For instance, harmonics and/or running speed sidebands of defect frequencies might be expected as the bearing degraded. However, the point to be made is mat relatively large increases in high frequency components have minimal en'ect on me non-spectral overall vibration velocity amplitude.
4. B. Pump B Vibration Data Analysis
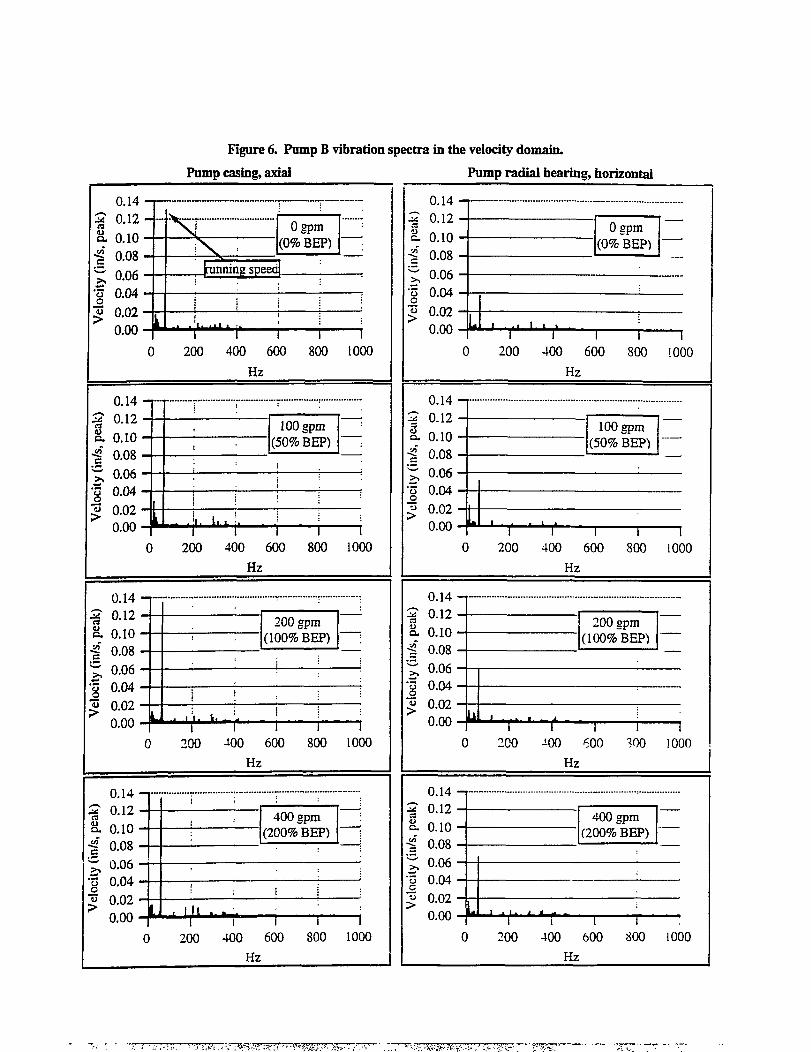
Vibration data was acquired at various flow rates for Pump B. ranging from shutoff (0 gpm) conditions to approximately twice best efficiency point (BEP) flow. The vibration data was acquired with acceierometers mountea on (1) the pump casing, in an axiai direction, and (2) the housing of the inboard radial bearing.
Figures 6-8 provide velocity and acceleration domain vibration spectra for both monitored locations. Some observations on the data in these figures are listed below.
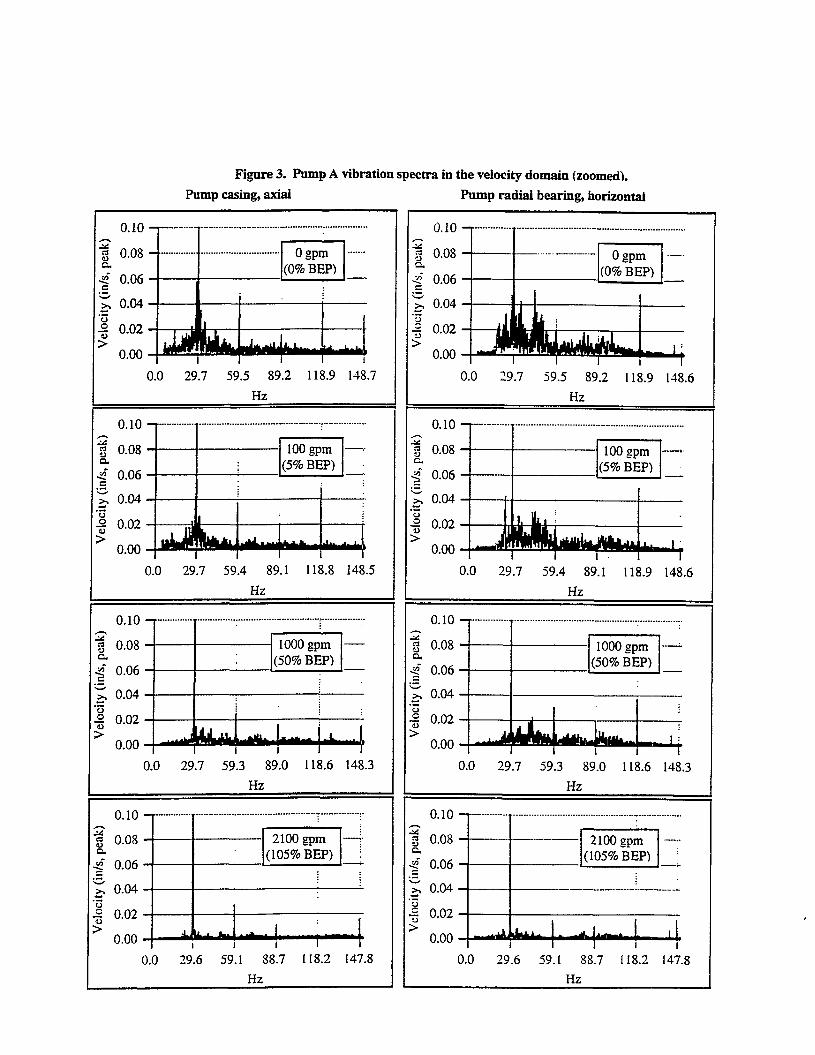
Figure 3. Pump A vibration spectra in the veiocity domain (zoomed). Pump casing, axial
0.10
i 0.08 -f-
0.06
>, 0.04
I 0.02 0.00 IIK
Ogpm (0% BEP)
hth i t d i iM
0.0 29.7 59.5 89.2 Hz
118.9 148.7
C3
o
>
0.10 - r
0.08
0.06
0.04
0.02
0.00
100 gpm (5% BEP)
~~udfc - a — L f c
0.0 29.7 59.4 89.1 Hz
118.8 148.5
'1 o
>
0.10 - r
0.08
0.06
0.04
0.02
0.00
1000 gpm (50% BEP)
J r ^ • * • — L
0.0 29.7 59.3 89.0 118.6 Hz
148.3
u
>
0.10
0.08
0.06
0.04
0.02
0.00 •
2100 gpm (105% BEP)
iflHi ht. M I M
0.0 29.6 59.1 88.7 Hz
118.2 147.8
Pump radial bearing, horizontal
0.10
0.08
0.06
0.04
0.02
0.00
148.6
0.10
0.08
0.06
0.04
0.02
0.00
148.6
1000 gpm (50% BEP)
0.0 29.7 59.3 89.0 118.6 Hz
148.3
2100 gpm (105% BEP)
m i i id f*-4-0.0 29.6 59.1 88.7 118.2
Hz 147.8
• *
5
1 u >
Figure 4. Summary rms vibration data for Pump A. Fourteen seconds of data were acquired; the rms values were calculated over 0.5 second intervals.
400 800 1200 1600 2000
How rate (gpm)
400 800 1200 1600 20(K)
How rale (gpni)
o • a <s ai
4.0 - i
3.5 -
Ratio of peak tonus * 1.414
amplitudes -©— Axial -•— Radial
L.\) 1 1 Ratio of rnis
1.8 -maximum to minimum -&— Axial
1 6 - - » - Radial
1.4 - • r ! r r H
-1.4 - -
1.2 - • V
V"
1 A) ' t 0 -100 800 1200 1600 2000
Flow i ate (gpm)
100 800 1200 1600
How rate (gpm)
20(H)
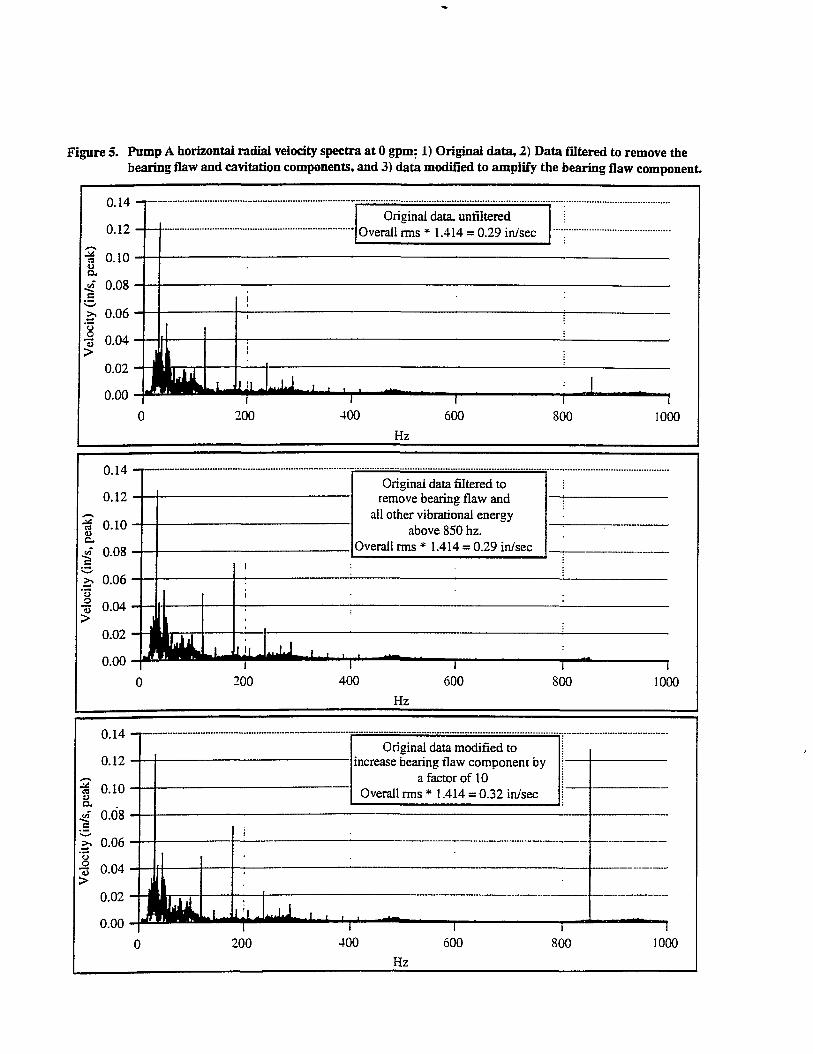
Figure 5. Pump A horizontal radial velocity spectra at 0 gpm: 1) Original data, 2) Data filtered to remove the bearing flaw and cavitation components, and 3) data modified to amplify the bearing flaw component
0.14
0.12
0.10
0.08'
>. 0.06 —
Original data, unfiltered Overall rms * 1.414 = 0.29 in/sec
I 0.04 f| > 0 0 2 - J b r -
200
J l 400
I 600 800 1000
Hz
0.14
0.12
a u c «" 0.08
'S 0.06
Original data filtered to remove bearing flaw and
all other vibrational energy above 850 hz.
Overall rms * 1.414 = 0.29 in/sec
I 0.04 |i > 0 - 0 2 - - |br - ill
i 200
**1 400 600 800 1000
Hz
0.14
0.12
•g 0.10
0.08
>> 0.06
•§ 0.04 >
0.02
0.00
Original data modified to increase bearing flaw component by
a factor of 10 Overall rms * 1.414 = 0.32 in/sec
_^9HnL tijl ilmiJ 200
- ' • ' ' . •
400 600 800 1000 Hz
a.
0.14 0.12 0.10
•gf 0.08 ~ 0.06 •3 0.04
0.02 0.00
> 1
t 0.14 0.12 0.10 0.08 0.06 0.04 0.02 0.00 -L
Figure 6. Pump B vibration spectra in the velocity domain.
Pump casing, axial Pump radial bearing, horizontal
1000
100 gpm (50% BEP)
0* r
200 400 600 Hz
—T 1 800 1000
200 gpm (100% BEP)
-t-Li I
200 I 1
-t00 600 Hz
800 1000
a.
o
>
0.14 0.12 0.10 0.08 0.06 0.04 0.02 0.00 f
400 gpm (200% BEP)
.!_«• 200
l I
400 600 Hz
800 1000
0.14 0.12 0.10 0.08 0.06 0.04 0.02 0.00'
Ogpm (0%BEP)
L I • ,. I I
200 400 600 Hz
800 1000
0.14 - r 0.12 0.10 0.08 0.06 0.04 0.02 0.00
100 gpm (50% BEP)
_k_j_
0 200 400 600 Hz
800 1000
0.14 0.12 0.10 0.08 0.06 0.04 0.02 0.00 -J*
200 gpm (100% BEP)
•- • 0 ICO -100 600
Hz 300 !000
0.14 - i 0.12 0.10 0.08 0.06 0.04 0.02 0.00
400 gpm (200%~BEP)
I i ,i i i t »
0 200 400 600 Hz
800 1000
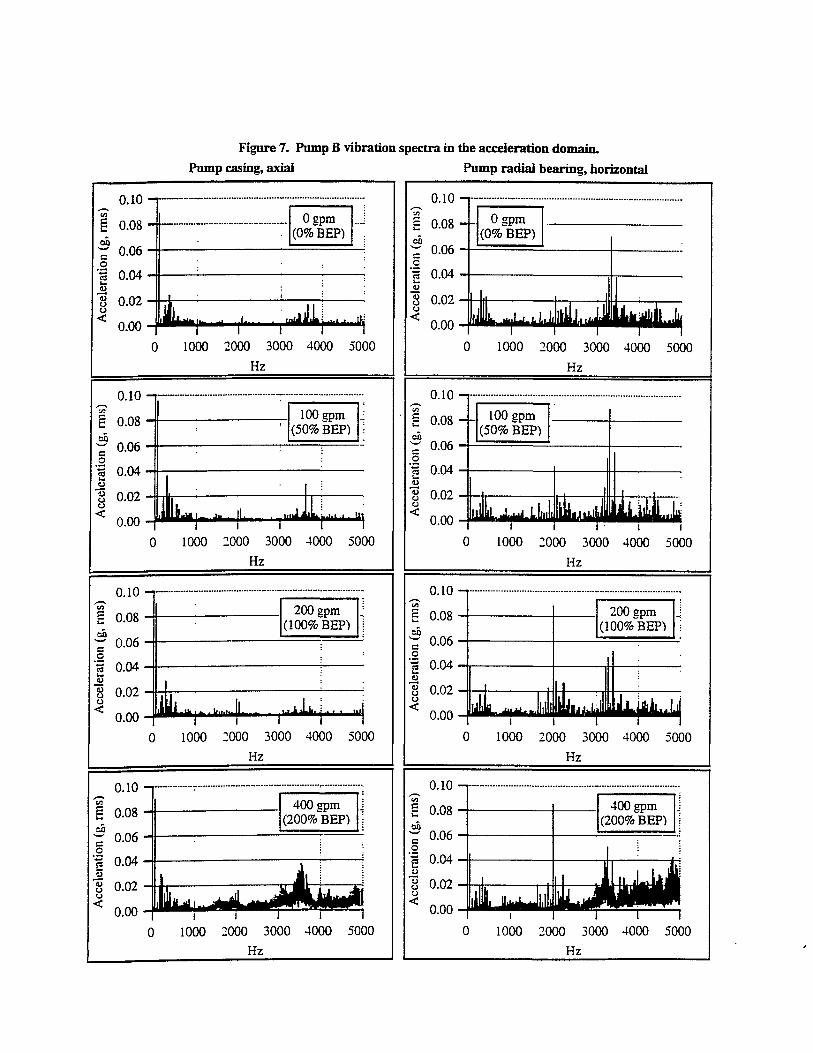
Figure 7. Pomp B vibration spectra in Pump casing, axial
C
La
"o u <
0.10
0.08
0.06
0.04
0.02
0 .00- f
0 apm (0% BEP)
L —iJ dJL i - ' • 'V
1000 2000 3000 4000 Hz
5000
c _o 2
ju "33 u <
0.10
0.08
0.06
0.04
0.02
0.00 -
100 gpm (50% BEP)
I UL1 Jlllt ,JJiL|..... • m I
0 1000 2000 3000 4000 Hz
5000
o o <
0.10
0.08
0.06
0.04
0.02
0.00-
200 apm (100% BEP)
t— JL-. j i t ^u " • i • " • * "
0 1000 2000 3000 4000 Hz
5000
0.10 0.08 0.06 0.04 0.02 0.00
400 gpm „ (200% BEP)
400 gpm „ (200% BEP)
i . JM 1^ , 4 jMVmM
i i 1 i 1 1000 2000 3000 4000
Hz 5000
the acceleration domain. Pump radial bearing, horizontal
0.10 - r -
0 1000 2000 3000 4000 5000 Hz
0.10
| 0.08 CO
~ 0.06
3 0.04 U
1 0.02 < 0.00
100 spm (50% BEP)
Jii*d.LLll UflUihl I uw b i i 0 1000 2000 3000 4000 5000
Hz
0.10
I 0.08 co ~ 0.06 o ' i 0.04
8 0™ u
< 0.00 _y £ Ukx
200 gpm (100% BEP)
1 llibk iUALLj 0 1000 2000 3000 4000 5000
Hz
0.10 - i -
0 1000 2000 3000 4000 5000 Hz
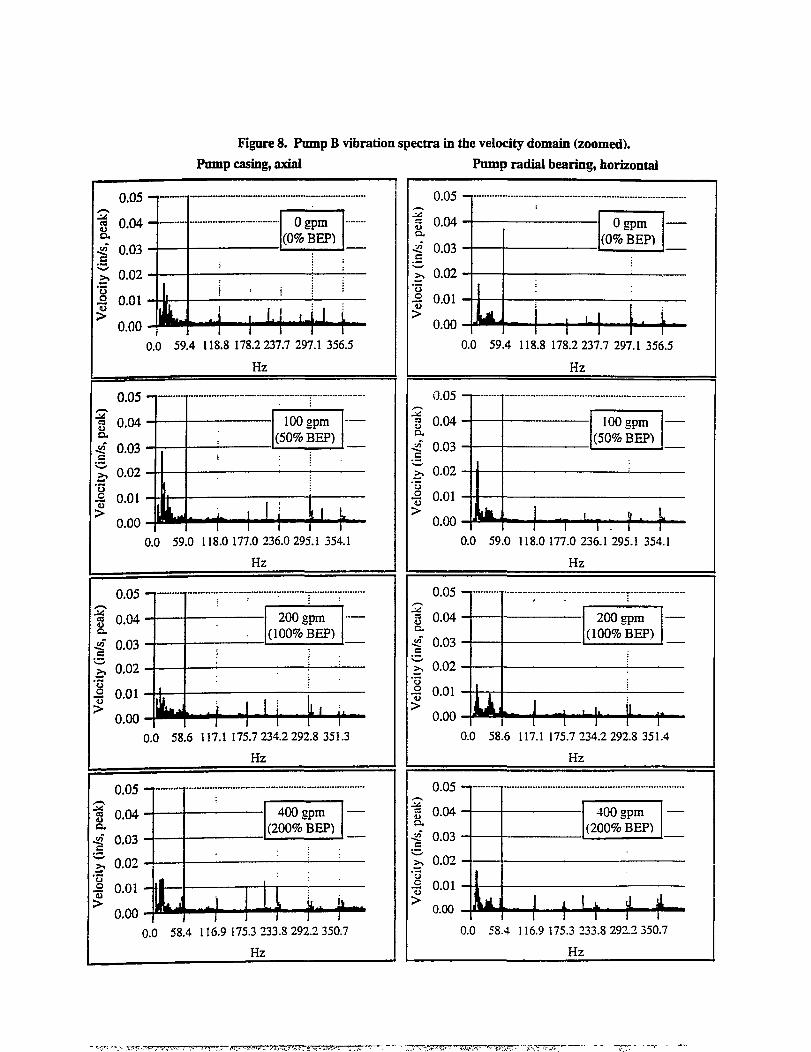
Figure 8. Pump B vibration spectra in the velocity domain (zoomed). Pump casing, axial
0.05
at u a.
u u >
0.04-
0.03
0.02
0.01
0.00 :fc Ogpm
(0% BEP)
Jb I I H ' ' I 1 \ 0.0 59.4 118.8 178.2 237.7 297.1 356.5
Hz
I o
>
0.05
0.04
0.03
0.02
0.01
0.00 i 100 gpm
(50% BEP)
M M ' F 0.0 59.0 118.0 177.0 236.0 295.1 354.1
Hz
a u a.
i a _o >
0.05
0.04
0.03
0.02
0.01
0.00 :t;
200 gpm (100% BEP)
• M - H l t"
0.0 58.6 117.1175.7 234.2 292.8 351.3 Hz
C3
a. C
>
0.05
0.04
0.03
0.02
0.01
0.00 :fa
400 gpm (200% BEP)
I—14 h hf
0.0 58.4 116.9 175.3 233.8 292.2 350.7 Hz
Pump radial bearing, horizontal
0.05
0.04
0.03
0.02
S 0.01 >
o.oi -4 o.oo - « < *
Ogpm (0% BEP)
I ••! M 0.0 59.4 118.8 178.2 237.7 297.1 356.5
Hz
0.05
0.04
0.03
0.02 ^ 0.02 —I
I 0 ' 0 1 " 1 o.oo - A l L ^
100 gpm (50% BEP)
r-h4-0.0 59.0 118.0 177.0 236.1 295.1 354.1
Hz
0.05
0.04
0.03
0.02
0.01
0.00 i r
200 gpm (100% BEP)
I i '•!" I r 0.0 58.6 117.1175.7 234.2 292.8 351.4
Hz
0.05
0.04
0.03
0.02
0.01
0.00 ± 400 gpm
(200%BEP)
1 j 't I f 0.0 58.4 116.9 175.3 233.8 292.2 350.7
Hz
• The running speed axial velocity amplitude for Pump B (Figure 6) is relatively constant witii flow rate, unlike Pump A. where the axial running speed amplitude at the highest flow rate is approximately twice that at shutoff (Figure 1).
• There is a significant levei of broadband noise at both locations in the acceleration domain (Figure 7) signals at the hiehest flow rate (200% BEP), indicating cavitation. Although the pump and system generate a generally higher level of noise at this flow rate, cavitation is not audibly detectable.
• There are a series of relatively well defined peaks in the range of 1600-2200 Hz and also in die range of 3100-3400 Hz in die acceleration domain horizontal radial signal. More detailed analysis of the spectra indicated tfiat diese peaks originate from a combination of the rotor bar pass frequency (and second harmonic), characteristic bearing frequencies (including a harmonic convergence similar to that noted for Pump A above), and running speed and 120 Hz sidebands of these components. It is important to note mat the motor used to drive diis pump is a high efficiency motor. High efficiency motors have been observed to be somewhat more likely to generate electrically-related vibration (such as rotor bar pass and 120 Hz components) than conventional motors.
• The vane pass peak is least well defined in the axial vibration for the lowest and highest flow cases. In Figure 8. for which the x-axes are laid out in orders of running speed, the fifth harmonic (vane pass) of running speed can be seen to be better defined for the 50% and 100% of BEP cases than for the shutoff and 200% case.
Figure 9 presents summary, non-spectral rms vibration data for the flow rates previously discussed. For this pump, the general trend is that radial vibration generally increases widi flow, while there is no consistent trend with flow for die axial vibration. The overall amplitudes, and the level of fluctuation at all flow rates, is less man that for Pump A. Clearly, mere is important information in the higher frequency region of the vibration spectrum whose effect is minimallv seen in die overall, non-spectral rms amplitude, as die acceleration frequency spectra for the pumps above have shown. Figure 10 shows die waveforms of die same vibration signal, with different digital filters applied. The upper plot shows die signal widi a 6000 Hz digital low-pass filter applied to die signal (which was also analog low-pass filtered at 6000 Hz nominal cutoff frequency for anti-aliasing before digitization). The lower plot of Figure 10 shows the same signal after having been low-pass filtered at 1000 Hz. The overall rms amplitude is only marginally changed. The filtering at 1000 Hz almost totally eliminates die effects of cavitation, rotor bar pass, and higher frequency bearing-generated vibration.
The significance of die 1000 Hz filter is diat the ASME code requires mat the frequency span to be included in vibration monitoring range from one-diird of running speed to 1000 Hz. Many vibration analyzers allow the user to select the bandwidtii, and men apply anti-aliasing filters to limit signals outside of the selected bandwidth. Thus, an analyzer set up to cover die exact range required by the ASME code would also filter out the higher frequency components noted above.
4. C. Pressure Pulsation Analysis
Pressure pulsations originate from various sources, including impeller vanes passing diffuser vanes or volute cutwaters, non-symmetric loading at rotational frequency, and other hydraulically-borne load variations. The vibration components listed in Table 3 are associated with hydraulic conditions, and vibration is a secondary response to die hydraulic loadings. Careful pressure analysis should be an inherently better means of monitoring die sources of hydraulically induced vibration. Of course, pressure monitoring is somewhat intrusive in nature, and is dierefore not a practical tool to use as a routine field monitor.
Pressure pulsation data for Pump B was acquired and spectrally analyzed. Two pressure transducers were used -one located about 6 inches upstream of me pump suction nozzle, and die other located about two feet from die pump discharge nozzle. Botii analog pressure signals were digitized. The suction pressure signal was subtracted from die discharge pressure signal to yieid a pump head signal.
Figure 11 provides the pressure spectrum for the pulsations in die pump head at the same four flow conditions tor which vibration data presented in Figures 6-8 was acquired. The pulsation amplitude is expressed in rms terms. The pump vane pass frequency was, for all cases except the highest flow case, die dominant component, but trended down with increasing flow rate. This is not surprising, since the overall head decreases widi increasing flow rate: however, note diat die decay is decidedly non-linear widi average head. At shutoff conditions, die rms pressure pulsation amplitude at vane pass frequency is over 1% of die total head. At the intermediate flow conditions, die
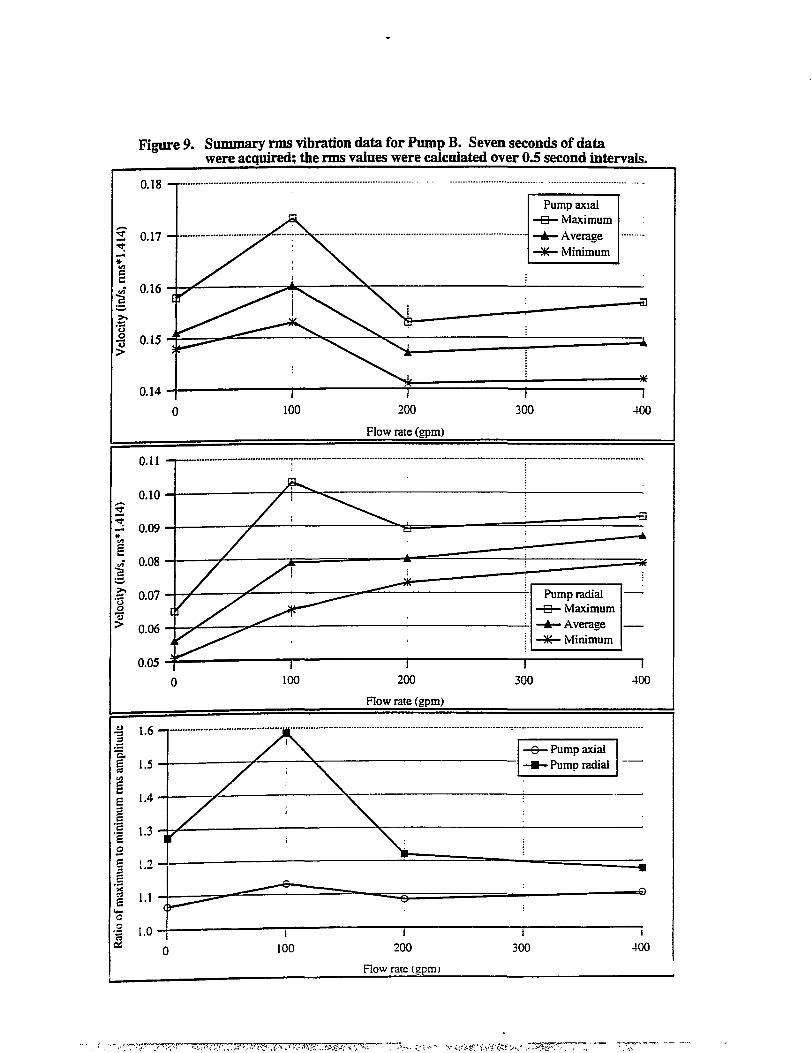
Figure 9. Summary nns vibration data for Pump B. Seven seconds of data were acquired; the nns values were calculated over 0.5 second intervals.
0.11
a -3 3
i 2 s
2 a
100
100
200
Flow rate (gpm)
200 now rate (gpm)
200 now rale (gpm)
Pump axial - B - Maximum —Ar- Average —*- Minimum
300
400
400
400
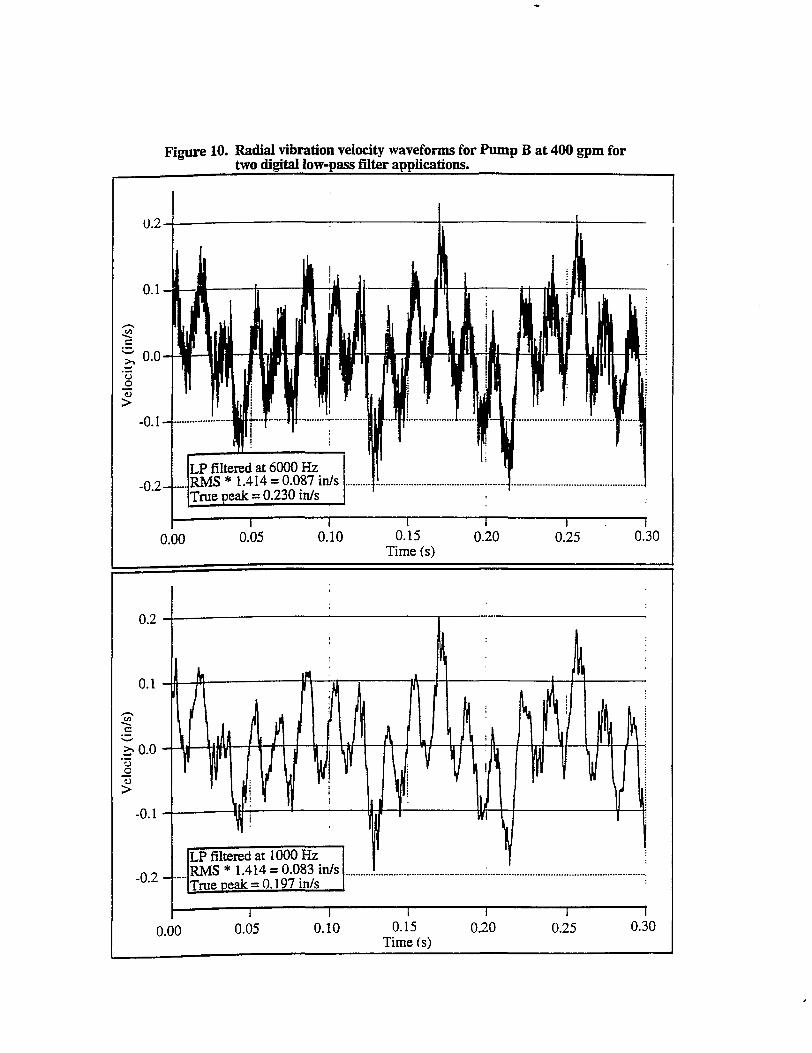
Figure 10. Radial vibration velocity waveforms for Pump B at 400 gpm for two digital low-pass filter applications.
o
>
LP filtered at 6000 Hz RMS* 1.414 = 0.087 in/s True peak = 0.230 in/s
0.00 0.05 0.10 1
0.15 Time (s)
0.20 0.25 0.30
- 0 . 2 -
LP filtered at 1000 Hz RMS* 1.414 = 0.083 in/s True peak = 0.197 in/s
0.00 0.05 0.10 0.15 Time (s)
0.20 0.25 0.30
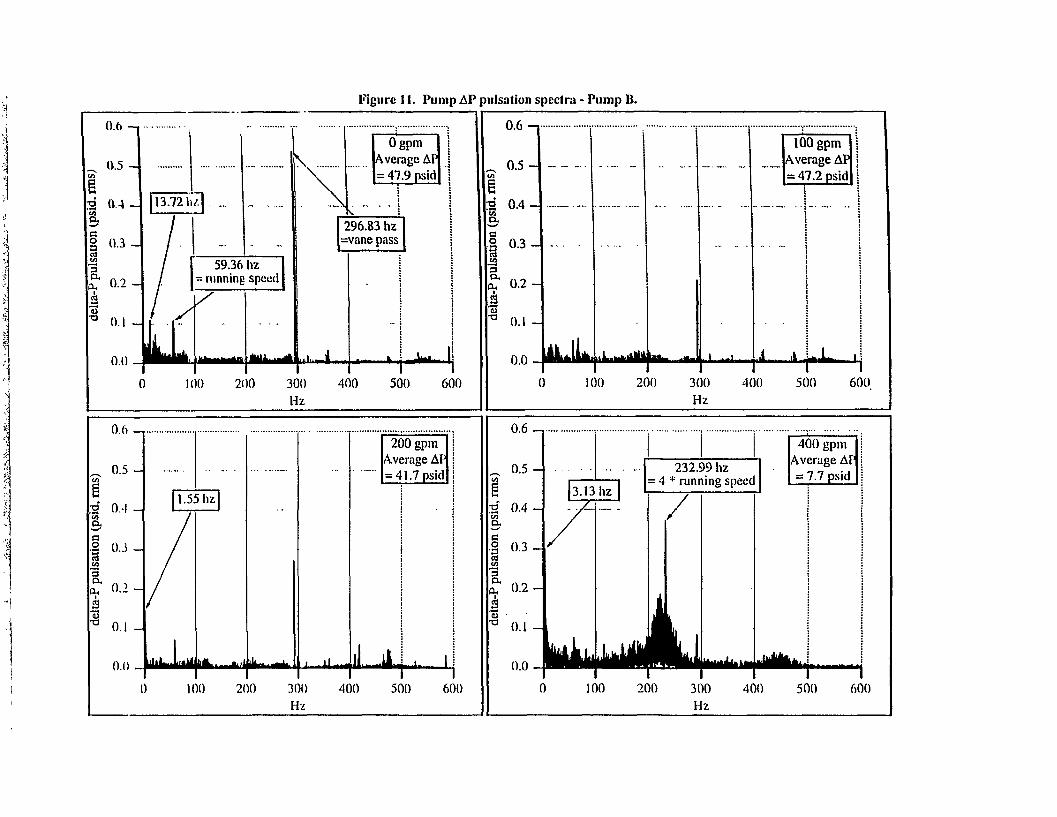
Figure 11. Pump AP pulsation spectra - Pump B.
Ogpm Average AP = 47.9 psid
59.36 hz : running speed
rta Mk, i^ i
296.83 hz =vane pass
200 r
300 Hz
-JL I i IILI 1
400 500 600
0.6 —.
0 . 5 -
3 0 . 4 -
CA
W
3 oT 0 .2 -s •° o.i -
0.0 100 200
100 gpm Average AP = 47.2 psid
1 ^ 0 .
300 Hz
400 500 600
1.55 hz
200
200 gpm Average AP = 41.7 psid
. ii —li—.iiJ. i- I
300 Hz
400 r
500 1 600
0 . 6 - ,
0.5 - 232.99 hz = 4 * running speed
vane pass pulsation amplitude is less man 0.5% of me head. At the highest flow condition, it is again over 1% of pump head.
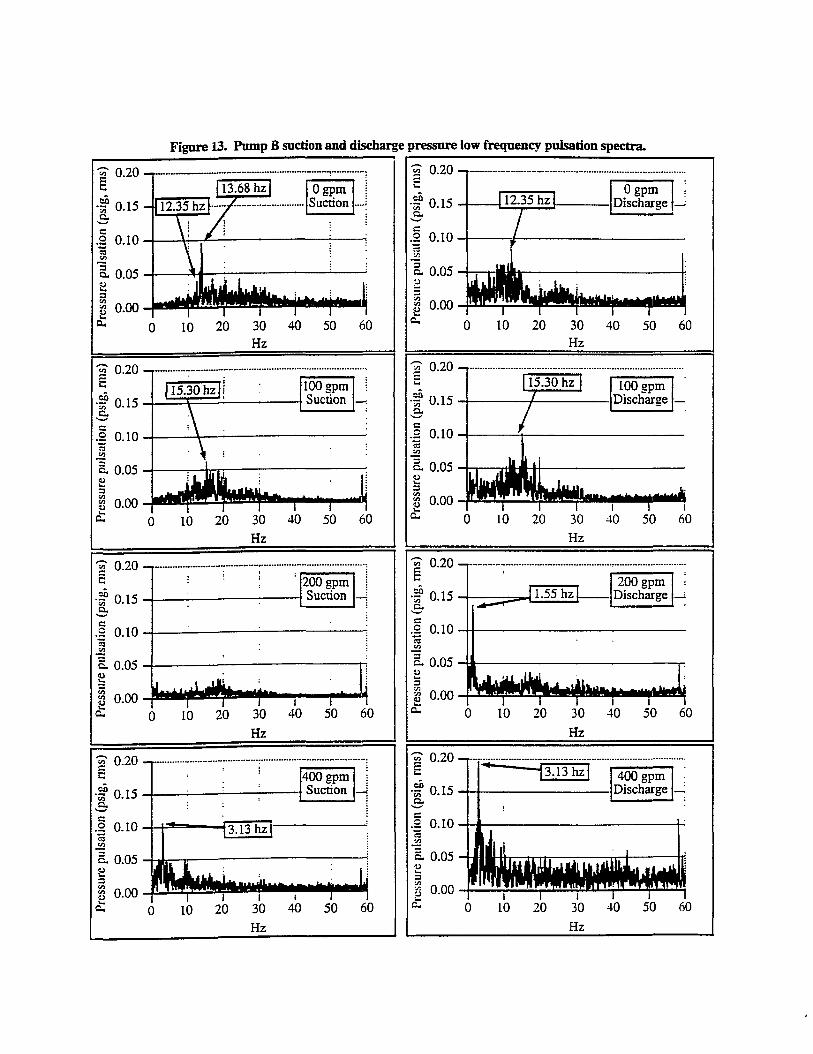
One particularly interesting result is me dramatic increase at four times running speed at the highest flow rate, accompanied by a general broadband noise in the spectrum in this vicinity.
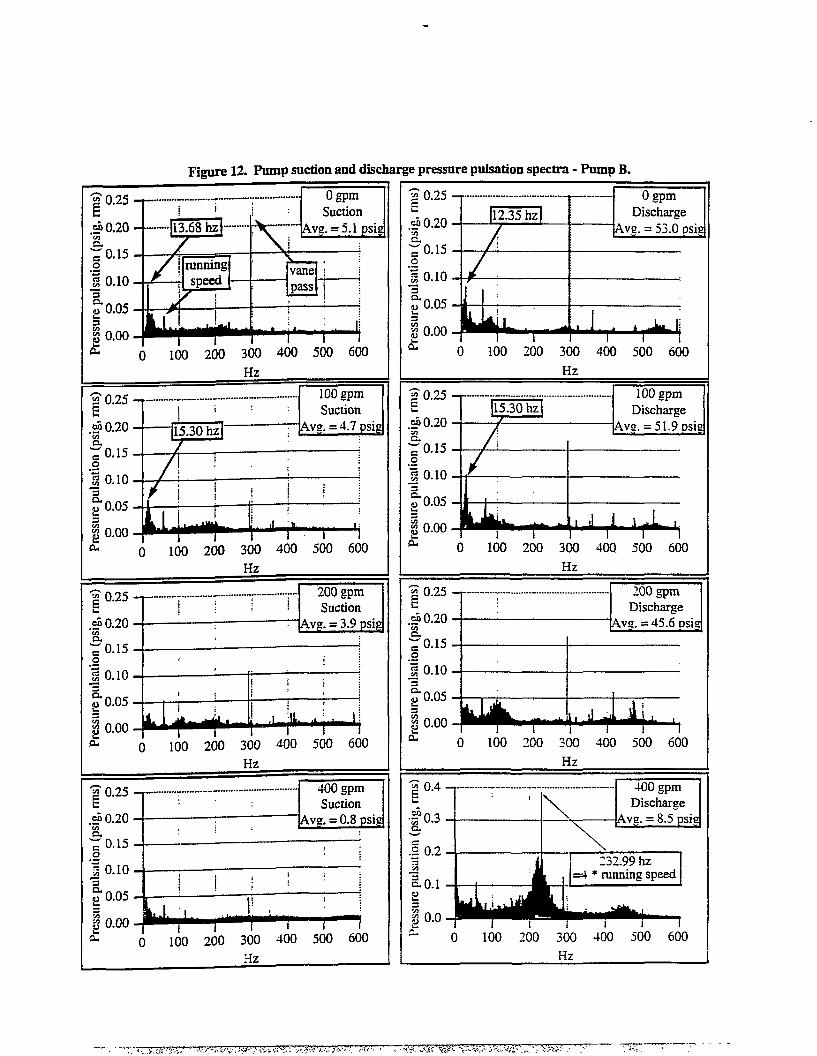
Pump suction and discharge pressure pulsation spectra are shown in Figure 12. The subsynchronous suction and discharge spectra are shown in more detail in Figure 13. By comparing the total head, the suction, and the discharge spectra, certain spectral components can be tied to specific sources. For example, the dramatic change in total head at four times running speed for the highest flow case (Figure 11) is not present in the suction pressure spectrum, but is present in the discharge spectrum (Figure 12). indicating that this is a discharge-related phenomenon. Another example feature of interest can be seen at 15.3 hz in both the suction and discharge pressure spectra at 100 gpm. but is not present in the total head spectrum. This suggests that an external influence, such as a resonant frequency in the loop, affected both signals individually, and is probably not a pump-generated component. Other spectral features such as the spectral peaks at 1.55 and 3.13 hz for the 200 and 400 gpm cases, respectively are common to all three signals. It is of interest that the ratio of these two frequencies is the same as the flow ratio.
4.D. Motor Power Analysis
Motor input power was monitored on both pumps. All three phases of current were monitored using clamp-on current transformers. All three phases of voltage were monitored using dropping resistor networks. The total input power was measured by summing the products of the individual phase currents and voltages (using both analog and digital multiplication).
Motor power acts as a transducer of the motor load. Obviously, as me motor load increases, the motor input power increases to accommodate the load; thus it is sensitive to changes in pump hydraulic and mechanical loads. For most motors, the motor power is relatively linear with load, so it is a parameter that gives a reasonably representative indication of load fluctuations. Motor power does have some inherent frequency limitations when monitoring pumps due to the rotating inertia of the motor and pump, as well as the pumped fluid. In order for- the motor power to change in an induction motor, the rotating speed must either increase or decrease (as the result of a load change). High frequency components, such as vane pass frequency, create load fluctuations at such a rate that the relatively large inertia of the rotating equipment and me pumped fluid essentially allow the motor to pass through these events with little or no change in speed.* However, for lower frequency load components, particularly at synchronous speed and below, the motor input power can be a relatively informative tool.
It might be noted here that motor current also responds to load changes, and has been historically used to monitor motor loads. 1 6 Motor current is somewhat non-linear with load for most motors (being most responsive at high loads), however, and its use to understand load fluctuations at different load conditions requires the application of a current vs. load adjustment. Current as a transducer of pump loads was not analyzed here for that reason. The ease of acquiring current (vs. power) makes it an inherently attractive parameter to monitor, and it is likely that with correction factors applied to account for non-linearities, current could also be effectively employed as a tool for understanding pump conditions.
Figure 14 provides normalized power spectra for Pumps A and B J The normalization is performed by dividing the power spectra by the average power for the particular flow condition. For Pump A, it can be cleariy seen that at the two low-flow conditions, the low frequency end of the power spectrum (up to about half of running speed) is much noisier. Also, note mat the spectral peak just below 30 Hz (corresponding to running speed) decreases wim increasing flow, which is exactly opposite to the pattern noted in the axial vibration data for Pump A. One possible interpretation of this apparent inconsistency emerges when it is recognized that both mechanical and hydraulic unbalance are manifested at running speed, but the phase angles of the mechanical and hydraulic unbalance components are not necessarily aligned. Since the pump motor input power is not particularly sensitive to mechanical unbalance (except at significant levels of unbalance, in our experience), but is sensitive to torsional load fluctuations, the data suggest that there is increased hydraulic unbalance at low flow; however, this hydraulic
* It misht be noted that vane pass frequency has been observed in spectral analysis of motor power, however. The results^o date show some promise, but have not been fully explored. f Note that the four flow conditions for Pump B power are not identical to those shown for vibration and pressure pulsation previously. Instead, the selected flow rates for both pumps are roughly equivalent, in terms of percent of BEP.
Pres
sure
pul
satio
n (p
sig,
rms)
o
o o
o o
o o
»-
—
1/1
o u
i (O
tO
o
u>
I
t>
•<: II
8 °
yo.g
a {o
o *
fl •a
3
y t/:
IS
Pres
sure
pul
satio
n (p
sig, r
ms)
o
o o
p p
o •—
to
O
J k
Pres
sure
pul
satio
n (p
sig, r
ms)
o
o o
o o
o o
—
H-
to
to
<-n
o u/>
o
w
:l to
o
. o
K
Q-f
c-N
O 8- 0\
o
. o
'P
O
•.
a f
£
Pres
sure
pul
satio
n (p
sig,
rms)
o
o o
o o
o Pr
essu
re p
ulsa
tion
(psi
g, r
ms)
o
o o
o o
o
Pres
sure
pul
satio
n (p
sig,
rms)
o
o o
o o
o Pr
essu
re p
ulsa
tion
(psi
g, r
nis)
o
o o
o o
o
003
N
5 N
5
3_
8" >—
-1— 500
1
CT>
Pres
sure
pul
satio
n (p
sig, n
ns)
Pres
sure
pul
satio
n (p
sig,
mis
) Pr
essu
re p
ulsa
tion
(psi
g, rn
is)
Pres
sure
pul
satio
n (p
sig,
nns
)
Pres
sure
pul
satio
n (p
sig, r
ms)
Pr
essu
re p
ulsa
tion
(psi
g, rm
s)
o o
o o
'*->
'<—
U
l O
O
l o -1
\
_Jl,55hz|
:
200 gpm Discharge 1
Pres
sure
pul
satio
n (p
sig,
nns
) Pr
essu
re p
ulsa
tion
(psi
g, ri
ns)
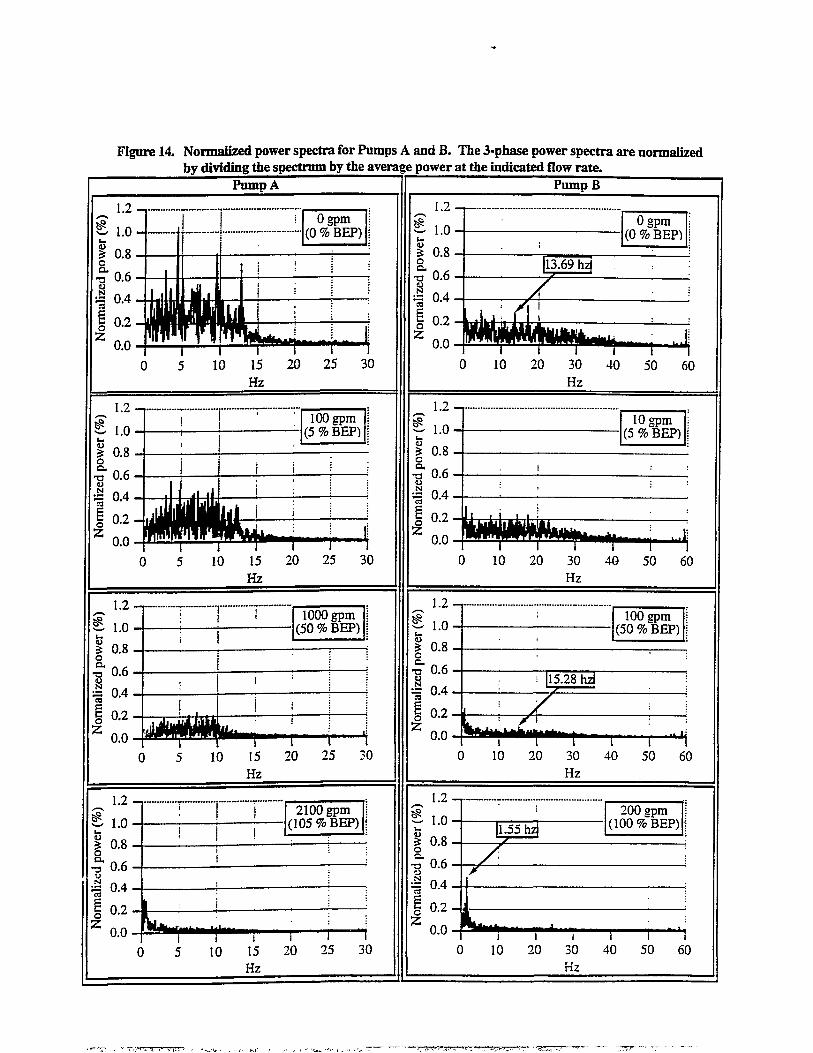
Figure 14. Normalized power spectra for Pumps A and B. The 3-phase power spectra are normalized by dividing the spectrum by the average power at the indicated flow rate.
unbalance is apparently out of phase, to some extent, with the existing mechanical unbalance, resulting in decreased overall running speed vibration at low flow conditions.
Pump B also has a level of low-flow related broadband noise at low frequencies (again, up to about half of running speed), although at a significantly lower absolute level than Pump A. The amplitude of the running speed peak (at just less than 60 Hz) also diminishes with increasing flow.
As flow rate increases, there is a general trend for both pumps to develop some very low frequency (<5 Hz) enerey. This can be seen for Pump A at 2100 gpm (105% BEP), and for Pump B at both 200 and 400 gpm (100% and 200% BEP, respectively). For Pump B, the energy is manifested as a more discrete peak.
Figure 15 presents a summary plot of power instability as a function of flow, including more flow conditions than have been discussed above. The motor power instability is calculated by dividing the standard deviation of the motor power by the average motor power, and is thus normalized for the different flow rates of a particular pump, as well as providing a common parameter against which to compare different pumps. The load of Pump B clearly fluctuates more at low-flow conditions than does Pump A. Both pumps have instability ratios that are comparable near the BEP, however. The test loop for Pump B is a relatively short loop which can be operated with minimal flow restrictions, thus allowing the pump to be run at flow rates significantly beyond its design condition. At die highest flow rate, the motor power exhibits more instability than at even the shutoff flow condition.
5. Comparing Results
Vibration and motor power data were recorded for Pump A. The results of the individual parameters were discussed above. The overall vibration velocity spectra (Figure 1) tend to be dominated by running speed and harmonics, making it more difficult to see the broader patterns in the acceleration domain (Figure 2). The acceleration domain spectra for Pump A (particularly axial vibration) show a considerably higher level of broadband noise at low flow rates (Figure 2). The lower frequency spectra of the vibration velocity show a marginal increase in low-flow related broadband noise from below running speed to about four times running speed. While these particular spectral components are not directly observable in the motor power signal, the results of the broadband noise are, in that the unstable flow-induced noise also causes lower frequency load variations that are manifested as input power fluctuations. It is important to note that the overall rms vibration velocity signals, measured in accordance with ASME code requirements (Figure 4), do not show the tendency toward hydraulically unstable conditions at low flow (although the variations in the rms amplitude do shed some insight).
Vibration, pressure pulsation, and motor power data were recorded for Pump B. The overall vibration amplitude was minimally affected by operation at either low or very high flow rates. The vibration acceleration spectra did show a significant increase in broadband, higher frequency noise at the highest flow rate (Figure 7).
The Pump B pressure pulsation data indicated that vane-pass frequency amplitude dropped with increasing flow rate. However, at the highest flow rate, a significant level of 4 times running speed activity was noted in the pump discharge pressure. Similar patterns were not found to exist in the vibration spectra. Some significant very low frequency peaks in the pressure pulsation data at the higher flow rates were observed. The amplitude of the running speed peak in the pump suction pressure was found to be largest at the lowest and highest flow rates.
For Pump B, as for Pump A, the motor power spectra do not show the same spectral features as vibration. However, there were identical spectral peaks in the motor power and pressure pulsation spectra at the low frequency range. For example, note the presence of spectral peaks at 1.55 hz in both the pressure and power spectra for the 200 gpm case. Although the power spectrum for the 400 gpm case is not shown, it also had a spectral peak in common with pressure pulsation (at 3.13 hz). The motor power instability was also consistent with the amplitudes at running speed in the pressure data. Likewise, for the highest flow condition, the high level of noise at four times running speed was manifested as an increased power fluctuation.
There are obviously a great number of other features that merit attention in correlating these signals. ORNL plans future activities to help better understand the signal correlations.
6. Summary and Conclusions
Previous studies indicate that the principal sources of service wear and degradation of internals for AFW pumps are hydraulic- and cavitation-reiated loads. Available literature indicates that various hydraulic-related stressors occur at frequencies ranging from as low as 0-10 Hz to 10 kHz (and beyond).
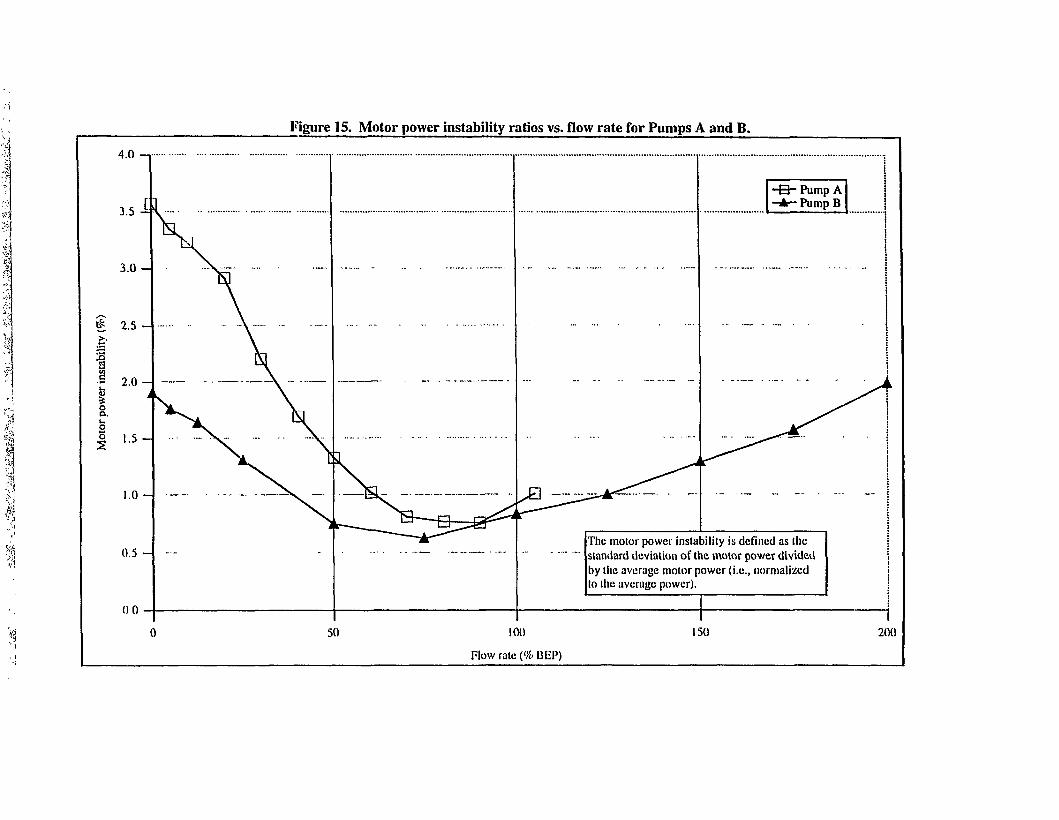
Figure 15. Motor power instability ratios vs. flow rate for Pumps A and B.
Vibration, pressure pulsation, and motor power measurements taken on two pumps indicate that there is, to a limited extent, consistency in the response of these parameters as hydraulically-related loads are changed.
The results of low flow-related hydraulic instability was clear in both the spectral vibration and motor power signals on a 2000 gpm BEP pump, and the two parameters showed generally consistent results, although the spectra were not direcdy comparable. The effects of low-flow instability can be recognized in born the vibration spectra and the motor power, but cannot be detected in me non-spectral vibration.
As expected, the level of instability at low flow was found to be significantly less in the smaller, 200 gpm BEP pump. Spectral vibration data provided little or no indication of instability at low flow, but clearly showed the effect of cavitation at flow rates significantly beyond BEP. Pressure pulsation spectra showed an increasing vane-pass frequency amplitude at low flow rates, and the presence of some relatively significant, very low frequency components at higher flow rates. A significant increase in four times running speed frequency, accompanied by surrounding broadband spectral noise was found in the pressure pulsation spectra. The very low frequency components present in the pressure spectra at higher flow rates were also observed in die power spectra.
The motor power instability appears to provide some useful insights into the general hydraulic stability of pumps that is complementary to that available from vibration spectra. Since radially and axially mounted vibration transducers will not necessarily be able to observe torsional fluctuations, motor power may be able to detect effects that cannot be detected by vibration (likewise, other sources of degradation, such as mechanical imbalance, may not be observed in motor power. Further study of how to best quantify and relate motor power to other parameters is needed before it can be applied more broadly.
Finally, die overall, non-spectral vibration amplitudes measured on these pumps were found to be insenstive to me hydraulic stability of the pump and to high-frequency related faults. The importance of spectral vibration monitoring was clearly borne out by the results.
References
1. Aging and Service Wear of Auxiliary Feedwater Pumps for PWR Nuclear Power Plants, NUREG/CR-4597, Vol. 1, M. L. Adams and E. Makay.
2. Auxiliary Feedwater System Aging Study, NUREG/CR-5404, Vol. 1, D. A. Casada. 3. Low-Flow Operation and Testing of Pumps in Nuclear Plants, Proceedings of the Svmposium on Inservice
Testing of Pumps and Valves, NUREG/CP-0111, W. Greenstreet. 4. Pump Testing in the Nuclear Industry: The Comprehensive Pump Test and Other Considerations,
Proceedings of the Second NRC/ASME Symposium on Pump and Valve Testing, NUREG/CP-0123, T. Hoyle.
5. Description of Comprehensive Pump Test Change to ASME OM Code, Subsection ISTB, Proceedings of the Third NRC/ASME Symposium on Valve and Pump Testing, R. S. Hartley.
6. Dynamic Loading on Pumps - Causes for Vibrations, Proceedings of the Tenth International Pump Users Symposium, S. Florjancic and A. Frei.
7. Centrifugal Pumps for General Refinery Service, API Standard 610, Seventh Edition, American Petroleum Institute
8. Code for Operation and Maintenance of Nuclear Power Plants, ASME OM Code-1990, including 1994 addenda, American Society of Mechanical Engineers.
9. Control of Backflow at the Inlets of Centrifugal Pumps and Inducers, Proceedings of the First International Pump Symposium, D. P. Sloteman, P. Cooper, and J. L. Dussourd.
10. Investigation of Pressure Pulsations Arising from Impeller/Diffuser Interaction in a Large Centrifugal Pump, Proceedings of the Rotating Machinery Conference and Exposition '93, E. Makay, P. Cooper, D. P. Sloteman, and R. Gibson.
11. A Case History - Improved Hydraulic Design Lowers Cavitation Erosion and Vibrations of a Water Transport Pump, Proceedings of the Tenth International Pump Users Symposium. S. S. Florjancic, A. D. Clother. F. J. L. Chavez.
12. 10CFR21 Reportability of a Potential Safety Hazard from Broken Cast Iron Diffusor Pieces in Auxiliary Feed Water Pumps, letter to R. Fuhrmeister (USNRC) from G. Young (Ingersoll-Rand), September 19, 1991.
13. Pump Vibrations. Proceedings of the Ninth International Pump Users Symposium. W. E. Nelson and J. W. Dufour.
14. Changes in Hydraulic Component Geometries Gready Increased Power Plant Availability and Reduced Maintenance Cost: Case Histories, Proceedings of die First International Pump Symposium. E. Makay and J. A. Barrett.
15. Trouble-Shooting High Energy Input Power Plant BFP Pumps, 1989 EPRI/MVI Centrifugal Pump Short Course Lecture Notes, E. Makay.
16. Aging and Service Wear of Electric Motor-Operated Vaives Used in Engineered Safetv-Feature Systems of Nuclear Power Plants, NUREG/CR-4234, VoL 2, H. D. Haynes.