Embed Size (px)
Citation preview

Master Class
on
PVsyst
Solar Project Designing Tool
7th
June 2013
10-06-2013

• Fundamental aspects of PV system design
• Performance assessment of PV systems
• PVSyst simulation process
• PV array shading analysis
• Custom engineering
• Simulating loss factors
• Assessment of hourly generation
• System design for fixed v/s tracking system
• PR calculations
• Hands-on PVSyst case studies for grid connected and rooftop systems
Objectives

Understanding Solar PV Technologies
10-06-2013

Solar PV technologies
10-06-2013

Solar PV Price Trends
-
0.50
1.00
1.50
2.00
2.50
3.00
May
-09
Jul-
09
Sep
-09
No
v-0
9
Jan
-10
Mar
-10
May
-10
Jul-
10
Sep
-10
No
v-1
0
Jan
-11
Mar
-11
May
-11
Jul-
11
Sep
-11
No
v-1
1
Jan
-12
Mar
-12
Crystalline($ / Wp) Thin film CdS/CdTe($ / Wp) Thin film a-Si/µ-Si($ / Wp)
Months & Year
pri
ce
in
us d
olla
r $
10-06-2013

PV Prices have been free fall over past couple of years
Efficiency Increases
Economy of scale
Increased competition
Innovative technologies
Source: ITRPV, SEMI
10-06-2013

PV Material Trends-Silicon wafer price
0
10
20
30
40
50
60
70
80
2010 2011 2012
Silicon price $/kg
Silicon price $/kg •The PV module cost is function of material price and the efficiency of conversion •The silicon price trends will lead to the module price in the range of $ 0.5/Wp by 2017 •Reduction in wafer thickness has also led to reduced module price. •Further there is a trend in glass thickness reduction, larger ingot size, and back contact options. Source: ITRPV, SEMI, PG Group
10-06-2013
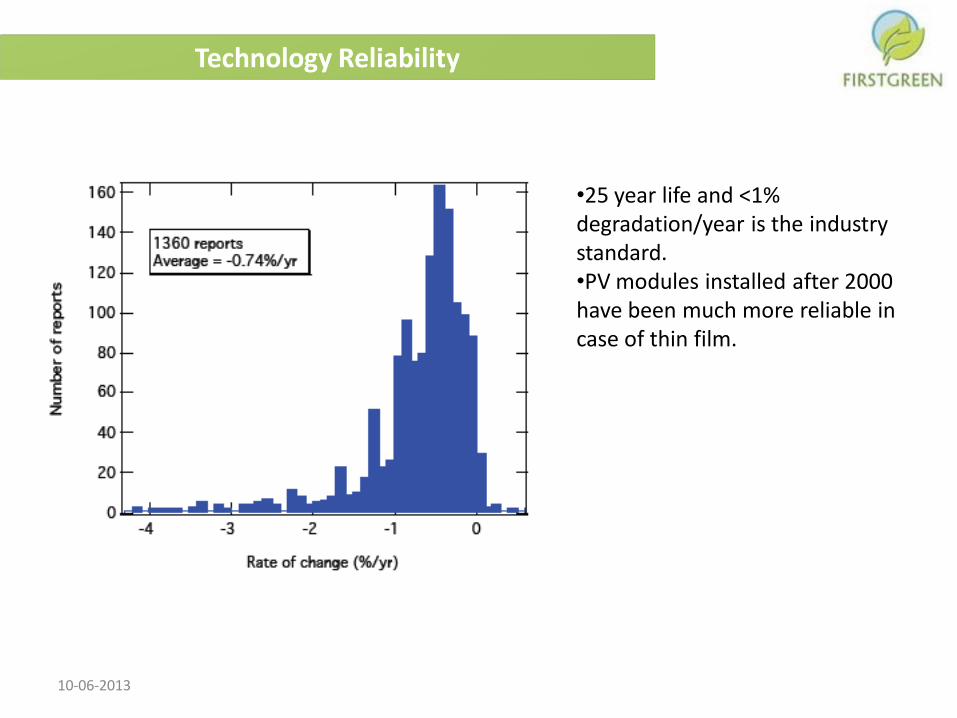
•25 year life and <1% degradation/year is the industry standard. •PV modules installed after 2000 have been much more reliable in case of thin film.
10-06-2013

10-06-2013
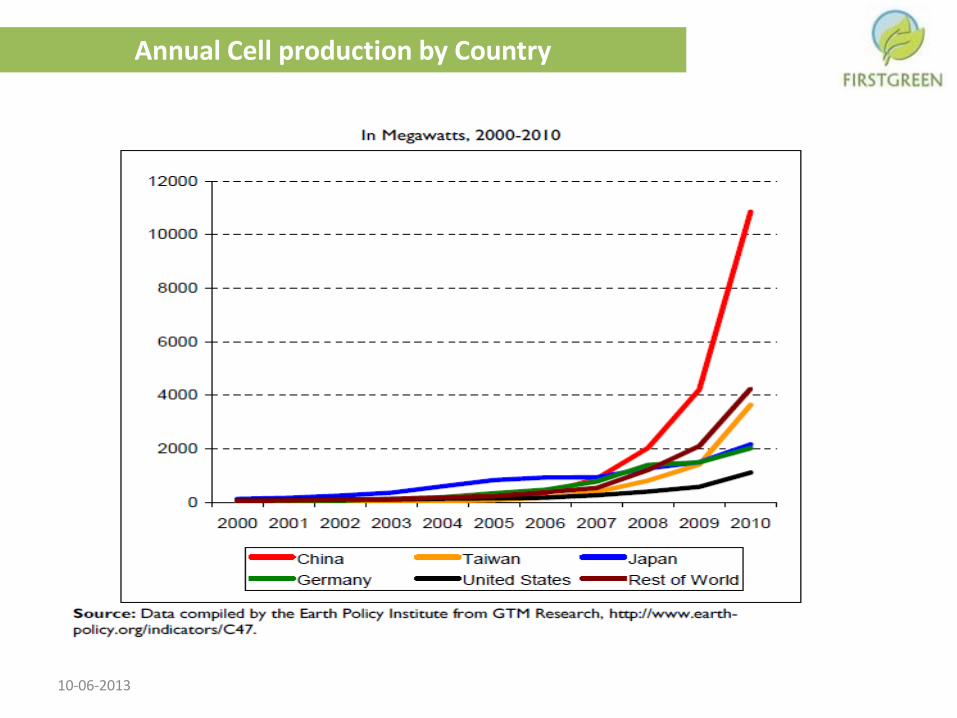
Annual Cell production by Country
10-06-2013

Solar Resource Assessment
10-06-2013

Average GHI and DNI In India
Source :NREL 10-06-2013

Solar radiation data
10-06-2013
0
1
2
3
4
5
6
7
8
Jan Feb Mar Apr May Jun Jul Aug Sep Oct Nov Dec
G
H
I
(
k
W
h
/
s
q
.
m
/
d
a
y)
MNRE-NREL Meteonorm
NASA Solar GIS (for last 1 year)
• The GHI for the region is ranging from 4
kWh/sq.m./day from 3.26 to 7.42 kWh/sq.m./day.
As per Meteonorm database, the annual GHI of
the site is 2021 kWh/sq.m
• Four types of data sources are compared for the
site (GHI (kwh/sq.m./day). These include MNRE-
NREL, NASA-SSE and Meteonorm and Solar GIS
(1 May’12-30 Apr’13)
• MNRE-NREL model estimates annual average
GHI at 10 km resolution based on hourly estimates
of radiation over 7 years (2002-2008)
• NASA-SSE is satellite monthly data for a grid of
1°x1° (111 km) covering the whole world, for a 10
years period (1983-1993).
• Solar GIS values represent an area of 250 m x
250 m

Data Uncertainty
10-06-2013

Insolation
• Insolation-Incident Solar Radiation, kWh/m2.
• Approximately 1 kW/m2 at the earth’s surface.
1 kW/m2 of irradiance for 5 hours
= 1 kW/m2 x 5 hr = 5 kWh/m2 of insolation
5 kWh/m2 of insolation on a 2 sq-m surface
= 5kWh/m2 * 2 m2 = 10 kWh of energy received byt he surface.
10-06-2013

Uncertainty in Energy Yield Prediction
10-06-2013

System sizing
10-06-2013

PV string
10-06-2013

Module specifications
10-06-2013

Module Characteristics
I-V Characteristics with respective Irradiance
10-06-2013
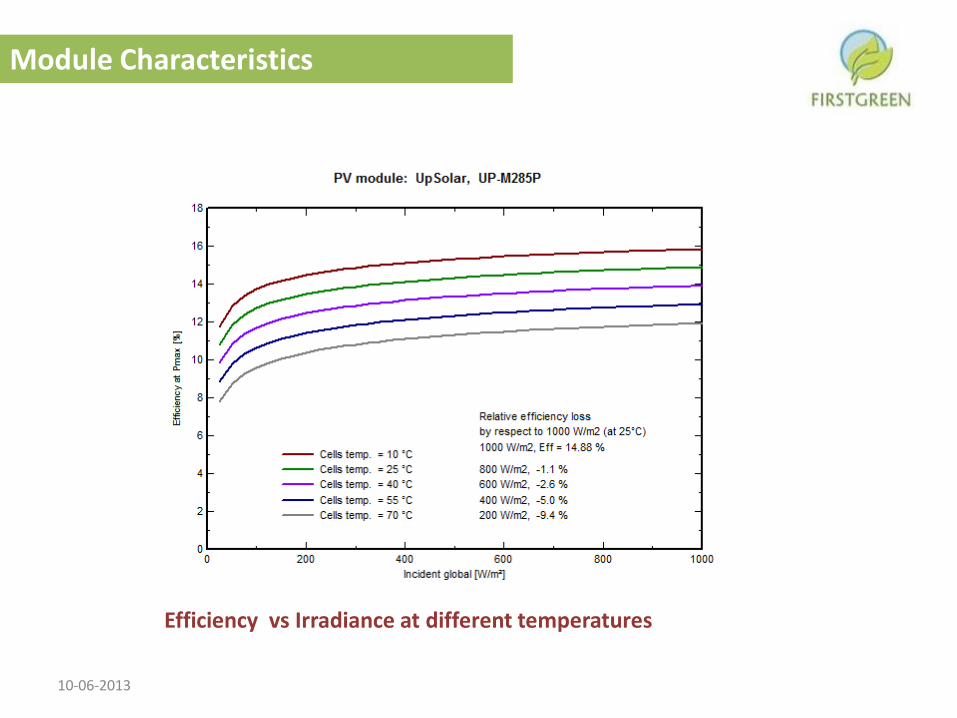
Module Characteristics
Efficiency vs Irradiance at different temperatures
10-06-2013
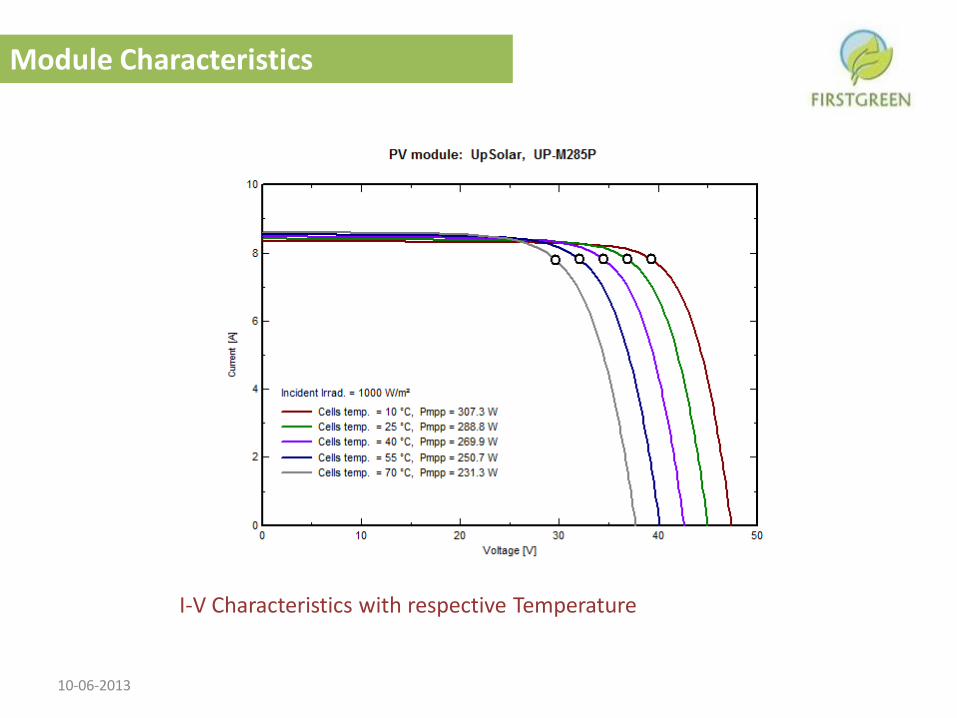
Module Characteristics
I-V Characteristics with respective Temperature
10-06-2013

Fixed and Tracking Structures
Single axis tracking
Dual axis tracking
10-06-2013
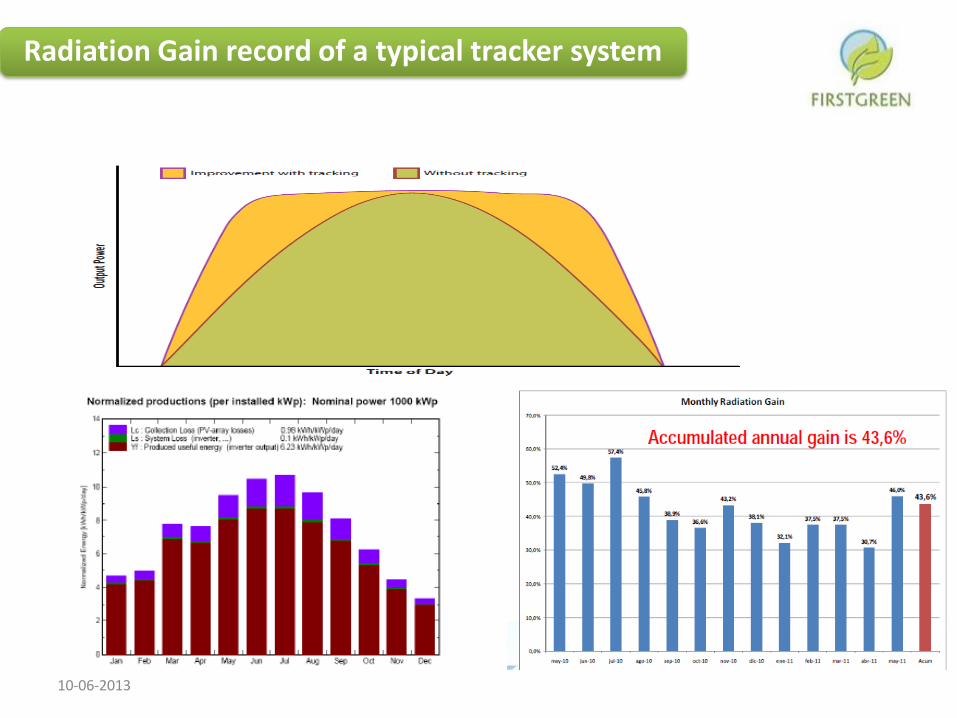
Radiation Gain record of a typical tracker system
10-06-2013
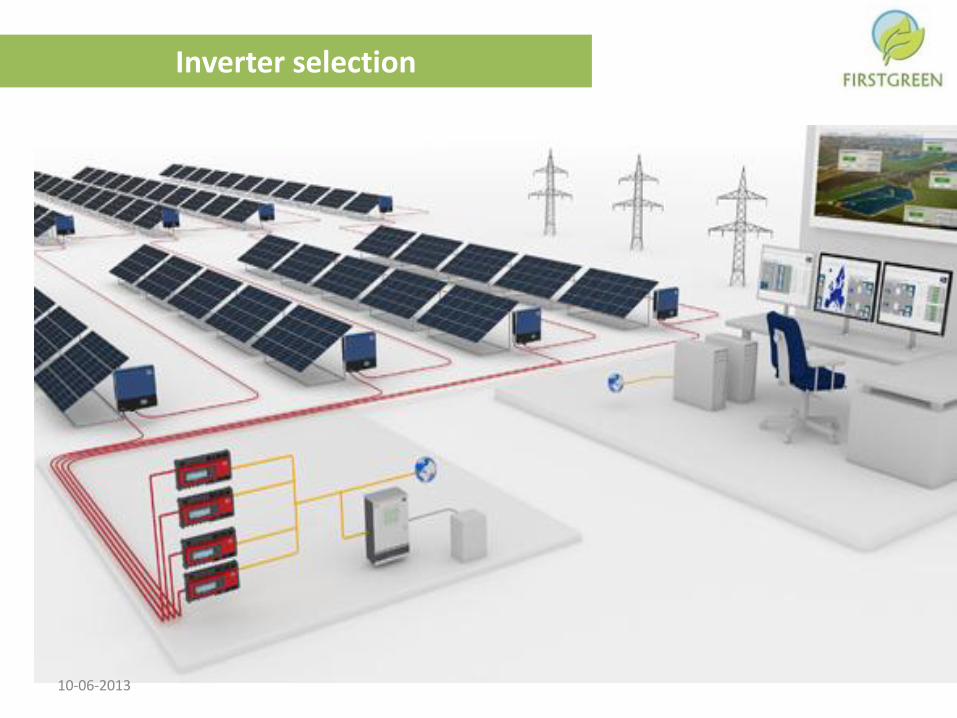
Inverter selection
10-06-2013

10-06-2013

Effect of Temperature on Inverter
09-06-2013
PVsyst

Effect of Temperature on Inverter
09-06-2013

10-06-2013

Effect of shading on PV cell
09-06-2013
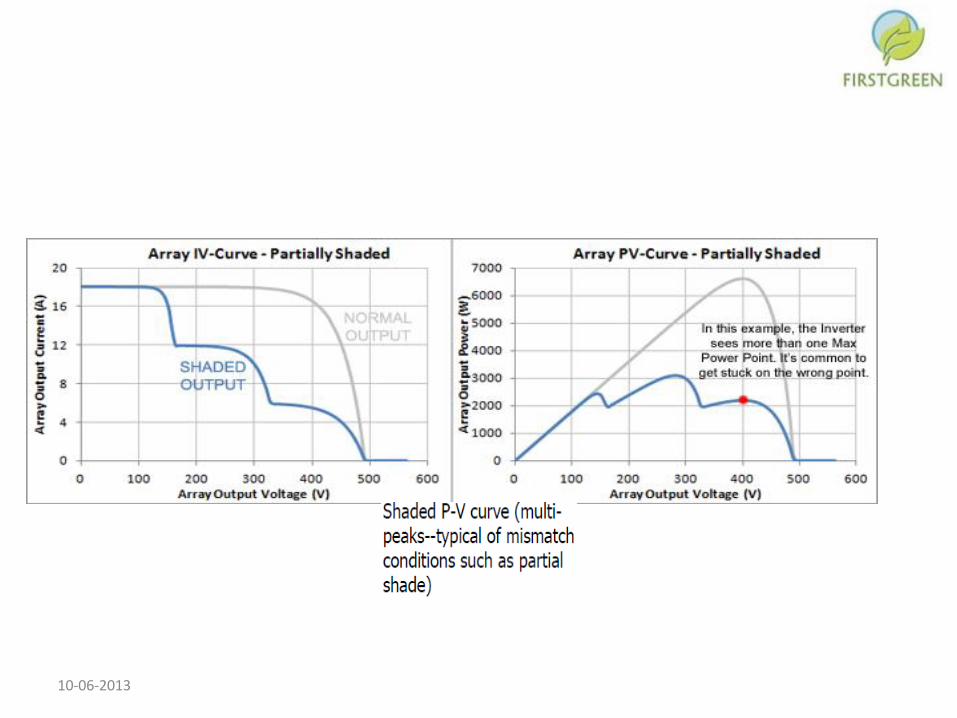
10-06-2013

Shading Analysis
09-06-2013

10-06-2013

Shading Analysis – Lateral shading
34 First Green Consulting Pvt Ltd,U 28A/3 FF, White Town House DLF Ph III Gurgaon, Haryana – 122002, India
• As the plant has a slope towards west, the adjoining array has level difference of about 6 inches which is causing lateral
shading on the adjoining panels. A shading analysis for typical 2 arrays was conducted and observed that about 0.136% of
energy is lost due to lateral shading. This accounts for a loss of 12.7 MWh of energy on annual basis and leads to a revenue
loss of approx. INR 148,000

CABLE SIZING
ACSR cable Copper cable
-1 % saving in the conductor losses can save about 20 Lakh rupees in case of a typical 5MW plant. -The Ampacity of DC Cable is function of temperature. - Aluminium conductors have higher resistance and low ductile strength. -Low voltage drop in Copper cables , generally used at DC side of the plant. -Bunching of cables reduces Ampacity .
09-06-2013

Correction factor for cables at different temperatures
• As temperature increases ,the Ampacity of the conductor reduces .So correction factors are to be considered before sizing of a cable .
09-06-2013

10-06-2013
0
100
200
300
400
500
600
700
800
25 30 35 40 45 50 55 60 65 70 75 80
Vo
ltag
e in
V
Temperature in Deg C
Voltage drop in string cable with temperature
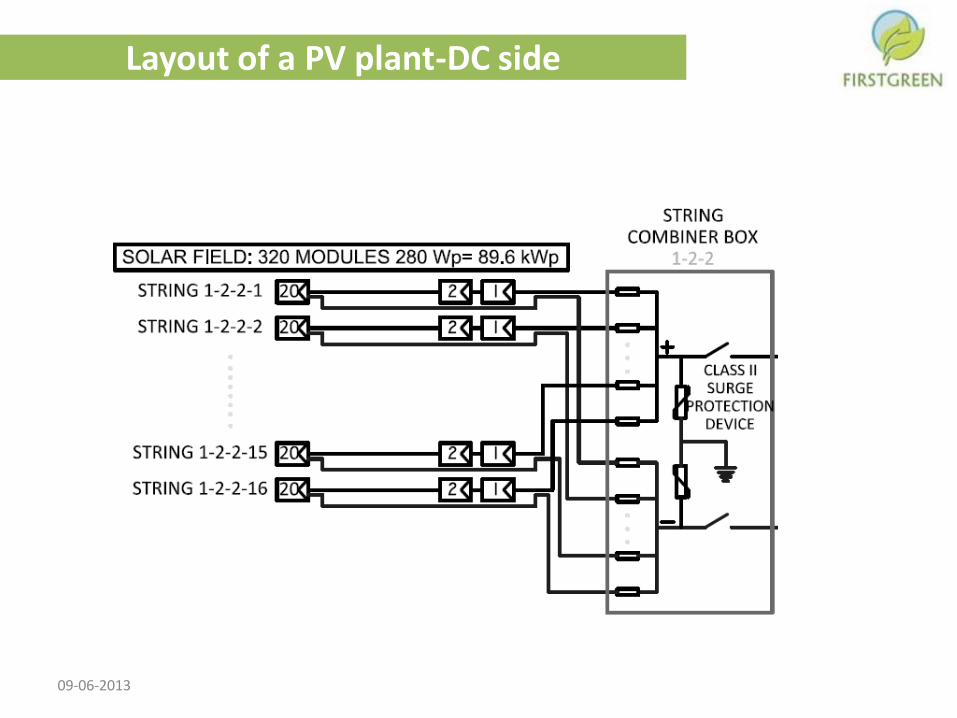
Layout of a PV plant-DC side
09-06-2013
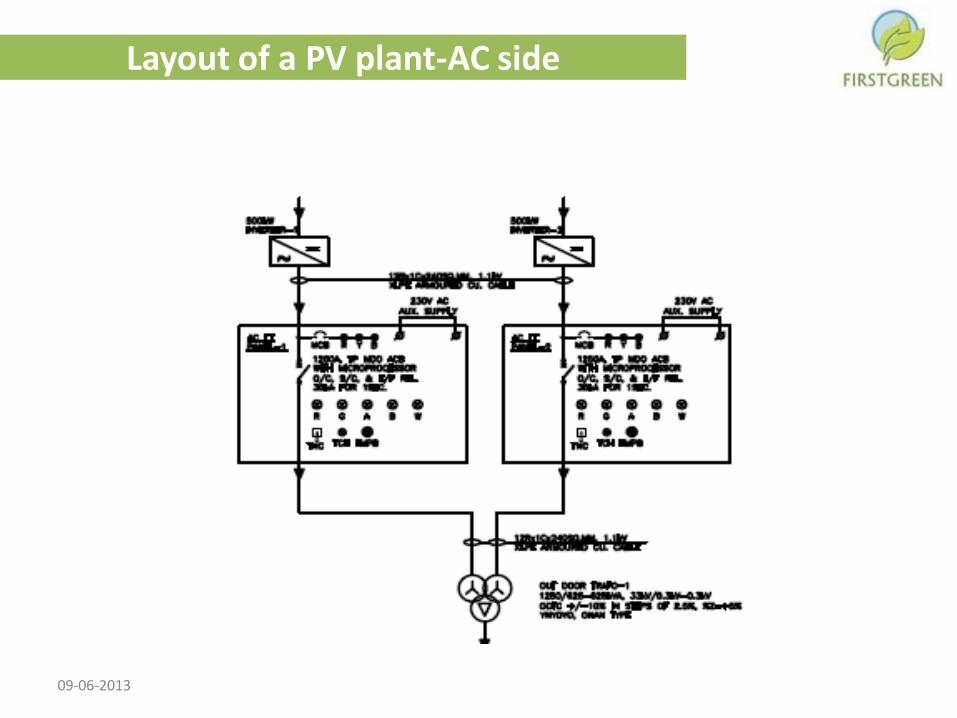
Layout of a PV plant-AC side
09-06-2013
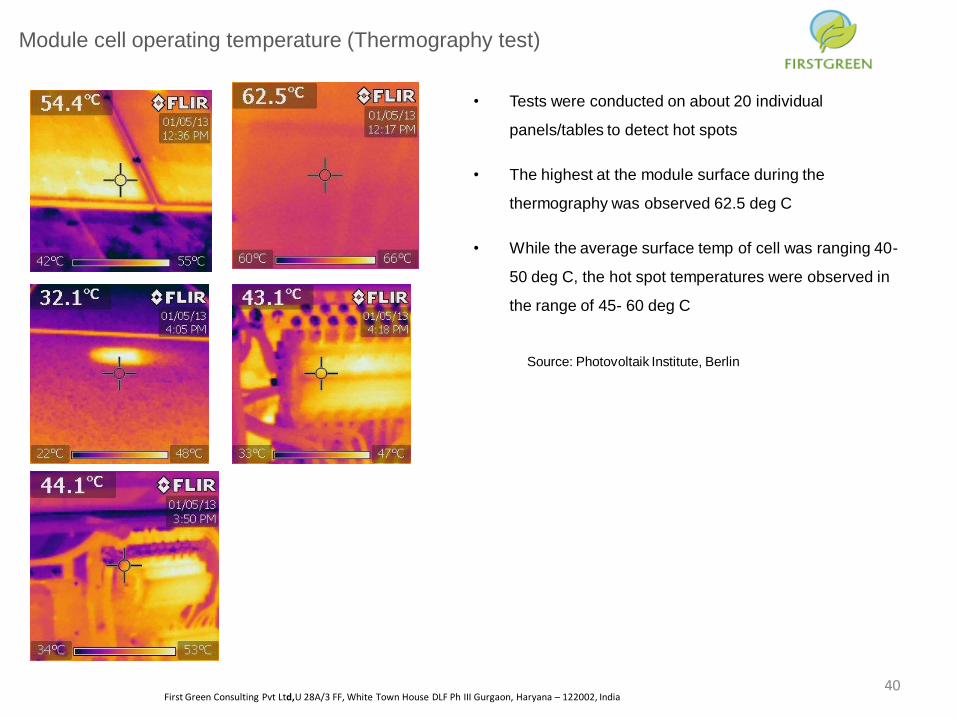
Module cell operating temperature (Thermography test)
• Tests were conducted on about 20 individual
panels/tables to detect hot spots
• The highest at the module surface during the
thermography was observed 62.5 deg C
• While the average surface temp of cell was ranging 40-
50 deg C, the hot spot temperatures were observed in
the range of 45- 60 deg C
40 First Green Consulting Pvt Ltd,U 28A/3 FF, White Town House DLF Ph III Gurgaon, Haryana – 122002, India
Source: Photovoltaik Institute, Berlin

41
Review of Plant Performance
First Green Consulting Pvt Ltd,U 28A/3 FF, White Town House DLF Ph III Gurgaon, Haryana – 122002, India
0.00
0.20
0.40
0.60
0.80
1.00
1.20
Jan Feb Mar Apr May Jun Jul Aug Sep Oct Nov Dec
Actual PR Vs Calculated PR
Actual PR Calculated PR

Shading Analysis
42 First Green Consulting Pvt Ltd,U 28A/3 FF, White Town House DLF Ph III Gurgaon, Haryana – 122002, India
•There is a loss of 163.3 MWh of energy due to effect of shading on the plant during morning and evening hours resulting in
a revenue loss of INR 19 lacs
• The shading losses are of the order of 1.73%. These losses are expected to be further higher as the array face the shading
during the morning hours due to differential leveling of array structures
9150
9200
9250
9300
9350
9400
9450
9500
Generation without shading Generation with shading
G
e
n
e
r
a
t
i
o
n
(
M
W
h)
Loss in Energy due to shading

Loss diagram for 1MW plant
09-06-2013

Thank You
First Green Consulting Private Limited
U-28A/3 FF, White Town House
DLF Ph III Gurgaon,
Haryana – 122002, India
Tel.: (+91) 124 424 1750 , 9899295854
Fax: (+91) 124 424 1751
Web: www.firstgreenconsulting.in
Email: [email protected]
Blog: firstgreenconsulting.wordpress.com
09-06-2013


![Analysis of the impact of PVSyst thermal loss factor ...sudied using PVSyst simulation software [17]. In PVSyst, the thermal loss due to the PV module mounting approach is captured](https://img.pdfslide.us/doc/110x75/5e69493acf083c0ae92c7062/analysis-of-the-impact-of-pvsyst-thermal-loss-factor-sudied-using-pvsyst-simulation.jpg)