Embed Size (px)
Citation preview
Massey Research Online Massey University’s Institutional Repository
Massey authors: Prinsen, Gerard Purcell, Gisela Prinsen, G & Purcell, G. (2013). Measuring, defining, and valuing change: A database on development indicators for policy-makers, activists, and researchers. Palmerston North. N.Z.: Massey University. Institute of Development Studies http://hdl.handle.net/10179/4950 Copyright is owned by the Author(s) of the paper. Permission is given for a copy to be downloaded by an individual for the purpose of research and private study only. The paper may not be reproduced elsewhere without the permission of the Author(s).
uploaded
Measuring, defining, and valuing change: A database on development indicators for policy-makers, activists, and researchers
Development Studies
Working Paper Series
2013/1
Institute of Development Studies
Massey University, New Zealand
Gerard Prinsen and
Gisela Purcell
IDS Working Paper 2013/1
Institute of Development Studies Working Paper Series 2013/1
Measuring, defining, and valuing change: A database on development indicators for policy-makers, activists, and researchers
Gerard Prinsen and Gisela Purcell
ISSN 1179-2973
ISBN 978-1-877147-14-2
Institute of Development Studies School of People, Environment and Planning Massey University Working Paper Series
The Institute of Development Studies welcomes contributions to its online, peer-reviewed Working Paper Series. The Working Paper Series aims to provide a forum for discussions around the contemporary theory and practice of development. It is intended to disseminate research findings in a timely manner and encourage discussion and debate on development issues. We are open to contributions from academics, post-graduate students, and development policy makers or practitioners.
Publication in this Working Paper Series does not necessarily preclude subsequent publication in a journal or book. Submission of an identical article to a journal or book would not, however, be appropriate. Guidelines for submissions can be found at www.dev.massey.ac.nz
For enquires regarding the working paper series please contact the Editor:
Associate Professor Glenn Banks Institute of Development Studies School of People, Environment and Planning Massey University Private Bag 11 222 Palmerston North New Zealand [email protected]
Measuring, defining, and valuing change
Abstract The use of indicators in international development has increased exponentially since the 1990s. Composite and proxy indicators are used to measure a wide range of concepts but their shortcomings have been widely critiqued. Through a review of over 300 documents, this paper gives a brief history of the rise of “indicatorology” and then summarizes the key challenges in three categories: technical/operational, political/strategic and epistemological/conceptual. Technical challenges faced by development practitioners revolve around the over-simplification of complex issues and the conflation of the goals with indicators. Political challenges involve the inherent power of indicators and the implications they have for policy making. Epistemological challenges question how to balance scientific rigor with local knowledge in the creation and use of indicators. A database of all publications used in this research is being made accessible to development practitioners and researchers via Massey University – watch this space!
Key words: Indicators, database, poverty measurement, monitoring and evaluation,
assessment, results based management
Biographical Note Gerard Prinsen works as a lecturer at Massey University’s Development Studies programme. Gisela is studying for a Master’s Degree in Development Studies at Massey University. Dr Gerard Prinsen Development Studies, School of People Environment and Planning, Private Bag 11222 Massey University, New Zealand [email protected].
Gisela Purcell Development Studies, School of People Environment and Planning, Private Bag 11222 Massey University, New Zealand [email protected].

IDS Working Paper 2013/1
Measuring, defining, and valuing change
1
Introduction: Indicators are Coming Development indicators have a whakapapa. One of their ancestors was the Gross Domestic Product (GDP), created for domestic policy-making in the USA in the 1930s and then promoted for international policy-making after World War II by the International Monetary Fund (IMF) and the World Bank (Costanza et al., 2009; Marcuss & Kane, 2007). Another ancestor of development indicators was the management approach called ‘management-by-objectives’, which came to dominate management of private corporations in the 1960s and 1970s (Drucker, 1955, 1964). Indicators then grew in importance and number under the New Public Management that spread throughout the public sector in the 1980s. Margaret Thatcher announced her reform of the public sector with a call that, “a thousand performance indicators should flourish” (Dooren, Bouckaert, & Halligan, 2010, p. 43) and a civil servant was expected to be “reborn as a manager” (Carter, Klein & Day, 2002, p. 1).
The next milestone in the life of indicators was the first Human Development Index published by the UNDP in 1990. It marked the point where the new public management and indicators moved from the domestic public sector into the international development sector, often translated as Results-Based Management (RBM). By the time the 8 Millennium Development Goals (MDGs) with their 18 targets and 60 indicators were adopted by almost every Head of State in the year 2000, indicators had moved to the centre stage and the daily life of development work was re-defined as ‘development management’. “RBM was applied to the MDGs in a very direct fashion” (Hulme, 2010, p. 20). Following suit in the same year, Massey University overhauled one of its two core papers in Development Studies and re-defined it as “131.702 Development Management”; indicators were added to the curriculum.
Many indicators – for example those pertaining to the millennium goals – are simple and quantifiable: $1-a-day, primary school enrolment ratios, or infant mortality rates. However, the introduction of the Human Development Index in 1990 not only heralded the introduction of indicators in international development programmes, it also marked the point where a new type of indicator began to spread in international policy-making: the composite indicator.1 To arrive at the composite indicator of the Human Development Index, Amartya Sen and Mahbub ul Haq selected, weighted, and fused diverging indicators for life expectancy, education, and per capita income
1 The Human Development Index of 1990 stands out because it marks the ascendancy of composite indicators as an important part of public policy-making and public debate around international development. However, it was by no means among the first composite indicators. In the 1940s, The US Bureau of Agricultural Economics developed composite indicators called “the level of living indexes”, which merged various “indicants” (the word ‘indicator’ was not yet used) of America’s rural families’ level of living, such as dwelling units with fewer than 1.51 person per room, dwelling units with radios, farms’ gross income and possession of cars of 1936 or later models, and the median grade of school years completed by persons over 25 years of age living on the farm (Hagood & Ducoff, 1944). Later, in 1972, Nordhaus and Tobin created a composite indicator called Measure of Economic Welfare (MEW) for American states, which weighted indicators as diverse as defence expenditure, pollution, congestion, crime, public services, investment, and leisure time (1972). In the 1960s and 1970s, the UN Research Institute for Social Development designed several composite indicators for international development that weighted and merged diverging indicators not only for income, goods and services, but also for nutrition, shelter, health, education, leisure, and security (Hicks & Streeten, 1979). Similarly, in the late 1970s, the Overseas Development Council designed a composite indicator called the Physical Quality of Life Index (PQLI), which combined indicators for life expectancy, infant mortality and literacy (Larson & Wilford, 1979). However, none of these composite indicators for development gained political or policy-relevance – unlike the Human Development Index in 1990.
IDS Working Paper 2013/1
2
in a country into one single number, which then allowed ranking one country’s human development against that of other countries.2 Composite indicators grew in importance from the late 1990s, as international development programmes not only acquired a more managerial approach, but also moved away from supporting discreet local projects and began seeking wide societal or systemic change: increased empowerment of women, enhanced institutional capacity, stronger Human Rights, improved public participation, reduced state fragility, enlarged policy sovereignty, increased community resilience. To measure such wide and far-reaching changes, simple indicators do not suffice; composite indicators might.
The creation and use of indicators, and particularly composite indicators, has increased dramatically over the last few years. Our google-scholar search suggests 136 composite indicators had been created by the year 2000 and other researchers found this number rose to 992 in 2005 and to 5,340 in 2010 (Paruolo, Saisana, & Saltelli, 2012). However, the rapidly expanding use of indicators was also accompanied by numerous critiques. Some researchers warned early on against the creation of a “indicator industry” (Hood, 1991, p. 9) and Amartya Sen seems to have second thoughts about his own invention when he joined hands with another Nobel Prize winner Joseph Stiglitz to warn against, “these indices, their perceived opacity, their methodological shortcomings, and the potential for misinterpretation and misuse” (Stiglitz, Sen, & Fitoussi, 2009, p. 194). The OECD cautioned indicators may, “invite users, especially policy makers, to draw simplistic analytical or policy conclusions” (OECD, 2008, p. 13).
More recently, reviewers claimed – half seriously – that the creation of huge numbers of composite indicators points to the birth of a science of “indicatorology” (Morse & Bell, 2011, p. 222) or lead to a “obsessive compulsive measurement disorder” (Pratt, 2012). Massey staff in the Development Studies programme has – half in jest – wondered in the last year who among ourselves and colleagues at other universities suffered from indicatoritis and who was inclined to indicatorophilia.
However, these academic debates have not slowed down the spread and use of indicators, particularly by policy-makers. For example, an MP of New Zealand’s Green Party currently promotes a private member’s bill titled “The Public Finance (Sustainable Development Indicators) Amendment Bill”, seeking to add 37 new indicators to measure prosperity.3 And by the end of this year, the UN is expected to present the official Sustainable Development Goals (SDGs) – succeeding the MDGs – and by one estimate they may be measured in as many as 188 indicators (Prinsen, 2013). Unsurprisingly, development studies students and staff are increasingly drawn into debating ‘indicatorology’ and into designing indicators for the ‘indicator industry’.
As a staff member and a student, we have an interest in indicators and financially aided by a summer scholarship from Massey University, we recently took stock of the current state of the debate in the literature regarding development indicators. In the process, we established an on-line database with publications on indicators accessible for policy-makers, activists, and researchers. This working paper starts by describing our research methodology and key findings, before outlining the debates
2 Interestingly, under the banner of “Pushing the frontiers of measurement”, the UNDP describes these three variables’ work in much broader and more ambitious terms: “measure[s] the average achievements in a country in three basic dimensions of human development: a long and healthy life, access to knowledge and a decent standard of living” (see: http://hdr.undp.org/en/statistics/indices/).
3 The bill and further detail can be found at the following hyperlink: http://www.greens.org.nz/misc-documents/public-finance-sustainable-development-indicators-amendment-bill-dr-k-graham-mp
Measuring, defining, and valuing change
3
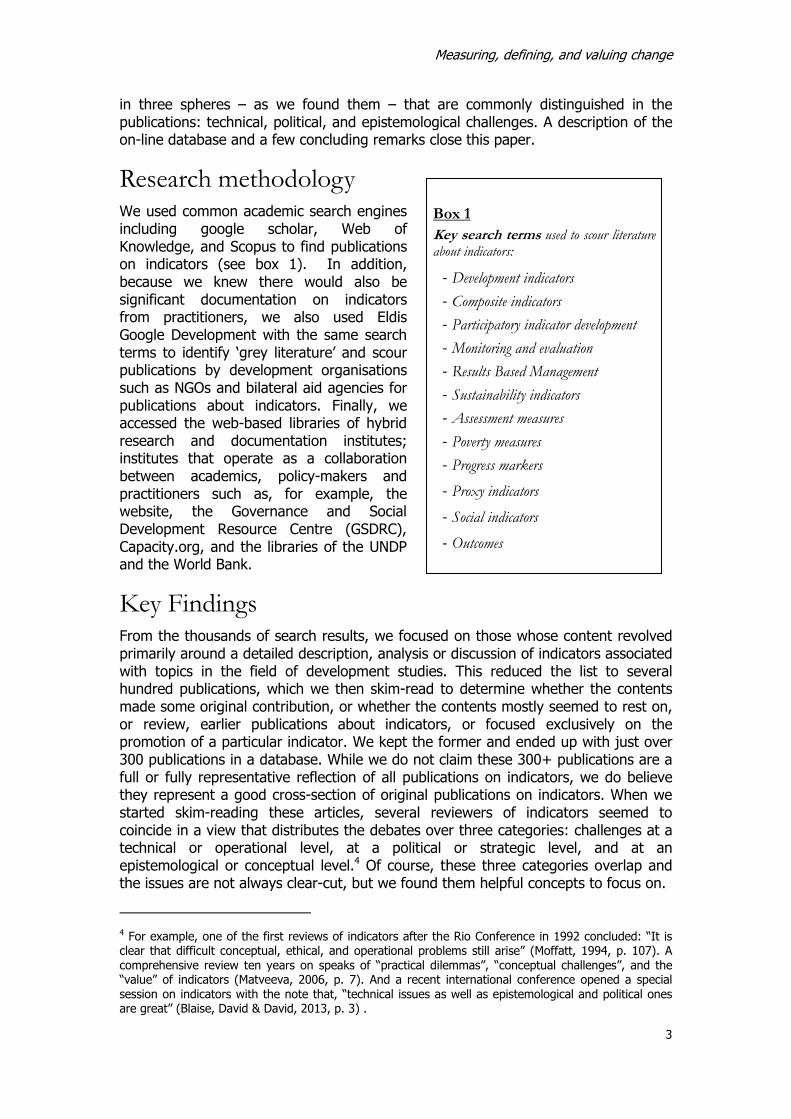
Box 1
Key search terms used to scour literature about indicators:
- Development indicators
- Composite indicators
- Participatory indicator development
- Monitoring and evaluation
- Results Based Management
- Sustainability indicators
- Assessment measures
- Poverty measures
- Progress markers
- Proxy indicators
- Social indicators
- Outcomes
in three spheres – as we found them – that are commonly distinguished in the publications: technical, political, and epistemological challenges. A description of the on-line database and a few concluding remarks close this paper.
Research methodology We used common academic search engines including google scholar, Web of Knowledge, and Scopus to find publications on indicators (see box 1). In addition, because we knew there would also be significant documentation on indicators from practitioners, we also used Eldis Google Development with the same search terms to identify ‘grey literature’ and scour publications by development organisations such as NGOs and bilateral aid agencies for publications about indicators. Finally, we accessed the web-based libraries of hybrid research and documentation institutes; institutes that operate as a collaboration between academics, policy-makers and practitioners such as, for example, the website, the Governance and Social Development Resource Centre (GSDRC), Capacity.org, and the libraries of the UNDP and the World Bank.
Key Findings From the thousands of search results, we focused on those whose content revolved primarily around a detailed description, analysis or discussion of indicators associated with topics in the field of development studies. This reduced the list to several hundred publications, which we then skim-read to determine whether the contents made some original contribution, or whether the contents mostly seemed to rest on, or review, earlier publications about indicators, or focused exclusively on the promotion of a particular indicator. We kept the former and ended up with just over 300 publications in a database. While we do not claim these 300+ publications are a full or fully representative reflection of all publications on indicators, we do believe they represent a good cross-section of original publications on indicators. When we started skim-reading these articles, several reviewers of indicators seemed to coincide in a view that distributes the debates over three categories: challenges at a technical or operational level, at a political or strategic level, and at an epistemological or conceptual level.4 Of course, these three categories overlap and the issues are not always clear-cut, but we found them helpful concepts to focus on.
4 For example, one of the first reviews of indicators after the Rio Conference in 1992 concluded: “It is clear that difficult conceptual, ethical, and operational problems still arise” (Moffatt, 1994, p. 107). A comprehensive review ten years on speaks of “practical dilemmas”, “conceptual challenges”, and the “value” of indicators (Matveeva, 2006, p. 7). And a recent international conference opened a special session on indicators with the note that, “technical issues as well as epistemological and political ones are great” (Blaise, David & David, 2013, p. 3) .
IDS Working Paper 2013/1
4
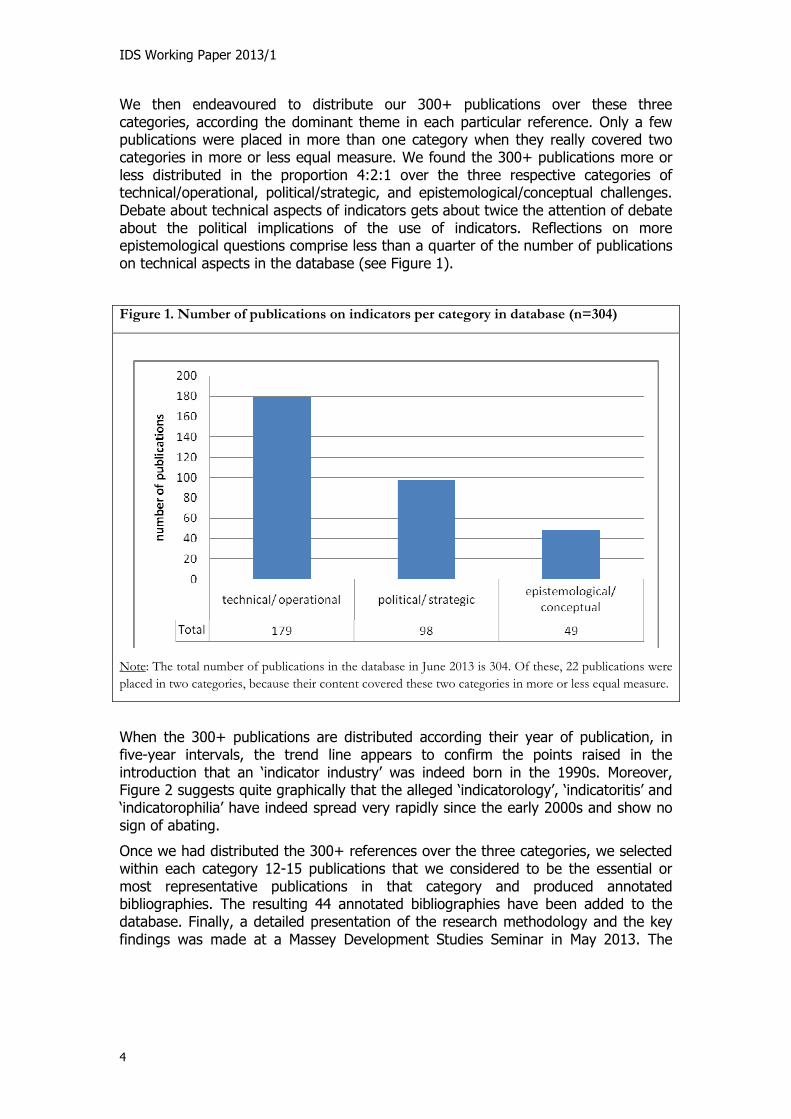
We then endeavoured to distribute our 300+ publications over these three categories, according the dominant theme in each particular reference. Only a few publications were placed in more than one category when they really covered two categories in more or less equal measure. We found the 300+ publications more or less distributed in the proportion 4:2:1 over the three respective categories of technical/operational, political/strategic, and epistemological/conceptual challenges. Debate about technical aspects of indicators gets about twice the attention of debate about the political implications of the use of indicators. Reflections on more epistemological questions comprise less than a quarter of the number of publications on technical aspects in the database (see Figure 1).
Figure 1. Number of publications on indicators per category in database (n=304)
Note: The total number of publications in the database in June 2013 is 304. Of these, 22 publications were
placed in two categories, because their content covered these two categories in more or less equal measure.
When the 300+ publications are distributed according their year of publication, in five-year intervals, the trend line appears to confirm the points raised in the introduction that an ‘indicator industry’ was indeed born in the 1990s. Moreover, Figure 2 suggests quite graphically that the alleged ‘indicatorology’, ‘indicatoritis’ and ‘indicatorophilia’ have indeed spread very rapidly since the early 2000s and show no sign of abating.
Once we had distributed the 300+ references over the three categories, we selected within each category 12-15 publications that we considered to be the essential or most representative publications in that category and produced annotated bibliographies. The resulting 44 annotated bibliographies have been added to the database. Finally, a detailed presentation of the research methodology and the key findings was made at a Massey Development Studies Seminar in May 2013. The

Measuring, defining, and valuing change
5
presentation can be viewed on the Prezi.com website.5 In the three successive sections below, we present our summary of the debate in each of the three categories.
Figure 2. Number of publications on indicators in database per 5-year interval since 1970
(n=304)
Technical or operational challenges The technical challenges, sometimes also referred to as operational or tactical challenges, mostly refer to the issues facing development practitioners in the field when they use or design indicators. We identified a number of challenges that resurfaced in many publications, of which we highlight four: reductionism, conflation of indicators with goals, complexity, and validity issues.
‘Reductionism’ is the first challenge; indicators may over-simplify a complex phenomenon and be, “an expression of a reductionist mindset” (Morse & Bell, 2011, p. 225). On the one hand, the very purpose of an indicator is precisely to reduce a complex problem into a simple number. In practice, many designers of indicators express an awareness of the risks involved with this. McKinley (1997), for example, makes a case for developing a “Cultural Index of Development”. He proposes sets of indicators to examine human development from a cultural perspective ultimately giving each country a score between one and ten. He acknowledges that reducing a country’s cultural values and opportunities to just one digit can be an over-simplification, but also argues there is a lot of data behind this number thus making it a useful tool to highlight trends and make comparisons.
5 The hyperlink is: http://prezi.com/zw-wkpjcveid/development-indicators/?kw=view-zw-
wkpjcveid&rc=ref-25909115
IDS Working Paper 2013/1
6
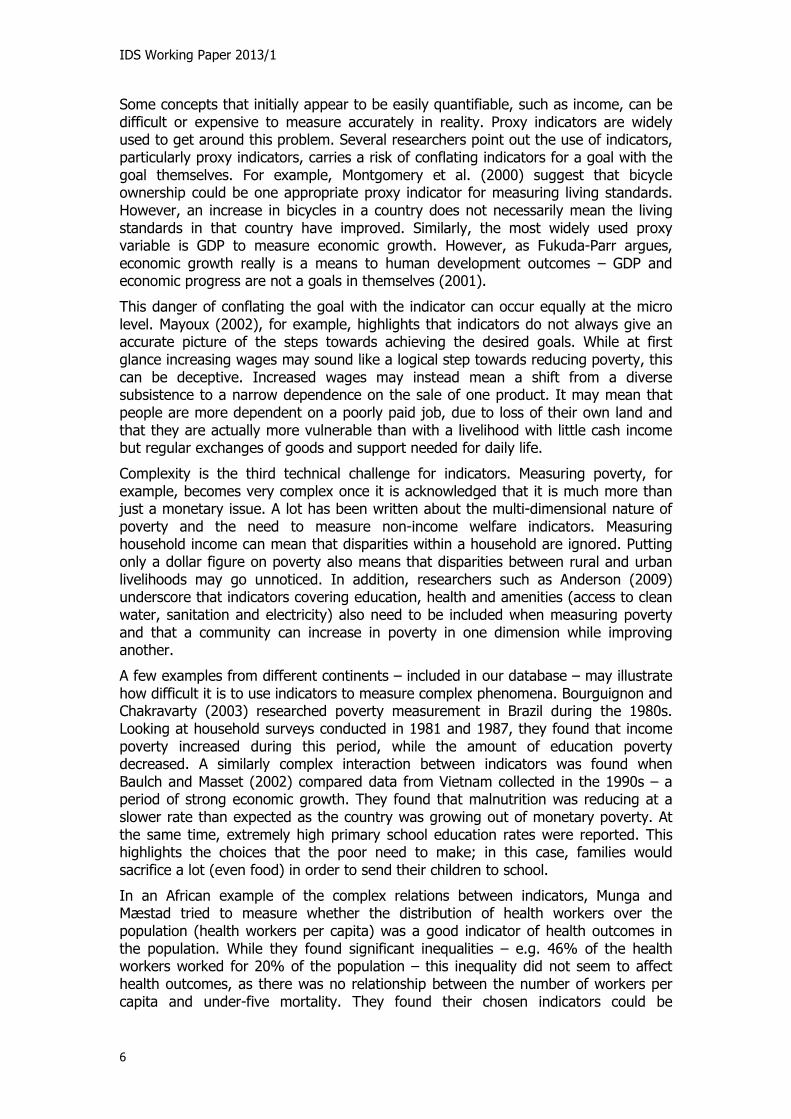
Some concepts that initially appear to be easily quantifiable, such as income, can be difficult or expensive to measure accurately in reality. Proxy indicators are widely used to get around this problem. Several researchers point out the use of indicators, particularly proxy indicators, carries a risk of conflating indicators for a goal with the goal themselves. For example, Montgomery et al. (2000) suggest that bicycle ownership could be one appropriate proxy indicator for measuring living standards. However, an increase in bicycles in a country does not necessarily mean the living standards in that country have improved. Similarly, the most widely used proxy variable is GDP to measure economic growth. However, as Fukuda-Parr argues, economic growth really is a means to human development outcomes – GDP and economic progress are not a goals in themselves (2001).
This danger of conflating the goal with the indicator can occur equally at the micro level. Mayoux (2002), for example, highlights that indicators do not always give an accurate picture of the steps towards achieving the desired goals. While at first glance increasing wages may sound like a logical step towards reducing poverty, this can be deceptive. Increased wages may instead mean a shift from a diverse subsistence to a narrow dependence on the sale of one product. It may mean that people are more dependent on a poorly paid job, due to loss of their own land and that they are actually more vulnerable than with a livelihood with little cash income but regular exchanges of goods and support needed for daily life.
Complexity is the third technical challenge for indicators. Measuring poverty, for example, becomes very complex once it is acknowledged that it is much more than just a monetary issue. A lot has been written about the multi-dimensional nature of poverty and the need to measure non-income welfare indicators. Measuring household income can mean that disparities within a household are ignored. Putting only a dollar figure on poverty also means that disparities between rural and urban livelihoods may go unnoticed. In addition, researchers such as Anderson (2009) underscore that indicators covering education, health and amenities (access to clean water, sanitation and electricity) also need to be included when measuring poverty and that a community can increase in poverty in one dimension while improving another.
A few examples from different continents – included in our database – may illustrate how difficult it is to use indicators to measure complex phenomena. Bourguignon and Chakravarty (2003) researched poverty measurement in Brazil during the 1980s. Looking at household surveys conducted in 1981 and 1987, they found that income poverty increased during this period, while the amount of education poverty decreased. A similarly complex interaction between indicators was found when Baulch and Masset (2002) compared data from Vietnam collected in the 1990s – a period of strong economic growth. They found that malnutrition was reducing at a slower rate than expected as the country was growing out of monetary poverty. At the same time, extremely high primary school education rates were reported. This highlights the choices that the poor need to make; in this case, families would sacrifice a lot (even food) in order to send their children to school.
In an African example of the complex relations between indicators, Munga and Mæstad tried to measure whether the distribution of health workers over the population (health workers per capita) was a good indicator of health outcomes in the population. While they found significant inequalities – e.g. 46% of the health workers worked for 20% of the population – this inequality did not seem to affect health outcomes, as there was no relationship between the number of workers per capita and under-five mortality. They found their chosen indicators could be
Measuring, defining, and valuing change
7
misleading and concluded that “other measures of health care needs than population levels may have to be developed in order to ensure a more meaningful measurement of distributional inequalities” (Munga & Mæstad, 2009, p. 1).
Validity issues, a fourth common issue of debate, are often associated with the complexity of the phenomena that indicators try to measure. For example, as noted above Montgomery et al (2000), looked at proxy variables such as bicycle ownership and access to clean water to measure living standards. However, when they compared these determinants with economic variables provided by a Living Standards Measurement Study carried out by the World Bank in Ghana, Jamaica, Pakistan, Peru and Tanzania, they found that the proxy variables were only weakly associated with actual consumption per adult. Connected to issue of indicator validity is the matter of the quality of the data available. Obtaining up-to-date and accurate data sources is a huge challenge. Quite often, researchers find the collected data is several years old and incomplete. Even in more industrialised countries, it has been found that poor data collection can hamper the validity of indicators. Finland’s Lyytimäki, for example, found that there is often a two-year time lag between collecting and utilising data (2012).
Political or strategic challenges Many of the examples used in the previous section illustrate that different indicators tell quite different stories, which in turn have quite different policy implications – which brings us to the category of the political challenges around indicators. We were surprised in our research to find that from indicators’ early days, there seems to have been a fairly broad agreement among researchers that the choice and definition of indicators is an inherently political decision. In the 1980s, when new public management introduced the use of indicators to the public administration, Britain’s Auditor General openly acknowledged that this cannot “be expected to ‘take the politics out of politics’” (National Audit Office, 1986, p. 8). Later, in the 1990s, after the Rio Conference, Moffatt took stock of sets of indicators to measure sustainability. He found many, each used for different purposes, and concluded: “there is no agreed set” (1994, p. 107). More recent analyses continue to arrive at the same conclusion. A case study by Russell and Thomson, for example, showed how the use of indicators for sustainability by the Scottish government turns these indicators into effective instruments of political power because they define what is, and what is not, sustainable and thereby subject to reward or punishment by the authorities (Russell & Thomson, 2009).
Whereas many publications found in our research suggest the use of indicators for political purposes at the level of government and policy-making is often more inherent or implicit, at the level of local development projects the use of indicators for political or strategic purposes seems to be a more explicit or open process. Unlike the use of indicators for policy-making by governments, indicators for projects are predominantly used to secure or maintain funding by governments or large donors. A case study of an urban development project in South Africa, for example, found the “local implementing agency … understood the political nature of the process required to develop the indicators” and in a carefully balanced fashion, it defined the indicators for its objectives in such a way that donors, local government, and local community groups recognised most of their interests and supported the project (Terry, 2008, p. 223). In the same vein, several reviewers recommend that in order to select relevant and appropriate indicators for development projects it is important to know who will use them and what they will be used for, or simply acknowledge
IDS Working Paper 2013/1
8
that indicators can be used to communicate information about the results to a wider audience (Barder, 2012; Bell & Morse, 2001; O'Dwyer & Unerman, 2007).
In all, it is clear that indicators are value-laden and have the power to enforce certain positions rather than to facilitate learning or discovery. Indicators tend to reflect what their creators deem to be important in a given time and place for a particular purpose. Arguably, indicators that do not reflect reality, or have shown to reveal very little, may sometimes remain in use if they fulfil certain political needs or demands – which could be as simple as meeting contractual obligations for certain projects or allowing politicians to defend an established policy. These political challenges around the question of whose interests are served in the selection and definition of indicators, naturally also lead to epistemological or conceptual questions: ‘How do indicators create knowledge? By what process is knowledge created, tested and used?’
Epistemological or conceptual challenges Against the backdrop of the wide agreement that choices in design and use of indicators actually reflects political choices, it is perhaps not surprising that a key question in the way in which indicators are designed and used is, ‘Are primary stakeholders involved in the creation of knowledge, and if so how?’ Several of the publications we gathered contain a moment of reflection about the role – the participation – of community members in the creation of knowledge. A review of practices by Rametsteiner et al. (2011) concludes that indicators perform an important mix of scientific-operational roles and political roles, with organisations tending to have a clear leaning to one side at the expense of the other. Two different, diverging emphases seem to have developed.
On the one side, there is an emphasis on an epistemological process that leans predominantly towards the scientific or operational aspects of the design and use of indicators. Here, scientists or policy-makers have the lead role, or are indeed the only actors in the design and use of indicators. The indicators mostly concentrate on rigorous statistical testing and peer-review. The contribution – not participation – of primary stakeholders in the design and use of indicators is mostly shaped via interviews or questionnaires (see for example: Giannarakis, Litinas & Theotokas, 2011; Hiete et al., 2012; Hoskins & Mascherini, 2009). On the other side, there are those who emphasise the participation of stakeholders in the design and use of indicators, as well as the joint learning between researchers and stakeholders. Mayoux (2002), for example, proposes using “indicator trees” with stakeholders, as a tool to create a systematic prioritisation of goals and clarification of the interrelations between goals and indicators. This indicator tree is also used with groups to ensure the indicators are relevant to local stakeholders. The database contains quite a few examples of these participatory approaches to the design and use of indicators. These approaches have been used in a wide range of environments, ranging from rural communities in Australia (Cameron & Gibson, 2005; Lennie, 2006), to urban neighbourhoods in Canada (Magee et al., 2013), and remote villages in Nepal (Khadka & Vacik, 2012).
Conclusion The use of indicators is increasing exponentially, but a review of 300+ experiences and analyses suggests that indicators should be used with consideration of pros and cons, as well as on the basis of careful choices. In designing and using indicators, we
Measuring, defining, and valuing change
9
Box 2
An on-line database on indicators
For the time being, we have stored the 300+ publications about indicators in an on-line database of Endnote 6. People can get a non-editing access to this database if they send an email to Gisela. We are currently working with Massey’s library to see if we can create a more open access to this database.
We believe this treasure trove of experiences and reflections regarding indicators would be most useful for researchers and – above all – for people working or wanting to work with indicators in (local) government bodies, NGOs, and their communities.
make choices that support certain views and interests and – by extension – ignore or undervalue other perspectives and interests. Ultimately, we believe the focus should be about so much more than using indicators to measure the impact of a development project. Indicators can also be instruments of shared learning and improved practices that may lead to better understood and more broadly discussed social changes. As one local participant succinctly stated: “It’s not about your project; it is about my country” (Carden, as cited in King, 2012, p. 60).
References Anderson, E. (2009). Growth incidence analysis for non-income welfare indicators:
evidence from Ghana and Uganda. Chronic Poverty Research Centre. Retrieved from http://www.chronicpoverty.org/publications/details/growth-incidence-analysis-for-non-income-welfare-indicators-evidence-from-ghana-and-uganda
http://www.chronicpoverty.org/uploads/publication_files/CPR2_Background_Paper_Anderson.pdf
Barder, O. (2012). Evidence-Based, Politically Savvy Ways of Doing Development Aid. Norrag News. Value for Money in International Education A New World of Results, Impacts and Outcomes, 47(April 2012), 25-30.
Baulch, B., & Masset, E. (2002). Do Monetary and Non-Monetary Indicators Tell the Same Story About Chronic Poverty? A Study of Vietnam in the 1990's. (Working Paper No. 17, 1-22.) http://www.chronicpoverty.org/uploads/publication_files/WP17_Baulch_Masset.pdf
Bell, S., & Morse, S. (2001). Breaking Through the Glass Ceiling: Who Really Cares About Sustainability Indicators?. Local Environment, 6(3), 291-309.
Blaise, S., David, C., & David, V. (2013). Sustainable Development in Oceania. Towards a New Ethic?, Koné - New Caledonia.
Bourguignon, F., & Chakravarty, S. (2003). The measurement of multidimensional poverty. The Journal of Economic Inequality, 1(1), 25-49.
IDS Working Paper 2013/1
10
Cameron, J., & Gibson, K. (2005). Participatory Action Research in a Poststructuralist Vein. Geoforum, 36(3), 315-331.
Carter, N., Klein, R., & Day, P. (2002). How Organisations Measure Success: The Use of Performance Indicators in Government. London - UK: Routledge Ltd.
Costanza, R., Hart, M., Posner, S., & Talberth, J. (2009). Beyond GDP: The need for new measures of progress. The pardee papers, 4, 46.
Dooren, W. v., Bouckaert, G., & Halligan, J. (2010). Performance Management in the Public Sector. Oxon - UK: Routledge Ltd.
Drucker, P. (1955). The Practice of Management (2006 ed.). London - UK: First Collins Ltd.
Drucker, P. (1964). Managing for Results (1999 ed.). London - UK: Butterworth-Heinemann Ltd.
Fukuda-Parr, S. (2001). Indicators of human development and human rights--overlaps, differences... and what about the human development index? Statistical Journal - United Nations Economic Commission for Europe, 18(2/3), 239-248.
Giannarakis, G., Litinas, N., & Theotokas, I. (2011). A Delphi Study to Identify Corporate Social Responsibility Indicators: The Case of Greek Telecommunication Sector. Journal of Sustainable Development, 42(2), 16-32.
Hagood, M. J., & Ducoff, L. J. (1944). What Level of Living Indexes Measure. American Sociological Review, 9(1), 78-84.
Hicks, N., & Streeten, P. (1979). Indicators of Development: The Search for a Basic Needs Yardstick. World Development, 7(6), 567-580.
Hiete, M., Merz, M., Comes, T., & Schultmann, F. (2012). Trapezoidal Fuzzy DEMATEL Method to Analyze and Correct for Relations Between Variables in a Composite Indicator for Disaster Resilience. OR spectrum, 34(4), 971-995.
Hood, C. (1991). A Public Management for All Seasons? Public administration, 69(1), 3-19.
Hoskins, B. L., & Mascherini, M. (2009). Measuring Active Citizenship Through the Development of a Composite Indicator. Social Indicators Research, 90(3), 459-488.
Hulme, D. (2010). Lessons from the Making of the MDGs: Human Development Meets Results-based Management in an Unfair World. IDS Bulletin, 41(1), 15-25.
Khadka, C., & Vacik, H. (2012). Comparing a Top-down and Bottom-up Approach in the Identification of Criteria and Indicators for Sstainable Community Forest Management in Nepal. Forestry, 85(1), 145-158.
King, K. (Ed.). (2012). Value for money in international education: A new world of results, impacts and outcomes (Vol. Norrag News 47): NORRAG - Network for Policy Research, Review and Advice on Education and Training.
Larson, D. A., & Wilford, W. T. (1979). The Physical Quality of Life Index: A Useful Social Indicator? World Development,, 7(6), 581-584.
Measuring, defining, and valuing change
11
Lennie, J. (2006). Increasing the Rigour and Trustworthiness of Participatory Evaluations: Learnings from the Field. Evaluation Journal of Australasia, 6(1), 27-35.
Lyytimäki, J. (2012). Evaluation of sustainable development strategies and policies: The need for more timely indicators. Paper presented at the UN Natural Resources Forum.
Magee, L., Scerri, A., James, P., Thom, J. A., Padgham, L., Hickmott, S., . . . & Cahill, F. (2013). Reframing Social Sustainability Reporting: Towards an Engaged Approach. Environment, Development and Sustainability, 15(1), 225-243.
Marcuss, R. D., & Kane, R. E. (2007). US National Income and Product Statistics. Survey of Current Business, 87, 2-32.
Matveeva, A. (2006). Early Warning and Early Response: Conceptual and Empirical Dilemmas. The Hague - The Netherlands: European Centre for Conflict Prevention.
Mayoux, L. (2002). What do we want to know? Selecting indicators. Enterprise Impact News, Issue 5(Jan/Feb 2002).
McKinley, T. (1997). Cultural indicators of development. Geneva. Retrieved from http://www.unrisd.org/80256B3C005BCCF9/httpNetITFramePDF?ReadForm&parentunid=453FE0139F688D4780256B67005B6D78&parentdoctype=paper&netitpath=80256B3C005BCCF9/%28httpAuxPages%29/453FE0139F688D4780256B67005B6D78/$file/OPCD4.pdf
Moffatt, I. (1994). On Measuring Sustainable Development Indicators. The International Journal of Sustainable Development & World Ecology, 1(2), 97-109.
Montgomery, M., Gragnolati, M., Burke, K., & Paredes, E. (2000). Measuring living standards with proxy variables. Demography, 37(2), 155-174. doi: 10.2307/2648118
Morse, S., & Bell, S. (2011). Sustainable Development Indicators: The Tyranny of Methodology Revisited. Consilience: The Journal of Sustainable Development, 6(1), 222-239.
Munga, M., & Mæstad, O. (2009). Measuring Inequalities in the Distribution of Health Workers: The case of Tanzania. Human Resources for Health, 7(1), 1-12.
National Audit Office. (1986). The Financial Management Initiative. Report by the Comptroller and Auditor General. London - UK: NAO.
Nordhaus, W., & Tobin, J. (1972). Is Growth Obsolete? In W. Nordhaus & J. Tobin (Eds.), Economic Research: Retrospect and Prospect. (Vol. 5: Economic Growth). New York - USA: Colombia University Press/National Bureau of Economic Research.
O'Dwyer, B., & Unerman, J. (2007). From Functional to Social Accountability: Transforming the Accountability Relationship between Funders and Non-Gvernmental Delopment Oganisations. Accounting, Auditing & Accountability Journal, 20(3), 446-471.
OECD. (2008). Handbook on Constructing Composite Indicators: Methodology and User Guide. Paris - France: OECD.
IDS Working Paper 2013/1
12
Paruolo, P., Saisana, M., & Saltelli, A. (2012). Ratings and Rankings: Voodoo or Science? Journal of the Royal Statistical Society: Series A (Statistics in Society), 1-26.
Pratt, B. (2012). Obsessive Compulsive Measurement Disorder. INTRAC Blogs. Retrieved 2 June, 2013, from http://www.intrac.org/blog.php/22/obsessive-compulsive-measurement-disorder
Prinsen, G. (2013). Measuring the Impact of a Kiss on Love: Designing Indicators for Multi-Dimensional Concepts such as Sovereignty, Resilience, Sustainability, or Fragility. Paper presented at the Conference "Sustainable Development in Oceania – Towards a New Ethic?" (24-26 April 2013) - New Caledonia, Koné - New Caledonia.
Rametsteiner, E., Pülzl, H., Alkan-Olsson, J., & Frederiksen, P. (2011). Sustainability Indicator Development-Science or Political Negotiation? Ecological Indicators, 11(1), 61-70.
Russell, S. L., & Thomson, I. (2009). Analysing the Role of Sustainable Development Indicators in Accounting for and Constructing a Sustainable Scotland. Accounting Forum, 33(3), 225-244.
Stiglitz, J. E., Sen, A., & Fitoussi, J.-P. (2009). Report by Commission on the Measurement of Economic Performance and Social Progress.
Terry, A. (2008). Community Sustainable-Development Indicators: A Useful Participatory Technique or Another Dead End? Development in Practice, 18(2), 223-234.