Embed Size (px)
DESCRIPTION
Massachusetts Water Resources Authority. Proposed Revisions to MWRA’s Ambient Monitoring Plan: Effluent and Water Column Andrea Rex, MWRA to Outfall Monitoring Science Advisory Panel June 29, 2009. Effluent: end floatables sampling. - PowerPoint PPT Presentation
Citation preview
1
Massachusetts Water Resources Authority
Proposed Revisions to MWRA’s Ambient Monitoring Plan: Effluent and Water Column
Andrea Rex, MWRAto
Outfall Monitoring Science Advisory PanelJune 29, 2009
2
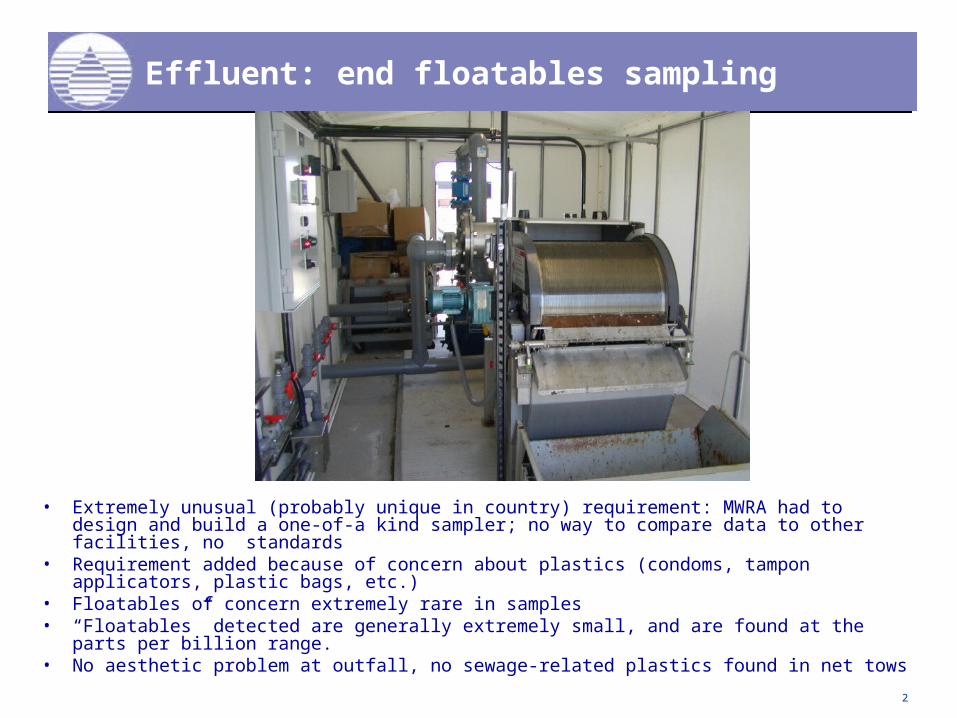
Effluent: end floatables sampling
• Extremely unusual (probably unique in country) requirement: MWRA had to design and build a one-of-a kind sampler; no way to compare data to other facilities, no standards
• Requirement added because of concern about plastics (condoms, tampon applicators, plastic bags, etc.)
• Floatables of concern extremely rare in samples • “Floatables” detected are generally extremely small, and are found at the parts per
billion range. • No aesthetic problem at outfall, no sewage-related plastics found in net tows
3
Effluent: change toxic contaminant sampling frequency from weekly to 4/month
• Overlapping studies sometimes result in several samples taken in a week, and 6 or more per month
• Eliminates redundant sampling

4
Water Column: Original discharge monitoring design: farfield
• 26 farfield stations, 8-70 km from outfall.
• Sampled during 6 surveys/year, Feb-Oct.
• Unchanged by 2004 revisions

5
Original discharge monitoring design: nearfield
• 21 nearfield stations, 1-7 km from the outfall
• Sampled during 17 surveys/year, Feb-Dec.
• Most stations had only dissolved inorganic nutrient (DIN) analyses and hydrographic data collected
• 26 farfield stations, 8-70 km from outfall.
• Sampled during 6 surveys/year, Feb-Oct.
• Revisions approved in 2004 affected ONLY nearfield stations and surveys.
6
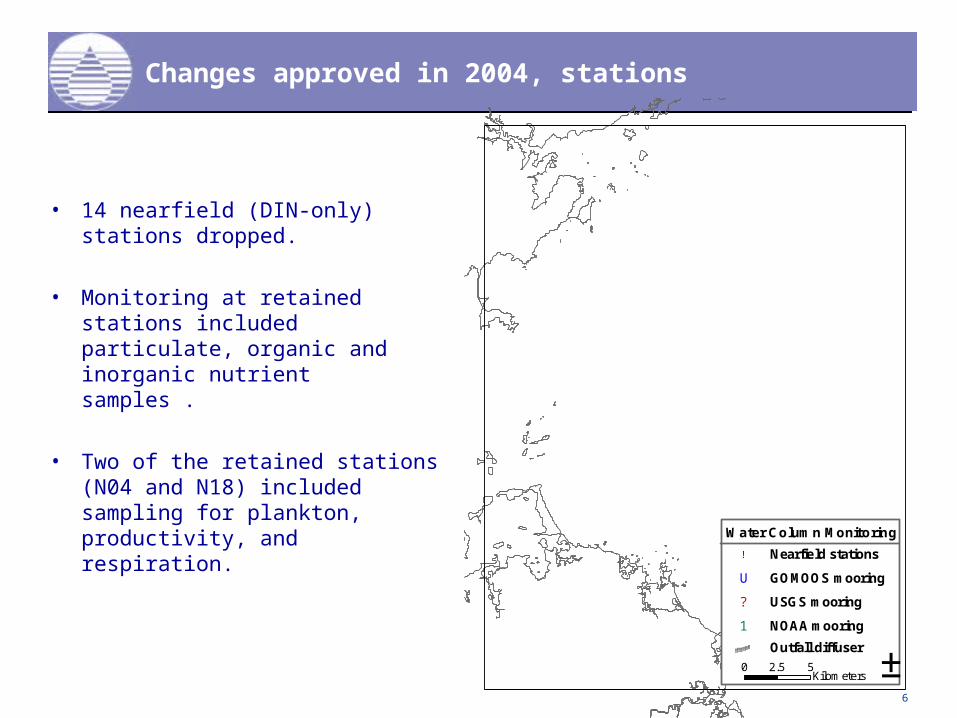
Changes approved in 2004, stations
• 14 nearfield (DIN-only) stations dropped.
• Monitoring at retained stations included particulate, organic and inorganic nutrient samples .
• Two of the retained stations (N04 and N18) included sampling for plankton, productivity, and respiration.
!
!
!
!
!
!
! ?
!!!!!!!!!!!!!!!!!!!!!!!!!!!!!!!!!!!!!!!!!!!!!!!!!!!!!!!
U
1
N20
N18
N16
N10
N07
N04
N01
!!!!!!!!!!!!!!!!!!!!!!!!!!!!!!!!!!!!!!!!!!!!!!!!!!!!!!!
! Nearfield stations
U GOMOOS mooring
? USGS mooring
1 NOAA mooring
Outfall diffuser0 2.5 5
Kilometers ±
Water Column Monitoring
7
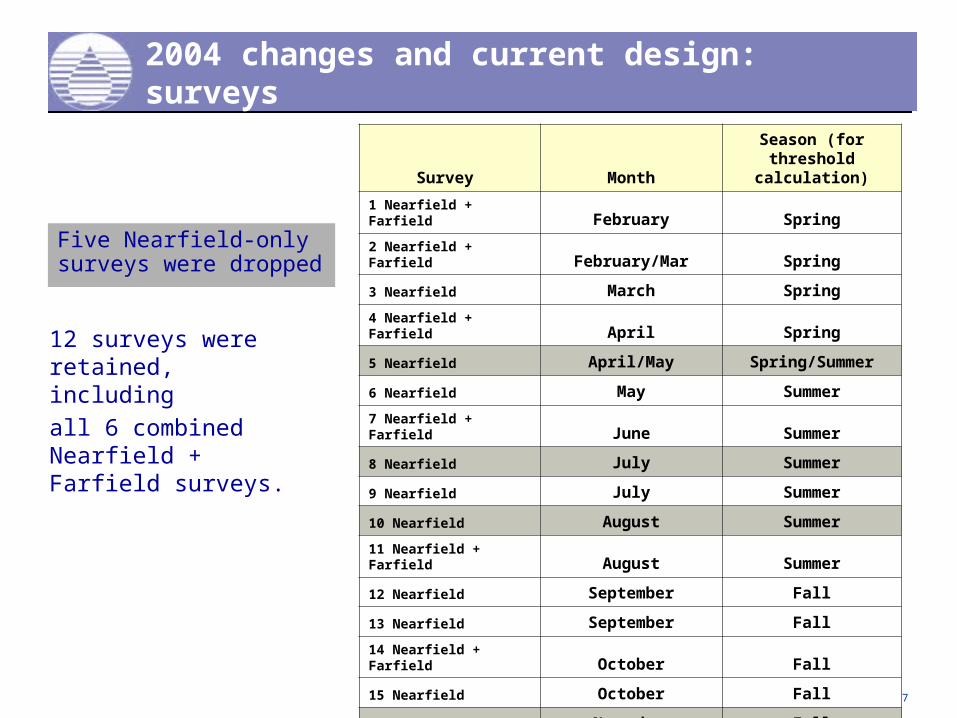
2004 changes and current design: surveys
Five Nearfield-only surveys were dropped
Survey Month
Season (for threshold
calculation)
1 Nearfield + Farfield February Spring
2 Nearfield + Farfield February/Mar Spring
3 Nearfield March Spring
4 Nearfield + Farfield April Spring
5 Nearfield April/May Spring/Summer
6 Nearfield May Summer
7 Nearfield + Farfield June Summer
8 Nearfield July Summer
9 Nearfield July Summer
10 Nearfield August Summer
11 Nearfield + Farfield August Summer
12 Nearfield September Fall
13 Nearfield September Fall
14 Nearfield + Farfield October Fall
15 Nearfield October Fall
16 Nearfield November Fall
17 Nearfield December Fall
12 surveys were retained, including
all 6 combined Nearfield + Farfield surveys.
8
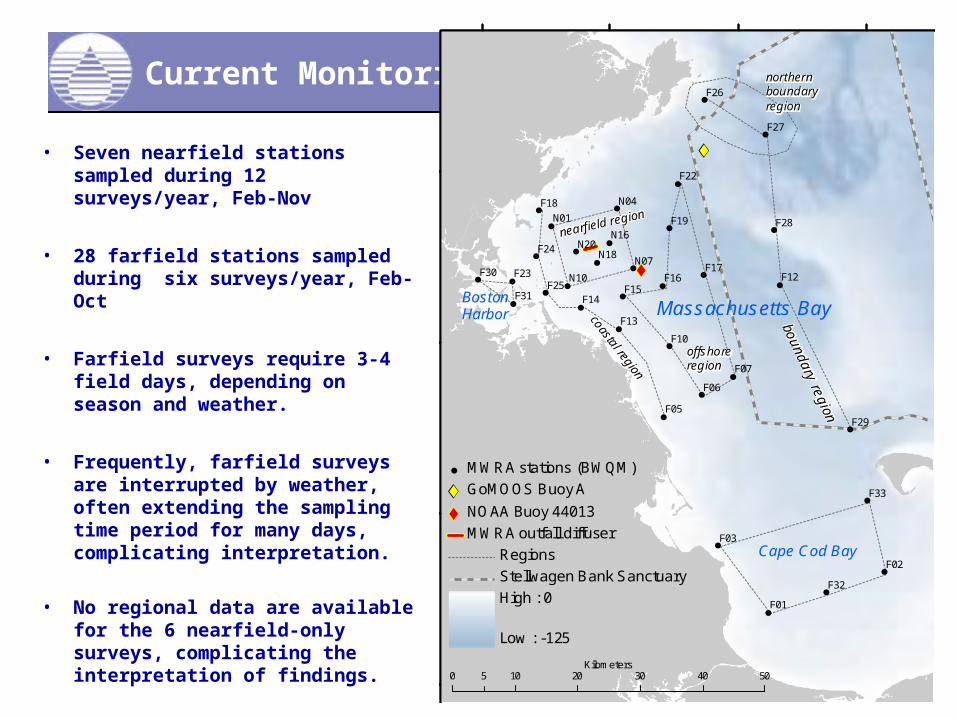
Current Monitoring
• Seven nearfield stations sampled during 12 surveys/year, Feb-Nov
• 28 farfield stations sampled during six surveys/year, Feb-Oct
• Farfield surveys require 3-4 field days, depending on season and weather.
• Frequently, farfield surveys are interrupted by weather, often extending the sampling time period for many days, complicating interpretation.
• No regional data are available for the 6 nearfield-only surveys, complicating the interpretation of findings.
F33
F32
F19
F18
F17F16
F15F14
F12
F10
F07
F05
N20
N10
N07
N01
F29
F28
F03
F23
F22
F13
F06
N18
N16
N04
F31
F30
F27
F26
F25
F24
F02
F01
70°15'W
70°15'W
70°30'W
70°30'W
70°45'W
70°45'W
71°0'W
71°0'W
42°3
0'N
42°3
0'N
42°1
5'N
42°1
5'N
42°0
'N
42°0
'N
41°4
5'N
41°4
5'N
F33
F32
F19
F18
F17F16
F15F14
F12
F10
F07
F05
N20
N10
N07
N01
F29
F28
F03
F23
F22
F13
F06
N18
N16
N04
F31
F30
F27
F26
F25
F24
F02
F01
70°15'W
70°15'W
70°30'W
70°30'W
70°45'W
70°45'W
71°0'W
71°0'W
42°3
0'N
42°3
0'N
42°1
5'N
42°1
5'N
42°0
'N
42°0
'N
41°4
5'N
41°4
5'N
Cape Cod Bay
BostonHarbor Massachusetts Bay
0 10 20 30 40 505Kilometers
northern boundary region
offshore region
MWRA stations (BWQM)
GoMOOS Buoy A
NOAA Buoy 44013
MWRA outfall diffuser
Regions
Stellwagen Bank Sanctuary
High : 0
Low : -125

9
Current monitoring design is very complex
• Carrying out all analyses at all 35 stations would be prohibitively expensive.
• Currently eight different unique combinations of sampling depths and analytes, complicates data interpretation.
• Plankton at about half the stations.
Station Type Code Sample depths per analysis per station
ANALYSIS BBR E H M
MRP Z
Dissolved Inorganic Nutrients 5 5 5 3 5 5
Organic and Particulate
Nutrients 3 3 3 3 3
Chlorophyll a and phaeophytin 5 5 5 3 5 5
Total suspended solids 3 3 3 3 3
Zooplankton 1 1 1 1
Phytoplankton 2 2 2
Respiration 3 3
Primary Production 5
Stations per station type
Station Type Code
BBR E H M
MRP Z
Nearfield 5 2
Farfield 112 2
10 1 2
F33
F32
F23
F22
F13
F06
N18
N16
N04
F31
F30
F27
F26
F25
F24
F02
F01
70°15'W
70°15'W
70°30'W
70°30'W
70°45'W
70°45'W
71°0'W
71°0'W42
°30'
N
42°3
0'N
42°1
5'N
42°1
5'N
42°0
'N
42°0
'N
41°4
5'N
41°4
5'N
F33
F32
F23
F22
F13
F06
N18
N16
N04
F31
F30
F27
F26
F25
F24
F02
F01
70°15'W
70°15'W
70°30'W
70°30'W
70°45'W
70°45'W
71°0'W
71°0'W42
°30'
N
42°3
0'N
42°1
5'N
42°1
5'N
42°0
'N
42°0
'N
41°4
5'N
41°4
5'N
Cape Cod Bay
BostonHarbor Massachusetts Bay
0 10 20 30 40 505Kilometers
northern boundary region
offshore region
coastal region
nearfield region
Phytoplankton and zooplankton station
Zooplankton-only station
GoMOOS Buoy A
NOAA Buoy 44013
MWRA outfall diffuser
Regions
High : 0
Low : -125

10
Changes proposed: Stations
• Focus on area plausibly affected by discharge, plus reference stations
• Nearfield sampling at 4 of current 7 stations, including two of three current plankton stations.
• End monitoring in reference areas unaffected by discharge
– Cape Cod Bay– Boundary stations (including
Stellwagen)
• Sentinel reference stations in Offshore and Coastal regions.
• All parameters measured at all stations.
• Enable “synoptic” sampling to improve data interpretation.
F33
F32
F19
F18
F17F16
F15F14
F12
F10
F07
F05
N20
N10
N07
N01
F29
F28
F03
F23
F22
F13
F06
N18
N16
N04
F31
F30
F27
F26
F25
F24
F02
F01
70°15'W
70°15'W
70°30'W
70°30'W
70°45'W
70°45'W
71°0'W
71°0'W
42°3
0'N
42°3
0'N
42°1
5'N
42°1
5'N
42°0
'N
42°0
'N
41°4
5'N
41°4
5'N
F33
F32
F19
F18
F17F16
F15F14
F12
F10
F07
F05
N20
N10
N07
N01
F29
F28
F03
F23
F22
F13
F06
N18
N16
N04
F31
F30
F27
F26
F25
F24
F02
F01
70°15'W
70°15'W
70°30'W
70°30'W
70°45'W
70°45'W
71°0'W
71°0'W
42°3
0'N
42°3
0'N
42°1
5'N
42°1
5'N
42°0
'N
42°0
'N
41°4
5'N
41°4
5'N
Cape Cod Bay
BostonHarbor Massachusetts Bay
0 10 20 30 40 505Kilometers
northern boundary region
offshore region
MWRA stations (BWQM)
GoMOOS Buoy A
NOAA Buoy 44013
MWRA outfall diffuser
Regions
Stellwagen Bank Sanctuary
High : 0
Low : -125
Proposed stations

11
Changes proposed: Stations retained
STATION ID
WATER DEPTH
(M)
LOCATION RELATIVE TO
OUTFALLPURPOSE
F06 33 29 km S Southern reference station
F10 33 20 km SFurthest expected southern expression of effluent plume
F13 25 14 km S Near coastal (model, Alexandrium)
F15 38 9 km S Evaluate extent of plume southeast
F22 80 17 km NE
Northern reference stationGulf of Maine influenceRegional physical forcing relates to nearfield DOLink between buoy and sampling data“Upstream” sentinel station in winter-spring
F23 25 12 km E Boston Harbor
N01 31 6.3 km NW Evaluate extent of plume northwest
N04 50 7.1 km NE Evaluate extent of plume northeast
N07 50 7.1 km SENear NOAA buoy MWRA instruments-data comparison
N18 27 2.5 km S
Closest station to outfallHighest ammoniumPrimary “impact” station for comparison to other stations
P
!
!
!
!
!
!
!
!
!!
GOMOOS-A
BUOY-44013
N18 N07
N04
N01
F23
F22
F15
F13
F10
F06
70°15'W
70°15'W
70°30'W
70°30'W
70°45'W
70°45'W
71°0'W
71°0'W
42°3
0'N
42°3
0'N
42°1
5'N
42°1
5'N
42°0
'N
42°0
'N
41°4
5'N
41°4
5'N
! Water Column Station
P GOMOOS-A Mooring Station
NWS Buoy
) MWRA Outfall Diffusers
Stellwagen Bank National Marine Sanctuary
Water Depth(meters) > 70 40 - 70 < 40
Cape Cod Bay
Water Column Monitoring
0 10 20 Kilometers
±
12
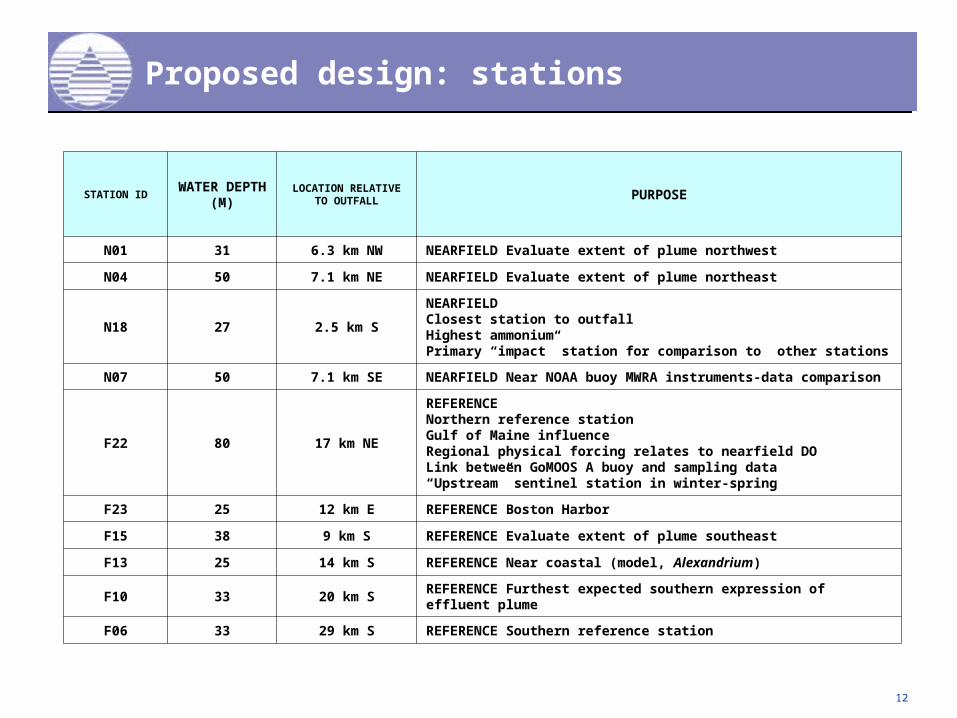
Proposed design: stations
STATION ID
WATER DEPTH
(M)
LOCATION RELATIVE TO OUTFALL PURPOSE
N01 31 6.3 km NW NEARFIELD Evaluate extent of plume northwest
N04 50 7.1 km NE NEARFIELD Evaluate extent of plume northeast
N18 27 2.5 km S
NEARFIELDClosest station to outfallHighest ammoniumPrimary “impact” station for comparison to other stations
N07 50 7.1 km SE NEARFIELD Near NOAA buoy MWRA instruments-data comparison
F22 80 17 km NE
REFERENCENorthern reference stationGulf of Maine influenceRegional physical forcing relates to nearfield DOLink between GoMOOS A buoy and sampling data“Upstream” sentinel station in winter-spring
F23 25 12 km E REFERENCE Boston Harbor
F15 38 9 km S REFERENCE Evaluate extent of plume southeast
F13 25 14 km S REFERENCE Near coastal (model, Alexandrium)
F10 33 20 km S REFERENCE Furthest expected southern expression of effluent plume
F06 33 29 km S REFERENCE Southern reference station
13
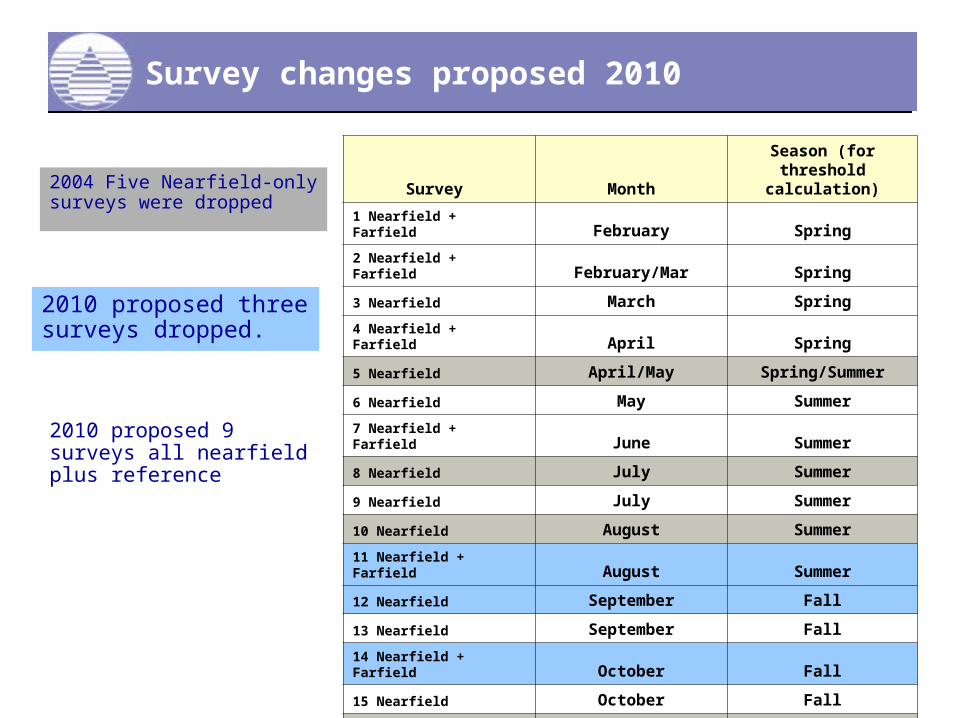
Survey changes proposed 2010
Survey MonthSeason (for threshold
calculation)
1 Nearfield + Farfield February Spring
2 Nearfield + Farfield February/Mar Spring
3 Nearfield March Spring
4 Nearfield + Farfield April Spring
5 Nearfield April/May Spring/Summer
6 Nearfield May Summer
7 Nearfield + Farfield June Summer
8 Nearfield July Summer
9 Nearfield July Summer
10 Nearfield August Summer
11 Nearfield + Farfield August Summer
12 Nearfield September Fall
13 Nearfield September Fall
14 Nearfield + Farfield October Fall
15 Nearfield October Fall
16 Nearfield November Fall
17 Nearfield December Fall
2004 Five Nearfield-only surveys were dropped
2010 proposed three surveys dropped.
2010 proposed 9 surveys all nearfield plus reference
14
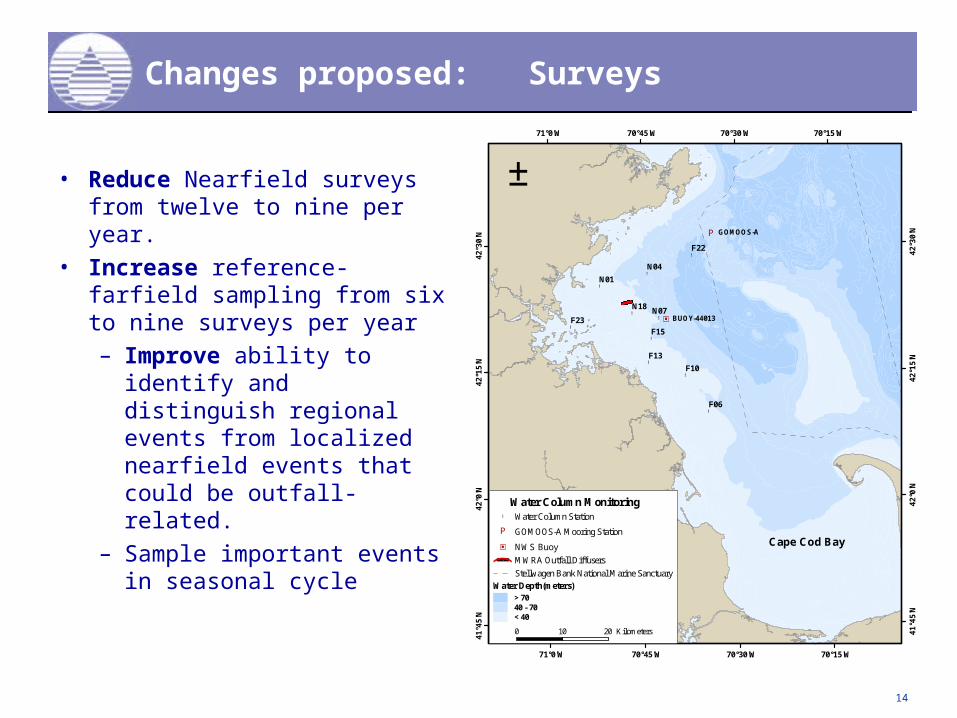
Changes proposed: Surveys
• Reduce Nearfield surveys from twelve to nine per year.
• Increase reference-farfield sampling from six to nine surveys per year– Improve ability to identify
and distinguish regional events from localized nearfield events that could be outfall-related.
– Sample important events in seasonal cycle
P
!
!
!
!
!
!
!
!
!!
GOMOOS-A
BUOY-44013
N18 N07
N04
N01
F23
F22
F15
F13
F10
F06
70°15'W
70°15'W
70°30'W
70°30'W
70°45'W
70°45'W
71°0'W
71°0'W
42°3
0'N
42°3
0'N
42°1
5'N
42°1
5'N
42°0
'N
42°0
'N
41°4
5'N
41°4
5'N
! Water Column Station
P GOMOOS-A Mooring Station
NWS Buoy
) MWRA Outfall Diffusers
Stellwagen Bank National Marine Sanctuary
Water Depth(meters) > 70 40 - 70 < 40
Cape Cod Bay
Water Column Monitoring
0 10 20 Kilometers
±

15
Changes Proposed: Surveys
WHEN PURPOSE
Early February Nutrient conditions near start of spring bloom
March Spring bloom
Early April Capture Phaeocystis bloom. Late winter/spring bloom nutrients
Mid-May Nutrient/water column conditions at end of winter-spring, Alexandrium
Mid-June Early summer stratification and nutrients. Mid-late red tide season.
Mid-July Mid-summer stratification and nutrients
Mid-August Mid-summer stratification and nutrients
Late September Nutrients, etc. prior to overturn.
Late October Mid-fall bloom nutrients, DO minima, etc.

16
Changes Proposed: Measurements
• Drop direct measurements of water column primary production
• Drop floatables tows in nearfield• Drop measurements of little-used parameters
– Dissolved Organic Carbon– Particulate Biogenic Silica– Total Suspended Solids– Respiration
• Add gene probe analyses for Alexandrium fundyense during bloom season
• Retain all other measurements
17
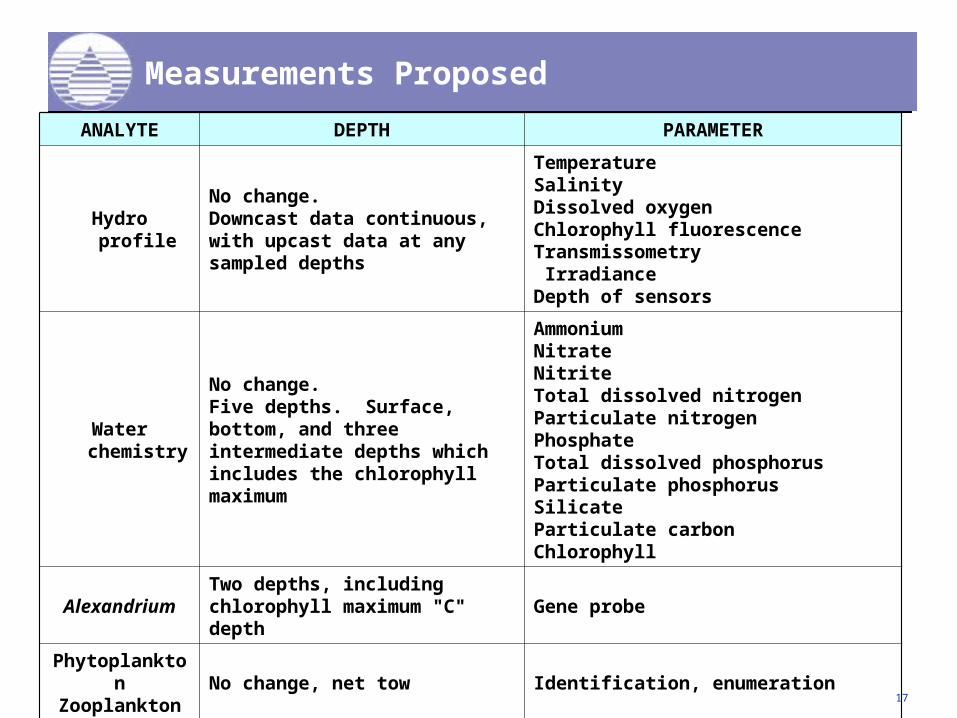
Measurements Proposed
ANALYTE DEPTH PARAMETER
Hydro profile
No change. Downcast data continuous, with upcast data at any sampled depths
Temperature SalinityDissolved oxygen Chlorophyll fluorescence Transmissometry IrradianceDepth of sensors
Water chemistry
No change. Five depths. Surface, bottom, and three intermediate depths which includes the chlorophyll maximum
AmmoniumNitrateNitriteTotal dissolved nitrogenParticulate nitrogenPhosphateTotal dissolved phosphorusParticulate phosphorusSilicateParticulate carbonChlorophyll
AlexandriumTwo depths, including chlorophyll maximum "C" depth
Gene probe
Phytoplankton Zooplankton
No change, net tow Identification, enumeration

18
Rationale for nearfield station selection: Bottom water dissolved oxygen nearfield averageR2 = 0.99
Nearfield Bottom DO, 1992-2008
y = 0.9778x + 0.2057
R2 = 0.9915
6
7
8
9
10
11
12
13
6 7 8 9 10 11 12 13
Current 7 stations
Pro
po
sed
4 s
tati
on
s
Dissolved Oxygen
Linear (Dissolved Oxygen)
2003 monitoring revision analyses showed strong spatial redundancy in nearfield, analyses show that the proposed 4 stations are very highly correlated to the existing 7 stations
19
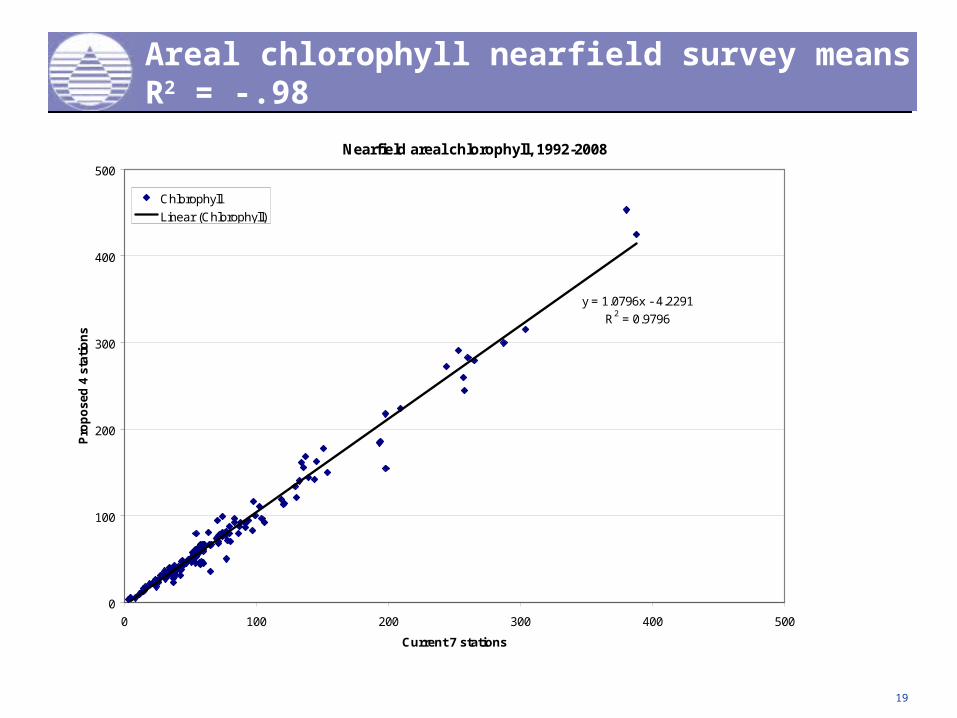
Areal chlorophyll nearfield survey means R2 = -.98
Nearfield areal chlorophyll, 1992-2008
y = 1.0796x - 4.2291
R2 = 0.9796
0
100
200
300
400
500
0 100 200 300 400 500
Current 7 stations
Pro
po
sed
4 s
tati
on
s
Chlorophyll
Linear (Chlorophyll)
20
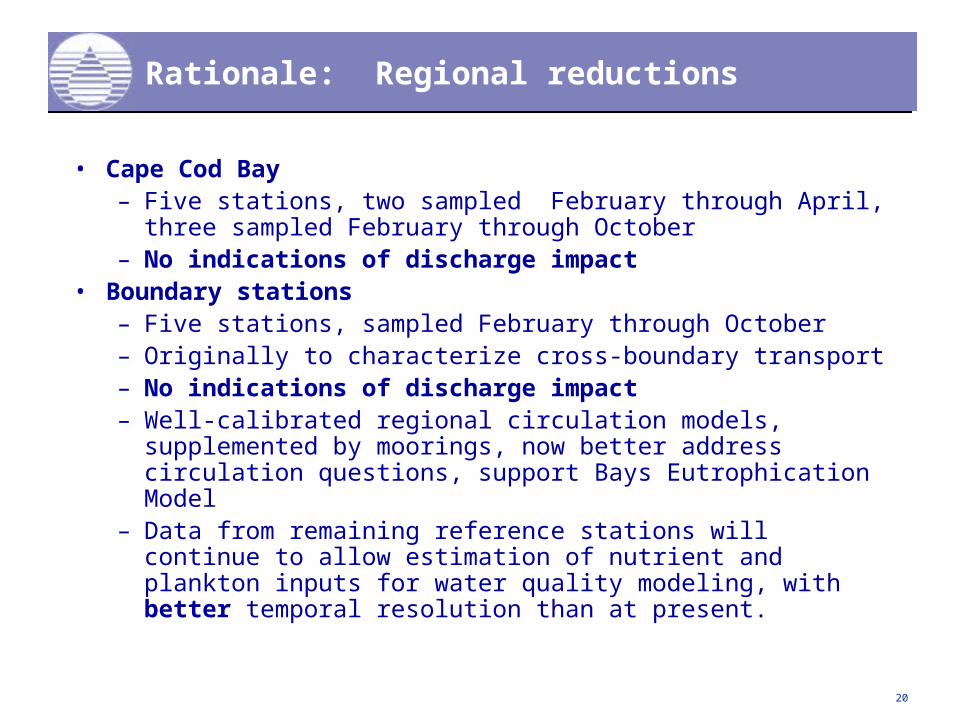
Rationale: Regional reductions
• Cape Cod Bay – Five stations, two sampled February through April, three
sampled February through October– No indications of discharge impact
• Boundary stations– Five stations, sampled February through October– Originally to characterize cross-boundary transport– No indications of discharge impact– Well-calibrated regional circulation models, supplemented by
moorings, now better address circulation questions, support Bays Eutrophication Model
– Data from remaining reference stations will continue to allow estimation of nutrient and plankton inputs for water quality modeling, with better temporal resolution than at present.
21
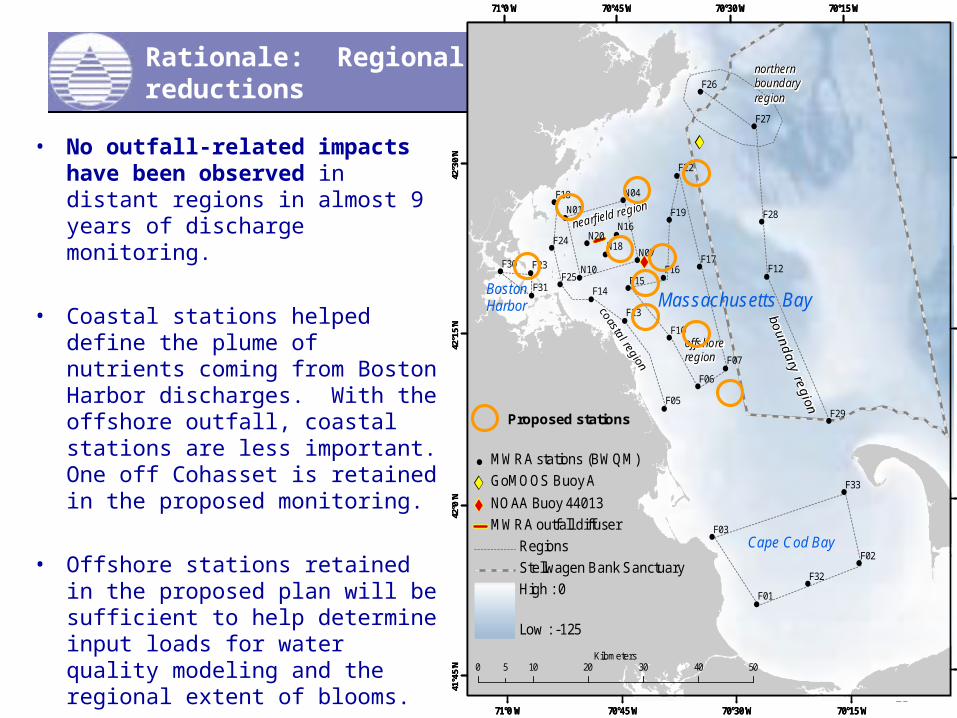
Rationale: Regional reductions
• No outfall-related impacts have been observed in distant regions in almost 9 years of discharge monitoring.
• Coastal stations helped define the plume of nutrients coming from Boston Harbor discharges. With the offshore outfall, coastal stations are less important. One off Cohasset is retained in the proposed monitoring.
• Offshore stations retained in the proposed plan will be sufficient to help determine input loads for water quality modeling and the regional extent of blooms.
F33
F32
F19
F18
F17F16
F15F14
F12
F10
F07
F05
N20
N10
N07
N01
F29
F28
F03
F23
F22
F13
F06
N18
N16
N04
F31
F30
F27
F26
F25
F24
F02
F01
70°15'W
70°15'W
70°30'W
70°30'W
70°45'W
70°45'W
71°0'W
71°0'W
42°3
0'N
42°3
0'N
42°1
5'N
42°1
5'N
42°0
'N
42°0
'N
41°4
5'N
41°4
5'N
F33
F32
F19
F18
F17F16
F15F14
F12
F10
F07
F05
N20
N10
N07
N01
F29
F28
F03
F23
F22
F13
F06
N18
N16
N04
F31
F30
F27
F26
F25
F24
F02
F01
70°15'W
70°15'W
70°30'W
70°30'W
70°45'W
70°45'W
71°0'W
71°0'W
42°3
0'N
42°3
0'N
42°1
5'N
42°1
5'N
42°0
'N
42°0
'N
41°4
5'N
41°4
5'N
Cape Cod Bay
BostonHarbor Massachusetts Bay
0 10 20 30 40 505Kilometers
northern boundary region
offshore region
MWRA stations (BWQM)
GoMOOS Buoy A
NOAA Buoy 44013
MWRA outfall diffuser
Regions
Stellwagen Bank Sanctuary
High : 0
Low : -125
Proposed stations
22
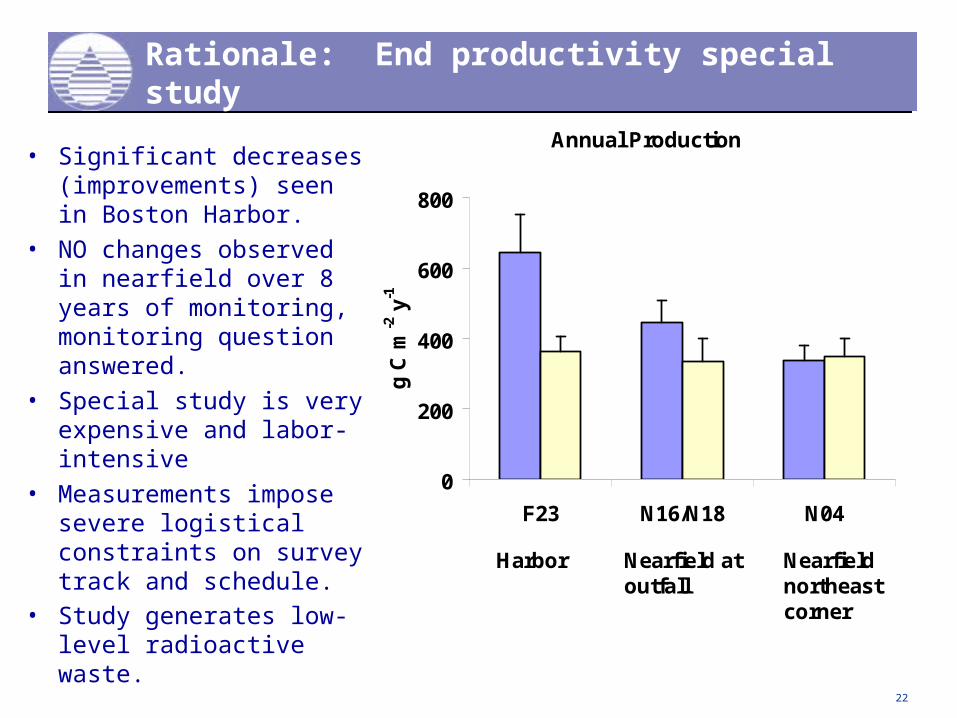
Rationale: End productivity special study
• Significant decreases (improvements) seen in Boston Harbor.
• NO changes observed in nearfield over 8 years of monitoring, monitoring question answered.
• Special study is very expensive and labor-intensive
• Measurements impose severe logistical constraints on survey track and schedule.
• Study generates low-level radioactive waste.
Annual Production
0
200
400
600
800
F23 N16/N18 N04
g C
m-2
y-1
Harbor Nearfield at outfall
Nearfield northeast corner
23
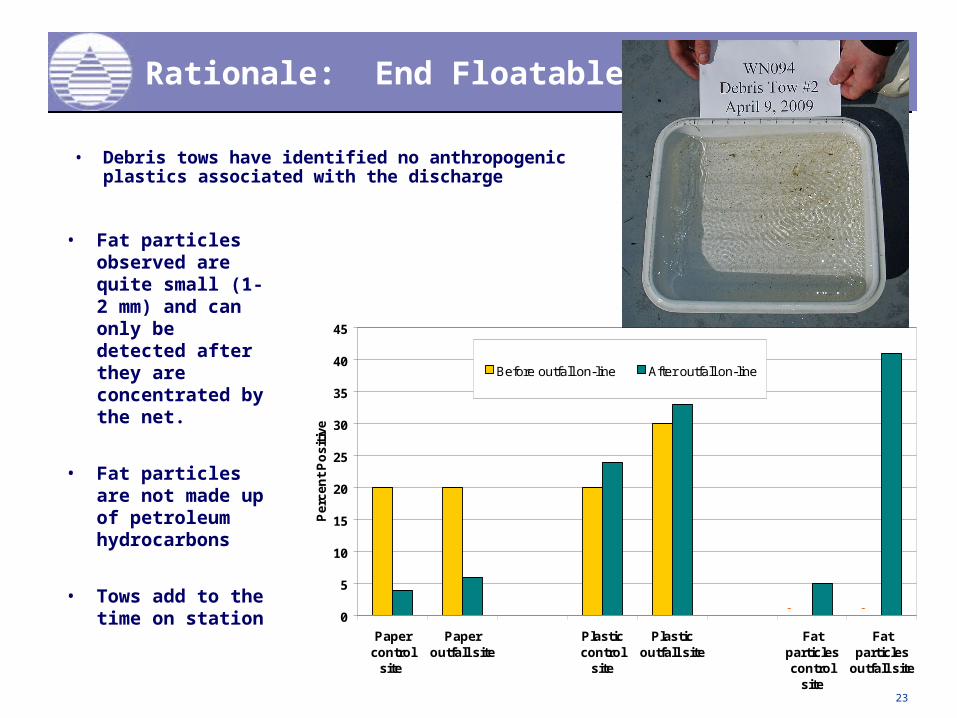
Rationale: End Floatables tows
• Fat particles observed are quite small (1-2 mm) and can only be detected after they are concentrated by the net.
• Fat particles are not made up of petroleum hydrocarbons
• Tows add to the time on station
0
5
10
15
20
25
30
35
40
45
Papercontrol
site
Paperoutfall site
Plasticcontrol
site
Plasticoutfall site
Fatparticlescontrol
site
Fatparticles
outfall site
Pe
rce
nt
Po
siti
ve
Before outfall on-line After outfall on-line
00
• Debris tows have identified no anthropogenic plastics associated with the discharge

24
Rationale, end other measurements
• Total Solids– Much baseline data biased high by salt retention on filters– Not used in data evaluation
• Biogenic Silica and Dissolved Organic Carbon data rarely used
25
Rationale: Survey schedule
Nine remaining surveys chosen to provide sentinel seasonal information:
•Important events observed in results to date would be captured:
– Red tide blooms– Phaeocystis blooms– July 2006 Dactyliosolen fragilissimus bloom
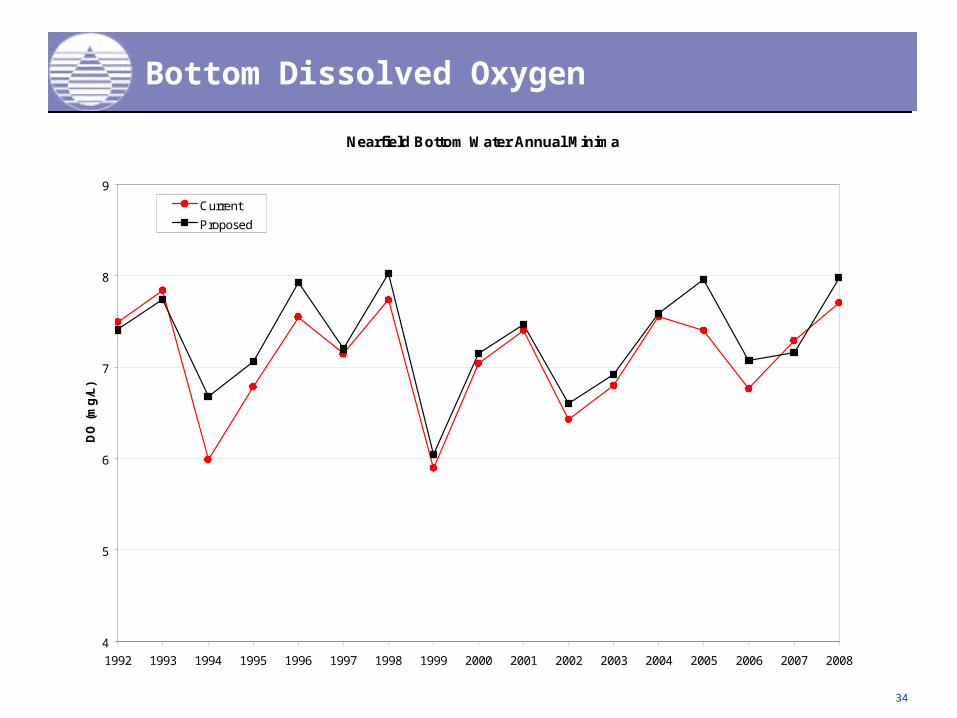
•Seasonal and annual averages used in threshold testing are very similar under both the existing and proposed monitoring

26
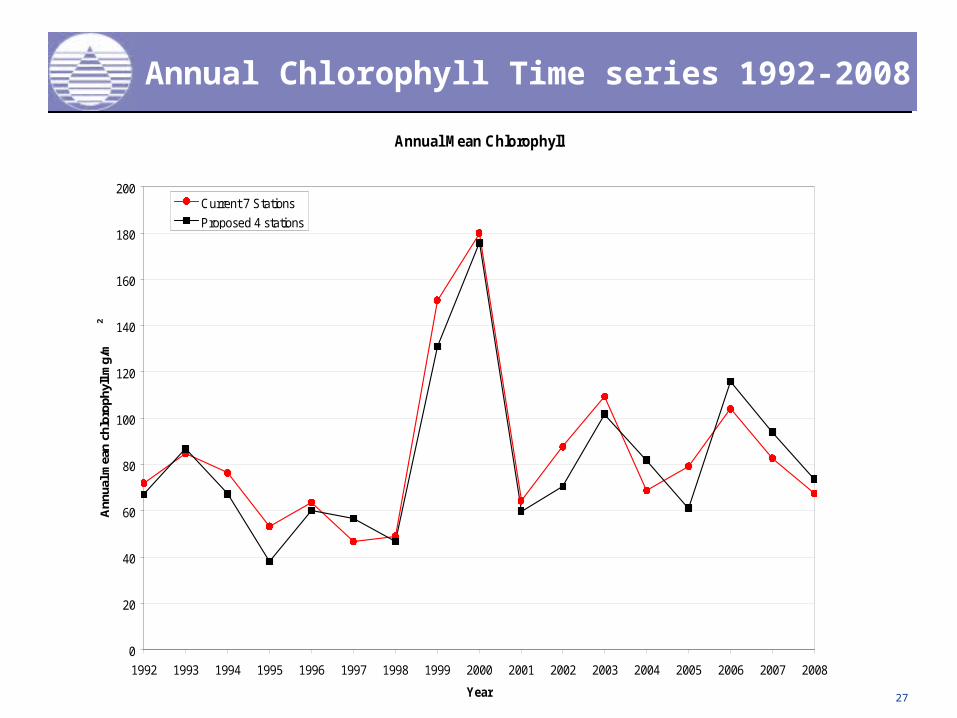
Comparisons of threshold parameters
In all plots, averages for “current 7 stations” are means for all current stations, 12 surveys per year.
Averages for “proposed 4 stations” are means for the 4 nearfield stations proposed for the 9 surveys/year proposed.
For time series plots, current design in red, proposed in black.
27
Annual Chlorophyll Time series 1992-2008
Annual Mean Chlorophyll
0
20
40
60
80
100
120
140
160
180
200
1992 1993 1994 1995 1996 1997 1998 1999 2000 2001 2002 2003 2004 2005 2006 2007 2008
Year
Ann
ual m
ean
chlo
roph
yll m
g/m
2
Current 7 Stations
Proposed 4 stations
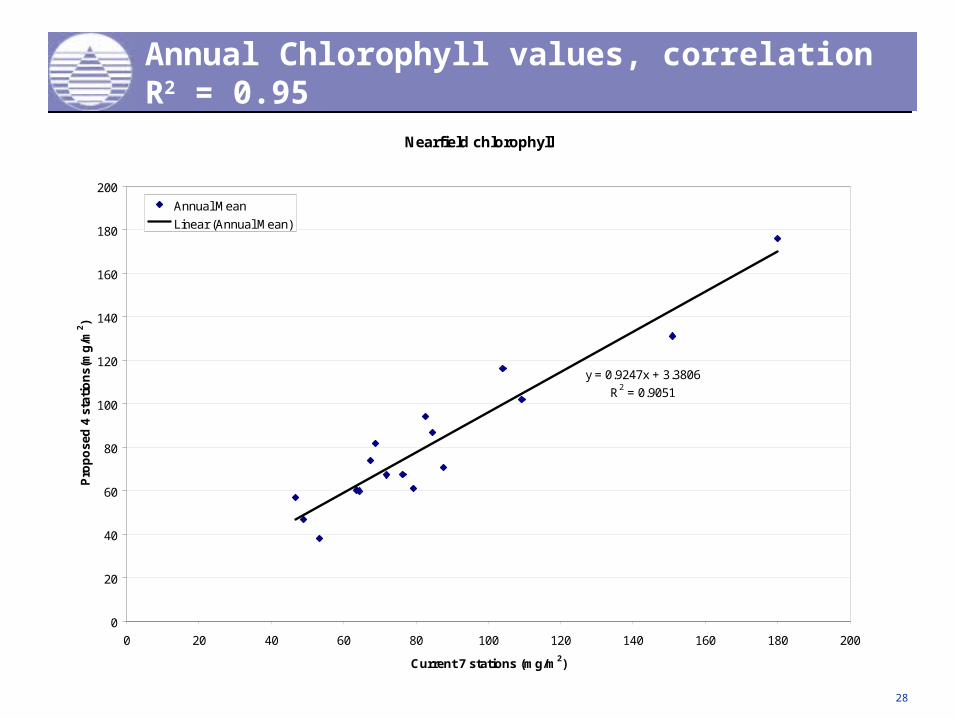
28
Annual Chlorophyll values, correlation R2 = 0.95
Nearfield chlorophyll
y = 0.9247x + 3.3806
R2 = 0.9051
0
20
40
60
80
100
120
140
160
180
200
0 20 40 60 80 100 120 140 160 180 200
Current 7 stations (mg/m2)
Pro
po
sed
4 s
tati
on
s(m
g/m
2)
Annual Mean
Linear (Annual Mean)

29
Seasonal Chlorophyll (all seasons) 1992-2009
Nearfield Chlorophyll Seasonal Means
0
50
100
150
200
250
300
1992 1993 1994 1995 1996 1997 1998 1999 2000 2001 2002 2003 2004 2005 2006 2007 2008 2009
Are
al C
hlo
rop
hyl
l
Current
Proposed

30
Seasonal Chlorophyll (Winter-spring) R2 = 0.81
Winter-Spring
y = 1.1494x - 2.3668
R2 = 0.8089
0
50
100
150
200
250
300
0 50 100 150 200 250
Current 7 stations (mg/m2)
Pro
po
sed
4 s
tati
on
s (m
g/m
2)
Chlorophyll
Linear(Chlorophyll)

31
Seasonal Chlorophyll (Summer) R2 = 0.97
Summer
y = 1.0712x - 6.3939
R2 = 0.9674
0
20
40
60
80
100
120
0 20 40 60 80 100 120
Current 7 Stations (mg/m2)
Pro
po
sed
4 s
tati
on
s (m
g/m
2 )
Chlorophyll
Linear (Chlorophyll)
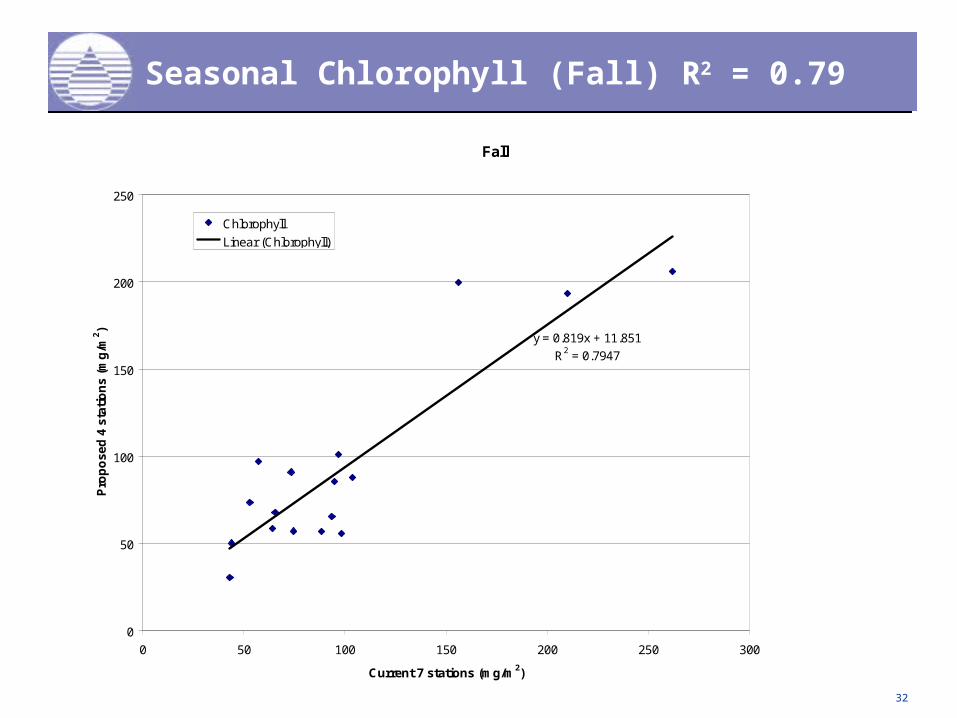
32
Seasonal Chlorophyll (Fall) R2 = 0.79
Fall
y = 0.819x + 11.851
R2 = 0.7947
0
50
100
150
200
250
0 50 100 150 200 250 300
Current 7 stations (mg/m2)
Pro
po
sed
4 s
tati
on
s (m
g/m
2)
Chlorophyll
Linear (Chlorophyll)
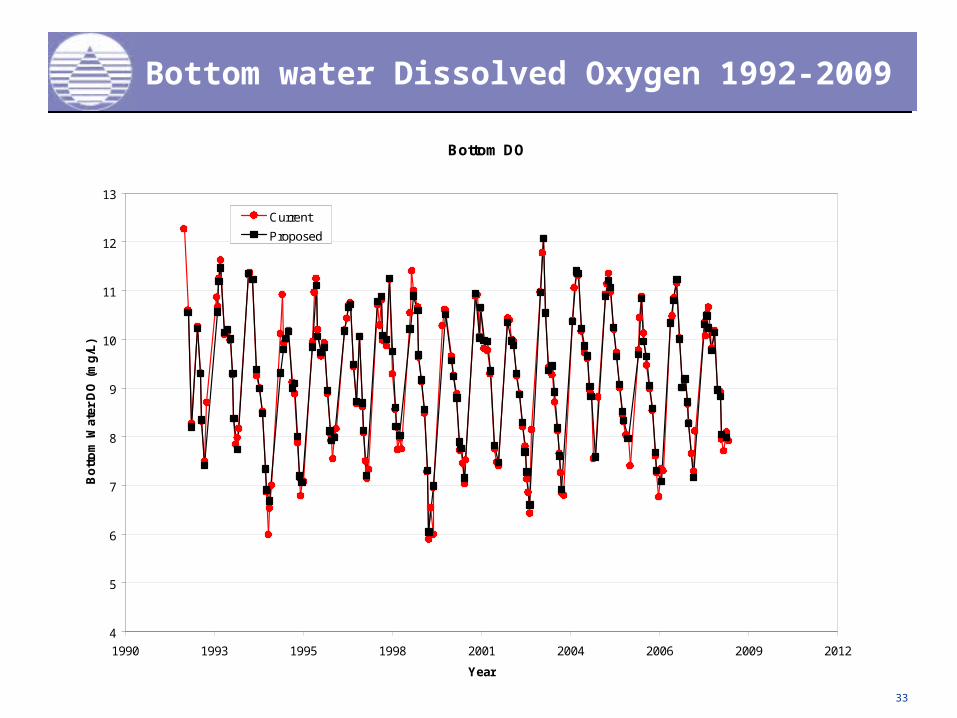
33
Bottom water Dissolved Oxygen 1992-2009
Bottom DO
4
5
6
7
8
9
10
11
12
13
1990 1993 1995 1998 2001 2004 2006 2009 2012
Year
Bo
tto
m W
ater
DO
(m
g/L
)
Current
Proposed
34
Bottom Dissolved Oxygen
Nearfield Bottom Water Annual Minima
4
5
6
7
8
9
1992 1993 1994 1995 1996 1997 1998 1999 2000 2001 2002 2003 2004 2005 2006 2007 2008
DO
(m
g/L
)
Current
Proposed
35
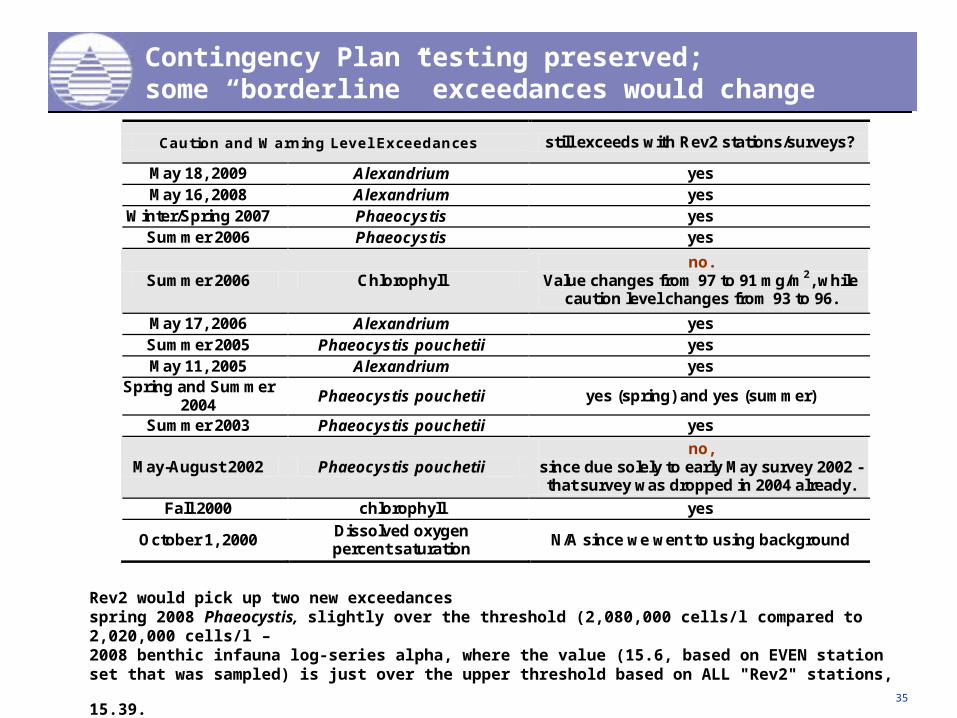
Contingency Plan testing preserved; some “borderline” exceedances would change
Caution and Warning Level Exceedances still exceeds with Rev2 stations/surveys?
May 18, 2009 Alexandrium yes May 16, 2008 Alexandrium yes
Winter/Spring 2007 Phaeocystis yes Summer 2006 Phaeocystis yes
Summer 2006 Chlorophyll no.
Value changes from 97 to 91 mg/m2, while caution level changes from 93 to 96.
May 17, 2006 Alexandrium yes Summer 2005 Phaeocystis pouchetii yes May 11, 2005 Alexandrium yes
Spring and Summer 2004
Phaeocystis pouchetii yes (spring) and yes (summer)
Summer 2003 Phaeocystis pouchetii yes
May-August 2002 Phaeocystis pouchetii no,
since due solely to early May survey 2002 - that survey was dropped in 2004 already.
Fall 2000 chlorophyll yes
October 1, 2000 Dissolved oxygen percent saturation
N/A since we went to using background
Rev2 would pick up two new exceedances spring 2008 Phaeocystis, slightly over the threshold (2,080,000 cells/l compared to 2,020,000 cells/l – 2008 benthic infauna log-series alpha, where the value (15.6, based on EVEN station set that was sampled)
is just over the upper threshold based on ALL "Rev2" stations, 15.39.
36
Contingency plan threshold tests
• SEE HANDOUT
• Thresholds recalculated from baseline using proposed station/survey set
• Exception: Phaeocystis and Pseudonitzschia threshold levels left provisionally unchanged because the new station/survey set resulted in substantially higher threshold levels which then did not capture all the previous exceedances. Thus the new sample design would be more conservative than at present for these algae and (conceivably resulting in more exceedances).
• Threshold tests yield very similar results with new survey design.